integrating remote sensing data and rapid appraisals for ...ifri/publications/r061-6.pdf ·...
TRANSCRIPT

land degradation & development
Land Degrad. Develop. 17: 31–43 (2006)
Published online 5 August 2005 in Wiley InterScience (www.interscience.wiley.com). DOI: 10.1002/ldr.692
INTEGRATING REMOTE SENSING DATA AND RAPID APPRAISALS FORLAND-COVER CHANGE ANALYSES IN UGANDA
N. VOGT,1,2* J. BAHATI,3 J. UNRUH,1,4 G. GREEN,1 A. BANANA,3 W. GOMBYA-SSEMBAJJWE,3
AND S. SWEENEY1
1Center for the Study of Institutions, Population, and Environmental Change, Indiana University, 408 North Indiana Avenue,Bloomington, IN 47408, USA
2School of Public and Environmental Affairs (SPEA), Indiana University, Tenth Street, Bloomington, IN 47405, USA3Uganda Forest Resources and Institutions Center (UFRIC), Faculty of Forestry, Makerere University, PO Box 7062, Kampala, Uganda
4Department of Geography, McGill University, Montreal, Quebec, Canada
Received 10 November 2004; Revised 20 December 2004; Accepted 11 April 2005
ABSTRACT
Rapid population growth, unsustainable land use, and a pervasively degrading landscape are components of a dominantparadigm regarding African development. While recent work articulating the ‘misreading’ of the African landscape have begunto challenge this paradigm, much work remains regarding the pervasiveness and character of this misread. A method ispresented for investigating mechanisms of land-cover change that combines remotely sensed data, archival data, and rapidappraisals in a way less influenced by dominant paradigms. We present a case where increasing human activity is resulting inaccumulation of woody biomass on edaphic grasslands of a forest–grassland mosaic, rather than the expansion of grasslands atthe expense of forests as is currently understood in that area. These increases in biomass are stimulated by anthropogenicinfluences that are shaped by institutional and edaphic factors. We do not claim that resources are being pervasively enhancedacross sub-Saharan Africa under conditions of population growth, but that there may be many mechanisms of change,resulting in both degradation and enhancement, occurring simultaneously across sub-Saharan Africa or even intra-regionallywithin a nation under these conditions. The integration and application of these methods serve to improve applied analysesof land-cover change to better characterize these mechanisms, and avoid the wrong policy prescriptions. Copyright # 2005John Wiley & Sons, Ltd.
key words: conservation; land tenure; land use; remote sensing; deforestation; Uganda
INTRODUCTION
Significant attention has focused on the fate of the African environment in light of ongoing and complex
relationships between population, agriculture, and natural resource use (e.g., Anglesen and Kaimowitz, 2001;
Benjaminsen, 2001; Cleaver and Schreiber, 1994; Fairhead and Leach, 1996; Lee and Barrett, 2001; Place and
Otsuka, 2000; Tilman et al., 2001; Turner et al., 1993). A great deal can be learned from these relationships in
Africa, where they have been underway longer than anywhere else and have led to highly modified landscapes.
Currently, population change makes these relationships increasingly important as food and livelihood security
priorities merge with concern about broad-scale resource degradation on the continent.
While paradigms and policies rooted in assumptions of a pervasively degrading African landscape due to
population growth and unsustainable land use persist, some studies have challenged a strictly deterministic
Copyright # 2005 John Wiley & Sons, Ltd.
�Correspondence to: N. Vogt, CIPEC, Indiana University, 408 N. Indiana Ave., Bloomington, IN 47408, USA.E-mail: [email protected]
Contract/grant sponsor: The Ford Foundation, USA.Contract/grant sponsor: The National Science Foundation, USA; contract/grant number: SBR9521918.

relationship between population, land use, and resource degradation (Agrawal, 1995; Batterbury and Bebbington,
1999; Benjaminsen, 2001; Blaikie and Brookfield, 1987; Lambin et al., 2001; Reenberg, 2001). Recent evidence
has challenged paradigms of pervasively degrading landscapes by exposing cases that apparently were ‘misread’
by colonial forestry officials (Fairhead and Leach, 1996; Gray, 1999; Howorth and O’Keefe, 1999; Leach and
Mearns, 1996; Tiffen et al., 1994). To see beyond these paradigms, Batterbury and Bebbington (1999) summarized
Leach and Mearns’ work (1996) and called for more ‘penetrating interpretations of the social and institutional
dynamics that structure access to and use of resources’ (p. 279). Most of the cases that describe this misreading
have focused on portions of West Africa where new tools for addressing landscape change (primarily remote
sensing) have documented an increase of forest islands in savanna locations due to the human relationship with the
landscape.
Fairhead and Leach (1996) have argued against the assumption that the forest–savanna mosaic in Africa is a
result of forest loss and a process of savannization. Rather, they argue that human land use and humidification may
be causing an expansion of forests into savanna lands. They describe how farmers encourage forest growth through
their choices of agroforestry, transplantation of trees, fire management strategies, and unintentional activities such
as changes in livestock grazing or location of the community and orientation of households within the community
(Fairhead and Leach, 1996). However, subsequent studies have pointed out that the existence of particular cases in
confined locations do not necessarily lead to an assumption of a pervasive ‘misread’ of what was considered to be a
degrading landscape (Gray, 1999; Howorth and O’Keefe, 1999; Nyerges and Green, 2000).
While these contrasting scenarios of change outline specific mechanisms regarding how the ‘African landscape’
might function over long periods of time, this paper presents evidence of different mechanisms of human–
environment interactions occurring other than through the few pervasively operating mechanisms described by
Fairhead and Leach (1996) and colonial resource managers. Accurate and specific characterization of these
mechanisms is important in the development context, where government and donor understanding of the
subnational population–land use–environment mix determines particular development policies and forms of
assistance.
Both planners and local users are often biased by the pervasive and enduring myths described in the
‘misreading’ construct that have been presented to them for several decades. The resulting assessments often
conclude that a singular mechanism of gradual degradation in vegetation cover occurs over time, with population
growth. For example, in our Uganda case, we find two different mechanisms whereby woody biomass is
accumulating on existing grasslands under conditions of population growth and increasing activity, rather than the
replacement of forests by grassland with population growth as is currently understood in the study area. By
analyzing human–environment interaction under the assumptions of the prevailing paradigms, as per the analysis
by the Ugandan National Environmental Management Authority (NEMA) in our study area, there is risk of
developing the wrong policy prescription. We believe that assessments may be improved, and appropriate policies
prescribed, if planners and local users have a method that is less biased by prevailing paradigms to more readily
identify and characterize the mechanisms of vegetation change occurring not only across the ‘African landscape,’
but across landscapes within each nation. In this paper, we demonstrate the use of a multi-disciplinary method
suited to this type of investigation.
Subsequent to describing the study site, we demonstrate how the method may be used to identify and
characterize the different human–environment interactions that are likely to exist across a landscape. We then
describe the different mechanisms of the observed biomass accumulation of the study area in the context of land
tenure, population change, and shifts in resource use. Finally, we consider the policy implications of the
application of this methodology, and findings it produced, with regard to development and conservation.
STUDY SITE/BACKGROUND
Our study site is located in the northern portion of Bugala Island, the largest island in the Ssese archipelago, which
lies in the northwestern section of Lake Victoria (Figure 1). Land-cover changes in this area illustrate broader
patterns across the island as a whole. Bugala Island is located between 0�130 and 0�320 South latitude in the District
32 N. VOGT ET AL.
Copyright # 2005 John Wiley & Sons, Ltd. LAND DEGRADATION & DEVELOPMENT, 17: 31–43 (2006)

Figure 1. Map of the study area, showing Bugala Island, the largest of the Ssese Islands in the Ugandan waters of Lake Victoria. Bugala Islandis located within Kalangala District, less than 50 km southwest of the city of Kampala.
UNTANGLING HUMAN–ENVIRONMENT INTERACTIONS 33
Copyright # 2005 John Wiley & Sons, Ltd. LAND DEGRADATION & DEVELOPMENT, 17: 31–43 (2006)
of Kalangala in southeastern Uganda. The island is covered with tropical high forest that comprises 221�5 km2
(about 49 per cent) of the district’s total land area. Average annual rainfall in the district exceeds 2m and is
distributed in two wet seasons (NEMA, 1998). On Rhodic Ferralsol soils, this bimodal rainfall supports two
agricultural seasons. Productivity varies across the catena. Broad crests and summits have shallow subsoils with
overlying quartzose gravel or compact sheet laterite. These soils generally have a loam or sandy-loam texture with
varying quantities of gravel and stones. Soils on the side slopes (residual soils) are deep and well drained. These
have a sandy-clay loam texture (Aniku, 2001).
Generally, the forests on the island are in good condition with only 6�2 km2 affected by human activities
(NEMA, 1998). The archipelago lies within the traditional boundaries of the Buganda Kingdom, which
historically was organized under the kabaka (king). Today the land is governed by the district land board as
outlined in the Ugandan Local Government Act of 1997.
The majority of forests on Bugala Island are inmailo land tenure, while a small fraction exists as either central
or local forest reserves under the central government. Themailo tenure system is a well-established and enduring
tenure system in Uganda based on traditional kinship institutions (Bikaako, 1994; Place and Otsuka, 2000).Mailo
land tenure is the holding of registered land in perpetuity, but in restricted allotments. It was introduced by the
Buganda Agreement of 1900 between the colonialists and the kabaka. While only the owners of mailo land can
acquire titles, tenants (the majority today) continue to have strong land rights (Place and Otsuka, 2000).
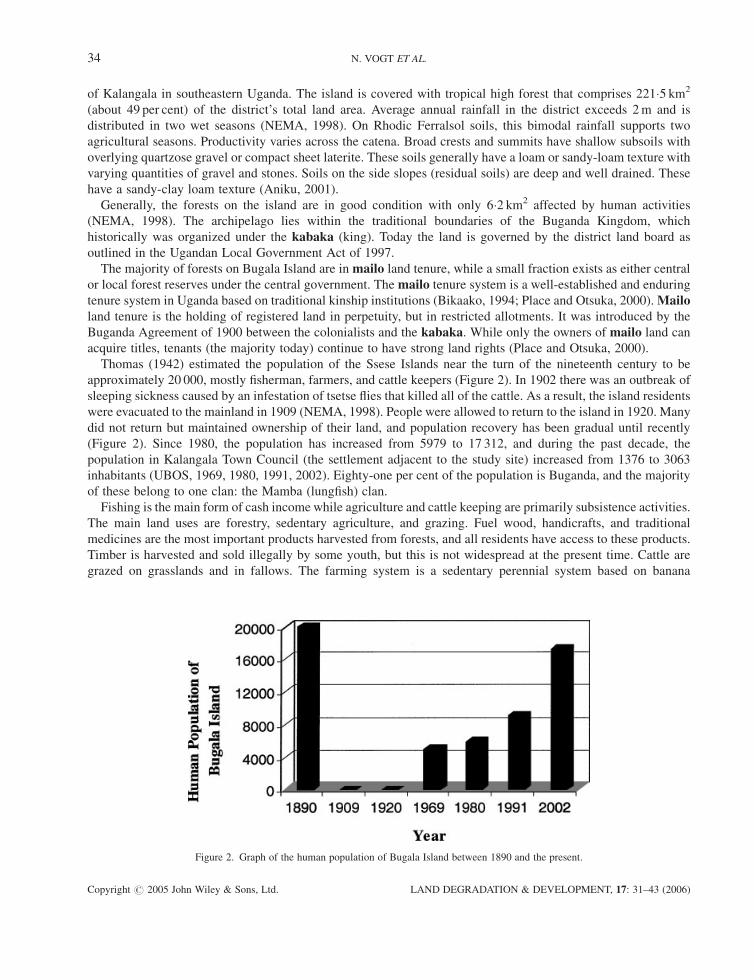
Thomas (1942) estimated the population of the Ssese Islands near the turn of the nineteenth century to be
approximately 20 000, mostly fisherman, farmers, and cattle keepers (Figure 2). In 1902 there was an outbreak of
sleeping sickness caused by an infestation of tsetse flies that killed all of the cattle. As a result, the island residents
were evacuated to the mainland in 1909 (NEMA, 1998). People were allowed to return to the island in 1920. Many
did not return but maintained ownership of their land, and population recovery has been gradual until recently
(Figure 2). Since 1980, the population has increased from 5979 to 17 312, and during the past decade, the
population in Kalangala Town Council (the settlement adjacent to the study site) increased from 1376 to 3063
inhabitants (UBOS, 1969, 1980, 1991, 2002). Eighty-one per cent of the population is Buganda, and the majority
of these belong to one clan: the Mamba (lungfish) clan.
Fishing is the main form of cash income while agriculture and cattle keeping are primarily subsistence activities.
The main land uses are forestry, sedentary agriculture, and grazing. Fuel wood, handicrafts, and traditional
medicines are the most important products harvested from forests, and all residents have access to these products.
Timber is harvested and sold illegally by some youth, but this is not widespread at the present time. Cattle are
grazed on grasslands and in fallows. The farming system is a sedentary perennial system based on banana
Figure 2. Graph of the human population of Bugala Island between 1890 and the present.
34 N. VOGT ET AL.
Copyright # 2005 John Wiley & Sons, Ltd. LAND DEGRADATION & DEVELOPMENT, 17: 31–43 (2006)

(plantain) production. Subsistence crops include banana, cassava, and potato. Fruit trees are found interspersed
among crops and in the home-garden. Common trees found on land used for agriculture and home-gardens are jack
fruit (Artocarpus heterophyllus), avocado (Persea americana), orange (Citrus reticulata), and papaya (Carica
papaya) (Gombya-Ssembajwe et al., 2000a, 2000b).
METHODS AND ANALYSIS
Data Collection
A combination of fieldwork and remote-sensing data was assembled as part of an assessment to determine the
patterns and processes of landscape change over time on Bugala Island. Fieldwork was carried out in June–July
2001. Brief, unstructured interviews were conducted with a few farmers and the chairman of Buyinja village
council. Rather than conducting household-level studies and linking to specific pixels, we first identified the
different patterns of directional change observed in remotely sensed products, occurring over recent decades, and
conducted interviews with informants who interact with the area over which the change is observed. In Buganda,
an enduring local administrative structure exists, so members of the administrative unit encompassing the study
area were interviewed. We also attempted to identify elderly members who might have been familiar with
resource-use and cover histories in the study area over longer time periods.
Key-informant interviews elicited information on land tenure, agricultural practice, and social trends over time.
These were conducted outside so as to relate the land-cover materials on the landscape with those observed in the
remotely sensed product. The few interviews that we were able to conduct were supported with archival research
and more in-depth past studies, including the long-term community-level monitoring studies of the island
conducted by colleagues at Makerere University in Kampala using the International Forest Resources and
Institutions (IFRI) Program protocol (CIPEC, 1994–1999; Gombya-Ssembajwe, 1996; Gombya-Ssembajwe et al.,
2000a, 2000b, 2000c, 2000d). Studies using the IFRI protocols also rely on open-ended rapid appraisals
(Chambers, 1992; Freudenberger, 1994) with individuals or groups of individuals who use the forests in various
ways, but not with remotely sensed images of land-cover change patterns around which to focus discussions about
resource use and cover that are more spatially and temporally explicit.
Information from the interviews and earlier studies allowed us to describe the environmental history of this area
from the late nineteenth century to present. A combination of site visits with geographic positioning systems and
the use of topographic maps (1:50 000 scale) depicting the 1955 forest extent (derived from aerial photographs)
and a composite produced from 1986 and 1995 Landsat1 images allowed observation of patterns in land-cover
change over time (from 1955 to 1995) and the location of the places where each was occurring.
Our analysis of the remotely sensed images provided a detailed accounting of the pattern and direction of
landscape change. Care was taken to choose imagery from the same season for each date.1 There are two dry
seasons in south-central Uganda: December to March and July to August. Landsat1 images from the first dry
season were collected whenever possible, because this season is longer and woody species are more easily
distinguished, spectrally and visually, from annual herbaceous vegetation when smallholder fields are cleared or
are in initial stages of crop growth. An advantage of using Landsat1 products is that the acquisition times for a
particular area have been held fairly constant over the past 30 years. This consistency reduced misinterpretations
of land cover caused by differences in sun angle.
An image-processing strategy was adopted that provided the information for a qualitative analysis of land-cover
change for the study area. To support this analysis, a multi-temporal color composite was created. These
composites are generated using Landsat 5 Thematic Mapper (TM) images acquired at red wavelengths (band 3) on
two dates: 19 January 1995, and 28 December 1986 (Plate 1). During the dry season, soil and senesced grass tend
1For this study we used a subsection of Path 171/Row 60 for the TM images (Worldwide Reference System 2) and Path 184/Row 60 for the MSSimages (Wordwide Reference System 1).
UNTANGLING HUMAN–ENVIRONMENT INTERACTIONS 35
Copyright # 2005 John Wiley & Sons, Ltd. LAND DEGRADATION & DEVELOPMENT, 17: 31–43 (2006)

to exhibit high reflectance within the spectral band pass of band 3 of the TM instrument, while photosynthetic
leaves on trees produce low reflectance. The difference in spectral information was used to indicate changes in
land cover—forest to non-forest and non-forest to forest.2 The composite reveals areas of change within a nine-
year time frame and the direction of that change (loss or gain of forest). Sussman et al. (2003) provide a more
detailed explanation of how multi-temporal color composites are constructed and how they are interpreted (and
used with three image dates).
Used in conjunction with a vector coverage produced from topographic maps depicting 1955 forest boundaries,
the recent nine-year land-cover change was compared to 40-year trends of forest boundary recession from or
advancement into natural grasslands (Plate 1). Vector coverages delineating the forest/non-forest 1955 boundaries
are shown by yellow lines. Red boxes depict areas shown in Plate 2, Figure 3 and Figure 4. The red arrows show
the direction of view. The aqua blue areas within the yellow lines in box Plate 2B show areas of woody growth
between 1986 and 1995. The savanna area, covered largely by box 3B, shows forest boundaries that have been
fairly stable since 1955. The small red area at the southern end of box 4A reveals an area of forest loss.
Aerial photography, taken from an overflight of the study area in 2001, enhanced our analysis of field and
remote-sensing work. Three-dimensional models consisting of the 1995 TM imagery, the 1955 forest boundaries,
and a digital elevation model (DEM) were created and used with aerial and ground photos to better understand the
relationship between time, land use, and topography (Plate 2A–B, Figure 3A–B and Figure 4A–D). These three-
dimensional models proved to be especially valuable because we could create views from any perspective,
allowing us to nearly duplicate the perspective of the aerial photos. Spatially linking these data sources provided
the means to identify the subtleties of forest boundary transition zones and better understand their complexities.3
RESULTS
The most noticeable observation drawn from Plates 1, 2, Figure 3 and Figure 4 is the overall stability of many of
the forest–grassland boundaries from 1955 (yellow line) through 1995 (the year of our most recent imagery) to
2001 (the year aerial photos were taken). Much of the grassland shown in Plate 2B and Figure 3B (which
correspond respectively to boxes Plate 2B and 3B in Plate 1) has been stable since 1955. Such boundary stability
over decades is strong evidence for a natural, topographically driven distinction between these forest and grassland
areas. Plate 2A and Figure 3A show that many of the grasslands on Bugala Island are located on ridges or hilltops;
this is also evidence for edaphic influence on their distribution.
The primary changes observed in the forest–grassland boundaries are woody species encroaching onto the
grasslands, in spite of the population growth on the island during the last several decades (Figure 2). Plate 2 and
Figure 4 show that this movement of trees onto grasslands occurs in areas where agriculture has also advanced onto
—————————————————————————————————————————————"Figure 3. (A) Landsat 5 Thematic Mapper, images acquired 19 January 1995, is draped over a 30-meter DEM.4 The red box frames the extent ofan aerial photograph (B). Many of the forest grassland boundaries shown in the 1995 Landsat image correspond to the forest/non-forestboundaries of 1955. Thus, it is shown that these boundaries have remained fairly stable since 1955. (B) An oblique aerial photograph, takenfrom the northeast in August 2001, that corresponds to the red box in A. The area covered is also shown by box 3B in Plate 1. This 35mm photowas taken at approximately 500 feet above ground level from a Cessna 172. Forest is shown by dark green colors, and areas of grass cover areshown by light yellow and green tones (more recent burns are brown in color). This photograph shows that woody growth has remained fairly
stable since 1955. (Aerial photo was taken by Nathan Vogt.).
2The composite was created by assigning band 3 of the 1995 registered subset as the red layer and band 3 of the 1986 registered subset as thegreen and blue layers. Since it was optimal to view areas exhibiting no change as black or white, either bright on both dates or dark on both, band3 from the 1986 registered subset was used twice to account for all primary colors. The colors were then normalized by stretching the bands todistribute values over the entire 8-bit data range (256). Produced in this way, shades of gray (plus black or white) indicate little or no change inland cover, while the presence of color indicates change. Dark areas indicate stable forests, bright areas indicate stable grasslands, red areasindicate a loss of woody cover, while cyan (green plus blue colors) areas indicate areas of woody growth.3Please contact the first author for more information regarding image processing.
36 N. VOGT ET AL.
Copyright # 2005 John Wiley & Sons, Ltd. LAND DEGRADATION & DEVELOPMENT, 17: 31–43 (2006)

Plate 1. Multi-temporal color composite showing areas of stable land cover, forest loss, and forest gain on a portion of Bugala Island(see ‘Figure 3’ in Figure 1).
Copyright # 2005 John Wiley & Sons, Ltd. LAND DEGRADATION & DEVELOPMENT, 17: (2006)

Plate 2. (A) A Landsat 5 Thematic Mapper image, acquired 19 January 1995, is draped over a 30-meter DEM.4 The orange-colored areas withinthe yellow lines depict areas that have experienced woody plant growth between 1955 and 1995. The red box (B) frames the extent of the aerialphotograph B. (B) An oblique aerial photograph, taken from the north in August 2001, which corresponds to box B in A and box 4B in Plate 1.This 35mm photo was taken at approximately 500 feet above ground level from a Cessna 172. Forest is shown by dark green colors, and areas ofgrass cover are shown by light green tones (recent burns are gray). This photograph shows that woody growth has continued to expand into the
grasslands in this area since 1995. Areas with many small trees might be colonized by continuous forest in the future.
Copyright # 2005 John Wiley & Sons, Ltd. LAND DEGRADATION & DEVELOPMENT, 17: (2006)

Figure 3.
UNTANGLING HUMAN–ENVIRONMENT INTERACTIONS 37
Copyright # 2005 John Wiley & Sons, Ltd. LAND DEGRADATION & DEVELOPMENT, 17: 31–43 (2006)

grasslands and general utilization of grassland has increased. In most cases, these areas were not used for
agriculture in the past. Through visual interpretations of the multi-temporal composites and aerial photographs, we
observed an apparent increase of trees on the long-settled areas (lands used for agriculture and home-gardens since
re-settlement) and the slight expansion of land used for sedentary agriculture onto grasslands, which results in an
increase of woody biomass on soils that predominantly supported grassland (Plates 1, Figure 4A, B, and D). We
also see the advance of self-seeding trees from a forest patch onto grassland adjacent to the settlement, which is
more heavily utilized than other grasslands (Plates 1 and 2B). Thus, in locations where human use of the grassland
is limited, such as the location shown in Figure 3B and box 3B in Plate 1, the grassland–forest boundary remained
largely the same from 1955 to 2001. But, in locations where we observed greater human activity on the grassland,
such as in Plate 2B and box Plate 2B in Plate 1, there is a significant advance of trees into the grassland areas
through two processes.
Interviews with key informants were conducted on location where both stability and change were observed in
the remotely sensed images. Mailo land tenure, in particular, has played a key role in the advancement of trees
onto the grasslands of Bugala Island in recent decades. According to key informants, this land tenure system limits
land utilization by smallholders to the currently cultivated lands and the grassland savannas. Walking with them
Figure 4. (A) An oblique aerial photograph, taken from the south in August 2001, that corresponds to box 4A in Plate 1. Forest growth in thebackground corresponds to areas of blue within the box, and the human settlement in the foreground corresponds to the small area of red in thesame box, which is associated with loss of woody plants. Red arrows indicate the views of photos shown in B–D. (B) Oblique aerial photo, takenfrom the south in August 2001 at lower altitude, shows an area of agriculture expansion into the grasslands. (C) A ground photo taken in 2001 ofthe edge of forest that has colonized the grassland since 1955. Another grassland area that is experiencing woody invasion is shown in thebackground. (D) A ground photo that shows the edge of a newly cultivated field that has been established in an area that was grassland in 1955.
(Aerial and ground photos were taken by Nathan Vogt.).
38 N. VOGT ET AL.
Copyright # 2005 John Wiley & Sons, Ltd. LAND DEGRADATION & DEVELOPMENT, 17: 31–43 (2006)

through land-cover types observed in the remotely sensed products—forest, grassland, crops—they stated that the
preferred soils for sedentary production was on lands within themailo forests. However, they are not permitted to
cultivate within the mailo forests in this study area.
Access to mailo land in this region depends on kinship-based institutions that govern property rights
arrangements (Bikaako, 1994). Both forests and grasslands on Bugala Island are governed by the mailo insti-
tutions, but access is restricted only in forest areas, not in grasslands, due to the marginal productivity of the
latter. Since pre-colonial times, production has largely occurred on the fertile soils, typically found areas
between the hilltops and streams in this agro-ecological zone, which is traditionally called the mutala. Hilltopgrasslands and areas under fallow on the mutala were grazed communally (Richards et al., 1973). In pre-
colonial Buganda, local administrative chiefs (now councilors) allotted individual holdings on the mutala and
permitted communal grazing (shared access) on hilltop grasslands and fallows to members of the village
(Mukwaya, 1953). Thus, land tenure and strong, enduring local institutions enforcing rules-of-use and access
constitutes the primary components of the mechanism that prevented smallholders from expanding land used
for agriculture (an agroforestry production system) or grazing onto forested lands, but rather onto the savanna
grasslands.
Informants also stated that after clearance of an area in the grasslands for agriculture or grass harvesting (by fire
or physical clearance) trees would sometimes grow. Some of the species identified when visiting these areas with
key informants, guided by GPS to locations where woody material on grassland was visually observed in the
remotely sensed images, were Canarium schweinfurthii,Harungana madagascariensis,Maesopsis eminii, Sapium
ellipticum, and Vernonia spp.
Our investigation shows that in all likelihood the island has not been entirely forested (primarily void of
grasslands) at any time since the onset of colonization (late nineteenth century), as suggested in the NEMA report
(see below). Between 1909 and 1955 the island was first abandoned and then lightly repopulated. If climatic and all
edaphic conditions had favored forest regeneration within a 50-year interval, then we would expect to observe
more complete forest cover in the remotely sensed products of 1955. Instead, we found that both forests and
grasslands were present in 1955. Intervals between land-cover observations since 1955 are shorter than this, and
we did not observe complete reforestation at any time after this. Oral histories and past descriptions of land-use
patterns also support this postulation. While the population has grown over the past 50 years to approach that of the
late nineteenth century, we do not observe an increase in conversion of forest to grassland as is currently
understood. Instead, we find woody biomass accumulating on existing grasslands through the mechanisms
described above under conditions of population growth.
Other evidence, gained in IFRI studies conducted by researchers at Makerere University, also supports our
interpretation that the majority of current Bugala grasslands are not derived from human activities. First, IFRI
studies in Uganda indicate that closed forests are not used significantly for grazing (Gombya-Ssembajwe, 1996;
Gombya-Ssembajwe et al., 2000a, 2000b, 2000c). However, cattle may be brought to the seasonally inundated,
closed valley forests for water or for brief grazing during the dry season. Second, animal husbandry has never been
so extensive in the tropical moist agro-ecozones of Uganda for farmers to clear large tracts of forests for pasture as
is reported in Brazil or Indonesia. Most cattle in this agro-ecological zone are kept in small numbers (five to ten
heads) for subsistence and typically grazed in existing patches of grassland, or individual fallows, by the young
boys of the households. Historically, the few large cattle-producing estates (kept by members of the upper echelons
in the Buganda Kingdom) used large areas of natural grasslands rather than clearing forests to create pastures.
Currently large herds are kept primarily in the semiarid regions of the Buganda Kingdom that form part of
the Uganda ‘cattle corridor’ (such as Luweero, Western Mubende, Western Mpigi, Maska, Nakasongola, and
Sembabule districts). Also, most keepers of large herds have been nomadic rather than sedentary pastoralists.
Other investigations in this agro-ecological zone, have revealed that once a piece of land that was intensively
used for cultivation (typically on fertile soils of the mutala) is left for three to five years, advanced growth of
colonizing species is observed. After 25 to 30 years, the colonizing species are replaced by advanced succession
species of a typical high tropical forest. On Bugala Island, colonizing species such as Maesopsis eminii, Polycias
fulva, and Trema orientalis are replaced by dominant species such as Celtis spp., Albizia spp., Piptadenia
UNTANGLING HUMAN–ENVIRONMENT INTERACTIONS 39
Copyright # 2005 John Wiley & Sons, Ltd. LAND DEGRADATION & DEVELOPMENT, 17: 31–43 (2006)
africanum, and Uapaca guinense. With advancing succession one observes an increase in basal area in these
species, the presence of epiphytes and lianas, and a decrease in understory (herbaceous plants, shrubs, and
colonizing woody species). These patterns were observed in the Najjakulya and Katebo IFRI sites of Mpigi
District and at the Busowe and Kabunja IFRI sites on Bugala Island (Gombya-Ssembajwe, 1996; Gombya-
Ssembajwe et al., 2000a, 2000b, 2000c, 2000d). All these sites fall within the same agro-ecological zone.
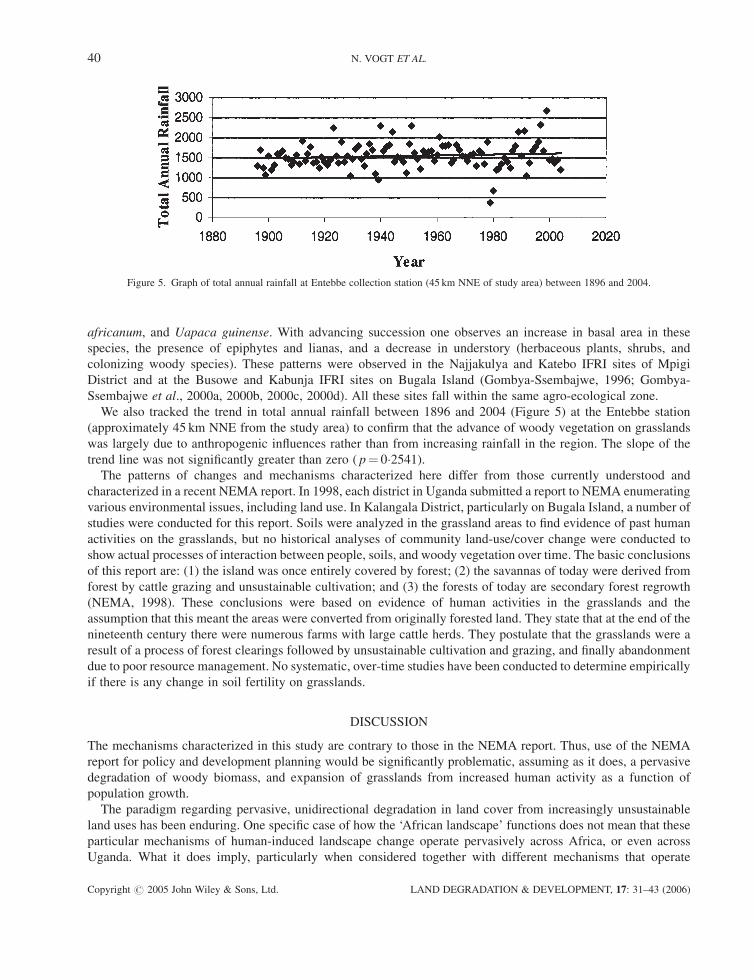
We also tracked the trend in total annual rainfall between 1896 and 2004 (Figure 5) at the Entebbe station
(approximately 45 km NNE from the study area) to confirm that the advance of woody vegetation on grasslands
was largely due to anthropogenic influences rather than from increasing rainfall in the region. The slope of the
trend line was not significantly greater than zero ( p¼ 0�2541).The patterns of changes and mechanisms characterized here differ from those currently understood and
characterized in a recent NEMA report. In 1998, each district in Uganda submitted a report to NEMA enumerating
various environmental issues, including land use. In Kalangala District, particularly on Bugala Island, a number of
studies were conducted for this report. Soils were analyzed in the grassland areas to find evidence of past human
activities on the grasslands, but no historical analyses of community land-use/cover change were conducted to
show actual processes of interaction between people, soils, and woody vegetation over time. The basic conclusions
of this report are: (1) the island was once entirely covered by forest; (2) the savannas of today were derived from
forest by cattle grazing and unsustainable cultivation; and (3) the forests of today are secondary forest regrowth
(NEMA, 1998). These conclusions were based on evidence of human activities in the grasslands and the
assumption that this meant the areas were converted from originally forested land. They state that at the end of the
nineteenth century there were numerous farms with large cattle herds. They postulate that the grasslands were a
result of a process of forest clearings followed by unsustainable cultivation and grazing, and finally abandonment
due to poor resource management. No systematic, over-time studies have been conducted to determine empirically
if there is any change in soil fertility on grasslands.
DISCUSSION
The mechanisms characterized in this study are contrary to those in the NEMA report. Thus, use of the NEMA
report for policy and development planning would be significantly problematic, assuming as it does, a pervasive
degradation of woody biomass, and expansion of grasslands from increased human activity as a function of
population growth.
The paradigm regarding pervasive, unidirectional degradation in land cover from increasingly unsustainable
land uses has been enduring. One specific case of how the ‘African landscape’ functions does not mean that these
particular mechanisms of human-induced landscape change operate pervasively across Africa, or even across
Uganda. What it does imply, particularly when considered together with different mechanisms that operate
Figure 5. Graph of total annual rainfall at Entebbe collection station (45 km NNE of study area) between 1896 and 2004.
40 N. VOGT ET AL.
Copyright # 2005 John Wiley & Sons, Ltd. LAND DEGRADATION & DEVELOPMENT, 17: 31–43 (2006)

elsewhere, is the potential existence of numerous mechanisms leading to either increases or decreases in woody
biomass. These mechanisms are now more readily observable and characterized through this application of a suite
of multi-disciplinary and multi-scalar analytical techniques (integrating remote sensing, GIS, and social science
studies). The variety of mechanisms that effect local changes in vegetation cover challenge us to reconsider
paradigms of an overall, continentwide degrading or aggrading landscape. Not only does the integrative use of
these analytical approaches allow the untangling of historical and dynamic human–landscape interactions, but it
improves and accelerates the examination of processes of landscape change, providing important understanding
for development practitioners, planners, and local-resource users to identify land-use policies that lead to mutually
preferred outcomes among stakeholders.
Scientists may also use this methodology when investigating human–environment interactions in either causal
direction. For example, the method could be used to identify particular patterns of land-cover change (i.e.,
deforestation, reforestation, or afforestation) when investigating land cover as an independent variable driving
human decisions on land use, resource management, or the evolution of institutions regulating resource use. Or, it
could be used to identify the above patterns to stratify a region or landscape to investigate the diverse mechanisms
leading to the patterns of land-cover change observed in a particular area of interest.
When integrating remote sensing and rapid rural appraisal, we found that interviews with informants of different
stakes, or interests, in the area under investigation may make the narratives of mechanisms richer and more robust.
Thus identification of these stakeholders is an important first step. For example, the socio-political structure
traditionally had great influence over land allocation and use. Current and past administrators at multiple levels in
the hierarchy can provide greater insights into changes of rules of use and access and impacts of state (colonial and
post-colonial) policies. Likewise, agriculture and forestry agents assigned to the area can provide insights into
broader-scale planning and management efforts in the area. In the integrated studies, we only interviewed
members of the socio-political unit within the study area, but in IFRI investigations they identify user groups that
graze or harvest from the study area but who may reside outside of it. This is useful in capturing change in pressure
on resources in the study area from non-local stakeholders, but challenging to identify. It takes a longer time to
identify these informants. Subsequent studies on the mainland also used this approach of interviewing informants
with longer-term experiences on the landscape, but including those with very local experiences, such as groups of
smallholders, to broader scale experiences of regional chiefs or district forest officers.
Also, in our experience, informants could more readily orient themselves on a topographic map by finding key
roads, administrative boundaries, and natural features than on a geo-rectified Landsat image. To aid in orienting
them on the Landsat products, we overlaid the same roads and administrative boundaries found on the topographic
map onto the most recently collected Landsat image. Once informants located themselves on the topographic maps
in relation to roads and boundaries, they were asked to locate their current position on the Landsat image using
these corresponding roads and administrative boundaries as references. Multi-temporal composites were very
confusing to informants, more so than multi-spectral composites. It was discovered that multi-temporal
composites could be a useful way for investigators to cross-check the statements by informants about changes
in land-use practices occurring at specific times and places in the study area.
IMPLICATIONS FOR POLICY MAKING AND DEVELOPMENT
National and donor policies in Africa are confronted with the dual and often conflicting objectives of agricultural
development and environmental conservation. While attempts to integrate the two are laudable, they are
significantly problematic, particularly when both poverty reduction and environmental conservation are central
concerns. At the same time, general policy application based on broad paradigms about the direction of
environmental change in Africa has not produced the desired outcomes.
Broad, generalized assumptions regarding how smallholder resource-use decisions are impacting the environ-
ment run the risk of marginalizing the poor and increasing resource degradation as policies based on these
assumptions unnecessarily reduce access rights or help promote an inappropriate land-use plan. With government,
donor, and scientific interest in many parts of the African continent focusing on issues of agricultural growth,
UNTANGLING HUMAN–ENVIRONMENT INTERACTIONS 41
Copyright # 2005 John Wiley & Sons, Ltd. LAND DEGRADATION & DEVELOPMENT, 17: 31–43 (2006)
poverty reduction, resource conservation, and the intersection of these, the occurrence of different mechanisms of
afforestation/reforestation and agricultural change than currently understood, has significant policy relevance.
Fortunately, advances in methodologies and their integration have lead to an ability to investigate specific cases
in a timely and effective manner, and can facilitate future policy making and development planning. A cross-
disciplinary and multi-scalar approach to policy derivation is relevant to both development and resource
conservation agendas (Batterbury and Bebbington, 1999; Gray, 1999; Harriss, 2002; Reenberg, 2001; Schimel
et al., 2001; Scoones, 1998). Such an approach to the historical analysis of landscape transformation can more
readily reveal the interactive relationship between humans and their environment through time. This in turn can
move our understanding of the human–environment relationship regarding a particular location beyond the
singular interpretations deduced from more deterministic models. Of particular importance is policy specificity
with regard to conditions present at particular subnational locations, as opposed to continentwide, or even
countrywide policy approaches to development and conservation.
acknowledgments
Wewould like to acknowledge the Ford Foundation and the National Science Foundation (grant SBR9521918) for
their financial support, the administrative authority in Kalangala for their assistance, and local communities and
key informants for their patience. We also acknowledge the assistance of Russell Barnes of the Kampala Flight
Training Centre for facilitating the aerial photography. We greatly appreciate the thorough editing of Joanna
Broderick and her preparation of this manuscript for submission.
references
Agrawal A. 1995. Population pressure¼ forest degradation: An oversimplified equation? Unasylva 181: 50–58.Anglesen A, Kaimowitz D. 2001. Agricultural Technologies and Tropical Deforestation. Center for International Forestry Research: Jakarta,Indonesia.
Aniku J. 2001. Soil classification and pedology. In Agriculture in Uganda, Mukibi JK (ed.). National Agriculture Research Organisation.Kampala: Fountain Publishers; 466.
Batterbury SPJ, Bebbington AJ. 1999. Environmental histories, access to resources and landscape change: an introduction. Land Degradation &Development 10: 279–289.
Benjaminsen TA. 2001. The population–agriculture–environment nexus in the Malian cotton zone.Global Environmental Change 11: 283–295.Bikaako W. 1994. Land to Tillers or Tillers to Land: The Existing Forms of Land Tenure Systems in Mpigi District. Centre for Basic Research:Kampala, Uganda.
Blaikie P, Brookfield H. 1987. Land Degradation and Society. Methuen: New York, NY.Chambers R. 1992. Rural appraisal: rapid, relaxed, and participatory. Institute for Development Studies Discussion PaperNo. 311, University ofSussex, Brighton.
CIPEC (Center for the Study of Institutions, Population, and Environmental Change). (1994–1999). International Forest Resources andInstitutions (IFRI) Research Program Field Manual (Versions 7.0–9.5, updated annually). CIPEC, Indiana University, Bloomington, IN47405, USA. Coursework required.
Cleaver KM, Schreiber GA. 1994. Reversing the Spiral. The World Bank: Washington, DC.Fairhead J, Leach M. 1996. Misreading the African Landscape. Centre of African Studies, Cambridge University: Cambridge.Freudenberger KS. 1994. Tree and Land Tenure: Rapid Appraisal Tools. Rome: Food and Agriculture Organization of the United Nations.Gombya-Ssembajwe W. 1996. Analysis of institutional incentives for sustainable management of tropical moist forests: a case of MengoForests, Uganda. PhD dissertation, University of Wales Bangor, Bongor.
Gombya-Ssembajwe W, Bahati J, Banana A. 2000a. Busowe Forest Reserve Site Report: First Visit, 2000. Uganda Forest Resources andInstitutions Centre: Kampala.
Gombya-Ssembajwe W, Bahati J, Banana A. 2000b. Kabunja Private Forest Site Report: First Visit, 2000. Uganda Forest Resources andInstitutions Centre: Kampala.
Gombya-Ssembajwe W, Bahati J, Banana A. 2000c. Katebo Cultural Forest Site Report, 2000. Uganda Forest Resources and InstitutionsCentre: Kampala.
Gombya-Ssembajwe W, Bahati J, Banana A. 2000d. Najjakulya Private Forest Site Report, 2000. Uganda Forest Resources and InstitutionsCentre: Kampala.
Gray LC. 1999. Is land being degraded? A multi-scale investigation of landscape change in southwestern Burkina Faso. Land Degradation &Development 10: 329–343.
Harriss J. 2002. The case for cross-disciplinary approaches in international development. World Development 30: 487–496.Howorth C, O’Keefe P. 1999. Farmers do it better: local management of change in southern Burkina Faso. Land Degradation & Development10: 93–109.
42 N. VOGT ET AL.
Copyright # 2005 John Wiley & Sons, Ltd. LAND DEGRADATION & DEVELOPMENT, 17: 31–43 (2006)

Lambin E, Turner BL II, Geist H, Agbola S, Angelsen A, Bruce J, Coomes O, Dirzo R, Fischer G, Folke C, George P, Homewood K, Imbernon J,Leemans R, Li X, Moran EF, Mortimore M, Ramakrishnan P, Richards J, Skanes H, Steffen W, Stone G, Svedin U, Veldkamp T, Vogel C, XuJ. 2001. The causes of land-use and land-cover change: moving beyond the myths. Global Environmental Change: Human and PolicyDimensions 11: 261–269.
Leach M, Mearns R. 1996. The Lie of the Land: Challenging Received Wisdom on the African Environment. James Currey: Oxford.Lee DR, Barrett CB (eds.). 2001. Tradeoffs or Synergies? Agricultural Intensification, Economic Development and the Environment. CABIPublishing: New York, NY.
Mukwaya AB. 1953. Land Tenure in Buganda: Present Day Tendencies. The Eagle Press: Kampala, Uganda.NEMA (National Environmental Management Authority). 1998. The State of the Environment 1998. Author: Kampala, Uganda.Nyerges AE, Green GM. 2000. The ethnography of landscape: GIS and remote sensing in the study of forest change in West African Guineasavanna. American Anthropologist 102: 271–289.
Place F, Otsuka K. 2000. Population pressure, land tenure, and tree resource management in Uganda. Land Economics 76: 233–251.Richards AI, Sturrock F, Fortt JM (eds). 1973. Subsistence to Commercial Farming in Present-Day Buganda: An Economic andAnthropological Survey. Cambridge University Press: Cambridge.
Reenberg A. 2001. Agricultural land use pattern dynamics in the Sudan-Sahel: towards an event-driven framework. Land Use Policy 18:309–319.
Schimel D, House J, Hibbard K, Bousquet P, Ciais P, Peylin P, Braswell B, Apps M, Baker D, Bondeau A, Canadell J, Churkina G, Cramer W,Denning A, Field C, Friedlingstein P, Goodale C, Heimann M, Houghton R, Melillo J, Moore B, Murdiyarso D, Noble I, Pacala S, Prentice I,Raupach M, Rayner P, Scholes R, Steffen W, Wirth C. 2001. Recent patterns and mechanisms of carbon exchange by terrestrial ecosystems.Nature 414: 169–172.
Scoones I. 1998. Sustainable Rural Livelihoods: A Framework for Analysis. IDSWorking Paper No. 72. Institute of Development Studies (IDS):Brighton.
Sussman RW, Green GM, Porton I, Andrianasolondraibe OL, Ratsirarson J. 2003. A survey of the habitat of Lemur catta in southwestern andsouthern Madagascar. Primate Conservation 19: 32–57.
Thomas AS. 1942. The vegetation of the Sesse Islands, Uganda. Journal of Ecology 30: 330–353.Tiffen M, Mortimore M, Gichuki F. 1994. More People, Less Erosion: Environmental Recovery in Kenya. Wiley: Chichester.Tilman D, Fargione J, Wolff B, D’Antonio C, Dobson A, Howarth R, Schindler D, Schlesinger WH, Simberloff D, Swackhamer D. 2001.Forecasting agriculturally driven global environmental change. Science 292: 281–284.
Turner BL, II, Meyer W, Skole D. 1993. Global land-use/land-cover change: towards an integrated program of study. Ambio XXIII: 91–95.UBOS (Uganda Bureau of Statistics). 1969. Population Census 1969. Kampala, Uganda.UBOS (Uganda Bureau of Statistics). 1980. Population Census 1980. Kampala, Uganda.UBOS (Uganda Bureau of Statistics). 1991. Population Census 1991. Kampala, Uganda.UBOS (Uganda Bureau of Statistics). 2002. Population Census 2002. Kampala, Uganda.
UNTANGLING HUMAN–ENVIRONMENT INTERACTIONS 43
Copyright # 2005 John Wiley & Sons, Ltd. LAND DEGRADATION & DEVELOPMENT, 17: 31–43 (2006)