integrating science and park management - … · national park service u.s. department of the...
TRANSCRIPT

National Park ServiceU.S. Department of the Interior
Natural Resource Stewardship and Science
Integrating Science and Park ManagementA Framework for PartnershipNatural Resource Report NPS/NRSS/NRR—2016/1230

ON THE COVER
Water sampling at Soda Butte Creek, Yellowstone National Park.Photograph courtesy of the National Park Service

Integration of Science and Park ManagementA Framework for PartnershipNatural Resource Report NPS/NRSS/NRR—2016/1230
Authors, listed alphabetically:
Robert E. Bennetts Kristin LeggSouthern Plains Network Greater Yellowstone NetworkModel, Colorado Bozeman, Montana
Nina Chambers Elizabeth MatthewsAlaska Region National Capital Region NetworkAnchorage, Alaska Washington, DC
James A. Comiskey Linda MazzuNortheast Region I&M Program Yosemite National ParkFredericksburg, Virginia Yosemite, California
Kevin James Rene OhmsBureau of Indian Affairs Devils Tower National MonumentReston, Virginia Devils Tower, Wyoming
James Lawler Cheryl SchreierAlaska Region I&M Program Mount Rushmore National ParkAnchorage, Alaska Keystone, South Dakota
Jason J. Taylor(formerly) Cape Cod National SeashoreWellfleet, Massachusetts
This report was produced as part of the Excellence in Science Committee, chaired by Michael Bozek.
May 2016
U.S. Department of the Interior National Park Service Natural Resource Stewardship and Science Fort Collins, Colorado

ii
Integration of Science and Park Management
NPS 909/132883, May 2016
The National Park Service, Natural Resource Stewardship and Science office in Fort Collins, Colorado, publishes a range of reports that address natural resource topics. These reports are of interest and applicability to a broad audience in the National Park Service and others in natural resource management, including scientists, conservation and environmental constituencies, and the public.
The Natural Resource Report Series is used to disseminate comprehensive information and analysis about natural resources and related topics concerning lands managed by the National Park Service. The series supports the advancement of science, informed decision-making, and the achievement of the National Park Service mission. The series also provides a forum for presenting more lengthy results that may not be accepted by publications with page limitations.
All manuscripts in the series receive the appropriate level of peer review to ensure that the information is scientifically credible, technically accurate, appropriately written for the intended audience, and designed and published in a professional manner. This report received peer review by subject-matter experts who were not directly involved in the collection, analysis, or reporting of the data, and whose background and expertise put them on par technically and scientifically with the authors of the information.
Views, statements, findings, conclusions, recommendations, and data in this report do not necessarily reflect views and policies of the National Park Service, U.S. Department of the Interior. Mention of trade names or commercial products does not constitute endorsement or recommendation for use by the U.S. Government.
This report is available from the Natural Resource Publications Management Web site (http://www.nature.nps.gov/publications/nrpm/) on the Internet. To receive this report in a format optimized for screen readers, please email [email protected].
Please cite this publication as:
Bennetts, R. E., N. Chambers, J. Comiskey, K. James, J. Lawler, K. Legg, E. Matthews, L. Mazzu, R. Ohms, C. Schreier, and J. J. Taylor. 2016. Integration of science and park management: a framework for partnership. Natural Resource Report NPS/NRSS/NRR—2016/1230. National Park Service, Fort Collins, Colorado.

iii
Contents Page
Preface: The Excellence in Science Committee ...........................................................viii
Executive Summary .........................................................................................................ix
Acknowledgements ........................................................................................................xi
Introduction .....................................................................................................................1How to Use this Report .............................................................................................................2
Module 1: Build the Foundation ....................................................................................4A Vision for Effective Partnerships ...........................................................................................4Building New and Strengthening Existing Partnerships ........................................................5
Mutual Commitment is Essential .........................................................................................................5Communication is a Two-way Process .................................................................................................5A Shared Vision of What? ...................................................................................................................5Defining Partners and their Roles ........................................................................................................5
Working in Partnership .............................................................................................................6
Module 2: Evaluate the Science ....................................................................................7Science Needs Assessment .......................................................................................................8
Identify what we need to know, based on management decision needs. ............................................8Identify what we know. ......................................................................................................................9Identify the gaps and how to fill them. ...............................................................................................9Apply existing IMD science to fill information gaps..............................................................................9
Provide Supplemental Science ................................................................................................11
Module 3: Communicate Results .................................................................................12Target Communication Audiences ........................................................................................12Developing a Science-Management Dialogue .....................................................................13Building on Successful Communication Models ....................................................................13Directly Engaging with Parks ..................................................................................................13Timely and Focused Information Delivery .............................................................................13Enhancing a Sense of Ownership ..........................................................................................14
Module 4: Make Decisions ............................................................................................15Broad Classes of Decisions ......................................................................................................15Principles of Good Decision Making ......................................................................................16The Shift from Heuristic to Formal Decisions ........................................................................19Structured Decision Making ...................................................................................................20Build Upon Our Existing Partnerships as a Foundation for Better Integration ...................21
Recommendations .........................................................................................................21Enhance the Utility of Science ................................................................................................22Communicate Science Effectively to Support Management Decision Making ...................24Management Decisions: Where the Foundation is Put into Action .....................................25
Literature Cited .............................................................................................................27

iv
Integration of Science and Park Management
Contents (continued)Page
Appendix A: A Collaborative Framework Example ..................................................A-1The Benefits of a Collaborative Approach ...........................................................................A-1The Framework Components ...............................................................................................A-1
Issues and Possible Solutions ........................................................................................................... A-1Reference Conditions ...................................................................................................................... A-2Monitoring ..................................................................................................................................... A-2Reporting ....................................................................................................................................... A-2Decision Support ............................................................................................................................ A-2
Appendix B: The Realm of Research and Monitoring ..............................................A-3Levels of Integration ............................................................................................................A-3Research v. Monitoring ........................................................................................................A-3Types of Monitoring ..............................................................................................................A-5Targeted v. Surveillance Monitoring ....................................................................................A-5
Appendix C: Conceptual Models ................................................................................A-6Conceptual Models for Monitoring Programs.....................................................................A-6Types of Conceptual Models ................................................................................................A-7Steps in Constructing Conceptual Models ...........................................................................A-7
Appendix D: Adaptive Management .........................................................................A-8The Adaptive Management Cycle ........................................................................................A-8Circumstances that Facilitate an Adaptive Management Approach .................................A-8Explicit Incorporation of Learning .......................................................................................A-9A Few Important Resources ..................................................................................................A-9
Appendix E: Thresholds and Assessment Points .....................................................A-10Thresholds ............................................................................................................................A-10
Types of Thresholds ....................................................................................................................... A-10Assessment Points ................................................................................................................A-12
Assessment Points as Part of an Adaptive Process ......................................................................... A-12Assessment Points as a Means of Addressing Uncertainty ............................................................. A-13
Thresholds of Potential Concern and the South African Parks Experience .....................A-13The South African National Parks Experience................................................................................. A-14
Appendix F: Science Communication Examples and Best Practices .......................A-15Listening Sessions ................................................................................................................A-15Data Visualization ..............................................................................................................A-16Technical Reports ................................................................................................................A-17Resource Briefs ....................................................................................................................A-17Newsletters .........................................................................................................................A-18Presentations at Scientific Conferences .............................................................................A-18Technical Support ...............................................................................................................A-19Social Media ........................................................................................................................A-19Multi-media Tools ................................................................................................................A-19Webpages ............................................................................................................................A-20Resources (Literature and Links) .........................................................................................A-20
v
Contents (continued)Page
Appendix G: Incorporating Science into Management Decisions ..........................A-21Pathways to Provide Science to the Decision Maker or Process .......................................A-21Gathering Scientific Support and Evidence .......................................................................A-21Expert Opinion, Science Panels and Advisory Boards .......................................................A-22Syntheses, Reviews, and Briefings ......................................................................................A-22
State of the Park Reports .............................................................................................................. A-22Decision Support Systems ...................................................................................................A-23
Structured Decision Models .......................................................................................................... A-23Experience and Perceptions ................................................................................................A-23Pathways for Feeding Science in to Different Classes of Decisions ..................................A-24
Some Common Formal or Required Decision Frameworks within the National Park Service ........... A-24Ways in Which Using Principles of Good Decision Making can Improve Integration of Science .........................................................................................................A-26
Appendix H: Expressing Goals, Objectives, and Desired Conditions to Facilitate Integration of Science and Management ................................................................A-27
Measurability .......................................................................................................................A-27Expressing Desired Outcomes as a State or Condition (The End v. the Means) ..............A-28
Appendix I: Structured Decision Making ................................................................A-29Case Study: Natchez Trace Parkway Beaver Management ..............................................A-29
The Problem: Beaver Management along Natchez Trace Parkway: ................................................. A-29Structured Decision Making Workshop ......................................................................................... A-29Emphasis on Early Phases .............................................................................................................. A-29Lessons Learned ............................................................................................................................ A-31
Appendix J: Evidence-based Conservation ..............................................................A-32The Cochrane Collaboration ...............................................................................................A-32Evidence-based Conservation .............................................................................................A-32Some Analytical Tools for Assessing Cumulative Evidence ...............................................A-32
Bayesian Inference ....................................................................................................................... A-32Meta-Analyses .............................................................................................................................. A-33
Conclusion ............................................................................................................................A-33

vi
Integration of Science and Park Management
FiguresPage
Figure 1. A framework intended to facilitate more effective application of science to park management decisions. ...............................................................................................................2
Figure 2. Not all parks or networks have the capacity to provide additional science support. This figure describes where additional flexibility may exist. ........................................................................8
Figure 3. Examples of ways to apply existing IMD data to management questions, in increasing degree of complexity. .................................................................................................................10
Figure 4. Three general classes of decisions relative to their authority and timeframe of application. 16
Figure 5. NPS decision-making processes must adhere with precision to the law, be mindful of legislative intent, and consistently and transparently follow public policy and regulations. 16
Figure 6. Conceptual diagram illustrating that the value in using a structured decision process increases as the importance, complexity, risk, uncertainty, and potential controversy associated with the decision increases. ......................................................................................19
Figure 7. The seven principles of good decision making that, when warranted, can be used as a connected process known as structured decision making. .......................................................20
Figure A1. The inventory and monitoring program, exotic plant program, fire program, and parks all contribute to, but overlap, in their efforts to meet the NPS mission. ................................... A-1
Figure A2. A graphic representation of the collaborative framework between parks of the southern plains, the Southern Plains Fire Group, the Southwest Exotic Plant Management Team, and the Southern Plains Network. ................................................................................................... A-2
Figure A3. Reporting would show condition relative to reference conditions. This could be used to assess progress across space (left) or time (right). ................................................................... A-2
Figure B1. A graphic representation of two opposing, but not mutually exclusive pathways from indecision to a decision based on whether the uncertainty is in the ecological response or the goals and objectives (adapted from Lee 1993). ................................................................ A-3
Figure C1. A conceptual model showing feedbacks and connections among system components. .. A-6
Figure C2. A stressor model, which communicates the links between stressors and effects. .............. A-7
Figure D1. There are many variations on the theme of adaptive management, but all incorporate an iterative process and include, in varying level of detail, steps of assessment. ...................... A-8
Figure D2. The value of learning increases substantially when there is high uncertainty about management responses and management is expected to be repeated over long timeframes. .................................................................................................................................................... A-9
Figure E1. Changing states of matter as a function of temperature represents a threshold in the form of an abrupt physical change in the system. ........................................................................ A-10
Figure E2. Ecological thresholds are often illustrated by a ball-and-valley diagram representing the tendency to stay or return to a given ecological state or condition. .................................. A-10
Figure E3. Ball and valley diagrams help to illustrate differences in the stability and resilience of ecological states. ...................................................................................................................... A-11
Figure E4. Assessment points represent pre-selected points along a continuum of resource values where scientists and managers have agreed to assess the status or trend relative to program goals, natural variation, or potential concerns. .................................................................... A-12
Figure E5. Assessment points can be used to account for the uncertainty by evaluating conditions leading up to a hypothesized threshold. ............................................................................... A-13
Figure E6. Thresholds of potential concern define the envelope of conditions within which ecosystem states may bounce around, without moving into an undesirable zone. . ........................... A-13
Figure G1. Conceptualization of the primary pathways for science delivery to the decision maker or decision process. .................................................................................................................... A-21
vii
TablesPage
Table 1. Seven basic principles of good decision making, descriptions of each, and suggested actions on how IMD and parks may be able contribute throughout the decision making process. It is important to document each one of these steps throughout the decision making process in order to provide transparency and a way to learn from the decision. ..............................17
Table B1. A simplified, hypothetical example of the levels of integration of I&M network vital signs monitoring (one form of science) and management decisions. ........................................... A-4
Table B2. Examples of a range of research designs. ................................................................................ A-4
Table E1. Commonly used concepts that describe, either objectively or subjectively, a state, condition, or sometimes a process that a resource manager wishes to avoid or to maintain. ............ A-11
Table G1. The three primary classes of decisions, their description, and the likely pathways for science to reach the decision maker or process. ................................................................................ A-24
Figures (continued)Page
Figure H1. The relationships among types of NPS planning processes or documents with respect to the level of specificity and intended timeframe. ......................................................................... A-27
Figure H2. A hypothetical riparian zone covered with exotic Russian olive trees (illustrated in grey) prior to treatment. If the objective was to treat a certain area (an action), then the outcome of Treatment 1 was identical to Treatment 2 since the same area was treated. If, however, the objective was to reduce the occurrence of Russian olive (a state), then Treatment 2 was far more effective than Treatment 1...................................................................................... A-28
Figure I1. The ProACT structured decision making process. .................................................................. A-30
Figure I2. Fundamental objectives with measureable attributes and performance criteria developed at the Natchez Trace Parkway beaver management structured decision making workshop. A-30
Figure J1. Meta analyses use data from different studies to assess a more generalized effect than would be concluded from a single study. .............................................................................. A-33

viii
Integration of Science and Park Management
Preface: The Excellence in Science CommitteeThe Excellence in Science Committee was formed in January 2014, at an Inventory and Monitoring Division Leadership Team Meeting in Omaha, Nebraska. At that time, the Inventory and Monitoring (I&M) Program in the National Park Service was over 10 years old and transitioning from a start-up program to one of science delivery and resource management support. In those first 10 years, much was learned by the 32 I&M networks about environmental monitoring, science delivery, and science communication. These different experiences provided clear insights about how to integrate a monitoring program into a science agency as complex as that of the National Park Service.
To see that information parlayed into useful science information for decision making, former division chief Bruce Bingham initiated a survey of all I&M employees, tapping into the collective wisdom, experiences, and expertise of staff to (1) get their input into what was working with the I&M program and (2) identify where improvements can be made to the science support that the program delivers to our national park units. Andy Hubbard (later acting division chief), and Kirsten Gallo (current division chief) worked with Marianne Tucker to compile the survey results and initiate discussions in Omaha about how to channel that collective wisdom and experience into productive outcomes for the program.
The goal: to create a lasting, tangible impact on park management using I&M science as its foundation. Promulgated from those discussions was the creation of four committees: Excellence in Science, Science Communication, Inventories, and Accountability and Achievability. Of these, the Excellence in Science Committee was subdivided into three workgroups, each asked to address different dimensions of how to create and deliver excellent science to NPS via the Inventory and Monitoring Program:
• The Integrating Science and Management workgroup, chaired by Southern Plains Network Program Manager Robert Bennetts, was assigned to evaluate approaches to effectively integrate I&M science into parks and proposing methods to improve science delivery and use in science-based management decisions.
• The Stellar Science Committee, chaired by Northern Colorado Plateau Network Program Manager Dusty Perkins, was tasked with defining what Excellent Science means in the context of the National Park Service. Their task was to bridge the gap between traditional views of excellence as defined by peer-reviewable science and the application of science so that it effectively informs managers of resource agencies of the status and trends of resources at their respective parks.
• The Attracting, Developing, and Retaining Excellent Science and Staff workgroup, chaired by Appalachian Highlands Network Program Manager Brian Witcher, sought to identify how we can attract, train, and retain scientists and technical staff in the program, identify what makes a successful monitoring network, and what training can be provided to improve skills within the program.
Each workgroup was asked to explore the dimensions of their respective science-transfer responsibilities to NPS and develop recommendations to improve that delivery.
In these efforts, we are indebted to Steve Fancy, Bruce Bingham (both influential former division chiefs), and all I&M employees and contractors, park resources staff, and superintendents for their dedication in helping bring science into how we manage parks for the American people and the world.
—Michael BozekChair, Excellence in Science Committee

ix
Executive SummaryThe Inventory and Monitoring Division (IMD) of the National Park Service (NPS) is over ten years old and is ready to improve its science delivery and resource management support. To facilitate this, an internal survey was conducted of the program’s staff to assess perspectives about where we were working effectively and where changes might be warranted. Respondents identified a number of areas needing attention, including the recognition that having a strong connection and relevance to parks is pivotal to the success of IMD. The Integrating Science and Management workgroup was tasked with considering how science is effectively integrated into parks and to make recommendations to improve science delivery and use in science-based management decisions. This report is the fulfillment of that task.
The workgroup identified four key components to achieve effective integration, each of which were considered as a module of an overall framework to integrate scientific information into park decision making. This framework is intended to be iterative, flexible, and dynamic. Not all ideas will be useful in all situations; nor will implementation of the framework be a linear process. Rather, the framework represents a suite of principles that we believe are worth considering for better integration of science and park management.
The first module focuses on building a foundation. It is based on a core principle that a strong partnership between scientists and decision makers is essential to achieve a shared vision of the NPS Mission and to successfully integrating science into park management. In this module, we emphasize that maintaining and strengthening an effective partnership requires a mutual commitment and on-going two-way communication to understand the perspectives, needs, and contributions of both the science providers and the science users.
In the second module, we focus on evaluating the science. Assessing science needs is an important place to start identifying information gaps and how best to fill those gaps. In this section, we discuss opportunities to evaluate existing IMD science and enhance its application to management decisions. We recognize that the core responsibility of the IMD is to collect, manage, analyze, and report on long-term data for selected vital signs and to effectively deliver data and information on resource condition to park decision makers. We suggest that networks and parks have varying capacities to go beyond these core responsibilities and, depending on the circumstances, parks and networks should work collaboratively as partners to decide if, when, and to what extent additional science support is appropriate to meet management needs.
In the third module, we focus on communicating results. Communication is key to any partnership. This module provides best practices to communicate more effectively, both enhancing the understanding of science findings and making them relevant to decision makers. We emphasize targeted communication both in terms of the intended audience as well as the topical focus that is most relevant to park management needs. We further emphasize that communication is a two-way process and suggest listening sessions as a tool for balancing the flow of communication.
In the fourth module, we discuss resource management decisions. This is where the foundation built in the previous modules is put into action. We introduce a general range of decisions (less to more complex) and describe basic principles of good decision making. We introduce the concept of a structured decision-making process that formalizes the incorporation of scientific data for more complex decisions and discuss the context for when such a structured approach is warranted.

x
Integration of Science and Park Management
Based on our investigation and findings, we propose nine recommendations. We believe that implementing the following actions will help to achieve our goal to strengthen the partnership between scientists and decision makers and result in more science-informed decisions:
Recommendation 1: Embrace the shift toward a more collaborative culture within NPS.
Recommendation 2: Encourage NPS leadership to expand the role of science in NPS and to recognize the need for a wide range of science support for parks.
Recommendation 3: Encourage effectiveness monitoring in Servicewide Comprehensive Call (SCC) proposals.
Recommendation 4: Substantially improve the capability for data to be shared among NPS divisions.
Recommendation 5: Provide support for on-going, iterative evaluation of science needs.
Recommendation 6: Engage parks and networks in the best alignment of IMD science, park information needs, and decision support.
Recommendation 7: IMD networks and parks share results from science integration into the decision-support process annually.
Recommendation 8: Include a science component to Fundamentals training.
Recommendation 9: Provide training in the principles of good decision making.

xi
AcknowledgementsThis workgroup and report would not have been possible without the foresight of Bruce Bingham to initiate a survey to evaluate the status and success of the Inventory and Monitoring Division at a 10-year crossroads; the support and commitment from Andy Hubbard and Kirsten Gallo for initiating the committees intended to transform the results of that survey into strategic planning; and Michael Bozek, the chair of the Excellence in Science Committee, of which this workgroup is a part for allowing us the freedom and flexibility to explore different ways of thinking about integrating science and park management.
We also are extremely grateful to the numerous staff of both the Inventory and Monitoring Division and parks of the National Park Service for providing feedback and reviews of our direction and efforts. We are especially grateful to Alice Wondrak-Biel and Michael Bozek for providing detailed, comprehensive reviews of this report. We did not always agree with the comments and reviews we received, but they certainly made us question ideas, rethink concepts and approaches, and ultimately produce a better report. For that we are thankful.


1
Introduction
IntroductionA common goal of virtually every natural resource monitoring program on public lands is to provide a scientific basis for better resource management. One of the explicitly stated goals of the National Park Service (NPS) Inventory and Monitoring Division (IMD) is to: Integrate natural resource inventory and monitoring information into National Park Service planning, management, and decision making. In this report, we discuss how both scientists and decision makers can strengthen their effectiveness by working together in partnership to design, implement, and communicate science and make decisions.
Bringing science and decision makingtogether is often challenging, however, because scientists and resource decision makers work in different realms. As Soukup (2007) has stated:
Both managers and scientists must shift how they see themselves and each other, as well. First, they must recognize they are partners, for only in an environment where scientists and managers share a common vision of the outcomes of their respective efforts can we truly expect an effective integration of science and management.
NPS PH
OTO
Park management, such as this release of a black-footed ferret, can often benefit from easy access to reliable science.
We recognize that park management can happen in many different forms and can be the result of decisions made by superintendents, division chiefs, and park resource specialists. For this reason, we try to avoid the label “manager” because many people may fill that role depending on the circumstances. In this document, we use the term decision maker to mean all those who make decisions about park resources.
Likewise, we recognize that scientists can be park resource specialists, network staff, regional- or Washington-level staff, and partners working with parks and networks.

2
Integration of Science and Park Management
Additionally, the organizational structure of the NPS, as with many agencies, is compartmentalized into disciplinarydivisions. There are many practical reasons why such compartmentalization makes sense for achieving specific goals and objectives; however, such specialization may also be a barrier to achieving effective integration of science and management. While each division has its own responsibilities, all divisions work toward achieving the mission of the NPS. We believe that a key element to ensuring science is available to support park management is for scientists and decision makers to strengthen their partnership. Working together toward combined management and scienceobjectives, is necessary to achieve the overall mission of the NPS.
How to Use this Report
This report provides a framework to improve the integration of science and management. It was created through an iterative and cooperative process by scientists, park resource specialists, and decision makers. At its core is the principle of forming strong partnerships between scientists and decision makers based on a foundation of mutual goals and effective, two-way communication. We provide recommendations with the goal to ensure that the science produced by the NPS IMD remains relevant to the parks.
We’ve organized the report around a framework to integrate scientific information into park decision making (Figure 1). This framework is intended to be iterative, flexible, and dynamic. Not all ideas will be useful in all situations; nor will implementation of the framework be a linear process. Rather, the framework represents a suite of principles that we believe are worth considering for better integration of science and park management, and may be implemented to varying degrees.
Opportunities for scientists and decision makers to strengthen collaboration includes multiple facets. We’ve simplified some of these facets into “modules” within the framework that provide best practices and key concepts that can strengthen the integration of science and park management. In each module we present a range of options so that actions can be scaled appropriately based on local conditions and context; we expect readers to pick and choose what works for them rather than implementing all best practices.
The Audience for this Effort
While there is a broad audience for IMD science, the primary audiences for this report are NPS scientists and park decision makers—including the park natural resource specialists, division chiefs, and superintendents—who can use IMD results to inform park management decisions.
A secondary audience is composed of other park specialists, including interpreters, planners, regional and national natural resources staff, and other interested stakeholders, who may include scientists from other agencies, universities, and non-profit organizations.
Figure 1. A framework intended to facilitate more effective application of science to park management decisions.

3
Introduction
Module 1: Build the Foundation. To Module 4: Make Decisions. There are myriad strengthen a foundation of partnership, kinds of park decisions at all levels of scale, we define what science-management importance, and complexity. In this module, partnerships look like and identify tangible we introduce the general kinds of decisions, actions to create and strengthen them. describe some basic principles of good
decision making, and provide a framework Module 2: Evaluate the Science. This module for integrating science into decision-making builds on the good work established by IMD settings. science and discusses possible opportunities to adjust or enhance the science for best Recommendations. Based on our application to management decisions. investigation and findings, we propose a set
of recommendations. Implementing these Module 3: Communicate Results. actions will achieve our goal to strengthen the Communication is key to any partnership. partnership between scientists and decision This module provides best practices makers and result in more science-informed to communicate more effectively, both decisions. enhancing the understanding of science findings and making them relevant to decision Appendices. In the appendices, we elaborate makers. on concepts and tools mentioned in the text.
4
Integration of Science and Park Management
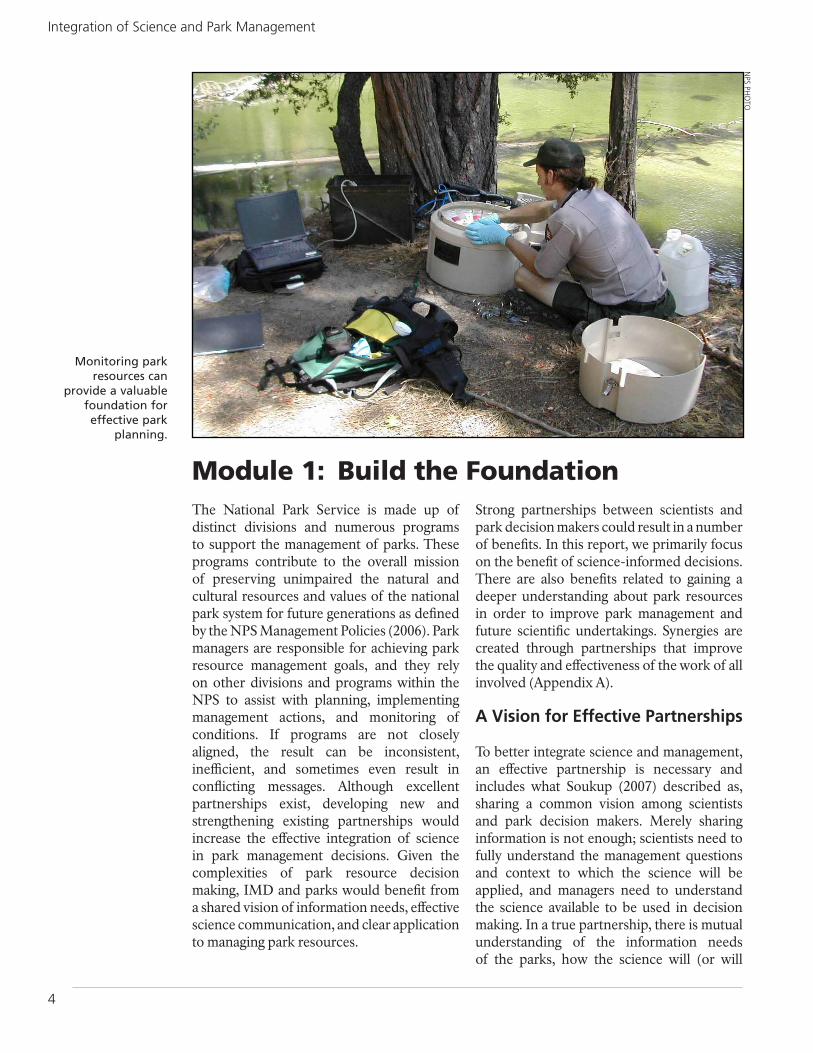
Module 1: Build the FoundationThe National Park Service is made up of Strong partnerships between scientists and distinct divisions and numerous programs park decision makers could result in a number to support the management of parks. These of benefits. In this report, we primarily focus programs contribute to the overall mission on the benefit of science-informed decisions. of preserving unimpaired the natural and There are also benefits related to gaining a cultural resources and values of the national deeper understanding about park resources park system for future generations as defined in order to improve park management and by the NPS Management Policies (2006). Park future scientific undertakings. Synergies are managers are responsible for achieving park created through partnerships that improve resource management goals, and they rely the quality and effectiveness of the work of all on other divisions and programs within the involved (Appendix A). NPS to assist with planning, implementing management actions, and monitoring of A Vision for Effective Partnershipsconditions. If programs are not closely aligned, the result can be inconsistent, To better integrate science and management, inefficient, and sometimes even result in an effective partnership is necessary and conflicting messages. Although excellent includes what Soukup (2007) described as, partnerships exist, developing new and sharing a common vision among scientists strengthening existing partnerships would and park decision makers. Merely sharing increase the effective integration of science information is not enough; scientists need to in park management decisions. Given the fully understand the management questions complexities of park resource decision and context to which the science will be making, IMD and parks would benefit from applied, and managers need to understand a shared vision of information needs, effective the science available to be used in decision science communication, and clear application making. In a true partnership, there is mutual to managing park resources. understanding of the information needs
of the parks, how the science will (or will
Monitoring park resources can
provide a valuable foundation for effective park
planning.
NPS PH
OTO

5
Module 1: Build the Foundation
not) meet those information needs, how to best communicate the science, and how the science will be used to inform park decisions.
Building New and Strengthening Existing Partnerships
Creating and maintaining a partnership based on a shared vision is built on a foundation of mutual commitment and two-waycommunication. Maintaining an effectivepartnership requires recognition that the partnership is a living, ongoing process where the shared vision is continually updated.
Mutual Commitment is EssentialIt can be difficult to achieve a functional partnership with a shared vision and goals; it can also be rewarding. Mutual commitment is essential for success. Assuming that there is interest and commitment, the next step is to determine how the partnership will best work given the specific partners, context, and need. Steps toward a successful partnership include identifying the purpose of the partnership and benefits of working together, developing a framework for the discussions, setting clear objectives for outcomes, reviewing current and proposing innovative new products, and scheduling times to evaluate progress.
Communication is a Two-way ProcessTwo-way communication between science providers and science users is critical or an exchange of ideas, and to explore ssues and applications. Currently, IMD rovides a majority of its written results in eports and briefs as “products” that are istributed to parks, in many cases with little ffective feedback and often without shared nderstanding of how the science connects
o park management. A better model would nclude venues where the applicability and
eaning of the science are continually eviewed and discussed to gain a mutual nderstanding of the meaning and relevance.
eedback from parks is an essential omponent. Parks should openly express ow well the science does, or does not meet
heir needs and routinely update IMD on heir changing information needs. Although
fiprdeutimru
Fchtt
changing sampling designs to accommodate changing needs may be difficult, there are certainly opportunities to accommodate interpretations and communication of the science to better align with those needs.
A Shared Vision of What?Throughout this report, we advocate for a common vision between IMD scientists and park decision makers, but a shared vision of what? The idea of partnerships is to bring more diverse knowledge, perspective, and expertise to bear on an issue (or problem or question) in order to create a better outcome than what would be achieved by any of the partners individually. By scientists and decision makers sitting down together to clearly describe the intended outcome, they will each have the opportunity to describe their perspective and needs and allow the other partner to identify how they can fill the need or contribute their knowledge. The mutual outcome that members of a partnership are working toward is the shared vision.
Defining Partners and their RolesPartners should be identified along with their respective roles and responsibilities at the outset. All partners will not have the same level of investment and commitment, nor are partnerships static. Primary partners are those who have the responsibility and are best suited to achieve the intended outcome. Secondary partners are those who provide added value to the outcome or who have a stake in the outcome. For example, parks have an explicit responsibility and are accountable for management of park resources. Similarly, IMD has a responsibility to and is accountable for the integrity and defensibility of the IMD science being used to inform park decisions. Although we may have a common understanding of the roles and responsibilities of the partners, this does not imply that the roles and responsibilities are the same for all partners. These relationships may differ or change over time depending on the specific outcome and vision. Many problems can be avoided by agreeing from the outset on roles and responsibilities and identifying potential overlap that might cause conflict.

6
Integration of Science and Park Management
Working in Partnership of the individuals involved. Partnerships are difficult to effectively mandate or
There is not a single approach for working in institutionalize, because they ultimately come partnership that will apply to all situations. down to the interactions among individuals. Rather, this report describes a few key We can provide suggestions and ways to elements to consider. The details of how best structure interaction, but at its core, it’s about to develop a partnership that works for all people and relationships, getting to know parties will differ according to the perceptions, each other, and working together to achieve personalities, organization, and other factors mutually beneficial goals.
Recommendation 1: Embrace the shift toward a more collaborative culture within NPS.
Collaboration ResourcesDeveloping and maintaining a strong partnership based on a common vision may sound difficult to achieve; however, there are tools and resources available to help get you started and stay on track. For example, the National Park Service Collaboration Clinic Training Team (CCTT) conducts facilitated clinics intended to aid in the development of collaborative efforts. The CCTT conduct clinics that are customized to meet the needs of an ongoing collaboration, an emerging collaboration, or simply those interested in exploring the possibilities of collaboration. More information about this resource can be found at: https://sites.google.com/a/nps.gov/collaborationclinics/
7
Module 2: Evaluate the Science
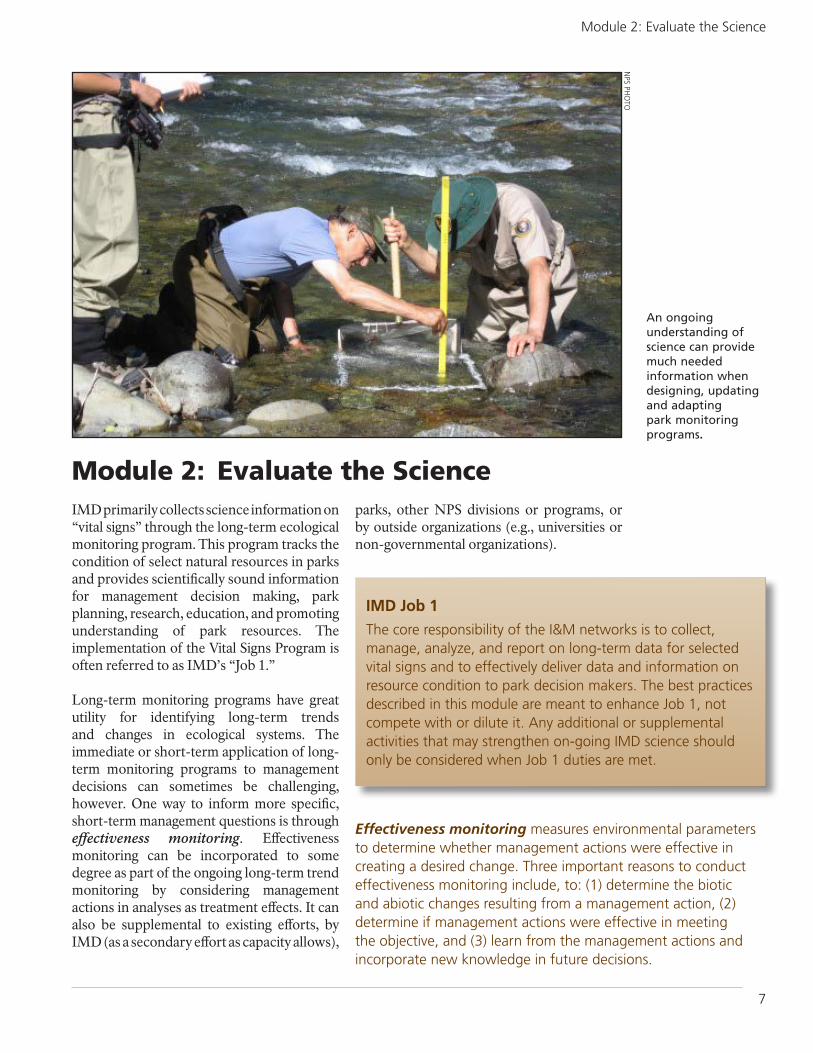
Module 2: Evaluate the Science IMD primarily collects science information on “vital signs” through the long-term ecological monitoring program. This program tracks the condition of select natural resources in parks and provides scientifically sound information for management decision making, parkplanning, research, education, and promoting understanding of park resources. Theimplementation of the Vital Signs Program is often referred to as IMD’s “Job 1.”
Long-term monitoring programs have great utility for identifying long-term trendsand changes in ecological systems. The immediate or short-term application of long-term monitoring programs to management decisions can sometimes be challenging, however. One way to inform more specific, short-term management questions is through effectiveness monitoring. Effectivenessmonitoring can be incorporated to some degree as part of the ongoing long-term trend monitoring by considering managementactions in analyses as treatment effects. It can also be supplemental to existing efforts, by IMD (as a secondary effort as capacity allows),
parks, other NPS divisions or programs, or by outside organizations (e.g., universities or non-governmental organizations).
Effectiveness monitoring measures environmental parameters to determine whether management actions were effective in creating a desired change. Three important reasons to conduct effectiveness monitoring include, to: (1) determine the biotic and abiotic changes resulting from a management action, (2) determine if management actions were effective in meeting the objective, and (3) learn from the management actions and incorporate new knowledge in future decisions.
NPS PH
OTO
An ongoing understanding of science can provide much needed information when designing, updating and adapting park monitoring programs.
IMD Job 1The core responsibility of the I&M networks is to collect, manage, analyze, and report on long-term data for selected vital signs and to effectively deliver data and information on resource condition to park decision makers. The best practices described in this module are meant to enhance Job 1, not compete with or dilute it. Any additional or supplemental activities that may strengthen on-going IMD science should only be considered when Job 1 duties are met.

8
Integration of Science and Park Management
Networks and parks within IMD have varying capacities to go beyond Job 1. Depending on the circumstances, these parks and networks will need to work together to decide if and to what extent supplemental science support(effectiveness monitoring or other research) is appropriate (Figure 2).
We recognize that science is not the onlyinformation applied to managementdecisions, and that science information needs are quite variable, depending on the context (Appendix B). In this module, we describesome best practices to identify and addressscience needs based on the shared vision and identified outcome.
Science Needs Assessment
Assessing science needs is a useful place to start. Many parks and IMD networks started such an assessment in the early stages of identifying vital signs for their monitoring programs. Since park information needs evolve and change over time, it is helpful to
revisit them. The key components of a science needs assessment include:
Identify what we need to know, based on management decision needs.The science information needs for park management generally represent gaps between our existing knowledge and the information required to make effective management decisions. First, we recognize that decision makers and scientists likely think about and approach information needs differently. Even for the same resource or topic, scientists may think more about which parameters might be feasible to collect to determine the biophysical state of the system, while park decision makers may think more about such things as the potential visitor impacts and feasibility of management given limited resources. Thus, conducting a needs assessment together will incorporate perspectives from both scientists and decision makers. Conceptual models are one tool to simplify a complex issue (Appendix C).
Figure 2. Not all parks or networks have the capacity
to provide supplemental science
support. This figure describes where
additional flexibility may exist.
9
Module 2: Evaluate the Science
When determining information needs, it is advantageous to consider multiple scales. Thinking about a management issue from multiple perspectives and scales is useful to consider the context and intended or unintended consequences of actions. Some information needs (e.g., effects of climate change) may be shared by other parks across the region; addressing those information gaps may be beneficial to others.
Identify what we know.Based on the science and management questions, we can identify what information we need and compile what we already have. This includes access to science currently available, as well as an interpretation of the science in the context of park issues. It is not uncommon for two parties to look at exactly the same information or data and come away with different interpretations. By gathering and discussing existing, relevant knowledge, scientists and decision makers can be on the same page for next steps in the decision-making process.
Knowing what science is available is largely an access issue (or a capacity issue to collect the data). Science based on data currently collected as part of IMD monitoring is (generally) readily available. There are also myriad other science information sources available through portals such as the NPS Integrated Resource Management Applications (IRMA).
Identify the gaps and how to fill them.Based on what we need to know and what we already know, the information gaps will clearly point to what we don’t know. Some gaps may be filled by looking at existing information in a new way (e.g., different analyses); or designing ways to collect the information.
It is important to note that even when there are defined science-based information needs, answering those needs may, in some cases, be difficult or unrealistic to achieve and IMD will not always be able to fulfill all needs. This could be due to cost or to logistical or practical reasons. At some point, scientists and decision makers will need to consider the feasibility of
Apply existing IMD science to fill information gaps.
filling information needs and prioritizing what is reasonable. Decisions are rarely made with all information gaps filled, and uncertainty in ecological systems is inevitable; however, in cases where supplementary science (research or monitoring) is not feasible, an alternative may be to treat uncertainty as an information need to be incorporated into management actions. For example, existing monitoring can be often be used in conjunction with tools such as adaptive management or assessment points (discussed in Appendices D and E, respectively) to help reduce uncertainty over time within the context of existing efforts.
Two approaches to effectively deliver science information that directly applies to management decision making include (1) applying existing IMD science and park information in new ways, and (2) providing supplemental science to address unmet information needs.
The overall purpose of IMD is to determine the condition of park natural resources and detect trends in condition over time. IMD and park staff have invested substantial time and energy in developing and implementing the long-term program to accomplish this, and although not all vital signs were explicitly chosen to address management issues, existing data may provide useful insights to decision makers. This information might be applied to management issues through different interpretation and analysis of existing data. It may be that existing data can be considered,
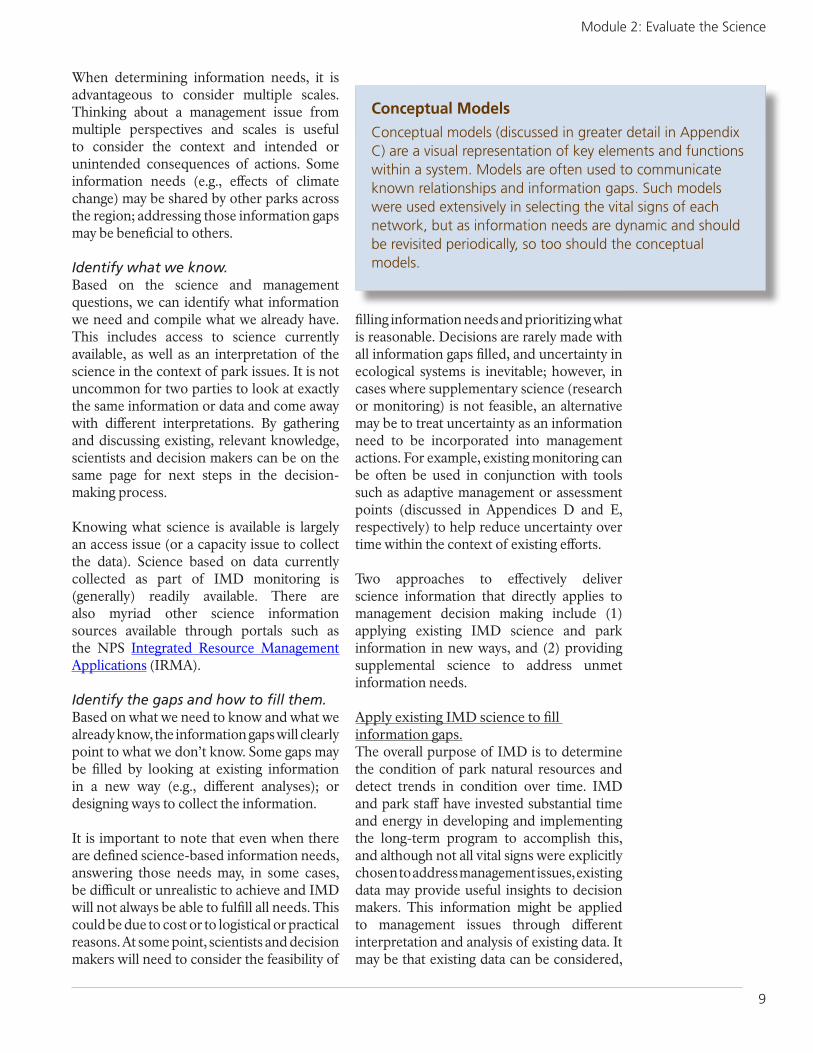
Conceptual ModelsConceptual models (discussed in greater detail in Appendix C) are a visual representation of key elements and functions within a system. Models are often used to communicate known relationships and information gaps. Such models were used extensively in selecting the vital signs of each network, but as information needs are dynamic and should be revisited periodically, so too should the conceptual models.

10
Integration of Science and Park Management
Analyze Existing Data to Meet New NeedsThe Southern Plains Network (SOPN) is assigning floristic characteristics (e.g., color and shape of the flower, reproductive phenology, and other parameters) to individual plant species within existing vegetation datasets. These characteristics influence the plant’s availability for pollinators. For example yellow and blue flowers are particularly attractive to bees, whereas red flowers may be more attractive to butterflies and hummingbirds. Similarly, characteristics such as the shape of the flower and the seasonality of blooming also influence their attractiveness and availability to certain pollinators. Such information about flower characteristics is largely available in the existing literature or known by local botanists and does not require additional sampling. Adding this information to the database enables an analysis of vegetation monitoring results in the context of condition and trend of pollinator habitat, something that has become a global concern, but was not considered at the time of the initial sampling design.
A Collaborative Approach to Using IMD DataWhen water quality parameter exceedances were recorded by the Northern Colorado Plateau Network (NPCN) staff in the Narrows of Zion National Park, Utah, the park and state were immediately made aware. The state took the lead and met with land owners upstream of the park, and actions were implemented to reduce exceedances that were likely caused by people and livestock. In this case, existing IMD data were used and additional data were gathered through support of the park, NPS Water Resources Division, state, and other partners.
Adjusting Sampling Methods to Inform Management DecisionsAerial surveys of Dall’s sheep have been conducted almost annually in portions of Noatak Preserve in Alaska since 1986. Initially, surveys were conducted as unadjusted minimum-count surveys by park staff. In 2011 and 2014, aerial distance sampling surveys were conducted using a Bayesian analytical approach to increase precision and decrease required sample size in order to provide improved population estimates from year to year. This was done in partnership with the I&M network, Noatak Preserve, and the Alaska Department of Fish and Game (ADFG). Federally qualified subsistence users are allowed to hunt sheep in the preserve under federal or state hunting regulations. From 2011-2014, sampling indicated a decline in the sheep population within Noatak—47% in the Western Baird Mountains and 82% in the DeLong Mountains. Armed with this information based on the improved sampling approach, both the NPS and ADFG requested and received from their respective hunting regularoty boards, a complete closure of Dall’s sheep hunting in the preserve until the population recovers.
Adjusting Sampling Design to Answer Management Questions
The Greater Yellowstone Network (GRYN) whitebark pine monitoring program monitors whitebark pine stands in a panel design, with a resurvey every four years. During the mountain pine beetle epidemic around 2001-2013, however, it was recognized that visiting transects every four years was not adequate to capture the high rate of tree mortality. Therefore, site-visit frequency was increased to one visit every two years from 2008-2013 to more closely track tree mortality and resumed to a single visit every four years in 2014, after mortality rates declined. The ground-based monitoring results were informative during the preparation of a grizzly bear food synthesis report as part of the proposed delisting of the grizzly bear (http://nrmsc.usgs.gov/files/norock/IGBST/IGBST_FoodSynReport120213.pdf). In addition, GRYN identified the need to improve sampling of recruitment of whitebark pine trees after the large die-off of cone-bearing trees and has implemented a protocol to collect this information.
Supplementing On-going IMD Monitoring to Address Management EffectivenessThe Mid-Atlantic Network (MIDN) worked with Valley Forge National Historical Park (VAFO) and researchers from Penn State University to establish a baseline for effeciveness monitoring. Overpopulation of white-tailed deer in the park has resulted in two decades of greatly reduced forest regeneration. With the implementation of deer management at VAFO, it was determined that the number of IMD forest vegetation monitoring plots was not sufficient to provide an initial baseline and future trends in plant regeneration in two priority areas of the park. Since this information is critical to the park determining whether the inital target deer densities of 31 to 35 deer per forested square mile are adequate in promoting successful forest regeneration, supplemental forest monitoring plots were installed at the park. The additional plots provide an increased sampling intensity, augmenting the ongoing IMD monitoring in the park.
Figure 3. Examples of ways to apply
existing IMD data to management
questions, in increasing degree of
complexity.
Incr
easi
ng C
ompl
exit
y

11
Module 2: Evaluate the Science
Provide Supplemental Science
evaluated, or analyzed in a new way or in new combinations to provide new insights. Figure 3 provides examples of how existing data can be used to address management issues.
Some park information needs may not be immediately addressed by existing IMD data (e.g., water quality in streams or watersheds not monitored by IMD, effectiveness of alternative exotic plant management options, ecological drivers of observed natural resource trends). And there might be opportunities to augment or adjust IMD science to address unfulfilled science needs—what we will call supplemental science. We realize that supplemental science goes beyond Job 1 for I&M networks; as such, supplemental science should be considered only in cases where Job
1 duties are fully accomplished and where opportunities for supplemental science are feasible, given logistical, practical, or financial constraints (Figure 2).
Approaches to implementing supplemental science range from working with other NPS divisions or external partners in utilizing IMD data to adjusting current monitoring to fulfill unmet information needs (without undermining the long-term goals of on-going monitoring), or initiating some effectiveness monitoring. In Figure 3, we present a range of examples that illustrate a gradient of supplemental science, from simple to complex. These examples are meant to show that supplemental science can be scaled based on local conditions and context.
Recommendation 2: Encourage NPS leadership to expand the role of science in NPS and to recognize the need for a wide range of science support for parks.
Recommendation 3: Encourage effectiveness monitoring in Servicewide Comprehensive Call (SCC) proposals.
Recommendation 4: Substantially improve the capability for data to be shared among NPS divisions.
Recommendation 5: Provide support for on-going, iterative evaluation of science needs.

12
Integration of Science and Park Management
Module 3: Communicate Results While IMD networks have been successful in publishing many technical reports, resource briefs, journal publications, and other communications products over the past ten years, it is uncertain whether these products consistently meet management needs. When asked, managers frequently request that networks continue to deliver a wide range of products, but the variety of products are not equally effective, nor is it sustainable to package information in multiple ways. Likewise, there is no consistent understanding by networks on what parks truly need and can use, in part because the needs vary from park to park. Networks and parks can draw from the models that have worked across the country, as well as explore new and innovative ways to transfer science in useful formats that are both sustainable and effective. Effectively communicating science to support management decisions can only be achieved in collaboration—when decision makers express what information they need, and scientists provide information in a way that is understandable and applicable to managers (Appendix F).
In this module, we look at ways in which networks and parks can collaborate to improve how IMD science is communicated to facilitate decision making by engaging parks, creating a shared sense of ownership, and sharing targeted and timely information. The integration and communication of IMD science to the broader public is not covered here, but instead is addressed in the IMD Communication Plan (DeBacker et al. 2016).
Target Communication Audiences
The primary goal of IMD networks is to deliver science to parks in order to inform management decisions. Therefore, the primary audience for IMD science communication is park decision makers, consisting of park resource specialists, division chiefs, and superintendents.
A secondary audience consists of other park staff, including interpreters, planners, regional and national natural resources staff, and other interested stakeholders, including scientists from other agencies, universities, non- profit organizations.
Clear communication between park
managers and field crews help to make
sure all needs are met.
NPS PH
OTO

13
Module 3: Communicate Results
Developing a Science-Management Dialogue
A dialogue, with equal participation by IMD scientists and park decision makers, can better align science and management. There are a number of ways to facilitate this dialogue. In-person meetings (road shows, and other formats), field trips, and conference calls (joining regular staff calls, for example) can all provide opportunities for park decision makers to express their management challenges and for scientists to explore options for delivering information. No matter the approach, IMD and parks need to develop a dynamic format to their dialogue, moving away from relatively static information delivery through reports and presentations, toward interactive discussions (e.g., listening sessions) and information exploration (e.g., web-based data visualization).
Building on Successful Communication Models
Many good examples of effective communication products and approaches for integrating science into management exist from IMD networks across the country. Learning from other networks can help us achieve more consistency across networks (see DeBacker et al. 2016 and Appendix F).
Directly Engaging with Parks
While it may not be possible for networks to participate in all park-based resource management meetings, we encourage networks to explore opportunities to participate where time and resources allow. One approach would be to focus on a single park that is geographically closest to the network, or, to target a different park each year, or, to have different staff target individual parks on a rotating basis. In so doing, IMD staff will gain an understanding of park management priorities and how to deliver information that is relevant to the planning process. Likewise, parks will increase their opportunities to interact with networks, learn what information the network can provide, and enhance how the parks can assist the
networks for their mutual benefit. While we are not advocating that IMD become actively engaged in park planning, we encourage networks to increase their awareness of the challenges and decisions that parks face. Likewise and wherever possible, this type of engagement should also extend to the regional or national level (for example, technical committees and work groups) as another valuable opportunity to provide monitoring information.
Another opportunity to engage park staff is by inviting them to participate in IMD field activities. The type of interaction and dialogue that can occur while a field crew is collecting data is very different to what transpires in a conference room during a presentation. How differently would a decision maker perceive the data from a graph if it is shown on a tablet while in the field at the location that the data is summarizing? How would that affect that manager’s ideas for how to use future resource briefs or other products that networks provide? Yet another approach would be to have park staff on short details to the network office, engaging directly with IMD staff and working with data relevant to their park; or network staff on detail in a park learning more about park management.
Timely and Focused Information Delivery
Not all IMD data are immediately relevant to park decision makers. Although it is important to analyze and report on all monitoring data, the information most relevant to decision makers should have highest priority for
Listening SessionsThe Mid-Atlantic Network has established a network natural resources technical advisory group. Meetings or “listening sessions” are held once a year, with time allocated for networks to provide updates on vital signs monitoring, and for each resource manager to provide an overview of management issues they are addressing. Dialogue among park staff as well as with network staff can lead to new ways of collaboration.

14
Integration of Science and Park Management
communication. This requires fostering mutual understanding on the IMD products and how they can be used by park decision makers. One approach involves the use of data visualization. Web-based data visualization allows users (networks and parks) to access and explore data and generate custom-made
charts and tables relevant to their needs. IMD scientists and decision makers looking at data together through visualization tools can discuss what data and analyses are most informative to park resource management and how best to apply them to decision making.
Enhancing a Sense of Ownership
Parks directly benefit from IMD products. Although the IMD products are based on the resources that parks are mandated to protect, a widespread sense of collaboration and ownership has not been consistently achieved. We realize that this may take a long time to reach, and it may not happen in all networks and parks, but we can make significant strides by instilling a sense of ownership in the IMD products. This requires dialogue and a mutual understanding of our roles, and will only happen by active participation of networks with parks and vice versa.
Data VisualizationThe IMD is developing a data visualization portal where IMD and park staff, as well as the general public, can explore IMD data. While this will fulfill our mandate to make the data accessible, more importantly it provides a tool to promote dialogue and interaction with park decision makers. The National Capital Region Network has successfully implemented this approach and resulted in a dramatic increase in the number and types of interactions with park staff.
Recommendation 6: Engage parks and networks in the best alignment of IMD science, park information needs, and decision support.
15
Module 4: Make Decisions
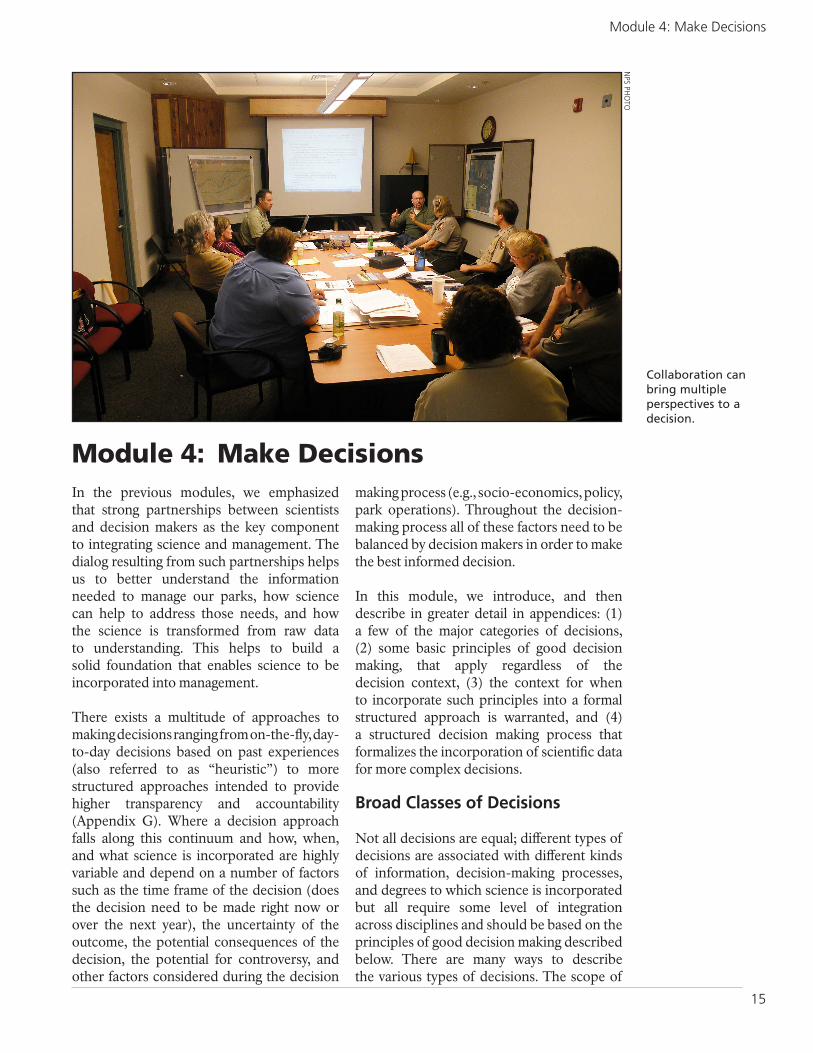
Module 4: Make DecisionsIn the previous modules, we emphasized that strong partnerships between scientists and decision makers as the key component to integrating science and management. The dialog resulting from such partnerships helps us to better understand the information needed to manage our parks, how science can help to address those needs, and how the science is transformed from raw data to understanding. This helps to build a solid foundation that enables science to be incorporated into management.
There exists a multitude of approaches to making decisions ranging from on-the-fly, day-to-day decisions based on past experiences (also referred to as “heuristic”) to more structured approaches intended to provide higher transparency and accountability(Appendix G). Where a decision approach falls along this continuum and how, when, and what science is incorporated are highly variable and depend on a number of factors such as the time frame of the decision (does the decision need to be made right now or over the next year), the uncertainty of the outcome, the potential consequences of the decision, the potential for controversy, and other factors considered during the decision
making process (e.g., socio-economics, policy, park operations). Throughout the decision-making process all of these factors need to be balanced by decision makers in order to make the best informed decision.
In this module, we introduce, and then describe in greater detail in appendices: (1) a few of the major categories of decisions, (2) some basic principles of good decision making, that apply regardless of the decision context, (3) the context for when to incorporate such principles into a formal structured approach is warranted, and (4) a structured decision making process that formalizes the incorporation of scientific data for more complex decisions.
Broad Classes of Decisions
Not all decisions are equal; different types of decisions are associated with different kinds of information, decision-making processes, and degrees to which science is incorporated but all require some level of integration across disciplines and should be based on the principles of good decision making described below. There are many ways to describe the various types of decisions. The scope of
Collaboration can bring multiple perspectives to a decision.
NPS PH
OTO

16
Integration of Science and Park Management
decisions can range from very broad to very narrow, and is sometimes described as three general classes that are by no means mutually exclusive: operational, tactical, and strategic (Figure 4).
Operational Decisions are informal, routine, day-to-day decisions, often made by field staff, that are primarily based on common sense, established rules or approved plans, experience, and judgement. These decisions would typically fall within a categorical exclusion in the compliance process. These decisions typically involve limited resources and have shorter-term applicability. Thus, many of these decisions do not warrant a more formal process, although they are likely improved upon by paying attention to the principles of good decision making. There may be opportunities for parks to incorporate existing results from the IMD monitoring programs or request additional information to help inform operational decisions. This in turn provides the opportunity to build a foundational partnership between IMD and parks.
Tactical Decisions are designed to achieve broader strategies. These include park management implementation plans (e.g., Fire Management Plans, Vegetation Management Plans, wildlife management plans). Decisions are typically made by park superintendents and resource staff in conjunction with a more in-depth compliance process. Many of these decisions would benefit from following the
basic principles of good decision making and could greatly benefit from supporting science. There are greater opportunities for park managers, IMD network scientists, and other specialists at the regional or WASO level to partner on incorporating the best science available into tactical decisions.
Strategic Decisions are the bigger-picture decisions, such as the NPS or programmatic missions, visions, and strategies. These are typically based on values but incorporate science as appropriate. While these types of decisions typically occur with upper level management, scientists from parks, regions, WASO, and IMD will be sought out to provide scientific input as needed.
Principles of Good Decision Making
There are basic principles of good decision making (Table 1, Figure 5), which can help to facilitate making better decisions regardless of whether it is an operational, day-to-day decision or part of a formal decision process used in tactical or strategic decisions.
Figure 4. Three general classes of decisions relative to their authority and timeframe of
application (Bauer and Erdogan 2015).
Figure 5. NPS decision-making processes must adhere with precision to the law, be mindful of legislative intent, and consistently and transparently follow public policy and regulations (National Park System Advisory Board, Science Committee 2012).

17
Module 4: Make Decisions
Table 1. Seven basic principles of good decision making, descriptions of each, and suggested actions on how IMD and parks may be able contribute throughout the decision making process. It is important to document each one of these steps throughout the decision making process in order to provide transparency and a way to learn from the decision.
In Action Principle Description
(as it relates to parks and IMD)
Clearly Define the Clearly defining and articulating the Identifying the stakeholders is critical Problem/Decision problem, management question, or in this step and initiating the dialog
decision is a critical first step as it (as discussed in Module 3) between will help determine the information scientists and decision makers at this needed to address the problem or stage will begin the process that the decision. This step should include “right” science data are available and identifying stakeholders, decision that results are communicated in a form authority, any legal constraints, the that is relevant to the specific problem data available and data needed, and and decision. Without these discussions any other factors that define the occurring early on assumptions may be scope of the decision. made that are incorrect and lead to the
inability to make a quality decision using the best science.
Articulate the Goal/ Clearly stating the goals and In addition to further ensuring that Objective of the Decision objectives facilitates that decisions science is relevant to the goals and
are tied to desired outcomes and objectives of the decision, a dialog the criteria by which to assess the between scientists and decision makers outcomes are clearly articulated also facilitates interpretation of the (discussed in greater detail in available science in the context of Appendix H). potential outcomes and identifies if
there are gaps in the available science. At this time scientists and decision makers can discuss whether there are other viable options to generate additional information, such as (1) re-analysis of existing data and information; (2) a simple redesign or adaptation to the existing effort to gather the information needed; or (3) identifying a need for new research.
Develop Meaningful Developing meaningful and realistic Interpreting existing science in the Alternatives alternatives for consideration. If there context of potential alternatives
are no alternatives, then there is really facilitates a better understanding of no decision to be made. which alternatives might best achieve
the desired outcomes. Decision makers and scientists need to work together to ensure there is a clear understanding of the defined alternatives so that each can be evaluated appropriately and no assumptions are made.
Consider the Consider the expected consequences Scientists and decision makers should Consequences for each alternative. This may gain a full understanding of all the
be a quantitative process if data consequences of a decision so that the are available to enable predictive best science is used while understanding estimates, or it may be a more the other components that come subjective process reliant on into play when making the decision. professional judgement if data are It is important for stakeholders to not available. Some consequences to understand when science may not be consider are what impacts may occur appropriate in the decision due to other to operations, the environment, or factors such as policy or laws. socio-economic.
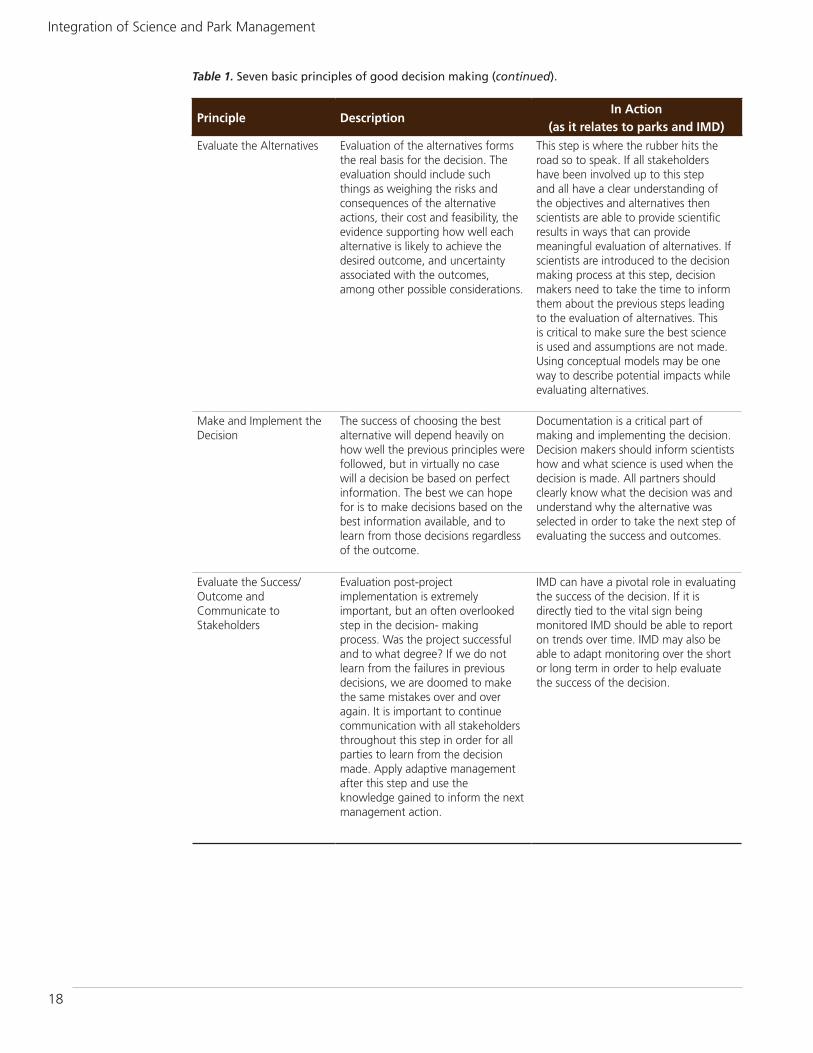
18
Integration of Science and Park Management
Table 1. Seven basic principles of good decision making (continued).
In Action Principle Description
(as it relates to parks and IMD)Evaluate the Alternatives Evaluation of the alternatives forms This step is where the rubber hits the
the real basis for the decision. The road so to speak. If all stakeholders evaluation should include such have been involved up to this step things as weighing the risks and and all have a clear understanding of consequences of the alternative the objectives and alternatives then actions, their cost and feasibility, the scientists are able to provide scientific evidence supporting how well each results in ways that can provide alternative is likely to achieve the meaningful evaluation of alternatives. If desired outcome, and uncertainty scientists are introduced to the decision associated with the outcomes, making process at this step, decision among other possible considerations. makers need to take the time to inform
them about the previous steps leading to the evaluation of alternatives. This is critical to make sure the best science is used and assumptions are not made. Using conceptual models may be one way to describe potential impacts while evaluating alternatives.
Make and Implement the The success of choosing the best Documentation is a critical part of Decision alternative will depend heavily on making and implementing the decision.
how well the previous principles were Decision makers should inform scientists followed, but in virtually no case how and what science is used when the will a decision be based on perfect decision is made. All partners should information. The best we can hope clearly know what the decision was and for is to make decisions based on the understand why the alternative was best information available, and to selected in order to take the next step of learn from those decisions regardless evaluating the success and outcomes. of the outcome.
Evaluate the Success/ Evaluation post-project IMD can have a pivotal role in evaluating Outcome and implementation is extremely the success of the decision. If it is Communicate to important, but an often overlooked directly tied to the vital sign being Stakeholders step in the decision- making monitored IMD should be able to report
process. Was the project successful on trends over time. IMD may also be and to what degree? If we do not able to adapt monitoring over the short learn from the failures in previous or long term in order to help evaluate decisions, we are doomed to make the success of the decision.the same mistakes over and over again. It is important to continue communication with all stakeholders throughout this step in order for all parties to learn from the decision made. Apply adaptive management after this step and use the knowledge gained to inform the next management action.

19
Module 4: Make Decisions
The Shift from Heuristic to Formal Decisions
As previously mentioned, different types of decisions call for different approaches to decision making and how science is integrated into those decisions. But, at what point along the continuum of types of decisions is a shift from experience-based heuristic decisions to a more structured decision processwarranted? Day-to-day operational decisions may not warrant a formal decision process, but as decisions get increasingly complex, the need for a more formal approach increases.
While there is not a single definable point t which the transition occurs, the value of sing a structured approach increases with
he decision’s importance, complexity, risk, ncertainty, and potential for controversy Figure 6).
pplying the principles of good decision aking at all levels along the decision-making
ontinuum is important to ensure there are ood relationships between decision makers nd scientists. The end result is that when a ecision requires the more formal structured ecision process there is already a strong artnership in place.
autu(
Amcgaddp
Figure 6. Conceptual diagram illustrating that the value in using a structured decision process increases as the importance, complexity, risk, uncertainty, and potential controversy associated with the decision increases.

20
Integration of Science and Park Management
Structured Decision Making
We suggest that the principles of good decision making described above can add value to all types of decisions, but we also recognize that in situations where the decisions are more complex and require greater transparency, a process that formalizes these steps may be warranted. In recent years, these basic principles, or variations on these principles, have been linked together and evolved into a process known as structured decision making (Figure 7; Appendix I). Structured decision making can be thought of as Keeney (1982) expressed it: a formalization of common sense for decision problems which are too complex for informal use of common sense.
For decisions that warrant a formal approach, structured decision making brings clarity to the decision-making process. Working in partnership with all stakeholders and thinking explicitly about the reason for the decision; the objectives, consequences, and risks associated with different alternatives; the evidence supporting those alternatives; and the outcome of having made a decision all contribute to a fundamentally more effective stewardship of NPS resources. Such an approach also provides transparency by documenting how and why a certain decision was made or alternative selected, and provides clear justification for each decision. In addition, the process provides a record (or a history) that facilitates learning that can benefit future decisions.
As described in this module, we recognize that there are different classifications of decisions and the role of science in those decisions will vary. Following the principles of good decision making will help ensure a good partnership between decision makers and scientists that will ultimately lead to quality decisions that are transparent no matter the type of decision to be made.
Recommendation 7: IMD networks and parks share results from science integration into the decision-support process annually.
Recommendation 8: Include a science component to Fundamentals training.
Recommendation 9: Provide training in the principles of good decision making.
Figure 7. The seven principles of good decision making that, when warranted, can be used as a connected process known as structured decision making.

21
Recommendations
We support the use of the best available sound science and scholarship throughout the National Park Service. Many guidance documents support this (Revisiting Leopold, Call to Action, and others), and the intent of the IMD Excellence in Science Committee was to identify tangible steps toward strengthening science capacity and application. We see the following recommendations as actions we can take within IMD to better integrate science and park management, though these same principles and actions can be applied in other areas of the agency and across land management agencies.
Stated simply, NPS scientists and decision makers need to become more aware of opportunities to integrate science and management decisions and take action to do so. We recognize that there are many different circumstances faced by park decision makers and scientists and there is no single approach to integrating science into decision making. We also recognize that there is a wide range of decisions and that science is one part of the decision-making process—or may have no part at all. Therefore, this report and the following recommendations are a framework
in support of how to integrate science and park management decisions.
Build Upon Our Existing Partnerships as a Foundation for Better Integration
Recommendation 1: Embrace the shift toward a more collaborative culture within NPS.
The NPS consists of numerous divi sions and programs. Although each division or program has its own programmatic goals, they all contribute to the overall NPS mission of preserving unimpaired the natural and cultural resources and values of the na tional park system for future generations. Work ing collaboratively, rather than independently, offers the best opportunity to assess resource condition and use the best available sound science to help manage our parks, in addition to increasing science literacy among park managers. Grassroots efforts such as the Urban Agenda’s One NPS Project, the NPS Collaboration Clinic Training Team, and others offer opportunities to join forces to embrace a shift within NPS toward a more collaborative culture. We recommend that
Recommendations
Having a strong partnership between scientists and decision makers is one of the best pathways to successful integration.
KIM
STRUTH
ERS

22
Integration of Science and Park Management
IMD and parks be a part of this cultural shift, as recommended specifically in Revisiting Leopold (National Park System Advisory Board Science Committee 2012:19), “This expanded scientific capacity must beinterdisciplinary as well as disciplinary, and leverage scientific partnerships...”
This report can be a catalyst to initiate or continue a dialog between park managers and IMD. Thus, we propose that network program managers distribute this report to their technical committees, board of directors, and their parks. Then establish a time and forum to discuss steps that might be appropriate for strengthening their partnership. Because each network has its own relationship with its parks, we are not advocating any one specific approach; rather this report can serve as a guide for potential discussion topics.
For example, networks may distribute this report to their parks with a request for ideas of how they could build upon their existing partnership and seek out specific opportunities to integrate science into management.
If networks want to take this further, they may also develop a “partnership plan,” using this report as a resource that outlines steps to be taken by both the network and parks for building a stronger partnership.
Ultimately, partnerships should be a routine way of doing business, an integral part of our agency culture. Upper management from the director’s office to individual regions should provide encouragement and support collaboration across divisions and disciplines. This can be incorporated into vision statements, plans, and memos of support, including the IMD Strategic Plan. Networks and parks should also be encouraged to look for opportunities and synergies that arise when our programmatic efforts overlap.
Enhance the Utility of Science
Recommendation 2: Encourage NPS leadership to expand the role of science in NPS and to recognize the need for a wide range of science support for parks.
We agree and support the conclusion of the Revisiting Leopold report (National Park System Advisory Board, Science Committee 2012:19): “To implement the resource management goals and policies described in this report, the NPS will need to significantly expand the role of science in the agency.” This goes well beyond IMD. The Inventory and Monitoring Program was initially established to monitor the status and trends of a small set of indicators or vital signs. Although understanding the monitoring status and trend of key resources is of high value as an early warning of park condition, the science needs of NPS go well beyond this aspect. Basing park decisions on the best available science also includes a fundamental understanding of ecosystem processes and functioning, the ability to better predict responses to management actions, and ongoing assessments of effectiveness of treatments or relative effectiveness of alternative treatments.
At the very least, we would encourage NPS leadership to recognize the vast array of needs for science and to encourage and support innovative solutions and opportunities to fulfil those needs.
However, to realistically achieve anything close to effectively using science as a basis for park management a more aggressive solution would be required. Such a solution would be along the lines of the Revisiting Leopold report (National Park System Advisory Board, Science Committee 2012:19) recommendation that “NPS must materially invest in scientific capacity building by hiring a new and diverse cohort of scientists, adequately supporting their research, and applying the results.”

23
Recommendations
Recommendation 3: Encourage effectiveness monitoring in Servicewide Comprehensive Call (SCC) proposals.
The SCC provides access to NPS funding sources to support natural resource (and other) projects. The criteria for projecteligibility and the evaluation criteria forproject selection differ among funding sources and, in our opinion, currently lacks clarity and consistency with regard to supporting science-based park management decisions. Of particular concern is the specific exclusion of an “effectiveness monitoring” component for project eligibility or selection. Currently, the inclusion of monitoring renders a project (e.g., social science projects) ineligible for some funding sources. Other funding sources (e.g., ocean and coastal park stewardship projects) indicate that funding is not intended for long-term monitoring, while still others (e.g., climate change response projects) give high selection criteria points in technical soundness for effectiveness monitoring for adaptive management (FY2017 SCC Natural Resources Guidance). Regardless of thedifferences among funding sources or the intent, there is a widespread perception that including a monitoring component will dramatically reduce the chances of a proposal from funding.
Given that NPS policy (NPS 2006) states that park planning decisions should be based, at least in part, on the best available science, we believe that discouraging monitoringis inconsistent with the intent of NPSpolicy. This is not an argument for blanket incorporation of general monitoring in SCC projects; rather, it is an argument for inclusion of the right type of monitoring that would directly benefit park management decisions. In contrast to the monitoring conducted by IMD which largely focuses on the status and trend of a small set of resources, “effectiveness monitoring” focuses on assessing theresponse or effectiveness of management actions in achieving their intended purpose and/or the relative effectiveness of alternative management actions. As such effectiveness monitoring is directly related to the outcome of management decisions or actions. In
essence, effectiveness monitoring is a key process for learning what management actions are and are not effective in achieving our park management goals.
Recommended implementation: It is our understanding that the SCC is currently being revised. In this revision, we believe that SCC guidance should distinguish between effectiveness monitoring and other types of monitoring. Without effectiveness monitoring, there is no reliable and consistent means to determine whether management actions are achieving their intended results. As such, we strongly recommend that effectiveness monitoring be encouraged, not discouraged in SCC proposals that include management actions.
Recommendation 4: Substantially improve the capability for data to be shared among NPS divisions.
Information sharing is vital for improved integration of NPS divisions and parks, as datasets that are collected by each division or park can complement and strengthen the activities of other divisions or parks. For example, by accessing locations of exotic plant treatments or prescribed fires, IMD may be able to assess treatment effects by post-stratifying monitoring data by management action. This approach is only possible, however, if data describing the management actions implemented by EPMT or fire programs are easily accessible to scientists.
As a first step towards improved information and data-sharing, we propose convening a workgroup, with representatives from all NPS NRSS divisions, to determine the best tools for sharing data across disciplines and divisions. This is a science need that requires an IT solution; thus, IT needs to work alongside scientists to find the solution. The ultimate goal of the workgroup will be to develop tools and solutions that allow access to descriptions of datasets (metadata) collected by each division and to the raw data themselves. We recognize that this is a challenging task that will require substantial time and effort, and NRSS divisions must be

24
Integration of Science and Park Management
willing to commit such time and effort if we are ever to improve data access and sharing among the divisions. We believe that this recommendation complements on-goingefforts to facilitate data-sharing (e.g., the “pipeline” and data.gov) and may be folded into other initiatives.
Recommendation 5: Provide support for on-going, iterative evaluation of science needs.
Science information needs evolve andchange, partly as a result of the improved understanding of ecological systems and their stressors gained through long-term monitoring. As such, we must recognize that the identification of science information needs is an on-going, continual process that reflects the current understanding of natural resources and the threats to them.
A natural opportunity to evaluate science needs, then, is during ongoing park-IMD interactions that are focused on reviewing and discussing the meaning of science and its applicability to park management. Links between IMD science and park management, or lack thereof, may facilitate pinpointing gaps in the current understanding of park resources. Regular, recurring discussions are also a vital component of maintaining a strong partnership between parks and IMD and should be a high priority for both partners.
In some cases, it may become apparent that a more formal science needs assessment is needed and desired, particularly if park science needs are well outside the scope of IMD and other NPS programs. Just as we encourage NPS leadership to encourage and support opportunities to fulfill science needs (see recommendation 2), we also encourage NPS leadership to provide support for repeated opportunities for parks to formally assess, identify, and revise their highest priority science needs.
Communicate Science Effectively to Support Management Decision Making
Recommendation 6: Engage parks and networks in the best alignment of IMD science, park information needs, and decision support.
We encourage networks and parks to engage in a dialog that identifies opportunities for collaboration and information sharing. An emphasis on collaborative, two-way communication, and a sense of a shared ownership in the science and management outcomes is essential. This requires timely and focused information exchange, not just science delivery, but also articulating management challenges and needs. Not all IMD monitoring is immediately relevant nor are all management needs met by the networks, but the technical expertise networks have can help parks meet common goals. IMD technical assistance to parks can play a substantial role in promoting dialogue and creating a common vision. Likewise, as time allows, networks can take an active role in supporting park decision making by participating in scientific panels or advisory boards, and by assisting with the evaluation and implementation of decision making tools.
We encourage networks and parks to explore alternative approaches to exchanging science information, moving away from solely relying on formal technical reports to targeted resource briefs, interactive media, and personal engagement. One approach is to build on the examples of successful communication across IMD; for example, listening sessions, collaboration clinics, data visualization, and to incorporate those into network activities, and to follow examples of successful communication products compiled by the IMD Communication Plan (DeBacker et al. 2016). Engaging park managers in field activities while IMD crews are in parks can be another effective way to promote dialogue and information exchange that will not happen easily through other means. A step further is to support IMD staff conducting formal or
25
Recommendations
informal details with park managers, and vice •versa, park staff working closely with network monitoring.
IMD provides an overview of science being collected; parks provide an overview of management issues of concern; both parties establish a dialogue that articulates specifically the roles and responsibilities, information needs, and identifies timelines. IMD develops tools to promote communication between networks and managers, including a library •of communication products and internal data visualization portals. Use the tactics outlined in the IMD Communication Plan and Resource Guide (DeBacker et al. 2016). As time allows, networks participate in park-based management meetings where science can support decision making, including, for example, Natural Resource Condition Assessments, State of the Park reports, and Resource Stewardship Strategies.
Management Decisions: Where the Foundation is Put into Action
Recommendation 7: IMD networks and parks share results from science integration into the decision-support process annually.
This recommendation can help to stimulate ideas to networks and parks for future science and management integration. This allows opportunities to learn from management decisions and the role science played into that decision as well as hold IMD and parks accountable for using science in the decision making process. In addition, specific examples that highlight the use of IMD science in support of park management will be valuable in demonstrating the importance of the role IMD can play in park management. IMD will recognize annually a range of successes of IMD science and park management both for improved decision making and understanding that emphasize the value of quality long-term monitoring science in protecting the resources of the NPS.
Several actions may be taken to implement this recommendation, including:
Annually there could be a month (e.g., November) dedicated to webinars on examples of the integration of science into decision making. Parks, IMD, and others could highlight when integration was successful and also when it was not. Others will be able to learn from these experiences in order to improve future integration of science and decision making.
Each Regional IMD Program Manager could compile highlights from their networks Annual AdministrativeReports illustrating successes and areas still needing work related to science integration into park management. These briefs should include a few points explaining why there was success as well as when there was not success. The program managers work together to synthesize across regions to synthesis reports bringing forward both examples that are similar and those that are unique in nature. IMD could provide these reports to a broader audience and highlight these successes during NRSS, Regional, Superintendent, and other larger resource management discussions and gatherings (see EPMT Annual Report as an example).
• Networks, parks, and other partners that demonstrated the highest level of science and management integration could be recognized annually by receiving an awared for demonstrating the integration of science into park management decision making and understanding. This recognition may be based on the foundation of a partnership that results in better informed decisions that protect park resources.
Recommendation 8: Include a science component to Fundamentals training.
Fundamentals training should include a component that introduces IMD and the science it produces. The general lack of awareness of the IMD among NPS employees is disconcerting; a discussion about the best available science should, at least, include a
26
Integration of Science and Park Management
thorough discussion of IMD. This orientation should focus on resources for how to useIMD information and tools available (see also DeBacker et al. 2016, Perkins et al. 2016).
For example, NPS policy is for parkmanagement decisions to be based, at least in part, on the best available science (NPS 2006). Therefore, a basic presentation that there is a science “arm” in NPS needs to be presented to new NPS employees. The presentationcan include an understanding of the role of science in park management and how science is applied in decision making (perhaps within an adaptive management context). Inclusion of at least a basic introduction to the principles of applying science to park decisions would be a first step to understand science-based park decision making.
Recommendation 9: Provide training in the principles of good decision making.
Training opportunities in the principles of good decision making and integrating science into resource management decisions (though not specific to any one process or tool) would improve the overall quality of how decision makers approach decisions, and illustrate how
science could be used more effectively (see also DeBacker et al. 2016). We believe there should be training specifically to increase science literacy for decision makers (such as superintendents).
For example, the NPS currently offers little in the way of training regarding how to identify reasonable alternatives or to assess those alternatives within the context of current policy. Training that examines and explains the application of science in the decision-making process (i.e., when to use science, how to use science, and assessing the quality of available science) is a valuable tool to network program managers as well as park resource specialists and decision makers. Ideally, training would address the following questions: What kinds of questions need science? How is science effectively applied to the management decision-making process? How do we facilitate a collaborative relationship between decision makers and scientists so that science is more effectively used in park resource management decisions? This would result in decision makers being comfortable asking questions of scientists and scientists having a better understanding of the decision-making process.
The NPS has an excellent corps of resource managers, but these managers
must be supported with the necessary funds and personnel, as well as with
training and professional development. NPS professionals, and especially
park superintendents, should be required to possess and maintain significant
scientific literacy that extends to an understanding of the strengths and
limitations of scientific findings, appropriate application of scientific research
to management and policy, and familiarity with key scientific concepts in
both biophysical and sociocultural disciplines.
Revisiting Leopold, p. 21
27
Literature Cited
Literature Cited Acker, S. A., J. R. Boetsh, M. Bivin, L. Busch, E. D. and J. C. Trexler. 2002. The
Whiteacker, C. Cole, and T. Phillippi. importance of monitoring in regional 2015. Recent tree mortality and ecosystem initiatives. Pages 1-23 in E. D. recruitment in mature and old-growth Busch and J. C. Trexler, eds. Monitoring forests in western Washington. Forest Ecosystems: Interdisciplinary approaches Ecology and Management 336:109-118. for evaluating ecoregional initiatives.
Island Press:Washington, D.C.Balph, D. F. and M. H. Balph. 1983. On
the psychology of watching birds: the Busch, D. E. and J. C. Trexler, eds. 2003. problem of observer-expectancy bias. Monitoring ecosystems: interdisciplinary Auk 100:755-757. approaches for evaluating ecoregional
initiatives. Washington, DC:Island Press.Baver, T. and B. Erdogan. 2015. An Introduction
to Organizational Behavior. Available Cochrane, A. 1972. Effectiveness and at: http://2012books.lardbucket.org/ efficiency: Random reflections on the pdfs/an-introduction-to-organizational- health service. Nuffield Provincial behavior-v1.1.pdf (accessed March 2016) Hospitals Trust, London.
Bennetts. R. E., J. E. Gross, K. Cahill, C. Cochrane Collaboration. 2015. About the McIntyre, B. B. Bingham, A. Hubbard, L. Cochrane Collaboration. Available at Cameron, and S. L Carter. 2007. Linking http://www.cochrane.org/ (accessed June monitoring to management and planning: 2015)Assessment points as a generalized approach. The George Wright Forum Cooney, R. 2006. The Precautionary Principle 24:59-17. in Biodiversity Conservation and Natural
Resource Management: An issues paper Bestelmeyer, B. T. 2006. Threshold concepts for policy-makers, researchers and
and their use in rangeland management practitioners IUCN, Gland, Switzerland and restoration: the good, the bad, and and Cambridge, UK.the insidious. Restoration Ecology 14:325-329. Crombie, I. K. and H. T. Davies. 2009. What
is meta-analysis? Hayward Medical Biggs, H. C. and K. H. Rogers. 2003. An adaptive Communications. Available at: http://
system to link science, monitoring, and www.medicine.ox.ac.uk/bandolier/management in practice. Pages 59-80 in J. painres/download/whatis/meta-an.pdf T. du Toit, K. H. Rogers, and H. C. Biggs, (accessed April 2015).eds., The Kruger experience: Ecology and management of savanna heterogeneity. DeBacker, M. D., S. Melena, A. L. Mims Washington, D.C.:Island Press. (editor), A. Wondrak Biel, T. Gostomski,
M. Nortrup,and M. Beer. 2016. Inventory Biggs, H., S. Ferreira, S. Freitag-Ronaldson. and Monitoring Division communication
R. Grant-Biggs. 2013. Taking stock after a strategy and resourceguide. Natural decade: Does the ‘thresholds of potential Resource Report NPS/IMD/NRR—concern’ concept need a socio-ecological 2016/XXX. National Park Service,Fort revamp? Koedoe 53(2):1-9. Collins, Colorado.
Bingham, B. B., R. E. Bennetts, and A. Dicks, L. V., J. Walsh, and W. J. Sutherland. Hubbard. 2007. Integrating science and 2014. Organising evidence for management: The road to Rico-Chico. environmental management decisions: a George Wright Forum 24(2):21-25.

28
Integration of Science and Park Management
‘4S’ hierarchy. Trends Ecological Evolution Huggett, A. J. 2005. The concept and 29:607-613. utility of ‘ecological thresholds’ in
biodiversity conservation. Biological du Toit, J. T., K. H. Rogers, and H. C. Biggs. Conservation 124:301-310. doi:10.1016/j.
eds 2003. The Kruger Experience: biocon.2005.01.037Ecology and Management of Savanna Heterogeneity. Island Press:Washington, Johnson, S. E., E. L. Mudrak, E. A. Beever, DC. S. Sanders, and D. M. Waller. 2008.
Comparing power among three sampling Fancy, S. G. and R. E. Bennetts. 2012. methods for monitoring forest vegetation.
Institutionalizing an effective long-term Canadian Journal of Forest Research monitoring program in the U.S. National 38(1):143-156, I0.1139/X07-121Park Service. Pages 481-497 in Gitzen et al. (editors). Design and Analysis of Long- Kurtz, J. C., L. E. Jackson, and W. S. Fisher. 2001. term Ecological Monitoring Studies. Strategies for evaluating indicators based Cambridge University Press. on guidelines from the Environmental
Protection Agency’s Office of Research Failing, L. and R. Gregory. 2003. Ten common and Development. Ecological Indicators
mistakes in designing biodiversity 1:49-60.indicators for forest policy. Journal of Environmental Management 68: 121-132. Landres, P., P. Morgan, and F. Swanson. 1999.
Overview of the use of natural variability Groffman, P. M., J. S. Baron, T. Blett, A. J. Gold, in managing ecological systems. Ecological
I. Goodman, L. H. Gunderson, B. M. Applications 9:1279-1288.Levinson, M. A. Palmer, H. W. Paerl, and G. D. Peterson. 2006. Ecological thresholds: Lee, K. N. 1993. Compass and gyroscope: The key to successful environmental Integrating science and politics for the management or an important concept environment. Island Press:Washington, with no practical application? Ecosystems DC.9:1-13.
Lindenmayer, D. B. and G. E. Likens. 2010. Gunderson, L. H. 2000. Ecological resilience- The science and application of ecological
theory to practice. Annual Review of monitoring. Biological Conservation Ecological Systems 31:421-39. 143:1317-28.
Gurevitch, J., P. Curtis, and M. H. Jones. 2001. MacMillan, D. C. and K. Marshall. 2006. Meta-analysis in ecology. Advances in The Delphi process–an expert-based Ecological Research 32:199-247. approach to ecological modelling in data-
poor environments. Animal Conservation Hellawell, J. M. 1991. Development of a 9: 11-19.
rationale for monitoring. Pages 1-14, in F. B. Goldsmith, ed., Monitoring for Manley, P. N., W. J. Zielinski, C. M. Stuart, Conservation and Ecology. Chapman and J. J. Keane, A. J. Lind, C. Brown, B. Hall. L. Plymale, and C. O. Napper. 2000.
Monitoring ecosystems in the Sierra Holling, C. S. 1978. Adaptive environmental Nevada: The conceptual model
assessment and management. John Wiley foundations. Environmental Monitoring and Sons, NY. and Assessment 64:139-152.
Holling, C. S. 1973. Resilience and stability Martin, T. G., M. A. Burgman, F. Fidler, P. of ecological systems. Annual Review of M. Kuhnert, S. Low-Choy, M. McBride, Ecological Systems 4:1-23 K. Mengersen. 2011. Soliciting expert

29
Literature Cited
knowledge in conservation science Report NPS/WASO/NRR—2016/XXX. Conservation Biology 26:29-38. National Park Service, Fort Collins,
Colorado. McLuhan, M. 1987. Letters of Marshall
McLuhan. Oxford University Press. Pullin, A. S. and T. M. Knight. 2003. Support for decision making in conservation
National Park Service (NPS). 2011. A Call to practice: an evidence-based approach. Action: Preparing for a Second Century of Journal of Nature Conservation 11:83-90. Stewardship and Engagement. National Park Service unpublished report. Pullin, A. S. and T. M. Knight. 2001.
Effectiveness in Conservation Practice: National Park Service (NPS). 2006. Pointers from Medicine and Public
Management Policies 2006. The Health. Conservation Biology 15:50-54.Department of the Interior, National Park Service. Pullin, A. S., T. M. Knight, D. A. Stone, and
K. Charman. 2004. Do conservation National Park System Advisory Board, managers use scientific evidence to
Science Committee. 2012. Revisiting support their decision making? Biological Leopold: Resource Stewardship in the Conservation 119:245-252.National Parks. National Park Service.
Radford, J. Q. and A. F. Bennett. 2004. National Park System Advisory Board, Thresholds in landscape parameters:
Science Committee. 2009. National Park Occurrence of the white-browed Service Science in the 21st Century: treecreeper Climacteris affinis in Victoria, Recommendations concerning future Australia. Biological Conservationdirections for science and scientific 117:375-391.resource management in the national parks. National Park Service:Washington, Runge, M. C., S. J. Converse, and J. E. DC. Lyons. 2011. Which uncertainty? Using
expert elicitation and expcetd value National Research Council (NRC). 1995. of information to design an adaptive
Review of EPA’s environmental program. Biological Conservationmonitoring and assessment program: 144:1214-1223.Overall evaluation. National Academy Press, Washington, D.C. SANParks - South African National Parks.
2015. Available at: http://www.sanparks.Nichols, J. D. and B. K. Williams. 2006. org/parks/kruger/conservation/scientific/
Monitoring for conservation. Trends in mission/tpc.php (accessed July 2015)Ecology and Evolution 21:668-673.
Soukup, M. 2007. Integrating science and Nilsson, J. and P. Grennfelt, eds. 1988. Critical management: Becoming who we thought
loads for sulphur and nitrogen. UNECE we were. George Wright Forum 24(2):26-Nordic Council Workshop Report, 29.Skokloster, Sweden, 19-24. Miljorapport 1988:15. Nordic Council of Ministers, Spellerberg, I. F. 1991. Monitoring ecological Copenhagen, 418 pp. change. Cambridge University Press,
Cambridge.Perkins, D. W., M. Bozek, M. MacCluskie,
T. Philippi, A. Ray, W. Route, and D. Stankey, G. H., D. N. Cole, R. C. Lucas, Thoma. 2016. Excellent science in the M. E. Petersen, and S. S. Frissell. 1985. National Park Service Inventory and The limits of acceptable change (LAC) Monitoring Division: Guiding principles system for wilderness planning. Gen. and recommendations. Natural Resource Tech. Rep. INT-176. Ogden, UT: U.S.

30
Integration of Science and Park Management
Department of Agriculture, Forest Walters, C. J. 1986. Adaptive management of Service, Intermountain Forest and Range renewable resources. MacMillan Publ. Experiment Station. 37 p. Co., New York, NY.
Suhr, J. 1999. The Choosing By Advantages Williams, B. K., R. C. Szaro, and C. D. Shapiro. Decision Making System. Westport, CT: 2007. Adaptive Management: The U.S. Quarum Books. Department of the Interior Technical
Guide. Adaptive Management Working Sutherland, W. J., A. S. Pullin, P. M. Dolman, Group, U.S. Department of the Interior,
and T. M. Knight. 2004. The need for Washington, DC.evidence-based conservation. Trends in Ecology and Evolution 19:305-308. Wintle, B. A., M. C. Runge, and S. A. Bekessy.
2010. Allocating monitoring effort in the U.S. Department of the Interior. 2008. face of unknown unknowns. Ecology
Adaptive Management, Department Letters 13:1325-1337.of the Interior, Departmental Manual, Environmental Quality Programs, Part Yoccoz, N. G., J. D. Nichols, and T. Boulinier. 522: Adaptive Management. Available 2001. Monitoring of biological diversity at: http://www.doi.gov/initiatives/ in space and time. Trends in Ecology and AdaptiveManagement/documents/ Evolution 16:446-453.DOImanual3786.pdf (accessed July 2015)

A-1
Appendix A: A Collaborative Framework Example
Appendix A: A Collaborative Framework ExampleMultiple NPS divisions and programs contribute to the overall mission of the agency to preserve unimpaired the natural and cultural resources and values of the national park system for future generations. The IMD, Natural Resource Science and Stewardship (NRSS), the Biological Resource Division’s (BRD) Exotic Plant Management Teams (EPMTs), and the Fire and Aviation Division (FAD) all work in and with parks to better assess and manage natural resources. Although each program may have its own programmatic goals, there is also considerable overlap in their goals and efforts (Figure A1). Traditionally these groups have worked independently, but working collaboratively offers the best opportunity to assess resource condition and use the best science possible to help manage our parks to be maintained in, or restored to, good condition.
The Benefits of a Collaborative Approach
One benefit of working collaboratively is increased efficiency where there is redundancy between individual efforts. As an example, the Southern Plains Fire Group and Southern Plains I&M Network were previously monitoring many of the same sites within parks, often with substantial overlap in the data collected. Consolidating these efforts into one crew achieved cost savings, reduced administrative overlap, and enabled a level of information sharing that seldom occurred prior to collaboration.
Beyond gains in efficiency, we believe that a collaborative approach substantially improves the quality of both the information provided to parks and, ultimately, park management. A collaborative approach applies multiple perspectives, experiences, and expertise working in concert to understand park resource issues rather than individual entities expressing independent perspectives and leaving parks to sort out the disparities among them. When varying perspectives and
experiences are presented together, it enables a much more engaging interaction that often leads to shifts in the thinking of all parties and a consensus that examines any given issue from a broader foundation.
A collaborative approach may include (1) identifying and defining potential issues, (2) expanding upon the broad desired conditions contained within General Management Plans to more measurable desired resource states, (3) discussing and implementing management solutions and treatments, (4) monitoring the effectiveness of those solutions and treatments, (5) interpreting and reporting the results of the efforts, and (6) providing parks with the best information possible in support of management decisions (Figure A2).
The Framework Components
Issues and Possible SolutionsTogether, partners identify natural resource management issues and potential solutions to those issues. In some cases, solutions may center on preventing the degradation of a potentially threatened resource, while in
Figure A1. The inventory and monitoring program, exotic plant program, fire program, and parks all contribute to, but overlap, in their efforts to meet the NPS mission.

A-2
Integration of Science and Park Management
other cases emphasis may be on restoring an already degraded resource.
Reference ConditionsReference conditions describe our best estimate of resource conditions to use as a reference point by which we evaluate the effectiveness of our resource management progress. One way to look at reference conditions is as a tentative, but measurable, desired condition.
MonitoringIt is all too common for agencies, including the NPS, to initiate management actions without any mechanism to determine if those actions achieved the desired outcome. Monitoring that incorporates some level of effectiveness monitoring in conjunction with the solutions (treatments) provide a way to determine if, and to what extent, the treatment had the desired effect.
ReportingReporting should compare the measured condition relative to reference conditions. This could be used to assess progress across both space and time, or among classes of resources (Figure A3).
Decision SupportWe recognize that the parks have the responsibility and accountability for resource management decisions, but a collaborative group of partners may be helpful to inform a park’s decision process through collective planning, science, and expertise. Directly engaging in face-to-face discussions and debate in light of available data provides valuable information to park decision makers.
Figure A2. A graphic representation of the collaborative
framework between parks of the
southern plains, the Southern Plains
Fire Group, the Southwest Exotic
Plant Management Team, and the
Southern Plains Network.
Figure A3. Reporting would show condition relative to reference conditions. This could be used to assess progress across space (left) or time (right).

A-3
Appendix B: The Realm of Research and Monitoring
Appendix B: The Realm of Research and MonitoringScience, as defined in this report, is the advancement of knowledge of the structure and behavior of the physical and natural world through systematic observation and experiment. It includes various forms of research and a range of research designs and methods, including monitoring.
In order to facilitate the integration of science and management, it is helpful to understand when science can be useful to management decisions and when it cannot. A common reason given for indecision is a lack of information (including scientifically derived information); however, science will not always be the most appropriate source of information to support decision making. When a decision maker needs to understand the status and trend of resources, learn why a resource is changing, determine if resource degradation is due to human causes or natural phenomenon, or resolve uncertainty about the ecological or environmental response to management, then well-designed science can help close those knowledge gaps. If indecision is a result of disagreement on what the goals or objectives should be, however, this is a value judgment for which science is of marginal use. In such circumstances, negotiation, rather than science, is the better path toward making management decisions (Lee 1993; Figure B1).
Our goal with this report is not to advocate that science have a larger role in every park resource management decision, but rather to recognize when science can best inform decisions and to facilitate appropriate use of science for those purposes. Facilitation will be achieved through understanding park needs and designing and communicating science in a way to address those needs.
Levels of Integration
Integrating science and park management decisions is a key component of the IMD (e.g., Bingham et al. 2007, Fancy and Bennetts 2012, Soukup 2007). There are a variety of
ways and levels to which science is integrated, Figure B1. A graphic representation of two opposing, but not mutually exclusive pathways from indecision to a decision based on whether the uncertainty is in the ecological response or the goals and objectives (adapted from Lee 1993).
depending on the individual needs of a park and the kinds of decisions to be made (Table B1). Science need not be integrated at the highest level for all management decisions. Here we focus on how to consider management needs when planning science and how to communicate the results of science in a way that is most useful to decision makers.
Research v. Monitoring
The difference between research and monitoring has long been the subject of debate. For example, one element that is often used to distinguish among research and monitoring is whether or not there is an experimental component (i.e., with an experimental rather than survey design; Table B2). One does not need to look very far, however, to find examples of descriptive, rather than experimental research. Similarly, some types of monitoring (e.g., effectiveness monitoring) may in fact have all of the elements of an experimental design. Others may argue that a key distinction is whether or not the focus of the science is on answering questions. Once again, much of research

A-4
Integration of Science and Park Management
currently being conducted has poorly defined questions, if they are defined at all; and some monitoring incorporates design-based surveys that are intended to answer specific questions through monitoring. Still others may argue that a key distinction is that monitoring entails repeated surveys over long time periods; again, repeated measure designs are quite common in long-term research (e.g., at long-term ecological research sites).
Although it is not uncommon for some individuals to cite what they believe to be distinctions between research and monitoring, these distinctions often get very blurry upon close examination. It is not our intention to resolve this debate, but rather to point out that regardless of whether one prefers to call our science research or monitoring, the ideas presented in this report intended to better connect science and management will apply. We subscribe to the approach taken by Busch and Trexler (2003:3) on this issue: Research and monitoring exist in a continuum of scientific endeavor.
Table B2. Examples of a range of research designs.
Degree of Control
Design Type DescriptionPerceived Realm of Research and Monitoring
HighControlled Experimental
Entails comparison of sampling (i.e., experimental) units that have been randomly assigned to treatments.
Realm of Research
Realm of Monitoring
Moderately High
Quasi-ExperimentalEntails comparison of sampling units that have not been randomly assigned to treatments (i.e., “natural” experiments).
Moderately Low
Relational SurveySurveys that examine the association (e.g., comparisons/correlation) among variables or groups.
Low Descriptive SurveySurveys that describe status or trend with no assessment of relationships among variables or groups.
Table B1. A simplified, hypothetical example of the levels of integration of I&M network vital signs monitoring (one form of science) and management decisions. Level of Integration
Scope of Vital Signs Application to Management Decisions
High
Low
Monitoring vital signs that are of direct management application. For example, forest regeneration in a park.
Explicit management is in place that relies heavily on the results of the vital sign. For example, a park that is managing deer populations to promote healthy regeneration and is using regeneration of seedlings collected as a vital sign.
Monitoring focused on vital signs that are of interest to current park management activities. For example, monitoring presence and abundance of invasive exotics plants across forest communities in a park.
Park managers are actively managing invasive plant communities, and while the vital sign is not measuring effectiveness of management actions, the monitoring does provide an overall assessment of the change in invasive plant species (presence, extent, and abundance) across the park.
Monitoring focused on a broad range of vital signs that provide information on ecosystem health. For example, monitoring dynamics of forest communities in a park.
Less direct application for specific park management, although there may be opportunities for application to broader policy decisions. For example, while forest dynamics is important in maintaining forest cover over the long term, active park management may not be in place.
A-5
Appendix B: The Realm of Research and Monitoring
Types of Monitoring
Most science conducted by the National Park Service falls into the realm of monitoring. There have been a multitude of ways that people have categorized monitoring, three general classes of monitoring seem to be commonly described in the context of natural resources (1) regulatory monitoring, (2) effectiveness monitoring, and (3) trend detection (Hellawell 1991, Spellerberg 1991), each of which are described in more detail below.
Regulatory monitoring focuses on compliance and adherence to regulatory statutes and standards. For the NPS, this type of monitoring would most likely be applied in the context of pollution standards such as water quality, air quality, noise, and other similar topics with identified standards.
Effectiveness monitoring focuses on describing the response or effectiveness of management actions (treatments). For example, some monitoring of fire effects or exotic plant treatment effects may fall into this category.
Trend-detection monitoring focuses onidentifying temporal changes in theenvironment, often for the purpose of early warning or impending concerns. Most vital signs monitoring falls within this class.
It is important to note that these three categories are not mutually exclusive, and this is not the only way to categorize monitoring. The I&M Program was developed within a conceptual framework of “vital signs” of ecosystem health and has been most closely aligned with the trend detection category of monitoring, although all three categories are used by NPS and each contributes to management decision making.
Targeted v. Surveillance Monitoring
Natural resource monitoring programs may also be characterized by their location along a continuum between two contrasting approaches: targeted vs. surveillance
monitoring (Nichols and Williams 2006, intle et al. 2010). This is similar to the passive/andated vs. question-driven monitoring
ichotomy described by Lindenmayer and ikens (2010), and closely parallels the
esearch vs. monitoring debate described bove. Whereas targeted monitoring is based n the definition of a priori hypotheses and ssociated conceptual models of how the argeted entity works, surveillance monitoring acks clearly stated a priori hypotheses and ssumes that more information about a ystem will be useful.
ecause targeted monitoring aims to iscriminate among competing hypotheses, it
s often viewed as the more efficient approach o understanding the mechanisms that drive bserved ecological patterns (Yoccoz et al. 001, Nichols and Williams 2006), particularly iven limited resources to fund monitoring rograms. The role of surveillance monitoring annot be discounted; as argued by Wintle t al. 2010, surveillance data have been used o corroborate emerging hypotheses and o detect “unknown unknowns.” Another radeoff between the two extremes is elated to scale. Surveillance monitoring is
ore often implemented at a coarse scale regional to national), leading to assessments f resource condition, but providing limited nderstanding of ecological mechanisms. In ontrast, targeted monitoring is finer scaled within park or region), often addressing nderlying mechanisms, but perhaps making
t more difficult to make extrapolations to arger scales (Lindenmayer and Likens 2010).
ome authors advocate for a mixed strategy pproach, that is, combining surveillance onitoring with short-term targeted programs
o address specific management questions. As indenmayer and Likens (2010:1324) point ut, “a long-term monitoring program can be sed as a framework around which shorter-
erm projects can be conducted.”
WmdLraoatlas
Bdito2gpcetttrm(ouc(uil
SamtLout
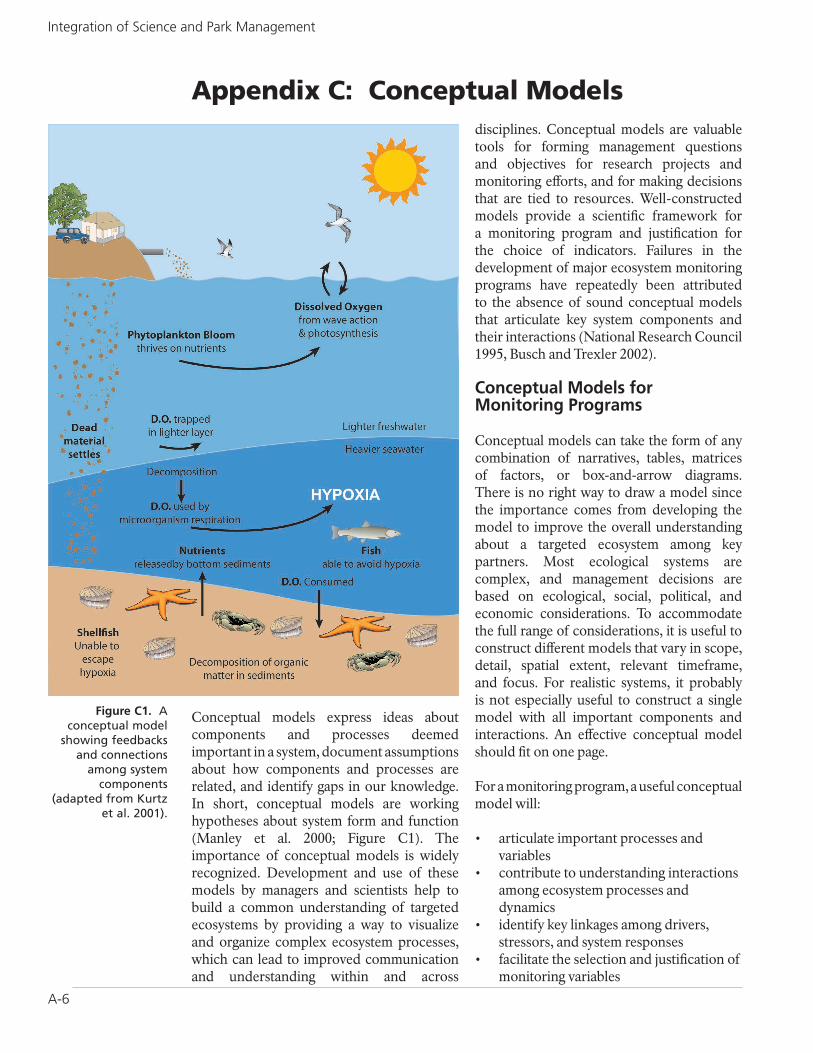
A-6
Integration of Science and Park Management
Appendix C: Conceptual Models
Conceptual models express ideas about components and processes deemedimportant in a system, document assumptions about how components and processes are related, and identify gaps in our knowledge. In short, conceptual models are working hypotheses about system form and function (Manley et al. 2000; Figure C1). The importance of conceptual models is widely recognized. Development and use of these models by managers and scientists help to build a common understanding of targeted ecosystems by providing a way to visualize and organize complex ecosystem processes, which can lead to improved communication and understanding within and across
disciplines. Conceptual models are valuable tools for forming management questions and objectives for research projects and monitoring efforts, and for making decisions that are tied to resources. Well-constructed models provide a scientific framework for a monitoring program and justification for the choice of indicators. Failures in the development of major ecosystem monitoring programs have repeatedly been attributed to the absence of sound conceptual models that articulate key system components and their interactions (National Research Council 1995, Busch and Trexler 2002).
Conceptual Models for Monitoring Programs
Conceptual models can take the form of any combination of narratives, tables, matrices of factors, or box-and-arrow diagrams. There is no right way to draw a model since the importance comes from developing the model to improve the overall understanding about a targeted ecosystem among key partners. Most ecological systems are complex, and management decisions are based on ecological, social, political, and economic considerations. To accommodate the full range of considerations, it is useful to construct different models that vary in scope, detail, spatial extent, relevant timeframe, and focus. For realistic systems, it probably is not especially useful to construct a single model with all important components and interactions. An effective conceptual model should fit on one page.
For a monitoring program, a useful conceptual model will:
• articulate important processes and variables
• contribute to understanding interactions among ecosystem processes and dynamics
• identify key linkages among drivers, stressors, and system responses
• facilitate the selection and justification of monitoring variables
Figure C1. A conceptual model
showing feedbacks and connections
among system components
(adapted from Kurtz et al. 2001).

A-7
Appendix C: Conceptual Models
• facilitate evaluation of data from the monitoring program
• clearly communicate dynamic processes to technical and non-technical audiences
Development of conceptual models should be viewed as a work in progress, with updates to be made as information and understanding improves through time.
Types of Conceptual Models
There are two types of conceptual models commonly used: control models and stressor models.
A control model represents the key processes, interactions, and feedbacks. These are the most-often-developed conceptual models that are used to explain a targeted ecosystem with its components and interactions. Figure E1 is an example of a control model.
Stressor models are designed to articulate the relationships between stressors, ecosystem components, effects, and, sometimes,indicators (Figure C2). Stressor models normally do not represent feedbacks. The intent of a stressor model is to illustrate sources of stress and the ecological responses of the system attributes of interest.
It may be necessary or useful to develop both kinds of models. Note that Figures C1 and
C2 are of the same system. Control models present a more complete and accurate picture of system components and their interactions. Stressor models are likely to more clearly communicate the direct linkages between stressors, ecological responses, and indicators.
Steps in Constructing Conceptual Models
A systematic approach that leads to a set of conceptual models will include the following tasks. Although the steps appear in a sequential list, it will be necessary to address some of the task goals at the same time.
• Clearly state the goals of the conceptual models.
• Identify bounds of the system of interest.• Identify key model components,
subsystems, and interactions.• Develop control models of key systems
and subsystems.• Identify natural and anthropogenic
stressors.• Describe relationships among stressors,
ecological factors, and responses.• Articulate key questions or alternative
approaches.• Identify inclusive list of indicators
(prioritize indicators).• Review, revise, and refine models.
Figure C2. A stressor model (modified from Kurtz et al. 2001), which communicates the links between stressors and effects.
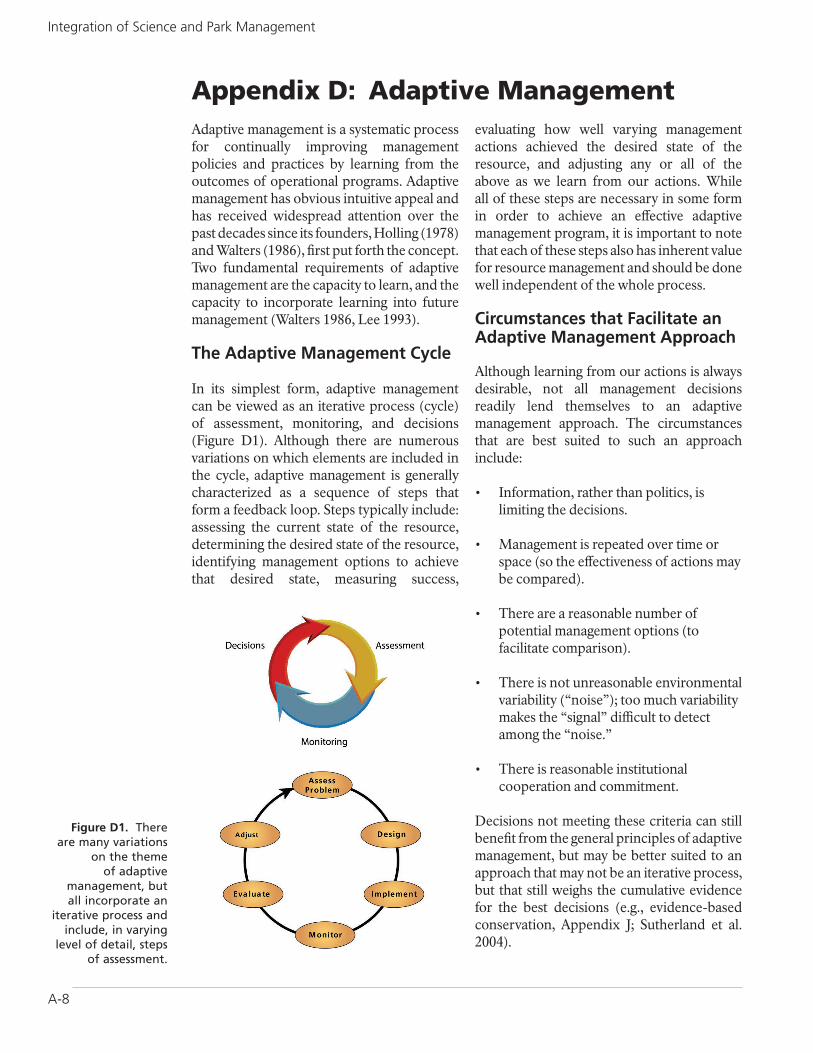
A-8
Integration of Science and Park Management
Appendix D: Adaptive ManagementAdaptive management is a systematic process for continually improving managementpolicies and practices by learning from the outcomes of operational programs. Adaptive management has obvious intuitive appeal and has received widespread attention over the past decades since its founders, Holling (1978) and Walters (1986), first put forth the concept. Two fundamental requirements of adaptive management are the capacity to learn, and the capacity to incorporate learning into future management (Walters 1986, Lee 1993).
The Adaptive Management Cycle
In its simplest form, adaptive management can be viewed as an iterative process (cycle) of assessment, monitoring, and decisions (Figure D1). Although there are numerous variations on which elements are included in the cycle, adaptive management is generally characterized as a sequence of steps that form a feedback loop. Steps typically include: assessing the current state of the resource, determining the desired state of the resource, identifying management options to achieve that desired state, measuring success,
evaluating how well varying management actions achieved the desired state of the resource, and adjusting any or all of the above as we learn from our actions. While all of these steps are necessary in some form in order to achieve an effective adaptive management program, it is important to note that each of these steps also has inherent value for resource management and should be done well independent of the whole process.
Circumstances that Facilitate an Adaptive Management Approach
Although learning from our actions is always desirable, not all management decisions readily lend themselves to an adaptive management approach. The circumstances that are best suited to such an approach include:
• Information, rather than politics, is limiting the decisions.
• Management is repeated over time or space (so the effectiveness of actions may be compared).
• There are a reasonable number of potential management options (to facilitate comparison).
• There is not unreasonable environmental variability (“noise”); too much variability makes the “signal” difficult to detect among the “noise.”
• There is reasonable institutional cooperation and commitment.
Decisions not meeting these criteria can still benefit from the general principles of adaptive management, but may be better suited to an approach that may not be an iterative process, but that still weighs the cumulative evidence for the best decisions (e.g., evidence-based conservation, Appendix J; Sutherland et al. 2004).
Figure D1. There are many variations
on the theme of adaptive
management, but all incorporate an
iterative process and include, in varying
level of detail, steps of assessment.

A-9
Appendix D: Adaptive Management
Because adaptive management is an iterative process, it is most appropriate for decisions that are repeated over time. The NPS mission of preserving natural and cultural resources unimpaired for future generations, isfundamentally different in many respects than many other land management agencies whose missions include “enhancing” wildlife and their habitat (U.S. Fish and Wildlife Service) or sustaining productivity (U.S. Forest Service and Bureau of Land Management); missions that may require more repeated active management. In contrast, many, but certainly not all, decisions in the NPS (new campground or visitor center, road closures, etc.) are not repeated over time or are repeated too infrequently to effectively use such an iterative process. Management within NPS that does entail repeated management actions, often with considerable uncertainty, include such things as fire and exotic plant management. Similarly, effectiveness monitoring is aligned with adaptive management more than long-term monitoring of ecosystem health.
Explicit Incorporation of Learning
Traditional management has no inherent requirement to learn or to adapt. In fact, traditional management often emphasizes the way things have been done in the past as a reason to continue to do them in the future. Because adaptive management explicitlyincorporates learning, it is perhaps best applied in cases when there is considerable uncertainty about which management actions
best achieve the desired outcome(s), especially when management is anticipated to be necessary and repeated over a long timeframe. The value of explicitly incorporating learning as an objective can easily outweigh the cost (Figure D2).
A Few Important Resources
Department of the Interior Adaptive Management Working Group, h t t p : / / w w w. d o i . g o v / i n i t i a t i v e s /AdaptiveManagement/
South African Parks (SANParks) experience at Kruger National Park (Toit et al. 2003) and the South African journal Koedoe (Biggs et al. 2013): http://www.koedoe.co.za/index.php/koedoe/issue/view/82
Figure D2. The value of learning increases substantially when there is high uncertainty about management responses and management is expected to be repeated over long timeframes.

A-10
Integration of Science and Park Management
Appendix E: Thresholds and Assessment PointsThresholds
The general idea of thresholds is as a point or zone where an abrupt change in a system occurs. Depending on how the concept is applied, such change can affect the physical state, ecological state, or behavior of the system. The concept of thresholds has existed within the realm of science for centuries. For example, during the 1700s, John Dalton described the changing states of matter for water in terms of temperature, wind speed, surface roughness, and vapor pressure (Huggett 2005; Figure E1).
More recently, the idea of ecological thresholds as transitions between states has evolved, and has been defined as points at which an abrupt change occurs in the condition or functioning of an ecosystem (Radford and Bennett 2004) from one state to another. This concept emerged from the idea that ecosystems often exhibit multiple “stable” states (Groffman et al. 2006) on either side of a threshold. Common examples of ecological thresholds include points where changes in vegetation communities occur, such as a grassland reaching a threshold and transitioning to a shrubland (Figure E2); or population dynamics thresholds, such as the idea of minimum viable populations that represents the theoretical limits (threshold) of population size that can exist without facing extinction from natural disasters or demographic, environmental, or genetic stochasticity.
Types of ThresholdsThere is a wide variety of terms and concepts that have been used to express types of thresholds, a few of which are described below (Table E1), but one commonality is that they all can be expressed as a measurable state or condition that helps to define the window of acceptable conditions, and therefore help to link science and management.
Figure E1. Changing states of matter as a function of temperature represents a threshold in the form of an abrupt physical change in the system.
Figure E2. Ecological thresholds are often illustrated by a ball-and-valley diagram
representing the tendency to stay or
return to a given ecological state or
condition.

A-11
Appendix E: Thresholds and Assessment Points
The Importance of Thresholds for the Integration of Science and ManagementProbably the most obvious implication of thresholds for management is the potentially high costs and consequences of crossing them. Once a threshold is crossed, it may limit future management options, force policy choices, or be ecologically irreversible (Groffman et al. 2006).
In the context of management, the concern over crossing an ecological threshold is not only whether or not the system undergoes an abrupt change, but also how difficult it would
be to return to the previous state, if that is the desired condition. State and transition models illustrate the concepts of stability and resilience (Holling 1973, Gunderson 2000) and help us to understand how resistant systems might be and how difficult it would be (in terms of time and energy) to move from one stable state to another or to return once a shift has occurred (Figure E3). State and transition models may help with planning by identifying the stages (states) one might predict alternative pathways (Bestelmeyer 2006).
Figure E3. Ball and valley diagrams help to illustrate differences in the stability and resilience of ecological states.
Table E1. Commonly used concepts that describe, either objectively or subjectively, a state, condition, or sometimes a process that a resource manager wishes to avoid or to maintain (adapted from Bennetts et al. 2007).
Concept Concept Description
Ecological thresholdsA point or zone in which abrupt change occurs in some ecosystem condition (e.g., a state, pattern, or process (Groffman et al. 2006).
Critical load
The quantitative estimate of an exposure to one or more pollutants below which significant harmful effects on specified sensitive elements of the environment do not occur according to present knowledge (Nilsson and Grennfelt 1988).
Policy or regulatory standardA benchmark of acceptable limits typically set by an agency that represents acceptable standards that may be enforced by law or policy.
Management thresholds or Trigger Points
A point or zone that triggers management action within a given context. The key distinction between ecological and management thresholds is whether it is an ecosystem that undergoes change (ecological thresholds), or the management of that ecosystem (management thresholds) that undergoes change when a threshold is crossed.
Thresholds of potential concernA set of operational goals that together define the spatiotemporal heterogeneity conditions for which the Kruger ecosystem is managed (Biggs and Rogers 2003).
Limits of Acceptable Change
The variation that is considered acceptable in a particular component or process of the ecological character of the system of interest, without indicating change in ecological character that may lead to a reduction or loss of the criteria (Stankey et al. 1985).
Range of natural variability
The ecological conditions, and the spatial and temporal variation in those conditions, that are relatively unaffected by people, within a period of time and geographical area appropriate to an expressed goal (Landres et al. 1999).

A-12
Integration of Science and Park Management
Thresholds can also help parks to identify limits that they may want to reach, avoid, or maintain. For example, limits of acceptable change may be used to represent the boundaries of a desired condition for the park. This can provide direction and be used as a benchmark for where the current condition is and where it needs to go.
Other thresholds may define legal or policy standards. For example, water or air quality standards may define a legal acceptable condition for state waterways or air quality or the limits for particular pollutants.
Assessment Points
Assessment points represent preselected points along a continuum of resource-indicator values where scientists and managers have together agreed that they want to assess the status or trend of a resource relative to program goals, natural variation, or potential concerns (Figure E4). These points provide an opportunity to consider a wide variety of information about the desirability, acceptability and risks imposed by the status and trend of the resource(s) in question at that point and to further consider potential management options. As such, assessment points provide a means of detecting conditions that may warrant management action with sufficient lead time to enable managers to identify and implement options that may halt or reverse an undesirable trajectory before significant damage occurs.
The NPS developed assessment points during a series of workshops focused on the integration of science and management as a
way to help overcome perceived challenges to the widespread use of threshold concepts and to apply these concepts to management planning and decision-making processes. Assessment points can function in tandem with other threshold concepts or be used independently of these other ideas. They were adapted from the idea of Thresholds of Potential Concern developed for South African Parks (Biggs and Rogers 2003)(described in greater detail below) and are analogous to the idea of management thresholds, which trigger a management action upon reaching a specified state or condition. However, rather than triggering a specific management action, as these other approaches do, assessment points are more of a “check in” to consider what actions may, or may not, be warranted. This allows for greater flexibility to consider a wide range of options, including no action.
Assessment Points as Part of an Adaptive ProcessAssessment points are part of an adaptive process of repeated evaluation that enables adjustments to both our understanding of potential risks and actions. An assessment would typically consider such questions as:
• Is the trajectory headed toward a threshold or standard?
• How much time do we anticipate it might take to reach a point of concern?
• Are we at risk of crossing an ecological threshold or legal standard?
• What actions might we take to slow, halt, or reverse an undesirable trajectory?
Figure E4. Assessment points
represent pre-selected points
along a continuum of resource values
where scientists and managers
have agreed to assess the status or trend relative
to program goals, natural variation, or potential concerns.
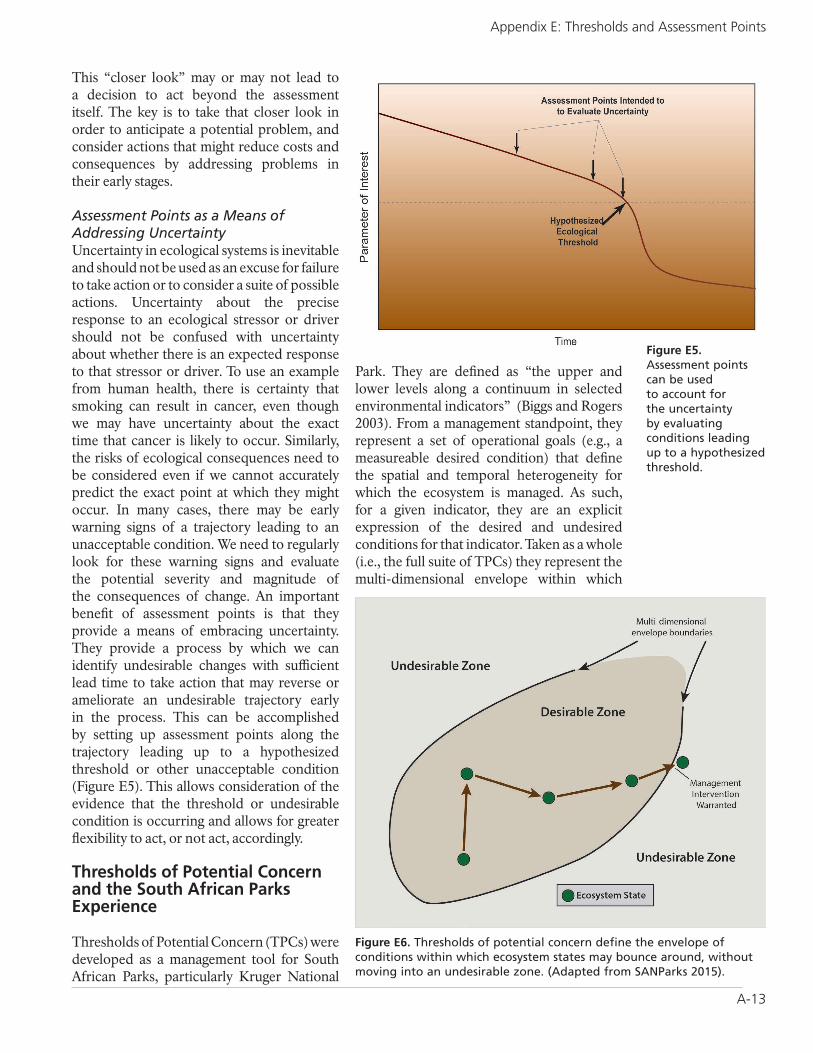
A-13
Appendix E: Thresholds and Assessment Points
This “closer look” may or may not lead to a decision to act beyond the assessment itself. The key is to take that closer look in order to anticipate a potential problem, and consider actions that might reduce costs and consequences by addressing problems in their early stages.
Assessment Points as a Means of Addressing UncertaintyUncertainty in ecological systems is inevitable and should not be used as an excuse for failure to take action or to consider a suite of possible actions. Uncertainty about the precise response to an ecological stressor or driver should not be confused with uncertainty about whether there is an expected response to that stressor or driver. To use an example from human health, there is certainty that smoking can result in cancer, even though we may have uncertainty about the exact time that cancer is likely to occur. Similarly, the risks of ecological consequences need to be considered even if we cannot accurately predict the exact point at which they might occur. In many cases, there may be early warning signs of a trajectory leading to an unacceptable condition. We need to regularly look for these warning signs and evaluate the potential severity and magnitude of the consequences of change. An important benefit of assessment points is that they provide a means of embracing uncertainty. They provide a process by which we can identify undesirable changes with sufficient lead time to take action that may reverse or ameliorate an undesirable trajectory early in the process. This can be accomplished by setting up assessment points along the trajectory leading up to a hypothesized threshold or other unacceptable condition (Figure E5). This allows consideration of the evidence that the threshold or undesirable condition is occurring and allows for greater flexibility to act, or not act, accordingly.
Thresholds of Potential Concern and the South African Parks Experience
Thresholds of Potential Concern (TPCs) were developed as a management tool for South African Parks, particularly Kruger National
Park. They are defined as “the upper and lower levels along a continuum in selected environmental indicators” (Biggs and Rogers 2003). From a management standpoint, they represent a set of operational goals (e.g., a measureable desired condition) that define the spatial and temporal heterogeneity for which the ecosystem is managed. As such, for a given indicator, they are an explicit expression of the desired and undesired conditions for that indicator. Taken as a whole (i.e., the full suite of TPCs) they represent the multi-dimensional envelope within which
Figure E5. Assessment points can be used to account for the uncertainty by evaluating conditions leading up to a hypothesized threshold.
Figure E6. Thresholds of potential concern define the envelope of conditions within which ecosystem states may bounce around, without moving into an undesirable zone. (Adapted from SANParks 2015).

A-14
Integration of Science and Park Management
ecosystem variation is deemed acceptable (Figure E6; Biggs and Rogers 2003).
After 10 years of implementation, Biggs et al. (2013) recently examined their application of Thresholds of Potential Concern. The concept remains viable and continues to be an integral and workable component to their strategic adaptive management program, but has presented some challenges for some of their TPCs. In particular, they recognized three challenges: (1) uncertainty about whether and where real thresholds exist, (2) social preferences and criteria, as opposed to what were seen as objective biophysical variables only, and (3) whether to adjust TPCs to allow for variations in societal behavior.
The issue of uncertainty about ecological thresholds is deeply rooted in whether or not
park management tends to be risk tolerant or risk averse (Biggs et al. 2013). High risk aversion (low tolerance for risk) often leads to stalling on making a decision until more evidence is available, which in many cases may be a long time in coming, if at all. Adaptive management facilitates moving forward in the face of uncertainty by explicit incorporation of learning (i.e., “more evidence”) while making decisions based on the best available information. This is not to say that when risk is high, that moving forward should be without caution (Cooney 2006) and that a well-considered “no action now” decision may be warranted (Biggs et al. 2013). It is this high uncertainty and the need for flexibility in choosing not to act at a given point that led to the development of assessment points described above (Bennetts et al. 2007).
The latter two challenges both reflect the role of social values in defining and using Thresholds of Potential Concern. In many cases societal values can have a dramatic influence on how parks are managed. In the case of South African Parks, it may be whether to introduce the “big 5” (elephants, rhinos, buffalo, lions, and leopards) into smaller parks where they may not currently be present (Biggs et al. 2013). Closer to home, it may be such things as snowmobile use in Yellowstone National Park. This issue really reflects the well-known fact that park decisions are not made on ecological science alone. For SANParks, they have concluded that the application of TPCs can, in many cases, be improved by shifting away from their development in a purely ecological context toward an approach that embraces a more socio-ecological view (Biggs et al. 2013). How such an approach will play out in the NPS perhaps remains to be seen.
The South African National Parks ExperienceSouth African Parks (SANParks 2015) have been at the forefront of applying both threshold concepts as well as adaptive management. Scientists work hand in hand with park managers in developing and applying solutions for managing some of the most complex and visited parks in the world. The Thresholds of Potential Concern, described here, are just one part of a Strategic Adaptive Management (SAM) framework used by SANParks. Readers are highly encouraged to explore the South African experience. Two excellent sources to accomplish this is a book on the experience at Kruger NP (du Toit et al. 2003) that describes the initial framework and planning for their current efforts. A more recent special edition of the South African journal, Koedoe (Biggs et al. 2013), is devoted to this framework and describes the history, lessons learned after ten years of implementation, and the resulting adaptations to their program that has resulted. The entire issue is available online at: http://www.koedoe.co.za/index.php/koedoe/issue/view/82
A-15
Appendix F: Science Communication Examples and Best Practices
Appendix F: Science Communication Examples and Best PracticesIn Module 3, we discuss approaches to delivering science information to IMD audiences, primarily park resource specialists, division chiefs, and superintendents. Here, we expand our discussion of the tools presented in that module and provide examples to illustrate how these tools can be used to successfully communicate IMD science to different audiences. We also evaluate what makes these examples good models to follow. We realize that there are many other products not included; these are just some examples. More information on communications related to IMD can be found in the Communications Plan (DeBacker et. al. 2016)
Listening Sessions
Listening sessions are active discussions between IMD, park staff, and other stakeholders, as appropriate. The crucial difference between listening sessions and the “results revues” or “road-show” presentations currently used by some networks is that they emphasize two-way communication; this is in contrast to the typical one-way information delivery that is common to presentation-focused meetings. Listening sessions create an opportunity for IMD and park staff to jointly evaluate results of ongoing monitoring, determine the most effective way to deliver science products for management purposes, and identify additional opportunities for IMD science to inform management decisions (see discussions in Module 3).
To encourage a productive and efficient conversation, IMD and park staff might consider questions related to natural resource issues and IMD products prior to listening sessions. The focal questions will vary among networks, but might include:
• What are the major natural resource related issues that the park is currently dealing with? What issues do you foresee becoming important in the next 5 years?
• Which IMD tools have been most helpful to date? What improvements would you suggest?
• What portions of the IMD data are most relevant to you right now? How can they help you with your management decisions?
• Is there additional assistance that IMD can provide to your park if time allows?
For example:
• The Mid-Atlantic Network’s (MIDN) Technical Advisory Committee is primarily composed of the network’s park natural resource managers. Meetings are held once a year and focus on MIDN monitoring activity updates. Recently, time has been allocated for resource managers, who seldom meet in person, to share the latest issues from their parks. This has been a very valuable opportunity for the network to learn about the challenges managers face and to provide advice and seek further opportunities to collaborate with and support the network parks. A more structured approach to these discussions is being developed for future meetings.
• We like: a listening session implies not just delivery of IMD information, but also an opportunity to hear from IMD’s primary audience on challenges and opportunities for collaboration. By incorporating visualization and other data exploration tools into these sessions, it may be possible to better refine IMD data delivery to parks in a format that is most useful to their most immediate needs.
• To consider: listening sessions will likely present a shift in how IMD and parks have communicated in the past, and use of facilitators initially may

A-16
Integration of Science and Park Management
help to promote more of a two-way communication.
• When to use: As often as possible but could be a rotation panel of visits to parks over multiple years.
Data Visualization
Web-based tools that allow users to create custom-made graphics (e.g., maps, box-plots, line-graphs) based on IMD network data are one approach to visualizing data. They allow park staff and other IMD audiences to access network data in real time and generate data summaries that are appropriate for a variety of uses (e.g., compliance, planning, and interpretation).
• The National Capital Region Network (NCRN) has produced data visualization tools for its forest health (http://irmadev.nps.gov/r-reports/NCRN/ForestVeg/) and water quality data (http://irmadev.nps.gov/r-reports/NCRN/Water/). The underlying infrastructure for these visualization tools is based on R, an open-source language that many network staff are increasingly familiar with. Maintaining an open-source, collaborative approach means that as individual networks develop new analyses, these will benefit the larger IMD community as a whole.
• Following the prototype developed by NCRN, an IMD working group composed of multiple networks across the country in collaboration with staff at the IMD Central Office in Fort Collins, are developing additional visualization tools. Although the visualization tool is still at an early development stage, a prototype is currently available for water quality monitoring data (http://imtest/im/reports/plots/SiteInfo/water_quality/characteristics_and_plots/).
• Climate data gathered from multiple sources (USGS gauging stations, NOAA weather stations, Remote automated weather stations [RAWS]) are provided in a vizualization tool to multiple networks
and parks through climateanalyzer.org. While networks do not collect these data, the networks identified climate as a vital sign. This vizualization tool provides a way to clearly present multiple forms of resourced climate data.
We like: Interactive web portals that summarize data provide much more flexibility than a static report. Users can be park and network staff as well as the broader public.
To consider: Online interpretation is limited, and while the underlying data may be sound, there is no control on how the resulting graphics are used and interpreted. This approach should not replace intermittent reporting (technical reports, resource briefs, and peer-reviewed publications).
When to use: Ideal for data exploration, especially during listening-sessions between network and park staff.
Dynamic approaches to reporting through the use of interactive maps in Adobe Acrobat files provide an alternate method for data and information delivery. These files allow the user to directly interact with the embedded map, turning layers on and off to better visualize the underlying data.
• The Heartland Network monitors whitetail deer at three parks annually. In 2009, reporting shifted from NPS publication series to interactive maps distributed as a PDF (see example from Pea Ridge National Military Park, Arkansas, https://sites.google.com/a/nps.gov/science-integration-workgroup/home/communication-examples/heartlandnetworkinteractive reportfordeermonitoring/PERI_Deer_2013_m.pdf). In addition to distributing monitoring results as an interactive map file, an instructional Read Me file was developed and distributed to assist navigation and exploration of the interactive file. The switch to this type of reporting was well received by the parks and serves as starting point to discussing changes in deer abundance with park staff.

A-17
Appendix F: Science Communication Examples and Best Practices
We like: the acrobat PDF format is easily accessible and transportable; the files and visualization can be used in the field on tablet or laptop computers.
To consider: Interpretation is limited and does not replace other reporting mechanisms.
When to use: Ideal for data exploration; especially useful in the field.
Technical Reports
These are publications in the IMD report series, including Natural Resource Reports and Natural Resource Data Series Reports (http://www.nature.nps.gov/publications/nrpm/). Technical Reports provide sometimes lengthy analyses and interpretation of status and trends of vital signs and are often inappropriate for publication in other formats (e.g., resource briefs and peer-reviewed publications, discussed below) due to their length.
• There are many good examples of technical reports posted to the IMD and networks web pages. As an example, the Mid-Atlantic Network produces annual weather data summaries for network parks (e.g., https://irma.nps.gov/App/Reference/Profile/2195875). A summary of the report is also prepared as a resource brief (see below).
Technical reports can vary substantially in their content; they can be concise summaries of a year’s monitoring at an individual park or lengthy analyses of long-term trends across multiple parks.
• The Heartland Network volunteer bird monitoring program report provides concise highlights of volunteer accomplishments, species lists, and a map that displays hot spots or cool spots of breeding bird observations across the selected park (https://irma.nps.gov/App/Reference/Profile/2198738).
We like: technical reports are the core approach to IMD information delivery. Because there are not restrictions on content,
technical reports can vary in length and content.
To consider: lengthy annual data summaries can be time consuming to prepare. Formatting and publication compliance requirements can be onerous. Intended audience may not have the time to read multiple lengthy reports. Because they are static, the information presented may not serve future management needs, requiring additional analyses in the future.
When to use: documenting progress of IMD monitoring is an important step to finalizing data collection, QA/QC, and analysis. While important, technical reports should not be the sole reporting mechanism for a network.
Resource Briefs
These provide concise, visually appealing, informative summaries of network findings. They may be linked with longer technical reports, although some networks produce briefs as stand-alone documents. Multiple formats for resource briefs are available. Examples of the classic two-page brief include:
• Mid-Atlantic Network, Weather and Climate Resource Brief: Fredericksburg and Spotsylvania National Military Park 2012, https://irma.nps.gov/App/Reference/Profile/2196012
We like: an appealing layout with boxes that provide the background information on the protocol, why it is important, and the management applications. The main body provides the status for a particular year. This model can stand alone having all the information needed to provide background on the protocol.
To consider: Much of the same information is repeated each year, limiting the space available for status and trends description for a particular year.
When to use: when a resource brief needs to be a standalone document, providing the

A-18
Integration of Science and Park Management
background information on the underlying protocol.
• Greater Yellowstone Network, Changing Flows in the Bighorn River: A Summary of Water Years 1930 to 2013, https://irma.nps.gov/App/Reference/Profile/2210622.
We like: Quick facts section provides a good summary of the content with management applications. Ample space for documenting analyses and interpretation.
To consider: This resource brief does not stand alone, and a reader would need to turn elsewhere for more information on the protocol and contacts.
When to use: when details of protocol are not needed.
In contrast, a three- to four-page brief allows for a more extensive elaboration on IMD findings.
• Arctic Network, Bering Land Bridge Winter 2013-2014 Weather Summary: https://irma.nps.gov/App/Reference/Profile/2194256.
We like: the longer format provides a greater opportunity to display graphics and tables;
To consider: This resource brief does not stand alone, and a reader would need to turn elsewhere for more information on the protocol and contacts.
When to use: when details of protocol are not needed.
Newsletters
Newsletters are a flexible format for sharing information with IMD audiences. Many networks produce newsletters, which vary in frequency, length, and intended audience. These may be distributed as print or digital media (e.g., email newsletter, pdf newsletter posted to google sites, etc).
• Northeast Temperate Network, The Temperate Times: https://irma.nps.gov/App/Reference/Profile/2220710, or Sonoran Desert Network, Heliograph: http://science.nature.nps.gov/im /units/sodn/assets/docs/Heliograph/Heliograph_4(2).pdf
We like: informal format for sharing timely information; particularly good for sharing field schedules and logistics, and for alerting a wide audience to new IMD projects and products.
To consider: When to use: on a recurring basis to update IMD audiences of I&M activities.
Peer-reviewed Publications
Peer-reviewed journal publications build scientific credibility, strengthen management decisions and actions taken using IMD data, and promote IMD science to the broader scientific community. Furthermore, better visibility in the scientific community may result in opportunities for collaboration with research institutions, which can expand the application of IMD science.
• Peer-reviewed publications in the primary literature can vary from those that address both ecological (e.g., Acker et al. 2015, https://irma.nps.gov/App/Reference/Profile/2217437) and statistical questions (e.g, Johnson et al. 2008, https://irma.nps.gov/App/Reference/Profile/2196534; Miller and Mitchell 2014, https://irma.nps.gov/App/Reference/Profile/2216380).
We like: provides higher visibility to science conducted by IMD and ensures that products are available to the wider scientific community.
To consider: while park managers like to know the publications are out there, this will not be the primary source for decision makers. Resource briefs that summarize the results and implications should be prepared for managers.

A-19
Appendix F: Science Communication Examples and Best Practices
When to use: all IMD protocols should be producing peer-reviewed publications in the primary literature.
Presentations at Scientific Conferences
Similar to peer-reviewed journal publications, presentations at scientific conferences build scientific credibility and introduce IMD science to a broader audience.
• A search of the Ecological Society of America abstracts from the 2014 meeting (http://eco.confex.com/eco/2014/webprogram/start.html) provided a list of 15 papers or posters presented by NPS staff or collaborators on monitoring conducted in NPS units.
We like: as with peer-reviewed publications, presentations at scientific conferences increased the visibility of science conducted by IMD. Conferences also afford the opportunity to address questions and comments on the monitoring conducted by NPS staff and collaborators.
To consider: decision makers and park managers are unlikely to attend these meetings, but it is worth ensuring they are aware that IMD scientists are presenting at such conferences; including a note in the network newsletter would be a good way to report on staff participation at these meetings.
When to use: all IMD protocol leads should be afforded the opportunity to present their results at scientific conferences.
Technical Support
Networks have staff with technical expertise that may not be represented at some parks. Network staff can provide assistance in developing monitoring protocols, funding proposals, and management responses, as well as a variety of other topics.
• Mid-Atlantic Network staff participated on the deer management science team at Valley Forge NHP; NPS. 2009.
White-tailed deer management plan/environmental impact statement. National Park Service, Valley Forge National Historical Park, PA. Participation ensured that forest vegetation protocol results were tied to evaluating success of deer management.
We like: IMD staff constitute a large portion of the scientific capacity of the NPS, and hence can contribute to a variety of additional tasks and support to parks beyond their primary duties.
To consider: resources are limited and IMD staff have to focus on their primary duties; however, in order to improve IMD’s ability to integrate science into management will require taking on tasks that will help broaden its perspective on park management and decision making.
When to use: only when IMD staff primary duties are being fulfilled can staff engage in additional support. All parks will benefit from interaction with IMD staff.
Social Media
Many I&M networks now maintain accounts on social media platforms, including Facebook and Twitter. Example social media pages include the following Facebook pages: Northern Colorado Plateau Network (https://www.facebook.com/npsncpn), National Capital Region Networks’ page (https://www.facebook.com/NPSNCRN), Northeast Temperate Network (https://www.facebook.com/NPS.NETN).
We like: social media is a virtual requirement for reaching a broad audience especially outside NPS.
To consider: because the use of social media requires careful oversight and dedicated activity, networks that utilize these resources often have a dedicated staff member to curate these accounts (e.g., the National Capital Region Network’s Facebook page is curated by the Science Communicator). In addition, a successful social media feed requires frequent
A-20
Integration of Science and Park Management
activity, something that many IMD networks may not be able to maintain.
When to use: when a network has dedicated communication staff.
Multi-media Tools
Multimedia tools (e.g., videos, flickr, posters, etc.) are also used by networks to communicate with a wider audience.
• Videos have been used to communicate complex ecological concepts (e.g., Arctic Network’s videos introducing arctic landscape features, http://science.nature.nps.gov/im/units/arcn/media/ARCNvideoInteractive/) and to provide basic information about I&M networks (National Capital Region’s video, https://www.youtube.com/watch?v=JYXR1UMdmkk).
• Some networks maintain YouTube pages (e.g., the National Capital Region Network’s page: https://www.youtube.com/user/NPSNCRN), as do some parks (e.g., Yosemite National Park’s page: https://www.youtube.com/user/yosemitenationalpark).
• Flickr provides a portal for sharing of images, and many networks are using this avenue to post photographs of parks, their resources, and monitoring activities conducted by IMD staff and collaborators (e.g., Sonoran Desert Network, https://www.flickr.com/photos/npssodn/, or Northeast Coastal
and Barrier Network, https://www.flickr.com/photos/npsncbn/).
Webpages
All IMD networks as well as the national IMD maintain web pages (http://science.nature.nps.gov/im/index.cfm).
We like: Consistent design and layout has greatly enhanced the sense of unity and made it easier for a user to find information across multiple networks. The incorporation of “widgets” that actively query IRMA for publications and species lists ensures that data delivered on the web page is up to date and consistent with IRMA. To consider: maintaining a web presence is no small task, especially if combined with other social media platforms. In addition, many networks also maintain intranet, sharepoint, and google sites, presenting not only a challenge for maintenance but also making it difficult for end users to know where to look for information. This is not a unique problem to IMD.
When to use: always; a web presence is a virtual requirement.
Resources (Literature and Links)
Most IMD products, including technical reports, peer-reviewed journal articles, and resource briefs, are accessible through the IRMA portal (https://irma.nps.gov/). However, IRMA is not searchable by Google or Google Scholar so the IMD technical reports are not widely available to those who are not searching directly in IRMA.

A-21
Appendix G: Incorporating Science into Management Decisions
Appendix G: Incorporating Science into Management DecisionsThere has been wide recognition of the need, and encouragement for, using science-based decisions within the NPS (National Park System Advisory Board 2009). For this to be effective, (1) there needs to be relevant and reliable science available, (2) it needs to be available in a form that is both readily accessible and usable by park decision makers, and (3) it needs to actually be used to help support making decisions as well as evaluating the success of those decisions. Having the best science available to parks is of very limited value to park management if that science is not used to help make management decisions. This appendix focuses on how we get science to the decision makers and how it might be better incorporated into decisions once we get it there.
Pathways to Provide Science to the Decision Maker or Process
Although there are a multitude of ways that science can be used to support management decisions, there tends to be only a few primary means for science to make its way from a raw form of data or literature (including reports) to the hands of the decision makers or a decision-making process (Figure G1). Once
in the hands of the decision maker or process, there are then numerous ways for the science to be used, many of which are addressed throughout this report.
Gathering Scientific Support and Evidence
A first step in establishing scientific support for management decisions is finding and compiling the relevant scientific information. Easy access to data and literature has long been an issue in the NPS. To address the issue, the I&M Division developed the Integration Resource Management Applications (IRMA) system. IRMA is intended as a web-based “one-stop” source for data and information related to NPS natural and cultural resources. IRMA allows users to search, view, download, and print information from multiple sources and systems, all from a consistent user interface. Searches for relevant information can also be enhanced using Boolean logic (combining keywords with operators such as AND, NOT and OR to produce more relevant results). The Search functions in IRMA are still evolving and some users have expressed frustration in its use and navigation; never the less, it is a certainly step in the right direction
Figure G1. Conceptualization of the primary pathways for science delivery to the decision maker or decision process. Adapted, in part, from Dicks et al. (2014).

A-22
Integration of Science and Park Management
and its developers are committed to continual improvement.
Although IRMA is a step toward improving access to data and information, it in no way covers the millions of sources of information from academia, other agencies or organizations, and a multitude of other sources. Finding relevant data and information in the vast maze of potential sources can be a daunting and overwhelming task. Specialized search tools designed for specific applications or topic areas can also help to refine our ability to find relevant information. A good example of such a search tool, developed in the United Kingdom, can be found at: http://www.conservationevidence.com
This application summarizes evidence from the scientific literature about the effects of common management actions. This type of database is especially valuable if there is a conscience effort to incorporate the most current literature as it emerges (as is done for conservationevidence.com). Even if the list of available references is not exhaustive, the most current literature often cites and leads to finding other major papers on a given topic. For the scientists working on a given topic will likely have conducted an extensive search for relevant science themselves, so that the most current literature leads to a linked chain of previous searches on that topic.
Expert Opinion, Science Panels and Advisory Boards
Expert opinion, science panels and advisory boards bring together one or more independent scientists to provide advice on the scientific and technical aspects of a questions/problem posed by managers. For many management decisions, data are lacking or not available before a decision must be made. Consequently, it is common for managers to rely on expert opinion aid in making decisions (Runge et al. 2011). However, soliciting expert opinion is also not without its risks. Studies have shown that even expert opinion can be biased when reflecting an individual’s personal experience and/or beliefs and can be self-serving when the potential for research is at
stake (Martin et al. 2011). For these reasons, a variety of tools and approaches have been developed for soliciting expert opinion from a group of scientists. Probably the most well-known is the Delphi Process (MacMillan and Marshall 2005). The Delphi Process and its multitude of variations elicit opinion from individual experts and then share those opinions among the group. Experts are then allowed to modify or refine their input taking into account any insights offered from other experts. Variations of the process differ in how the experts interact as well as how the information is finally aggregated (Runge et al. 2011). These types of expert opinion can build scientific consensus for a decision while also being transparent. This pathway is especially valuable when data are limited, decisions are controversial and when the science in support of the decision may be interpreted as biased if it comes from one source.
Syntheses, Reviews, and Briefings
This common approach to delivery of scientific information represents the compiling and presentation of available science, generally, but not always, from specialists familiar with the issue, the science, or the methods. The findings are generally presented in a written report, although some briefings may be verbal. This approach can be valuable for a variety of situations that are usually not overly complex or controversial. For example, this approach is often used for decisions that require limited compliance like a categorical exclusion so there is documentation. However, the value and reliability of this delivery approach depends on several factors including how familiar the presenter is with the issue or the science, the depth and breadth of the search for relevant science, the degree to which the report or brief was linked with to the management goals or objectives, and the objectivity in interpreting the science.
State of the Park ReportsOne of the best examples of syntheses, reviews, and briefings comes from a recent NPS “Call to Action” (National Park Service 2011) which calls for producing “State of the Park” reports that synthesize monitoring

A-23
Appendix G: Incorporating Science into Management Decisions
information, resource inventories, facilities condition data, and visitor surveys. These reports are explicitly intended to combine a review and syntheses of available information into a brief format for the purpose helping to establish park priorities leading to improved management decisions.
Decision Support Systems
A Decision Support System (DSS) is one of a wide variety of tools designed to aid decision making, typically by illustrating different possible outcomes visually or numerically (others, Dicks et al. 2014). They are usually computer based and can range from simple interfaces used by the decision makers themselves to more complex models often requiring that they be operated by their developers (Dicks et al. 2014). The data visualization tools currently being developed by NPS (citation) are an example of DSSs that enable decision makers to explore data and patterns themselves through a simple user interface. At the other end of the spectrum, structured decision models, currently being used by some of the Alaskan Parks enable data-driven evaluation and optimization of competing objectives for more complex and controversial decisions.
The value in using a decision support system closely parallels that of using a structured vs unstructured approach to decision making; that its value increases within increasing complexity and a the need for a transparent objective process. In terms of the principles of good decision making, DSSs can be an extremely powerful tool for evaluating the consequences of alternative actions. As with the principles of good decision making, DSSs also facilitate transparency by using open and logical steps to achieve their outcomes.
Structured Decision ModelsStructured decision models are essentially a quantitative expression of a structured decision process. They are a bit unique in that since they are based on a structured decision process, they can serve not only as the pathway for science to feed in to a decision process, but actually closely parallel the process itself. Other decision making approaches also
incorporate many aspects of a structured decision process, but probably none so closely as structured decision models. This approach uses explicit quantifiable objectives, explicit management alternatives (actions) to meet objectives. These models then predict the effect of alternative management actions on a given resource(s) which provides a basis for evaluating which alternatives best achieve the objectives. They are particularly well suited for problems in which there are multiple or even conflicting objectives. They typically require a fair amount of data be available although variations of this approach using a Bayesian framework (discussed briefly in Appendix J) can incorporate different sources of evidence beyond data collected expressly for this purpose.
Structured decision models are repeatable, formalized, transparent, and incorporate uncertainty through alternative models, although the process is not necessarily a fast so there needs to be a long-term commitment to carry it through. Their downside is that they are probably overkill for most lower-level operational decisions and typically require a fair amount of data to support them. Thus, while extremely valuable, they offer a feasible solution to a limited set of decisions faced by NPS decision makers. An example of this approach in an NPS context (bear management) is described in greater detail in Appendix I.
Experience and Perceptions
Many decisions, particularly operational decisions, within the park service (and other agencies) do not rely on any formal decision process. Rather, they rely on the experience of the decision maker. This pathway can be extremely important for less complicated and less controversial decisions, but comes with some risk. The quality of the information leading to decisions based on experience, perceptions, and anecdotal evidence is difficult to assess and is typically less reliable than evidence gathered using scientific methods. Further, perceptions about experience is often subjectively filtered and reinforced such that the belief about experience no longer matches the actual

A-24
Integration of Science and Park Management
experience (Balph and Balph 1983). This can lead to the propagation of poor or untested management actions and precludes any real transparency (Dicks et al. 2014). That being said, it would also be extremely inefficient to evoke a formal decision process for routine decisions where the cost of being wrong is minor and experience has effectively been able to guide decisions in the past. The key point is that decision makers should recognize when it is appropriate to go beyond a reliance on experience such as (1) when the cost of being wrong is not trivial, (2) when there is moderate to high uncertainly, (3) when the context warrants transparency, and (4) when there are confounding or complicating factors.
Pathways for Feeding Science in to Different Classes of Decisions
As discussed in Module 4, decisions tend to fall into one of three broad classes, strategic, tactical, and operational. Strategic decisions are the broad, often value-driven, decisions that typically entail such things as programmatic direction and are often made by upper management. Tactical decisions are the decisions that general reflect how to achieve the broader strategies. These would include
many of the park implementation plans and are typically made by park superintendents and resource staff. Operational decisions are the more informal, routine, day-to-day decisions often made by field staff that are primarily based on common sense, established rules, experience, and judgement. The class of decision certainly influences the likely pathway for science to reach the decision maker or process. In Table G1, we have described these classes and the likely pathways for science to reach the decision maker or process.
Some Common Formal or Required Decision Frameworks within the National Park ServiceFrom time to time, a formal process or approach emerges that typically takes into account some or all of the principles of good decisions making. These may be in the form of a generalized decision process or an approach developed for a specific type of problem or issue. They may be mandated or recommended in certain circumstances. Here, we have presented a few, but by no means all, of the common decision frameworks commonly used within the National Park Service. Our intent is not to provide an exhaustive list so much as to present a sample of these formal
Table G1. The three primary classes of decisions, their description, and the likely pathways for science to reach the decision maker or process.
Decision Class Class Description Likely Pathway(s) for Science
Strategic Although certainly influenced to some degree by science, these decisions are typically focused on programmatic goals and direction and tend to be highly influenced by societal values and other non-scientific factors.
Opportunities to use decision support systems and scientific review panels certainly exist; however, because science tends to be only one of many influences, the pathway for science tends come more from briefings by advisors.
Tactical These decisions tend to focus on the means of achieving the broader programmatic goals determined by strategic decisions. They tend to be more technical than either strategic or operational decisions, and while often influenced by non-scientific factors, science probably a prominent role.
These decisions can vary widely in their difficulty, complexity, controversial nature, etc. As such, all pathways, including experience and perceptions, are common. These types of decisions would also likely benefit most from using a structured decision process regardless of the pathway.
Operational These decisions tend to be more informal, routine, day-to-day decisions often made by field staff. These decisions typically do not have substantial consequences, involve limited resources and have shorter-term applicability. There is frequently a scientific basis for such decisions, but that science is often well established.
Operational decisions could in many cases benefit from other pathways; however, because of their simpler and often more routine nature, they tend to be made based on experience and perceptions.

A-25
Appendix G: Incorporating Science into Management Decisions
decision frameworks in order to illustrate how science is typically incorporated into some of these approaches.
National Environmental Policy Act (NEPA)Probably the best known example of such a process comes from the National Environmental Policy Act (NEPA). NEPA provides an established process for requires federal agencies to assess the environmental effects of their proposed actions prior to making decisions. While the goal is to include the best available science and knowledge of what the impacts may be to resources, there is really little guidance as to what that means. However, the process does include many of the general principles we have discussed, such as defining the problem, identifying alternatives, and choosing among the alternatives with justification. It often incorporates results from a wide variety of sources and other decision tools such as Choosing by Advantages, structured decision models, or science review panels.
General Management PlansThese guidance or umbrella documents help set the stage for management of a park and are typically long-lived documents (10 years) that take into account park legislation and NPS Management Policies. Decisions made to implement different goals or objectives outlined in the guidance document typically require some level of NEPA compliance. Like NEPA, there is little guidance as to how to incorporate the best available science, and there is considerable variation in the degree to which available science is discovered and used.
Choosing by Advantages Choosing by Advantages (CBA) was developed by Jim Suhr (Suhr 1999) of the U.S. Forest Service to make the correct decisions for projects involving qualitative resources and decision factors. CBA uses a selection and ranking process that is based on the relative advantages and costs of a project and range of alternatives while meeting servicewide goals and objectives. In an NPS context, CBA is intended to assess things such as (1) what and
how large are the advantages of each project? (2) how important are the advantages of the projects (3), and are those advantages worth their associated cost?. This process is mostly used for construction related projects but does take the impacts to natural and cultural resources into consideration, so any available science related to resources that could be impacted helps to inform the outcome of the decision. Sometimes this process may come across that the cost of implementing outweighs the potential resource impacts.
As discussed in Module 4, most of the literature on principles of good decision making center around a few common themes; the major differences being how they lump and split the principles, how they are framed, and where they put the emphasis. CBA is no exception and if one examines the five phases of CBA decision making the degree of overlap with Structured Decision Making quickly becomes apparent.
The five phases of CBA decision making are:
• Stage-Setting: establish the purpose and context for the decision
• Innovation: formulate an adequate set of alternatives
• Decisionmaking: choose the alternative with the greatest total importance of advantages
• Reconsideration: change the decision if it should be changed; improve on it if you can
• Implementation: make the decision happen; adjust as needed; evaluate the process and results
The major difference between CBA and SDM is that CBA puts an emphasis on the advantages of one alternative compared to another, while SDM puts an emphasis on how well any given alternative does at achieving the objectives.
A-26
Integration of Science and Park Management
Ways in Which Using Principles of Good Decision Making can Improve Integration of Science
As discussed in Module 4, different approaches to decisions influence how science is integrated into those decisions. Even decisions that use a systematic process have considerable variability in how science is actually used. The degree to which science is incorporated, and what science is incorporated, is also largely at the discretion of the decision maker. Further, there is certainly no “one-size-fits-all” approach to incorporating science into management decisions. Policies mandating the use of “best available science” have emerged throughout
government agencies with no explicit means of incorporating science into the process. Provided the reliable science is even available, a decision maker who is diligent, thorough, and comfortable with the science may be quite effective at incorporating the best available science, while one that is pressed for time or unfamiliar with the science, may not be quite as effective. In some circumstances decisions may be unnecessarily delayed due to paralysis from too much information or the belief that more science is needed. While we recognize that a structured decision approach to decisions is not warranted in all circumstances, we believe that understanding the basic principles of good decision making can vastly improve the reliability and transparency of management decisions.

A-27
Appendix H: Expressing Goals, Objectives, and Desired Conditions
Appendix H: Expressing Goals, Objectives, and Desired Conditions to Facilitate Integration of Science and ManagementDecisions within the NPS are based on a comprehensive hierarchy of planning processes and documents that reflect a wide range of values from the mission of the service down to very specific management and performance goals and objectives (NPS 2006). The upper end of this hierarchy reflects broad values that tend to be expressed as policy. Although science certainly can and should influence policy, the integration of science with management goals and objectives, the focus of this report, tends to occur at the lower end of the spectrum where measurable outcomes can be better incorporated into scientific investigations.
The desired state or condition of our parks is typically expressed in the form of goals, objectives, or a desired condition. Although each of these planning concepts expresses something about the future qualitative state of our parks, they differ in their specificity and timeframes (Figure H1).
Science can certainly be used to determine what the desired state of our parks should be based on how the environment, including man-made stressors, influence our parks relative to the values determined by the enabling legislation, foundation statements, or general management plans. If the intention is to use science to assess the condition of our parks relative to previously established desired states, however, there are at least two essential characteristics that are necessary; the desired outcome must be measurable and expressed in the form of a state or condition.
Measurability
Imagine a desired condition for a grassland park that is stated in a common form such as “to restore the ecological integrity of the native prairie.” Although this is fine as a general goal, it is insufficient to assess scientifically since we have no way to measure “integrity” per se. If, however, the management objective
Figure H1. The relationships among types of NPS planning processes or documents with respect to the level of specificity and intended timeframe.

A-28
Integration of Science and Park Management
was defined in measurable terms, such as “to restore the ecological integrity of the native prairie, which we define as being comprised of at least 85% native species, of which 60% are native grasses,” we can now measure the extent to which the landscape is in this condition or to what degree it is not. Of course, there could be several other dimensions used to define ecological integrity, this is a simple example.
Annual Performance Plans are one of the documents most likely to have objectives specific enough to be measurable in the context of science. Performance objectives in such plans, however, are often stated in terms of management actions rather than the desired end state. As stated above, to be effectively incorporated into scientific inquiry, measurability, while necessary, is not enough; the desired outcome must also be expressed as a state, rather than an action.
Expressing Desired Outcomes as a State or Condition (The End v. the Means)
Failing and Gregory (2003) identified confusion of the end and the means as one of the most common mistakes in establishing biodiversity indicators. Similarly, it is common for agencies and organizations to express
management objectives in terms of the means to achieve an end, rather than the end itself. That is, they express the objective in terms of the management action and frequently any element of measurability is associated with quantifying the extent of action rather than the desired condition of the resource. While this may be well suited for assessing some aspects of “performance,” it does little to facilitate connecting science and management.
As a hypothetical example, if the objective for an area infested with Russian olive trees (an exotic plant) was expressed only in terms of treating the area (e.g., to treat 25 acres for Russian olive), then two treatments of that same area would be considered equally successful, regardless of how effective the treatments were at discouraging the persistence of Russian olive. Even if other details associated with the treatment (e.g., a particular chemical or dose) were specified, there is still no information in the objective to enable assessment of the treatment’s effectiveness. If, however, the objective was expressed in terms of the resulting state or condition (e.g., extent of reduction of Russian olive) then success would better reflect how well the treatment was at achieving the desired condition, as opposed to merely whether or not it was treated (Figure H2).
Figure H2. A hypothetical riparian zone covered with exotic Russian olive trees (illustrated in grey) prior to treatment. If the objective was to treat a certain area (an action), then the outcome of Treatment 1 was identical to Treatment 2 since the same area was treated. If, however, the objective was to reduce the occurrence of Russian olive (a state), then Treatment 2 was far more effective than Treatment 1.

A-29
Appendix I: Structured Decision Making
Appendix I: Structured Decision Making Case Study: Natchez Trace Parkway Beaver Management
The purpose of this appendix is to emphasize the importance of putting extensive effort into the “value-focused thinking” part of structured decision making in order to clearly define problems, objectives, and alternatives in partnership with decision makers rather than moving too quickly into the evaluation modeling phase. While structured decision making models can quantitatively assist scientists and decision makers in evaluating alternatives and assessing success of management actions, they are only as good as the information that goes into them. If the first stages of decision making are glossed over too quickly, or if all appropriate perspectives and input are not explored, the model may be wrong or only marginally useful. The following example conveys how a complex management issue was examined to ensure that decisions were made with clarity and support from scientists, managers, and decision makers alike.
The ProblemThe 444-mile Natchez Trace Parkway was established to commemorate the historic network of trails linking Nashville, Tennessee and Natchez, Mississippi. There are hundreds of bridges and thousands of culverts and other structures that are essential in providing drainage to the parkway as it traverses diverse ecological landscapes and major watersheds. The drainage structures crossing the parkway provide beavers with a convenient place to construct their dams.
Beaver dams create complex successional mosaics of aquatic habitats that improve water quality, enhance biological diversity, and provide wildlife viewing opportunities for visitors. Beaver dams can have adverse impacts as well, including damage to the roadway, economic loss to agricultural land adjacent to the parkway, damage to sensitive cultural sites, and impact to habitat associated with threatened and endangered species. The management objective is to strike a
balance between managing for the ecological benefits of beaver habitation, the requirement to maintain natural processes, the federal mandate to protect an endangered species of butterfly that relies on beaver-created habitat, and impacts to infrastructure by beaver dams. Management decisions have been made on a case-by-case basis and are costly and time intensive. A logical process for managing beavers along the parkway that balances competing objectives was needed.
Structured Decision Making WorkshopIn August of 2014, the management team from Natchez Trace Parkway (superintendent, resource management, maintenance, and IMD scientists) along with coaches experienced in structured decision making met at a week-long workshop sponsored by the U.S. Fish and Wildlife Service’s National Conservation Training Center (NCTC) and hosted at Mississippi State University. The goal was to work as a team to identify the problem, clarify objectives, consider multiple alternatives and consequences, weigh the alternatives, and choose beaver management actions to be implemented. The management team and coaches used a structured decision- making process called PrOACT (Problem, Objectives, Alternatives, Consequences, Trade-offs). This tool uses the basic principles of structured decision making outlined in Module 4. The conceptual diagram in Figure I1 demonstrates how the defined problem and objectives drive the entire decision making process. The complexity of the beaver management with conflicting objectives, legal mandates, uncertainty, and high financial and ecological costs made it an ideal candidate for the structured decision making process. However, many less complex decisions would benefit from these principles, in particular the emphasis on defining the problem correctly in the early stages.
Emphasis on Early PhasesOften we think of evaluating alternatives as the main step in structured decision making. It can be attractive to jump right to the quantitative assessment of potential

A-30
Integration of Science and Park Management
actions so the decision can be made and implemented quickly with quantitative data to back it up. While this evaluation phase is critical, it requires careful consideration of all the values, uncertainties, and available science beforehand so the problem, goals, and available management actions are articulated clearly and thoroughly. In the Natchez Trace Parkway workshop, scientists
and decision makers worked the entire week to adequately discuss and define the issue, formulate clear objectives, and develop meaningful alternatives before assessing the options quantitatively. Many times the discussions would result in a re-evaluation of the problem statement that would then drive how the alternatives needed to be evaluated in the modeling step.
The discussion sessions led to the discovery of values, objectives, alternatives, and consequences that were not previously identified when scientists; managers and decision makers worked independently on the problem. Spending most of a week to correctly define the problem with the entire management team at the table resulted in seven fundamental objectives that included safety, negative impacts to resources (special concern resources, wetlands and wetland-dependent species, non-wetland communities), financial costs, public perception, and compliance with regulation. For each objective, measurable attributes and performance criteria for evaluating outcomes were specifically stated (Figure I2).
Figure I1. The ProACT structured
decision making process.
Figure I2. Fundamental
objectives with measureable
attributes and performance
criteria developed at the
Natchez Trace Parkway beaver
management structured decision making workshop.

A-31
Appendix I: Structured Decision Making
Coaches helped the team work through differing visions, values, and ideas along the way. For example, the team spent quite a bit of time discussing whether impacts to non-wetlands like pine forests are actually “bad.” Resource managers see it as a natural succession and engineers view it as killing trees. The team was able to make some decisions about circumstances where dead stands of pines were acceptable and circumstances where they were not. Similar discussions occurred for issues with public perception, which could be positive or negative depending on the stakeholder and whether it involved loss of particular habitats or beaver trapping as a management action. Legal precedent and mandate also played into the discussion on public perception and its role in decision making in this case. Through this week-long process, partnership and consensus were developed in the decision- making process that will help make management actions more successful in the long term.
Having the entire management team at the table to conduct the in-depth examination of the issue, and carefully documenting the
process, resulted in a more reliable quantitative evaluation of potential management actions. This process can be applied to many types of decisions. Clear objectives that drive a systematic and comprehensive evaluation of alternatives will result in management actions that have buy-in from decision makers, scientists, and managers, transparency, and documentation that will facilitate learning to benefit future decision making.
Lessons Learned• For structured decision making to be
effective, the decision makers should be in the room.
• Defining and refining the objectives is important, time consuming, and the step most often skipped.
• This process identifies and documents sources of uncertainty and assumptions.
• Do not try this on your own; coaches are invaluable in getting through road blocks and providing guidance.

A-32
Integration of Science and Park Management
Appendix J: Evidence-based ConservationUnfortunately, decisions in many fields, including natural resources, are often based on anecdotal evidence, the way it has been done in the past, or subconsciously filtered experiences which are seldom scrutinized as to their long-term effectiveness. As the NPS increasingly advocates for science-based resource management decisions, we need to explore alternatives to the way we think about evidence in our decision making. It is seldom, if ever, the case that one piece of evidence provides a definitive answer to a particular resource management issue. It is far more likely that we would want to weigh the cumulative evidence to understand the consequences of a given resource management decision. Recently, there has been a movement toward evidence-based approaches that use meta-analysis approaches to examine large bodies of cumulative evidence to inform decisions. Two such approaches—the Cochrane Collaboration and evidence-based conservation—are discussed below.
The Cochrane Collaboration
The Cochrane Collaboration (named after British medical researcher Archie Cochrane) is an international, independent network of scientists and professionals who conduct systematic reviews of primary research in human health care and health policy using the same search strategies and “critical appraisal” checklists (Cochrane Collaboration 2015, Pullin and Knight 2001). Their mission is “to promote evidence-informed health decision making by producing high-quality, relevant, accessible, systematic reviews and other synthesized research evidence” (Cochrane Collaboration 2015). Their Cochrane Reviews are widely available online. This evidence-based movement in medicine, and extended more broadly to public health, came about after Cochrane (1972) advocated the use of “randomized controlled trials” to evaluate the effectiveness of medical procedures and treatments, many of which had never been rigorously evaluated (Pullin and Knight 2001).
Evidence-based Conservation
Evidence-based conservation is a semi-formal approach that recently emerged, largely from Europe (Sutherland et al. 2004), to improve resource management decisions. Evidence-based conservation is based on the same principles as the Cochrane Collaboration described above. Like the Cochrane Collaboration, the premise behind evidence-based conservation is that decisions, whether they be in the medical or conservation fields, are often based on anecdotal evidence with little or no assessment of their long-term effectiveness. The intent of evidence-based conservation is to conduct systematic appraisals of the evidence used to make resource management decisions and make those appraisals readily available to managers for future decisions (Sutherland et al. 2004). While conducting a thorough systematic assessment of the evidence is certainly condoned, and consistent with the ideas of formal structured decisions, the general notion of using evidence as a basis for decisions is valuable even in less formal contexts. The approach is related to the concept of adaptive management, some argue that evidence-based conservation provides information from which to base an initial assessment, thus reducing the need to learn by mistakes (Pullin and Knight 2003). In this context, the ideas of evidence-based conservation may be well suited as a starting point for adaptive or other decision approaches.
Some Analytical Tools for Assessing Cumulative Evidence
Bayesian Inference Bayesian statistics, and the corresponding inference, is a quantitative tool that, by its very nature, enables incorporating previous evidence and knowledge, along with newly acquired data, to estimate the probability of a particular outcome. It is a way to update uncertainty in light of new evidence. Although the mathematics are beyond these introductory comments, Bayes’ Theorem

A-33
Appendix J: Evidence-based Conservation
essentially reverse engineers the probability distribution of an outcome, using (1) the cumulative existing knowledge, described in the form of a prior probability distribution, and (2) the likelihood of existing data supporting that outcome, given the prior probability distribution.
Bayesian methods are different from the standard statistics (also called frequentist statistics) that most of us have been taught. Traditional hypothesis testing produces a statement about the probability of the observed data given the null hypothesis, whereas Bayesian methods provide a direct assessment of how likely the null hypothesis is true, given the data. For estimating parameters, frequentists rely on only the sampled data while Bayesian methods combine prior knowledge (data or beliefs) with the sampled data to provide an updated estimate.
Meta-AnalysesMeta-analysis is similar to Bayesian methods in that prior knowledge or data from other sources is used. Meta-analysis is a quantitative statistical analysis of multiple separate, but similar studies from different researchers that is used to test the pooled data for statistical significance (Figure J1). Meta-analysis is a powerful tool that may produce more informative results than the individual studies. Meta-analysis was first used in other fields, such as medicine, but has been used in ecology since at least the early 1990s (Gurevitch et al. 2001). In medicine, this tool is used most often to assess the clinical effectiveness of healthcare treatments (Crombie and Davies 2009), whereas in ecology and conservation, meta-analysis may be used to address a large variety of questions. Meta-analysis methods are formal and statistically defensible, and they have been developed to (Gurevitch et al. 2001):
• determine average treatment effects across studies when a common research question is being investigated,
• establish confidence limits around the average effect size,
• and test for consistency or lack of agreement in effect size as well as explanations for differences in the magnitude of the effect among studies.
A crucial part of meta-analysis is a systematic review to uncover all of the relevant studies, and to evaluate the quality of each study’s design and execution (Crombie and Davies 2009). The benefits of meta-analyses include: overcoming bias (because all relevant studies are included), precision (because data from many individual studies are aggregated), and transparency (decisions about which studies/data are used are made clear).
Conclusion
Many of our management decisions are based on anecdotal evidence and intuitive perceptions. While many are comfortable with relying on their experience or beliefs as a basis for management decisions there are inherent biases that drive our beliefs and there is ample evidence regarding the lack of reliability in such a foundation for resource management (Sutherland et al. 2004). McLuhan (1987) perhaps said it best with his well-known expression “I wouldn’t have seen it if I hadn’t believed it.” An approach to decisions that starts with a gathering and incorporating the available evidence will only serve to improve resource management decisions and is fundamental to the widespread government mandate of using the best available science.
Figure J1. Meta analyses use data from different studies to assess a more generalized effect than would be concluded from a single study.


The Department of the Interior protects and manages the nation’s natural resources and cultural heritage; provides scientific and other information about those resources; and honors its special responsibilities to American Indians, Alaska Natives, and affiliated Island Communities.
NPS 909/132883, May 2016

National Park ServiceU.S. Department of the Interior
Natural Resource Stewardship and Science 1201 Oak Ridge Drive, Suite 150 Fort Collins, Colorado 80525 www.nature.nps.gov
EXPERIENCE YOUR AMERICA™