integrating visual and range data for robotic - stanford ai lab
TRANSCRIPT

Integrating Visual and Range Data for Robotic
Object Detection
Stephen Gould∗ Paul Baumstarck∗ Morgan Quigley†
Andrew Y. Ng† Daphne Koller†
∗Department of Elec. Eng. †Department of Comp. Sc.Stanford University Stanford University
Abstract. The problem of object detection and recognition is a notori-ously difficult one, and one that has been the focus of much work in thecomputer vision and robotics communities. Most work has concentratedon systems that operate purely on visual inputs (i.e., images) and largelyignores other sensor modalities. However, despite the great progress madedown this track, the goal of high accuracy object detection for robotic plat-forms in cluttered real-world environments remains elusive.Instead of relying on information from the image alone, we present a methodthat exploits the multiple sensor modalities available on a robotic platform.In particular, our method augments a 2-d object detector with 3-d infor-mation from a depth sensor to produce a “multi-modal object detector.”We demonstrate our method on a working robotic system and evaluate itsperformance on a number of common household/office objects.
1 Introduction
Endowing autonomous robots with the ability to perceive objects in their environ-ment is a notoriously difficult problem in computer vision. One standard solutionis to equip the robot with a video camera and run state-of-the-art, image-based ob-ject detection algorithms on each frame. However, there are a number of difficultieswith this approach.
Simply finding each object—let alone classifying it—is a non-trivial task in clut-tered real-world environments. Many state-of-the-art object detectors combine theprocess of object detection (localization) and object recognition (e.g., the sliding-window approach), and only compute features local to the region being considered.While this approach works well for uncluttered scenes with well-framed objects, itfails when applied to real-world images as seen by an autonomous robot.1
An autonomous robot needs to operate in a world of small, occluded objectsthat are often ill-framed. Many visual percepts will not have been encounteredbefore, and portions of the scene may contain confusing or conflicting visual cueswhen taken out of context. It has been shown that contextual information greatlyimproves the performance of vision-based object detectors especially when the ob-jects of interest are small [2–4]. However, even when this information is taken intoaccount, the context extracted from image features is inherently 2-dimensional andcan be unreliable in natural scenes with significant clutter.
1 The best performing methods in recent PASCAL Visual Object Classes Challenge [1] (whichcontains images of difficult natural scenes) achieved less than 50% average precision for mostobject classes.

2 M2SFA2 2008: Workshop on Multi-camera and Multi-modal Sensor Fusion
Sensor specifications:
– high resolution video cam-era (704×480 images at 15frames per second);
– laser range scanner (75vertical scanlines per sec-ond at 0.5◦ resolution);
– laser pan/tilt unit (37.5◦/shorizontal pan);
– odometry from navigationlaser and wheel encoders.
VideoCamera
Laser
Pan/Tilt Unit
Odometry
Assemble Point Cloud
LogFiles
Calibration
ObjectDetectors
scanline
undistorted video
odometry
dense point cloud(in video frame)
objects
Super-resolution
sparse point cloud
Fig. 1. Our robotic platform, hardware specifications, and data flow: a sparse point cloudis reconstructed in software by knowing the relative pose between the pan/tilt unit and thevideo camera, and correcting for robot motion using odometry. The depth of every pixelis then inferred, and features from the 2-d image and the 3-d point cloud are combinedby our probabilistic object detectors.
Exacerbating the above difficulties are the real-time processing constraints im-posed by robotic applications. This, in general, requires that the vision system besimple, and, in particular, rules out the option of going to higher resolution unlessa sophisticated attentional mechanism is employed.
The shortcomings of image-based object detection can be addressed on a roboticplatform by exploiting the multiple sensor modalities available to the robot ratherthan relying on a single monocular or stereo-vision sensor mode. Since the roboticsystem is situated in its environment it can directly measure features that wouldhelp detection instead of inferring these quantities from 2-d image cues. For exam-ple, measuring temperature can help in the detection of people, and finding largesupporting surfaces can help locate small objects. With the availability of cheaperand easier-to-use sensors, such as infrared cameras and lasers, it makes sense toleverage these different sensor modalities for vision.
In this paper, we propose to augment state-of-the-art robotic visual systemswith input from a laser depth scanner and to combine the 2-d and 3-d sensormodalities to enhance object detection in cluttered real-world environments. Wefuse the depth and visual data so that, for each pixel in the robot’s field-of-view, wehave color/intensity, depth (location in 3-d space), and surface normal information.This allows us to directly extract contextual cues (such as height above the ground)and 3-d features (such as object size). Figure 2 depicts these features for a simpleoffice scene.
Our method consists of a number of stages which can easily be pipelined forreal-time processing on a robotic platform. (See Figure 1 for a schematic of ourdataflow). First, using super-resolution techniques, we combine frames from a videocamera with a low resolution, or sparse, point cloud generated from a laser scannerto produce a high resolution, or dense, point cloud in the video camera’s frameof reference. Next, we apply a sliding-window object detector at multiple imagescales: for each location ((x, y)-position and scale) in the image, we compute local2-d patch features and corresponding 3-d contextual features. The patch featuresare provided as input to a trained boosted classifier which, like standard image-onlyobject detectors, estimates the probability of an object being at the location given

M2SFA2 2008: Workshop on Multi-camera and Multi-modal Sensor Fusion 3
(a) Image of scene (b) Height above ground (c) Surface normal (d) Object size
Fig. 2. Example 3-d feature responses for a window size of 40× 40 pixels (approximatelythe size of the coffee mug in this scene). Light areas indicate stronger feature values. Forexample, the surface normal feature can be used for identifying supporting surfaces suchas the table with horizontal support or the walls with vertical support.
just the image features. Finally, we apply a learned logistic classifier for each objectto a feature vector comprising this image-only probability and the computed 3-dfeatures. A distinct advantage of this approach is that the image-only classifier canbe trained using standard state-of-the-art techniques (and on large datasets) whileour “multi-modal” classifier still takes advantage of 3-d contextual information.
We demonstrate our method on a number of small household/office objectsin natural environments. Importantly, we show that by fusing information fromthe depth sensor we are able to significantly improve object detection rates overstate-of-the-art image-only techniques in cluttered real-world environments.
2 Background and related work
Sliding-window object detection is a popular technique for identifying and local-izing objects in an image. The method has been very successfully applied to facedetection [5] and can be highly efficient when combined with a cascade of boostedensembles (CoBE) classifier and simple Haar-wavelet features [6]. However, Haar-wavelet-like features tend to perform poorly on other object classes, and researchershave developed other, more sophisticated discriminative features (e.g., histogramof oriented gradients [7], biologically inspired (visual cortex) features [8], or patch-based features [9]) at the cost of processing speed. When applied to multiple objectclasses, features can be shared amongst the detectors, thereby amortizing the costof feature extraction [10].
A number of researchers have shown that context can significantly improve ob-ject detection accuracy, especially when the objects are small [2, 3, 9, 11, 4]. How-ever, little work has focused on 3-d context. Notable exceptions are the innovativeworks of Hoiem et al. [4] and Leibe et al. [12] who infer the camera location andscene geometry from a single 2-d image or stereo video stream, respectively. Theseworks reconstruct rough geometry of street scenes (pedestrians and cars) and can-not, for example, be used for estimating 3-d features of small objects. Instead oftrying to infer 3-d structure, we propose to measure it directly using a laser.
Some novel works use 3-d point clouds from depth sensors for detecting ob-jects. Nuchter et al. [13] use separate reflectance and depth information from asingle sensor to detect known objects. Other works focus on discovering geometricprimitives [14], or detecting large novel objects but without recognition [15]. Unlikethese works, we detect and recognize small objects from sparse depth informationin real-time.

4 M2SFA2 2008: Workshop on Multi-camera and Multi-modal Sensor Fusion
3 Sensor fusion and scene representation
In this section, we describe how we process the raw data from the robot’s sensors(Figure 1) into a representation that unifies the modalities of the camera and thesparse depth sensor. In particular, we describe how the sparse laser measurementsare used to infer depth at the (much higher) spatial resolution of the camera.
Ideally we would like to measure the depth (and surface normal) at every pixelin the image so that we can make use of 3-d geometric cues in our object detector.Unfortunately, the laser range scanner does not support the same resolution as thevideo camera.2 Thus we need to resort to super-resolution techniques in order toinfer the depth at every pixel. The resulting high resolution depthmap can thenbe used to estimate surface normals. State-of-the-art methods for super-resolutioninclude MAP inference on a pairwise Markov random field (MRF) [16, 17] andbilateral filtering [18], and are based on the intuition that depth discontinuitiesusually coincide with color discontinuities in the image.
Our method is similar to the MRF model of Diebel and Thrun [16].3 How-ever, instead of encoding a preference for fronto-parallel planes (implicit in theirformulation) we allow for arbitrarily sloped planar surfaces. Thus our method canbe thought of as reconstructing a first-order approximation to each surface ratherthan a zeroth-order one. We also use a robust Huber penalty instead of the morecommonly used ℓ2 penalty.4 A quantitative comparison measuring mean-square re-construction error on a hold-out set of points showed that, on average, our modelperformed better than that of Diebel and Thrun [16] on our office scenes—detailsomitted due to space constraints.
Concretely, let the image pixel intensities be {xi,j | (i, j) ∈ I}, the laser depthmeasurements be {zi,j | (i, j) ∈ L} and the reconstructed/inferred depth for everypixel be {yi,j | (i, j) ∈ I} where I indexes the image pixels and L ⊆ I indexes thelaser measurements (projected onto the image plane). Two MRF potential functionsare defined—the first penalizes discrepancy between measured and reconstructeddepths, while the second encodes a preference for smoothness:
Φij(y, z) = h(yi,j − zi,j ;λ) (1)
Ψij(x,y) = wvijh(2yi,j − yi,j−1 − yi,j+1;λ)
+ whijh(2yi,j − yi−1,j − yi+1,j ;λ) (2)
where h(x;λ) is the Huber penalty function, and wvij = exp{−c‖xi,j−1 − xi,j+1‖
2}
and whij = exp{−c‖xi−1,j−xi+1,j‖
2} are weighting factors indicating how unwillingwe are to allow smoothing to occur across vertical and horizontal edges in the imageas in [16].
2 The video camera on our robot has a base resolution of 0.1◦ and can optically zoom down to0.01◦. On the other hand, modern (full scene scanning) depth sensors, such as the SwissRangerSR-3000, only have a resolution of approximately 0.5◦.
3 Note that in their setup the camera and laser were axis-aligned and the scene imaged byrotating through 360◦. Thus they did not have to deal with calibration issues between the twosensors nor occlusions.
4 The Huber penalty function, h(x; λ) = x2 for −λ ≤ x ≤ λ and λ(2|x| − λ) otherwise, is convexand thus we can still find the MAP solution exactly.
M2SFA2 2008: Workshop on Multi-camera and Multi-modal Sensor Fusion 5
(a) (b) (c)
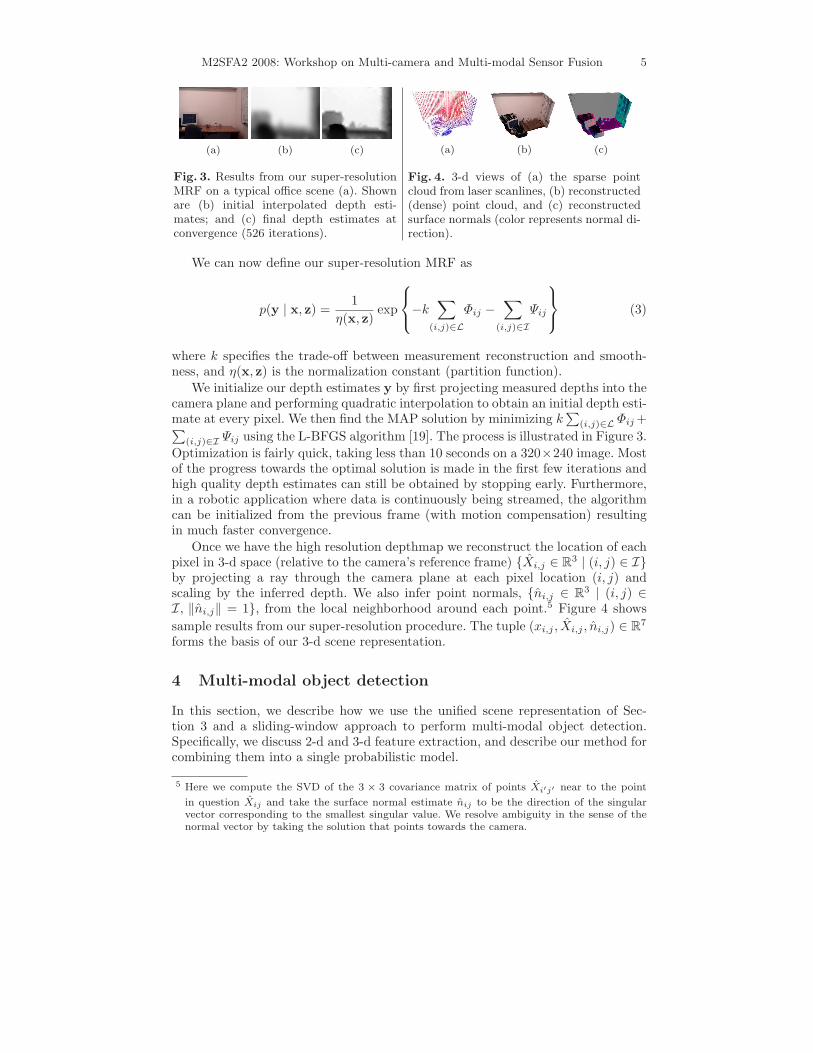
Fig. 3. Results from our super-resolutionMRF on a typical office scene (a). Shownare (b) initial interpolated depth esti-mates; and (c) final depth estimates atconvergence (526 iterations).
(a) (b) (c)
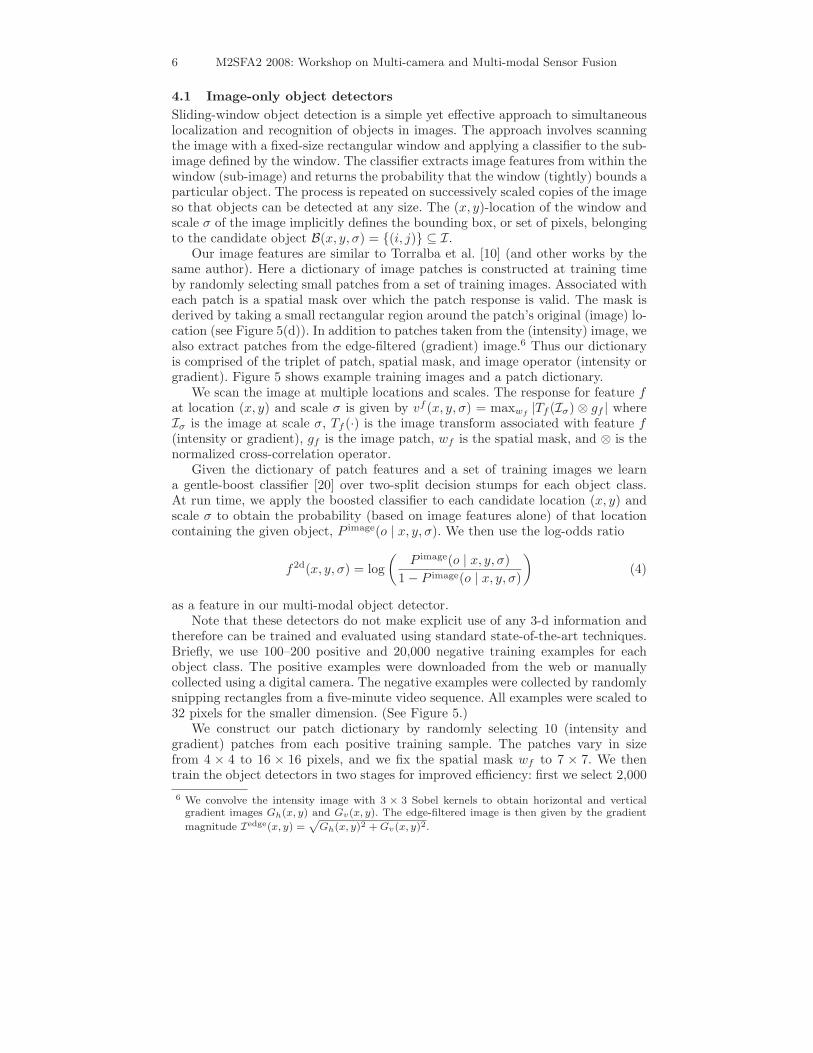
Fig. 4. 3-d views of (a) the sparse pointcloud from laser scanlines, (b) reconstructed(dense) point cloud, and (c) reconstructedsurface normals (color represents normal di-rection).
We can now define our super-resolution MRF as
p(y | x, z) =1
η(x, z)exp
−k∑
(i,j)∈L
Φij −∑
(i,j)∈I
Ψij
(3)
where k specifies the trade-off between measurement reconstruction and smooth-ness, and η(x, z) is the normalization constant (partition function).
We initialize our depth estimates y by first projecting measured depths into thecamera plane and performing quadratic interpolation to obtain an initial depth esti-mate at every pixel. We then find the MAP solution by minimizing k
∑
(i,j)∈L Φij +∑
(i,j)∈I Ψij using the L-BFGS algorithm [19]. The process is illustrated in Figure 3.
Optimization is fairly quick, taking less than 10 seconds on a 320×240 image. Mostof the progress towards the optimal solution is made in the first few iterations andhigh quality depth estimates can still be obtained by stopping early. Furthermore,in a robotic application where data is continuously being streamed, the algorithmcan be initialized from the previous frame (with motion compensation) resultingin much faster convergence.
Once we have the high resolution depthmap we reconstruct the location of eachpixel in 3-d space (relative to the camera’s reference frame) {X̂i,j ∈ R
3 | (i, j) ∈ I}by projecting a ray through the camera plane at each pixel location (i, j) andscaling by the inferred depth. We also infer point normals, {n̂i,j ∈ R
3 | (i, j) ∈I, ‖n̂i,j‖ = 1}, from the local neighborhood around each point.5 Figure 4 shows
sample results from our super-resolution procedure. The tuple (xi,j , X̂i,j , n̂i,j) ∈ R7
forms the basis of our 3-d scene representation.
4 Multi-modal object detection
In this section, we describe how we use the unified scene representation of Sec-tion 3 and a sliding-window approach to perform multi-modal object detection.Specifically, we discuss 2-d and 3-d feature extraction, and describe our method forcombining them into a single probabilistic model.
5 Here we compute the SVD of the 3 × 3 covariance matrix of points X̂i′j′ near to the point
in question X̂ij and take the surface normal estimate n̂ij to be the direction of the singularvector corresponding to the smallest singular value. We resolve ambiguity in the sense of thenormal vector by taking the solution that points towards the camera.
6 M2SFA2 2008: Workshop on Multi-camera and Multi-modal Sensor Fusion
4.1 Image-only object detectors
Sliding-window object detection is a simple yet effective approach to simultaneouslocalization and recognition of objects in images. The approach involves scanningthe image with a fixed-size rectangular window and applying a classifier to the sub-image defined by the window. The classifier extracts image features from within thewindow (sub-image) and returns the probability that the window (tightly) bounds aparticular object. The process is repeated on successively scaled copies of the imageso that objects can be detected at any size. The (x, y)-location of the window andscale σ of the image implicitly defines the bounding box, or set of pixels, belongingto the candidate object B(x, y, σ) = {(i, j)} ⊆ I.
Our image features are similar to Torralba et al. [10] (and other works by thesame author). Here a dictionary of image patches is constructed at training timeby randomly selecting small patches from a set of training images. Associated witheach patch is a spatial mask over which the patch response is valid. The mask isderived by taking a small rectangular region around the patch’s original (image) lo-cation (see Figure 5(d)). In addition to patches taken from the (intensity) image, wealso extract patches from the edge-filtered (gradient) image.6 Thus our dictionaryis comprised of the triplet of patch, spatial mask, and image operator (intensity orgradient). Figure 5 shows example training images and a patch dictionary.
We scan the image at multiple locations and scales. The response for feature f
at location (x, y) and scale σ is given by vf (x, y, σ) = maxwf|Tf (Iσ) ⊗ gf | where
Iσ is the image at scale σ, Tf (·) is the image transform associated with feature f
(intensity or gradient), gf is the image patch, wf is the spatial mask, and ⊗ is thenormalized cross-correlation operator.
Given the dictionary of patch features and a set of training images we learna gentle-boost classifier [20] over two-split decision stumps for each object class.At run time, we apply the boosted classifier to each candidate location (x, y) andscale σ to obtain the probability (based on image features alone) of that locationcontaining the given object, P image(o | x, y, σ). We then use the log-odds ratio
f2d(x, y, σ) = log
(
P image(o | x, y, σ)
1 − P image(o | x, y, σ)
)
(4)
as a feature in our multi-modal object detector.Note that these detectors do not make explicit use of any 3-d information and
therefore can be trained and evaluated using standard state-of-the-art techniques.Briefly, we use 100–200 positive and 20,000 negative training examples for eachobject class. The positive examples were downloaded from the web or manuallycollected using a digital camera. The negative examples were collected by randomlysnipping rectangles from a five-minute video sequence. All examples were scaled to32 pixels for the smaller dimension. (See Figure 5.)
We construct our patch dictionary by randomly selecting 10 (intensity andgradient) patches from each positive training sample. The patches vary in sizefrom 4 × 4 to 16 × 16 pixels, and we fix the spatial mask wf to 7 × 7. We thentrain the object detectors in two stages for improved efficiency: first we select 2,000
6 We convolve the intensity image with 3 × 3 Sobel kernels to obtain horizontal and verticalgradient images Gh(x, y) and Gv(x, y). The edge-filtered image is then given by the gradient
magnitude Iedge(x, y) =p
Gh(x, y)2 + Gv(x, y)2.

M2SFA2 2008: Workshop on Multi-camera and Multi-modal Sensor Fusion 7
(b) Intensity image
(a) Example training images (c) Gradient image (d) Example dictionary entries
Fig. 5. Example positive and negative training examples for the “mug” class are shownin (a). An example dictionary for the class “mug” is shown in (d). Adjacent columnsrepresent patch gf and spatial mask wf for each dictionary entry. White in the spatialmask indicates size of patch, and gray boundary indicates valid response area.
negative training examples at random and train a boosted classifier for 50 rounds;next, we trim our patch dictionary to remove all patches not used by this classifier;finally, we retrain using all 20,000 negative training examples to obtain our finalimage-only object detectors. The resulting patch dictionary typically contains 50–75 entries compared to the 500 entries used in [10].
4.2 3-d features
For each candidate location (x, y) and image scale σ, we compute 3-d featuresby taking the bounding rectangle implicitly defined by the location and scaleB(x, y, σ) = {(i, j)} ⊆ I and conceptually projecting that region into the sceneas shown in Figure 6. We shrink the set of points enclosed by the bounding box byremoving the (i, j) corresponding to points X̂i,j that lie in the outer 5% (in eitherthe x-, y-, or z-directions) of the points in B. This removes outliers and most back-ground points. The resulting shrunken set of points B′ is then used for computingthe features.
Let {X̂i,j ∈ R3 | (i, j) ∈ I} be the location of each pixel in 3-d space (relative
to the camera’s frame of reference), and let {n̂i,j ∈ R3 | (i, j) ∈ I, ‖n̂i,j‖ = 1} be
the estimated surface normal vector for each pixel. The centroid and covariance ofthe points in B′ are
µX =1
|B′|
∑
(i,j)∈B′
X̂i,j and ΣX =1
|B′|
∑
(i,j)∈B′
(X̂i,j − µX)(X̂i,j − µX)T (5)
where |B′| is the number of points in B′. A similar computation gives µn and Σn,the mean and covariance over surface normal vectors.
We now enumerate the object attributes and contextual cues captured by our3-d features and provide some insight into why they are useful for improving objectdetection. Implementation details for how we capture each attribute/contextual cueas a vector-value feature are also described.
Height above ground. Many objects are located at consistent heights abovethe floor. For example, computer monitors are often found on desks which area standard height above the floor; door handles are placed at a relatively fixed

8 M2SFA2 2008: Workshop on Multi-camera and Multi-modal Sensor Fusion
Fig. 6. Illustration of a candi-date object location in the im-age plane being projected into3-d space.
location on the door where most people find it comfortable to reach; and wallclocks are placed high enough so that they can be seen above other objects in theroom. Since we calibrate the point cloud xz-plane to coincide with the floor, ourheight above ground feature is simply
fheight-above-ground =[
µyX (µy
X)2]T
(6)
where µyX indicates the y-component of µX .
Distance from robot. Objects farther from the robot are harder to see, notonly because of their diminished size but also because of lighting effects and depthmeasurement inaccuracy. Although the probability of an object does not dependits distance from the robot, knowing this distance allows our model to compensatefor the influence the above effects have on other features (e.g., the 2-d detectors):
fdistance-from-robot =[
µzX (µz
X)2]T
(7)
where µzX indicates the z-component of µX .
Surface variation and orientation. Most objects have significant surfacevariation and extend above their supporting surface. Obvious exceptions are flatobjects, such as LCD monitors, which appear as a single plane in the 3-d pointcloud and so are distinguished by their lack of surface variation. We compute thefollowing vector-valued features to capture these attributes:
f surf-var =
ΣxxX + Σzz
X
ΣyyX
Σxxn + Σzz
n
Σyyn
, f surf-orientation =
µyn
√
1 − (µyn)2
(µyn)
2
(8)
where ΣX and Σn are the covariance matrices defined above.Object dimensions. One of the most defining attributes of an object is its
size. Knowing this information allows a significant number of false candidates tobe rejected. The width, height, and (projected) area of the object can be estimatedby considering the projection of the bounding rectangle into 3-d space:
fwidth = max(i,j)∈B′
X̂xi,j − min
(i,j)∈B′X̂x
i,j (9)
fheight = max(i,j)∈B′
X̂yi,j − min
(i,j)∈B′X̂
yi,j (10)
farea = fwidth × fheight (11)
where X̂xi,j and X̂
yi,j denote the x- and y-components of X̂i,j , respectively. Our
feature vector also includes the square of these terms. A measure of object depthis already captured by our surface variation feature and so is not repeated here.
The above features are assembled into a single 17-dimensional descriptor f3d
which captures the 3-d attributes of a possible object.

M2SFA2 2008: Workshop on Multi-camera and Multi-modal Sensor Fusion 9
4.3 Multi-modal object detectors
Our multi-modal object detectors are simple binary logistic classifiers based onthe 2-d and 3-d features, f2d and f3d, defined above. Note that, although this isa simple representation, the inclusion of squared terms for many of the featuresallows us to learn rich decision boundaries.
The probability for an object o existing at location (x, y) and scale σ in theimage plane can be written as
P (o | x, y, σ) = q(
θT3df
3d + θT2df
2d + θbias
)
(12)
where q(s) = 11+e−s is the logistic function and θ = {θ3d, θ2d, θbias} are the learned
parameters of the model. The parameters θ2d and θ3d trade-off between 2d and 3dfeatures while the bias term θbias models the prior prevalence of the object.
We learn one multi-modal model per object class on data (images and corre-sponding point clouds) collected from static scenes. We do this rather than usingvideo sequences to avoid the introduction of bias during training and evaluationdue to the high correlation between consecutive video frames. The images are anno-tated with a bounding box and class label for each object of interest. We constructa training set by first running the image-only object detectors over each image,keeping all detections with a probability above 0.001. Any detection overlappingby more than 50% with a groundtruth annotation is used as a positive examplewhile all other detections are used as negative examples. If for any groundtruthannotation there was no overlapping detection, we further run the image-only ob-ject detector on the bounding box for that annotation and add it to our positiveexamples. Finally, for each training example, we extract the 3-d features as detailedabove and learn the parameters θ of our logistic classifier using Netwon’s methodso as to maximize the log-likelihood of the training set. We use ℓ2 regularizationto prevent over-fitting, with weight chosen by cross-validation on the training set.
5 Experimental results
We collected 420 static images and corresponding sparse point clouds of clutteredscenes. The scenes contained a number of small objects (coffee mugs, disposablecups, monitors, wall clocks, door handles, and ski boots) which we would like todetect, as well as distractors (see Figure 7). A number of the scenes were ex-tremely challenging and the authors even had trouble identifying objects in someimages during groundtruth labeling because of image resolution. We performed k-fold cross-validation and report the aggregate performance over the hold-out sets.On each fold we learned the model parameters and regularization weight using thetraining set. The data in the hold-out set was only used for testing.
We evaluate our performance by comparing against image-only object detec-tion. Figure 8 shows precision-recall curves for our learned object detectors. Themulti-modal detectors (solid red curve) are consistently superior to the image-onlydetectors (dashed blue curve).
In general, 3-d features significantly help, especially when strong features such assize and location overcome large intra-class appearance variation (door handles andski boots) or lack of discriminating visual features (computer monitors). The cupclass performs badly for both detectors primarily due to its lack of distinguishing

10 M2SFA2 2008: Workshop on Multi-camera and Multi-modal Sensor Fusion
(a) Original scene (b) Super-res. depth (c) Image-only det. (d) Multi-sensor det.
Fig. 7. Representative scenes showing our results from multi-modal object detectors com-pared against image-only detectors. (Best viewed in color.)
features at small scale. We found a large number of false-positive cups coming fromother small objects such as coffee mugs. This suggests that a model which considersthe location of other objects may improve accuracy for such classes.
In order to understand the contribution that each of our features makes to im-proving object detection, we evaluated the performance of the image-only detectoraugmented with each 3-d feature separately (see Table 9). Here we compare perfor-mance by measuring the maximum F1-score. As expected, object dimensions andheight above the ground are the strongest individual features.
Finally, to gain an intuition for where our method works, we provide somerepresentative results in Figure 7. The first row shows that our multiple sensors helpwhen objects are partially occluded. Here the monitor is detected even though theleft edge is not visible. With some visual features missing, the image-only detectorcannot conclude the existence of the monitor. The second row shows how knowingobject size can be used to reject the false-positive disposable cup despite the strongvisual resemblance. In this scene our method also successfully detects one of thetwo door handles. The last two rows show how image-only detectors are easilyconfused by significant clutter or textured backgrounds. Interestingly, the multi-modal detector incorrectly labels some trash as a coffee mug (bottom of the thirdscene). A patch on the whiteboard that resembles a door handle is also mistakenlylabeled by our detector in the last scene.

M2SFA2 2008: Workshop on Multi-camera and Multi-modal Sensor Fusion 11
0 0.2 0.4 0.6 0.8 10
0.2
0.4
0.6
0.8
1
recall
prec
isio
n
0 0.2 0.4 0.6 0.8 10
0.2
0.4
0.6
0.8
1
recall
prec
isio
n
0 0.2 0.4 0.6 0.8 10
0.2
0.4
0.6
0.8
1
recall
prec
isio
n
0 0.2 0.4 0.6 0.8 10
0.2
0.4
0.6
0.8
1
recall
prec
isio
n
0 0.2 0.4 0.6 0.8 10
0.2
0.4
0.6
0.8
1
recall
prec
isio
n
0 0.2 0.4 0.6 0.8 10
0.2
0.4
0.6
0.8
1
recall
prec
isio
n
(a) Mug (b) Cup (c) Monitor (d) Clock (e) Handle (f) Ski boot
Fig. 8. Precision-recall curves for commonly found household/office objects. Results from2-d object detectors shown in dashed blue; results from 3-d augmented detectors shown insolid red. Scores are computed by first applying non-maximal neighborhood suppressionto remove overlapping detections. A true-positive is counted if any detection overlaps withour hand-labeled groundtruth by more than 50%. Any detection that does not overlapwith a groundtruth object (of the correct class) is considered a false-positive.
Detectors Mug Cup Monitor Clock Handle Ski bootimage-only 0.707 0.594 0.645 0.776 0.506 0.594
w/ height 0.737 (0.03) 0.619 (0.03) 0.755 (0.11) 0.760 (-0.02) 0.708 (0.20) 0.676 (0.08)
w/ distance 0.715 (0.01) 0.600 (0.01) 0.673 (0.03) 0.847 (0.07) 0.477 (-0.03) 0.616 (0.02)
w/ surface var. 0.753 (0.05) 0.608 (0.01) 0.695 (0.05) 0.796 (0.02) 0.563 (0.06) 0.537 (-0.06)
w/ obj. dim. 0.735 (0.03) 0.609 (0.02) 0.714 (0.07) 0.874 (0.10) 0.605 (0.10) 0.763 (0.17)
laser (3d) only† 0.206 (-0.50) 0.241 (-0.35) 0.582 (-0.06) 0.835 (0.06) 0.229 (-0.28) 0.294 (-0.30)
multi-modal (all) 0.768 (0.06) 0.650 (0.06) 0.821 (0.176) 0.865 (0.09) 0.760 (0.25) 0.879 (0.29)
Fig. 9. Comparison of maximum F1-score for image-only detectors augmented with in-dividual 3-d features. The delta over image-only detectors is given in parentheses. The3-d only results (†) are provided for comparison and are calculated for the same set ofcandidate rectangles returned by the image-only detector (but the log-odds ratio featureis not used).
6 Discussion
In this paper we proposed a multi-modal object detector for robots situated in theirenvironments. We showed how robots can exploit 3-d data from a low resolutiondepth sensor—the most common mode of robotic perception after optical sensing—by combining it with 2-d image data for robotic object detection in real-worldenvironments. Our main contributions were two-fold. First, we showed how super-resolution techniques allow us to obtain a high resolution scene representationconsisting of pixel intensities, 3-d locations, and surface normals. Second, we showedhow 3-d features and contextual cues derived from this scene representation canbe combined with a state-of-the-art 2-d object detector to significantly improvedetection accuracy. Importantly, our method works with any 2-d object detector.
Our experimental results showed that the multi-modal detector improves overa baseline 2-d detector for common household/office objects. The improvementis most striking for objects which lack distinguishing features or those with highintra-class variance. Object size and location (height above the ground) are thestrongest 3-d features, both of which are easily derived from our multi-sensor scenerepresentation. An exciting avenue for further work is the exploration of moresophisticated 3-d features while still restricting ourselves to real-time depth sensorswhich are inherently low resolution.
Our architecture also fits well with the needs of real-time robotics. The dataprocessing pipeline allows for multi-threading and can be scaled up to an arbitrarynumber of object detectors. The slowest operation is the extraction of the patch-response features used by our 2-d detectors (taking 10–20s per frame per object

12 M2SFA2 2008: Workshop on Multi-camera and Multi-modal Sensor Fusion
class). Performance can be improved by pruning parts of the scene based on 3-dcues (such as size or surface variation) which are quick to compute.
Vision-only object detection systems are plagued by a number of difficultiesin real-world scenes, e.g., lighting, texture, occlusion, etc. Many of these difficul-ties can be overcome by augmenting visual perception with complementary sensormodalities (e.g., depth and infrared) using the methods described in this paper,providing a step towards robust object detection for autonomous robots.
AcknowledgementsSupport from the Office of Naval Research under MURI N000140710747 is grate-fully acknowledged.
References
1. Everingham, M., Van Gool, L., Williams, C.K.I., Winn, J., Zisserman, A.: The PAS-CAL Visual Object Classes Challenge 2007 (VOC2007) Results (2007)
2. Fink, M., Perona, P.: Mutual boosting for contextual inference. In: NIPS. (2003)3. Murphy, K., Torralba, A., Freeman, W.: Using the forest to see the tree: a graphical
model relating features, objects and the scenes. In: NIPS. (2003)4. Hoiem, D., Efros, A., Hebert, M.: Putting objects in perspective. In: CVPR. (2006)5. Viola, P., Jones, M.: Robust real-time face detection. IJCV (2004)6. Brubaker, S., Wu, J., Sun, J., Mullin, M., Rehg, J.: On the design of cascades of
boosted ensembles for face detection. In: Tech report GIT-GVU-05-28. (2005)7. Dalal, N., Triggs, B.: Histograms of oriented gradients for human detection. In:
CVPR. (2005)8. Serre, T., Wolf, L., Poggio, T.: Object recognition with features inspired by visual
cortex. In: CVPR. (2005)9. Torralba, A., Murphy, K., Freeman, W.: Contextual models for object detection using
boosted random fields. In: NIPS. (2004)10. Torralba, A., Murphy, K., Freeman, W.: Sharing visual features for multiclass and
multiview object detection. PAMI (2007)11. Torralba, A., Oliva, A., Castelhano, M.S., Henderson, J.M.: Contextual guidance of
eye movements and attention in real-world scenes: the role of global features in objectsearch. Psychol Rev (2006)
12. Leibe, B., Cornelis, N., Cornelis, K., Gool, L.V.: Dynamic 3d scene analysis from amoving vehicle. In: CVPR. (2007)
13. Nuchter, A., Lingemann, K., Hertzberg, J., Surmann, H.: Accurate object localizationin 3d laser range scans. In: IEEE. (2005)
14. Rabbani, T., van den Heuvel, F.: Efficient hough transform for automatic detectionof cylinders in point clouds. In: ISPRS. (2005)
15. Chen, H., Wulf, O., Wagner, B.: Object detection for a mobile robot using mixedreality. In: VSMM. (2006)
16. Diebel, J., Thrun, S.: An application of markov random fields to range sensing. In:NIPS. (2006)
17. Torres-Mendez, L.A., Dudek, G.: Reconstruction of 3d models from intensity imagesand partial depth. In: AAAI. (2004)
18. Yang, Q., Yang, R., Davis, J., Nister, D.: Spatial-depth super resolution for rangeimages. In: CVPR. (2007)
19. Liu, D., Nocedal, J.: On the limited memory method for large scale optimization. In:Mathematical Programming B. Volume 45. (1989) 503–528
20. Friedman, J., Hastie, T., Tibshirani, R.: Additive logistic regression: a statistical viewof boosting. Technical report, Dept. of Statistics, Stanford University (1998)