integrating wind at pjm · integrating wind at pjm windiana 2010 indianapolis july 21, 2010 paul...
TRANSCRIPT

PJM©2010
Integrating Wind at PJM
Windiana 2010
Indianapolis
July 21, 2010
Paul McGlynn
General Manager
System Planning
PJM
PJM©20102
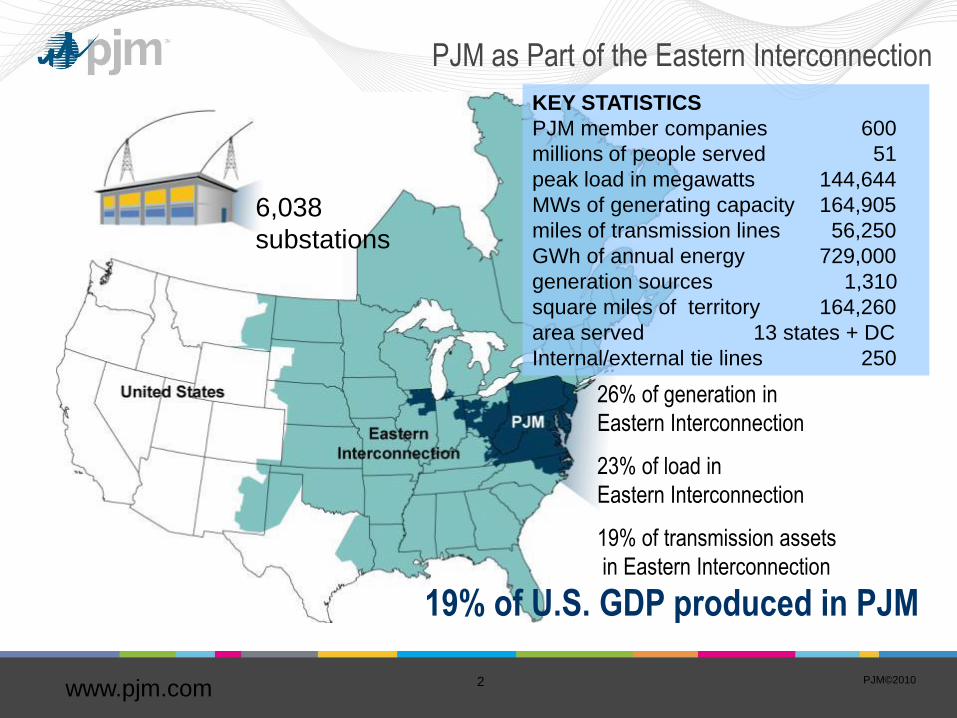
PJM as Part of the Eastern Interconnection
KEY STATISTICS
PJM member companies 600
millions of people served 51
peak load in megawatts 144,644
MWs of generating capacity 164,905
miles of transmission lines 56,250
GWh of annual energy 729,000
generation sources 1,310
square miles of territory 164,260
area served 13 states + DC
Internal/external tie lines 250
26% of generation in
Eastern Interconnection
23% of load in
Eastern Interconnection
19% of transmission assets
in Eastern Interconnection
19% of U.S. GDP produced in PJM
6,038
substations
www.pjm.com
PJM©20103
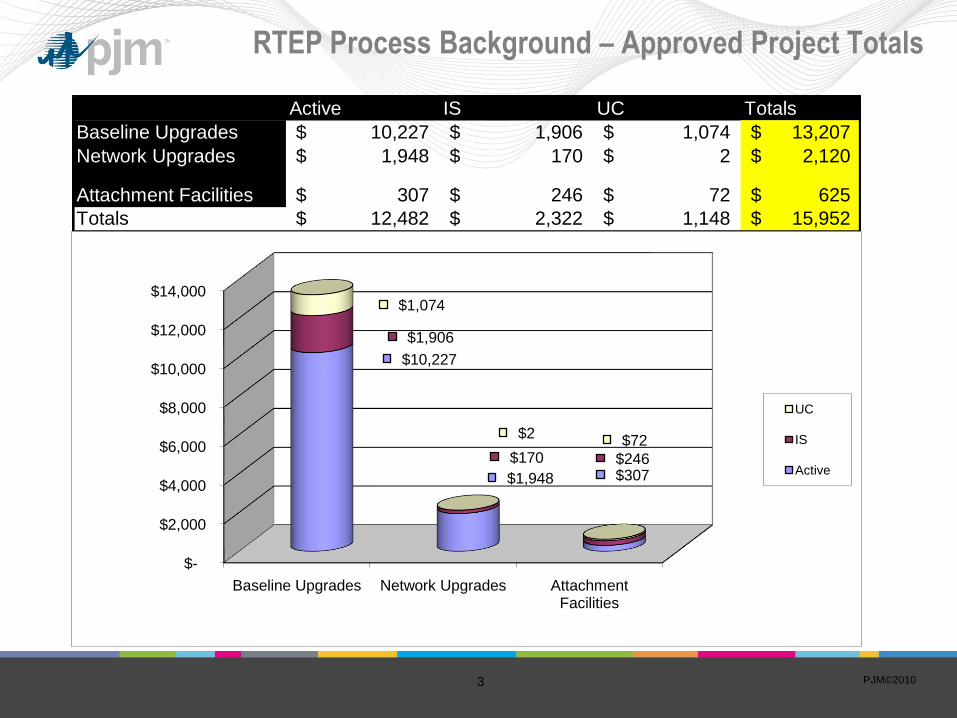
RTEP Process Background – Approved Project Totals
Active IS UC Totals
Baseline Upgrades 10,227$ 1,906$ 1,074$ 13,207$
Network Upgrades 1,948$ 170$ 2$ 2,120$
Attachment Facilities 307$ 246$ 72$ 625$
Totals 12,482$ 2,322$ 1,148$ 15,952$
$-
$2,000
$4,000
$6,000
$8,000
$10,000
$12,000
$14,000
Baseline Upgrades Network Upgrades Attachment Facilities
$10,227
$1,948 $307
$1,906
$170 $246
$1,074
$2 $72
UC
IS
Active
PJM©20104
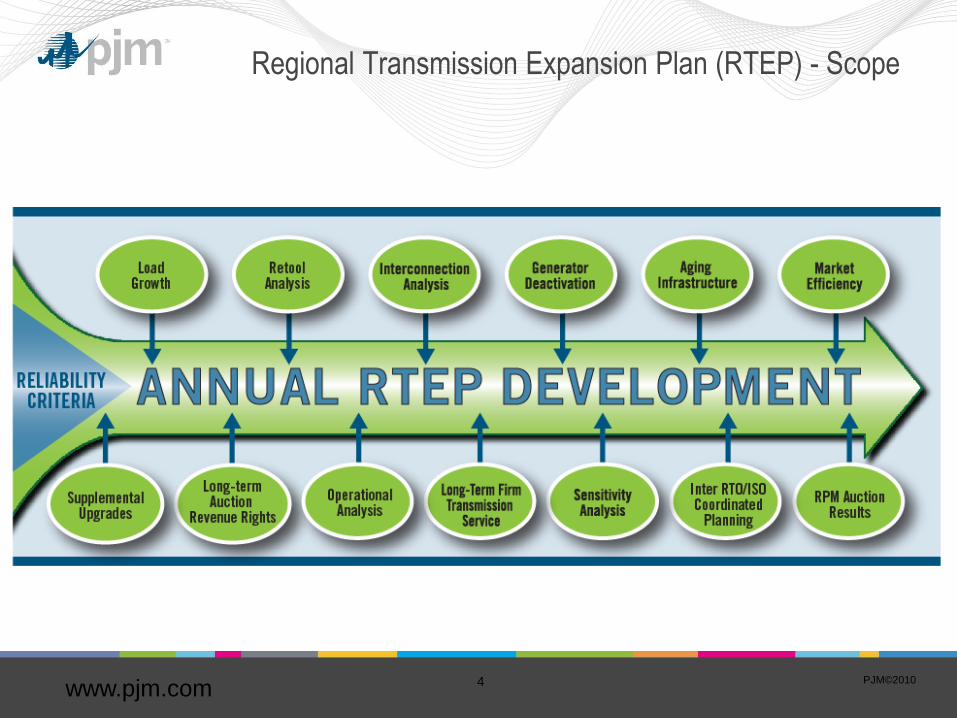
Regional Transmission Expansion Plan (RTEP) - Scope
www.pjm.com
PJM©20105
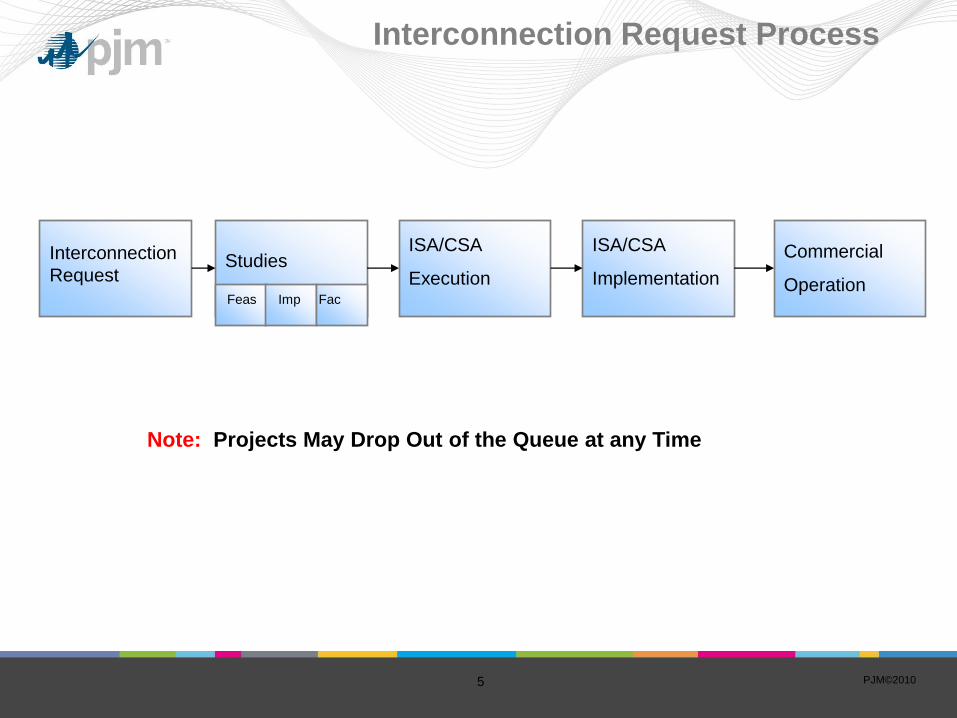
Interconnection
RequestStudies
ISA/CSA
Implementation
ISA/CSA
Execution
Commercial
Operation
Note: Projects May Drop Out of the Queue at any Time
Feas Imp Fac
Interconnection Request Process
PJM©20106
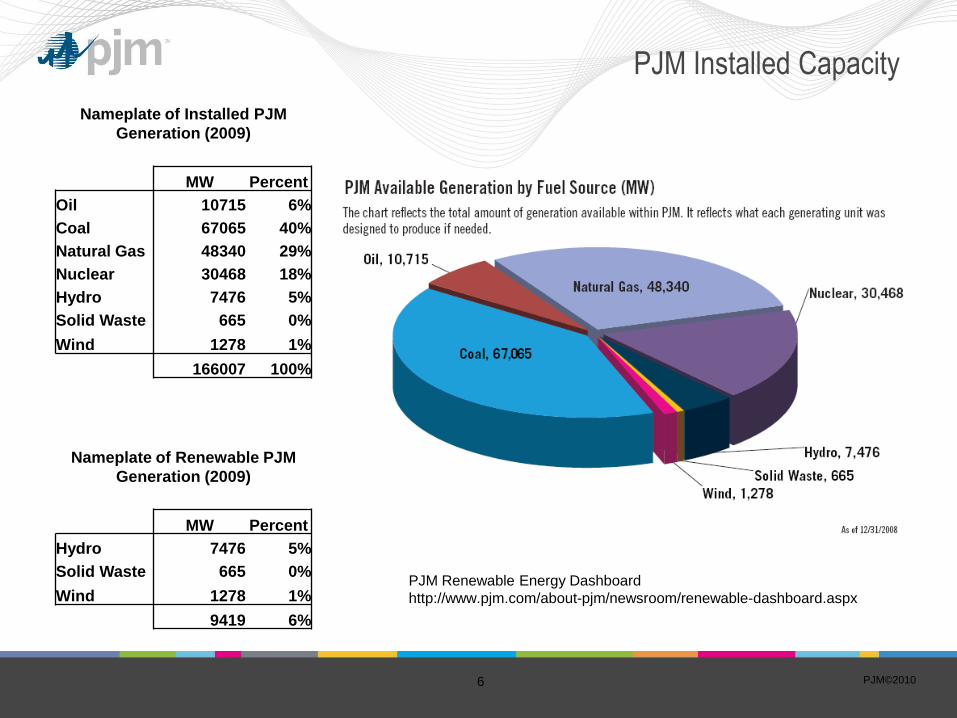
PJM Installed Capacity
Nameplate of Installed PJM
Generation (2009)
MW Percent
Oil 10715 6%
Coal 67065 40%
Natural Gas 48340 29%
Nuclear 30468 18%
Hydro 7476 5%
Solid Waste 665 0%
Wind 1278 1%
166007 100%
Nameplate of Renewable PJM
Generation (2009)
MW Percent
Hydro 7476 5%
Solid Waste 665 0%
Wind 1278 1%
9419 6%
PJM Renewable Energy Dashboard
http://www.pjm.com/about-pjm/newsroom/renewable-dashboard.aspx
PJM©20107
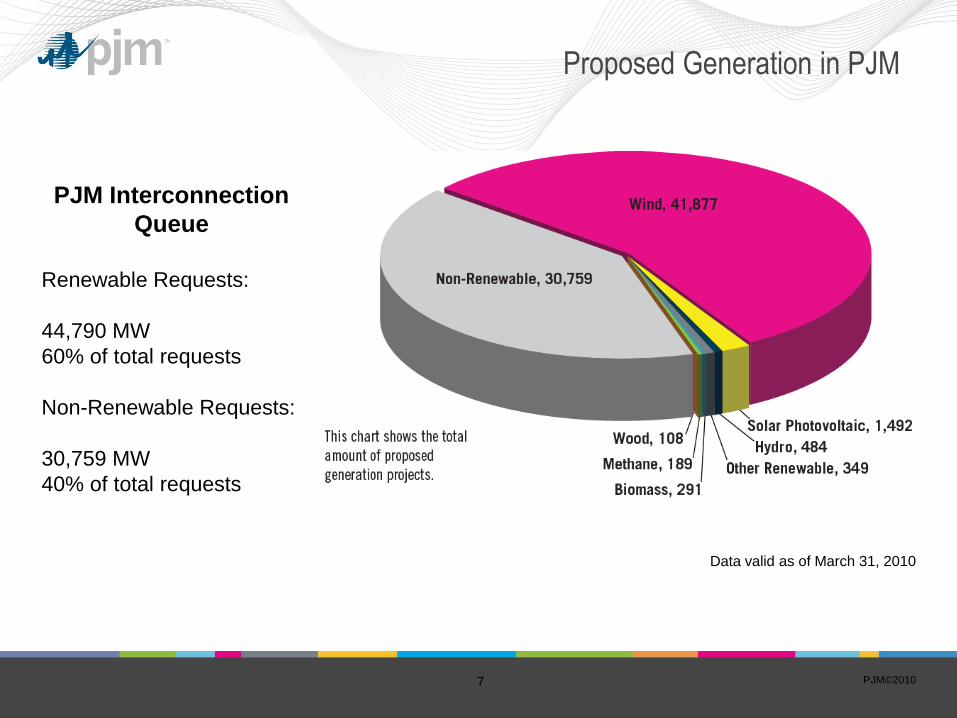
Proposed Generation in PJM
PJM Interconnection
Queue
Renewable Requests:
44,790 MW
60% of total requests
Non-Renewable Requests:
30,759 MW
40% of total requests
Data valid as of March 31, 2010
PJM©20108
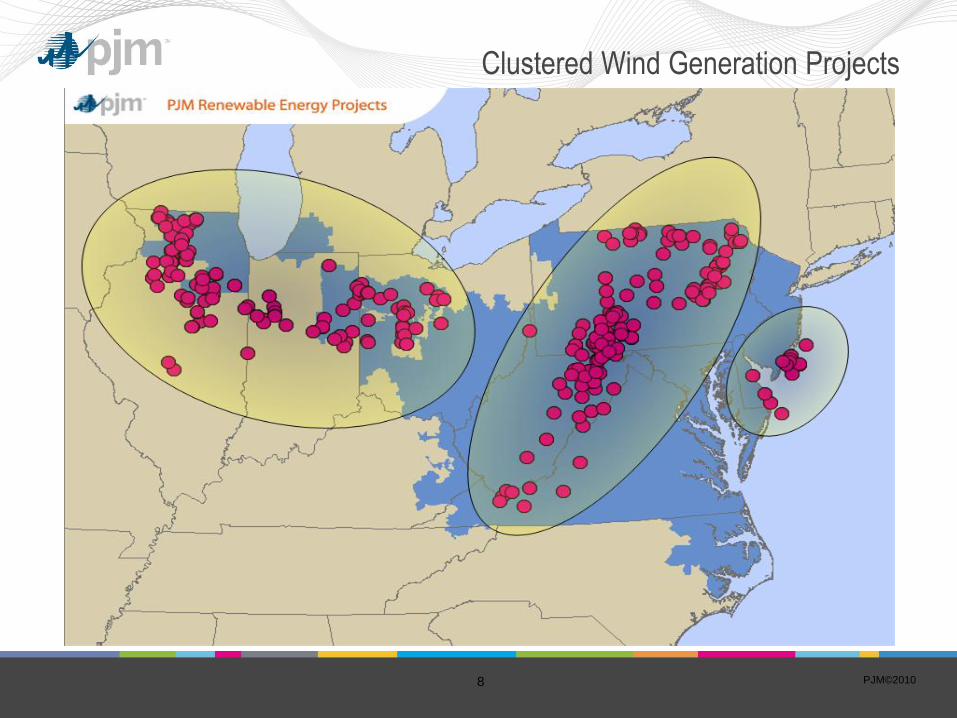
Clustered Wind Generation Projects
PJM©20109
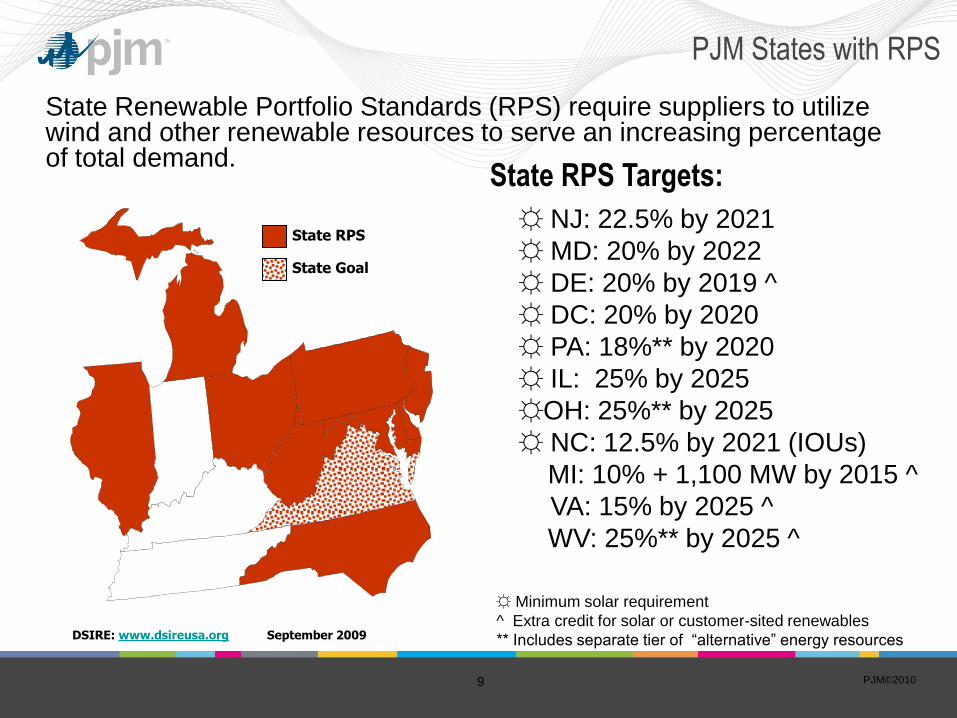
☼ NJ: 22.5% by 2021
☼ MD: 20% by 2022
☼ DE: 20% by 2019 ^
☼ DC: 20% by 2020
☼ PA: 18%** by 2020
☼ IL: 25% by 2025
☼OH: 25%** by 2025
☼ NC: 12.5% by 2021 (IOUs)
MI: 10% + 1,100 MW by 2015 ^
☼ VA: 15% by 2025 ^
WV: 25%** by 2025 ^
☼ Minimum solar requirement
^ Extra credit for solar or customer-sited renewables
** Includes separate tier of “alternative” energy resources DSIRE: www.dsireusa.org September 2009
State RPS Targets:
PJM States with RPS
State Renewable Portfolio Standards (RPS) require suppliers to utilize wind and other renewable resources to serve an increasing percentage of total demand.
State Goal
State RPS
PJM©201010
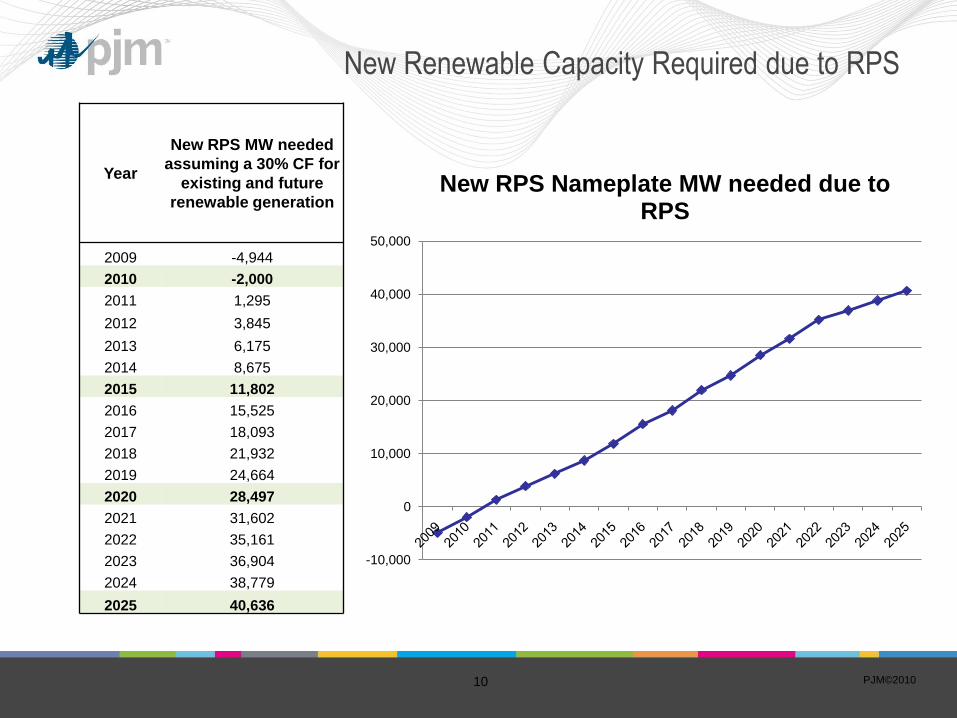
New Renewable Capacity Required due to RPS
Year
New RPS MW needed
assuming a 30% CF for
existing and future
renewable generation
2009 -4,944
2010 -2,000
2011 1,295
2012 3,845
2013 6,175
2014 8,675
2015 11,802
2016 15,525
2017 18,093
2018 21,932
2019 24,664
2020 28,497
2021 31,602
2022 35,161
2023 36,904
2024 38,779
2025 40,636
-10,000
0
10,000
20,000
30,000
40,000
50,000
New RPS Nameplate MW needed due to RPS
PJM©201011
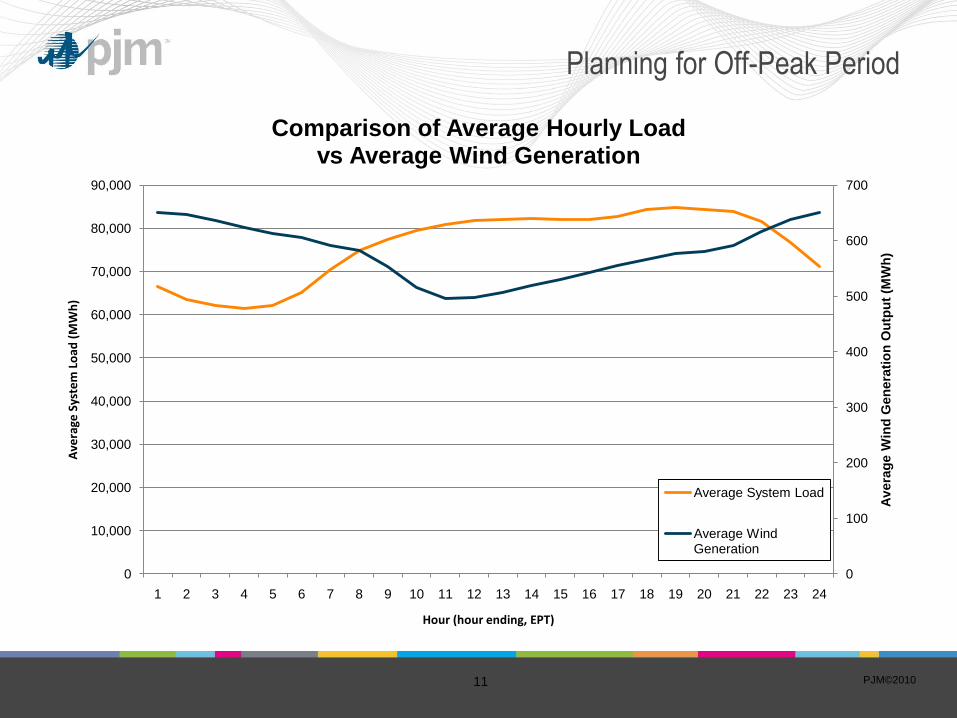
Planning for Off-Peak Period
0
100
200
300
400
500
600
700
0
10,000
20,000
30,000
40,000
50,000
60,000
70,000
80,000
90,000
1 2 3 4 5 6 7 8 9 10 11 12 13 14 15 16 17 18 19 20 21 22 23 24
Av
era
ge W
ind
Gen
era
tio
n O
utp
ut
(MW
h)
Ave
rage
Sys
tem
Lo
ad (
MW
h)
Hour (hour ending, EPT)
Comparison of Average Hourly Load vs Average Wind Generation
Average System Load
Average Wind Generation
PJM©201012
0
20
40
60
80
100
120
0 20 40 60 80 100 120
To
tal W
ind
Ou
tpu
t (%
)
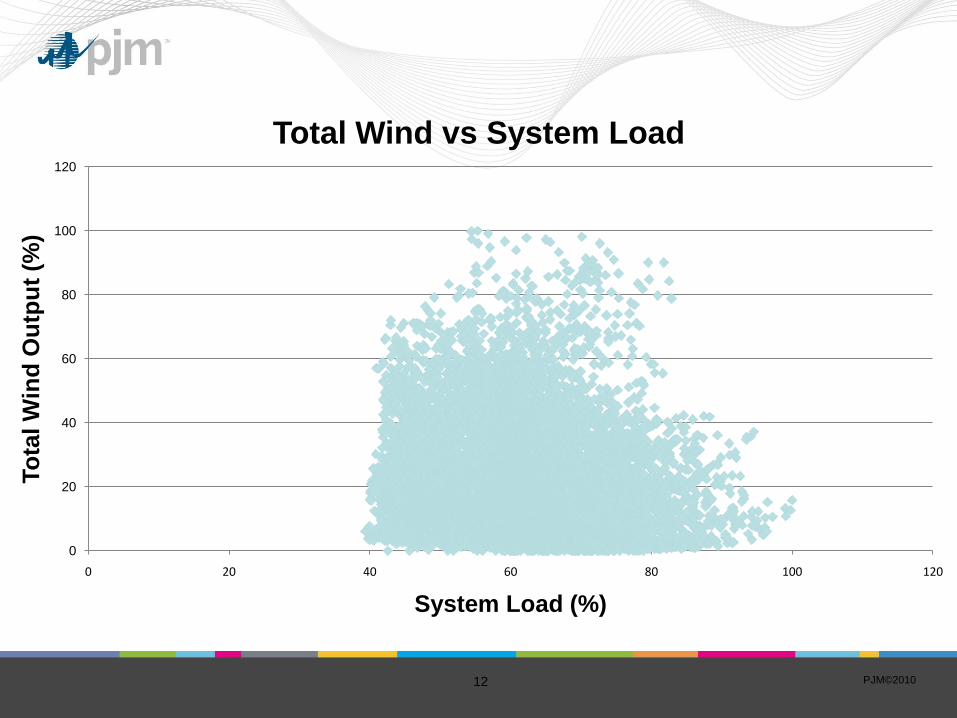
System Load (%)
Total Wind vs System Load
PJM©201013
PJM Initiatives to Address Operational and Reliability Impacts
• Off-peak planning criteria
• Implemented a centralized wind power forecasting service in April
2009 for use in PJM reliability assessments:
– Day Ahead (Medium-Term Wind Power Forecast)1. predict day-ahead congestion and mitigating strategies
2. ensure sufficient generation resources are scheduled to meet reserve requirements
– Real-Time (Short-Term Wind Power Forecast)1. evaluate current day congestion
2. ensure that sufficient generation resources are available to respond to real-time or
projected fluctuations in Wind Power Output.
• Implemented changes to improve wind resource management.
– Generating resources are now able to submit negative price offers, enabling wind
resources to submit flexible offers that better reflect the price at which they will
reduce output.
PJM©201014
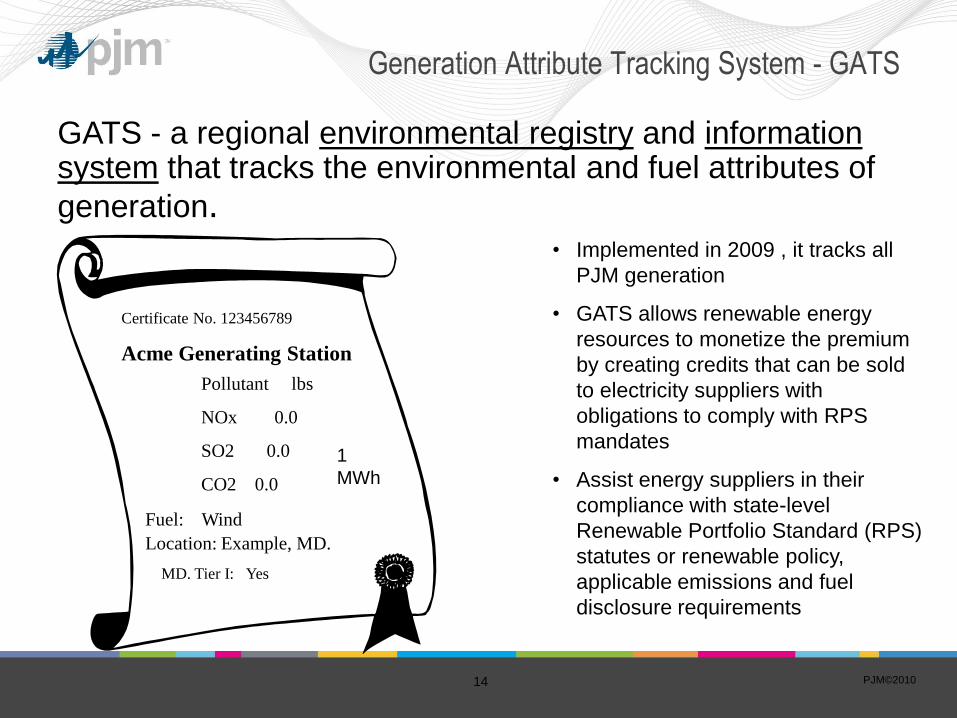
GATS - a regional environmental registry and information system that tracks the environmental and fuel attributes of
generation. • Implemented in 2009 , it tracks all
PJM generation
• GATS allows renewable energy
resources to monetize the premium
by creating credits that can be sold
to electricity suppliers with
obligations to comply with RPS
mandates
• Assist energy suppliers in their
compliance with state-level
Renewable Portfolio Standard (RPS)
statutes or renewable policy,
applicable emissions and fuel
disclosure requirements
Certificate No. 123456789
Pollutant lbs
NOx 0.0
SO2 0.0
CO2 0.0
Acme Generating Station
Fuel: Wind
Location: Example, MD.
MD. Tier I: Yes
1
MWh
Generation Attribute Tracking System - GATS
PJM©201015
Looking to the Future
• Flexible resources will be needed to offset the
impacts of variable generating resources
• New market players:
– Price Responsive Demand
– Smart Grid Technologies
– Energy Storage Resources• battery arrays
• flywheels
• compressed air energy storage
• plug-in hybrid electric vehicles (PHEVs)