integration of ground access to airports in measures of
TRANSCRIPT

USDOT Region V Regional University Transportation Center Final Report
IL IN
WI
MN
MI
OH
NEXTRANS Project No. 119OSUY2.1
Integration of ground access to airports in measures of inter-urban accessibility
By
Morton E. O’Kelly, PhD Professor & Chair, Department of Geography
The Ohio State University [email protected]
Yongha Park, PhD
Post-Doctoral Researcher, Center for Urban and Regional Analysis The Ohio State University

DISCLAIMER
Funding for this research was provided by the NEXTRANS Center, Purdue University under Grant No. DTRT12-G-UTC05 of the U.S. Department of Transportation, Office of the Assistant Secretary for Research and Technology (OST-R), University Transportation Centers Program. The contents of this report reflect the views of the authors, who are responsible for the facts and the accuracy of the information presented herein. This document is disseminated under the sponsorship of the Department of Transportation, University Transportation Centers Program, in the interest of information exchange. The U.S. Government assumes no liability for the contents or use thereof.

USDOT Region V Regional University Transportation Center Final Report
TECHNICAL SUMMARY
NEXTRANS Project No 019PY01Technical Summary - Page 1
IL IN
WI
MN
MI
OH
NEXTRANS Project No. 119OSUY2.1 Final Report, July 7, 2017
Integration of ground access to airports in measures of inter-urban accessibility
Introduction
Since the Airline Deregulation Act (ADA) of 1978, strong competition among airlines, flight routes, and airports characterizes US aviation markets. The competitive market environment accelerated airline mergers and alliances with the entrance of low cost carriers (LCCs) in a wide range of segment markets throughout the country (Borenstein, 1992; Pels et al., 2000; Vowles and Lück, 2013). Customers have easy access to market information including accessible departing airports, air fares and flight schedules with the spread of online air travel services (The Economist, 2005). Major cities (e.g. New York, San Francisco, and Los Angeles) are largely served by combinations of core and secondary airports, also called multiple airport regions (MARs). Airport choice of local residents and market competition among the adjacent facilities are two of core themes in the air transportation sector. In parallel, airport competition in many regional airports also raises concerns about losses from less profitable connections, which has promoted the Essential Air Service (EAS) program for small and geographically isolated communities for almost 40 years (Park and O’Kelly, 2017). Despite the federal subsidies, the local airports still suffer from competition with their nearby larger counterparts and with other ground mode(s) particularly in short-haul trip markets (Lian and Rønnevik, 2011). Those observations indicate that in the highly competitive air travel markets, uncertainty of market share losses, i.e. passenger leakage problems, prevail across both major cities and local communities.
Geographic dimensions provide an essential view to characterize the leakage problem in airports’ catchment areas. An airport is likely to be favorable for attracting trip demands from its nearby local communities but there are variable trade-offs by local residents with differential levels of air service quality served by accessible airports (Fuellhart, 2007). Fuellhart (2007) mentions that “Substitution, or market area ‘leakage’, occurs when travelers avoid using the local airport in their regions, and use other (out-of-region) airports to take advantage of lower fares and more convenient airline services (p.231).” Fuellhart (2007) observes in Washington-Baltimore MRA a strong distance decay in catchment area of Harrisburg airport competing with BWI. Size of catchment area and market share within the area are strongly affected by relative competitiveness of the airport to its surrounding airports with possible
NEXTRANS Project No 019PY01Technical Summary - Page 2
overlap (Lieshout, 2011). This also corresponds to a rich literature for the airport choice and passenger trip preference in MARs. (Windle and Dresner, 1995; Hess and Polak, 2005; Skinner, 1976; Basar and Bhat, 2004; Fuellhart, 2007; Gosling, 2006; Gupta et al., 2008), confirming that geographic proximity (ground access time) and LOS offered by airport such as flight cost, frequency, and time are the core factors on the decision process. Finally, catchment areas are not static, but evolve over time depending on relative changes in the service offerings of airports. Park and O’Kelly have also studied the changes in accessibility (papers attached) and published the results in a peer reviewed journal: Environment and Planning.
Commercial air travel can only be accessed through a limited set of locations (airports). Air trip patterns are distinctive across geographic markets and airports, reflecting the local trip demands around the facilities as well as routing strategies of airlines operating there. The passenger journeys are made up of a combination of multi-transport modes: ground access via private car or (and) public transit to an origin departure airport and direct or indirect flight(s) via a few stopover(s) from the origin airport. There is a trade-off on the passengers’ airport choice between the ease of ground access, possibly to their nearest airport, and the level of air service (LOS) at another airport. It is possible that an airport located farther away provides better service. The question then is the trade-off of distance to the further place vs the improved service options there. Among the various factors determining the level of airport service quality (LOS), the routing of local trip demands is a critical factor to serve more convenient trip routes for customers. In this perspective, entire journey time through the ground and air trips is a key element to evaluate the expected journey time efficiency of an airport in comparison to those through other neighboring counterparts. This also can be a base to examine the reliability of an airport’s catchment area against the passenger leakage problem with respect to both the ground access to, and routing service of, each airport. It is expected that the reliability of catchment areas is spatially uneven, possibly affected by the geographic distribution of limited access points (i.e. airports) and their variable routing services for carrying local trip demands.
This report primarily focuses on the spatial variation of air passenger trip times through the dual transport modes, ground access to and flight routing between airports, in an empirical data-driven assessment. Expected journeys from individual census tracts in the contiguous 48 states (and D.C.) are derived by connecting each tract with its neighboring airports at which actual air passenger trips observed, then the ground access and flight time of each observed air trip is measured, using various empirical sources. Since the locally accessible airports vary across communities, a set of accessible airports is given for each community, which is in turn a base to define the community’s local travel market with airports competing there. A community-specific relative journey time ratio is designed to evaluate the competitiveness of their nearest airport against other local competitors. The estimation allows us to explore potentially vulnerable regions by strong airport competition regarding the leakage problem, which in the past literature has been largely investigated for MARs within limited geographical boundaries through surveys. This effort is expected to suggest future research sites for investigating passenger travel behavior and airport competition even among local airports.

NEXTRANS Project No 019PY01Technical Summary - Page 3
Findings
For each census tract, the relative time ratio designed in this paper evaluates the combined passenger journeys of ground access (from a tract to its nearest airport) and air trips (from the airport to destination airports observed in the local demand market) in relation to their respective shortest times available within accessible alternatives. Overall, the result averaged across the US domestic market is 1.09, indicating that passengers in a tract need 9% more time for air trips to their desired destinations than the locally available shortest options when using their nearest airport. Table 1 presents the descriptive statistics of the estimated time ratio sorted by size-based groups of nearest airports. The negative relationship between the average ratio and airport size is reasonable: passengers living around larger airports show relatively lower journey time closer to the minimum, benefiting from a wider range of direct connections served by these airports. This in turn presents the competitiveness of large airports against their neighboring smaller competitors in general so as to carry their local trip demands more time-efficiently.
Table 1. Statistics of the tract-specific relative time ratios by group of nearest airport
Airport group
(# of airports)
Count of associated tracts
Average of relative time ratio
S.D. of relative time ratio
LARGE
(29) 20678 1.0557 0.0696
MEDIUM
(29) 15404 1.0872 0.0957
SMALL
(69) 16861 1.1035 0.0964
NONHUB
(184) 19321 1.1321 0.1015
NONPRIMARY (1)
21 1.1702 0.0649
All airports (312) 72285 1.0940 0.0954
Figure 1 shows the geographic distribution of tract-specific relative ratios with the boundaries (white line) of airport-specific catchment areas based on tract-to-airport ground access time. The resulting

NEXTRANS Project No 019PY01Technical Summary - Page 4
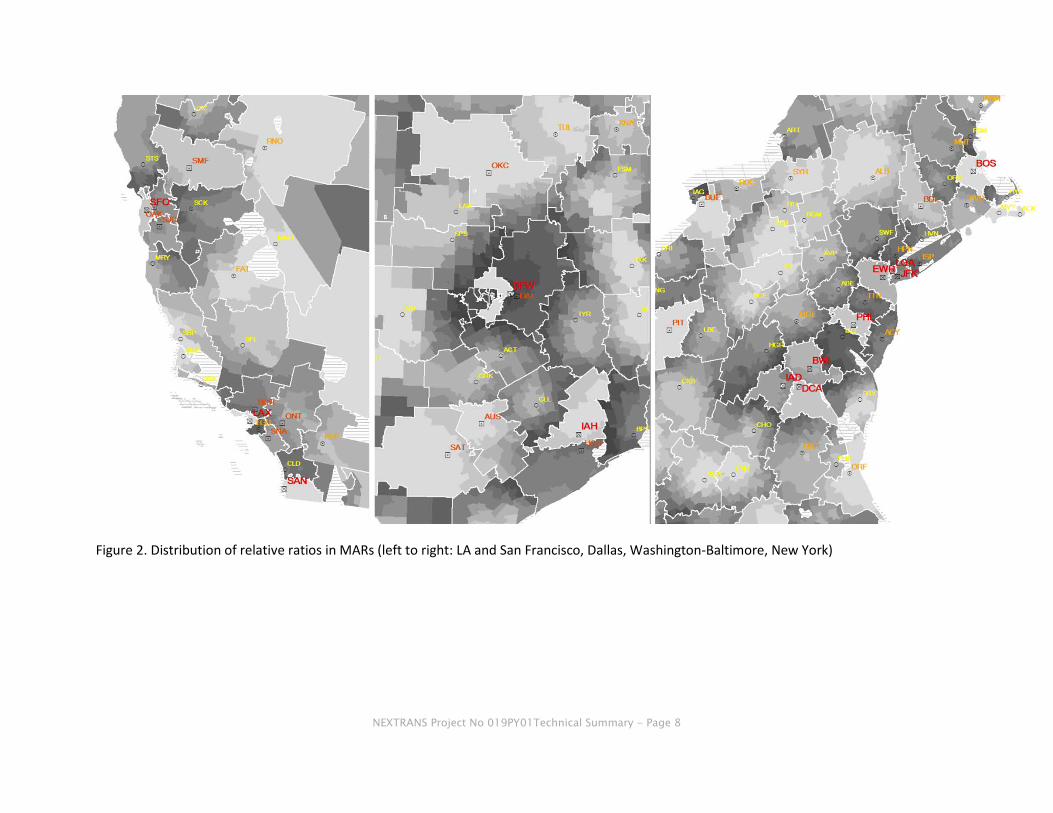
patterns make sense with the strong effect of proximity of individual tracts to their accessible origin airports. The estimates are usually smaller around each airport, then increase as being farther away. The geographic extent to which low values are concentrated is determined by competitiveness of ground and flight journey times via the airport against its neighboring competitors. Low values are largely observed around geographically isolated local airports with few alternatives located far away and regional or national hubs competing with smaller airports. On the other hand, high values are usually observed around the boundaries of ground-access based catchment areas. Particularly, they form a clear ring surrounding catchment areas of some large- and medium-size airports such as ATL, CLT, MSP, DEN (in the large airport group) and ABQ, BNA, STL, MCI, RDU (in medium airport group). Also, the ring is shaped much smaller in large cities in which core and secondary airports are densely located such as LAX with BUR, SNA, and ONT in LA, SFO with OAK and SJC in San Francisco (Basar and Bhat, 2004; Hess and Polak, 2004), DFW with DAL in Dallas, and IAH with HOU in Houston. Note that those secondary airports are medium-size, trying to share short-haul trip demands at the national hubs (Park and O’Kelly, 2016). This is quite distinctive from other MARs such as New York (JFK, EWR, and LGA; Gupta et al., 2008) and Washington-Baltimore (BWI, DCA, IAD; Fuellhart, 2007) in which the core airports associated in the large group are close to one another so that the ring forms surrounding the adjacent airports together rather than a single airport. The ground-access based catchment areas are shaped dependent on the geographic distribution of national airport system, and the small catchment areas of those core airports are somewhat unrealistic. However, the resulting ratio patterns are significant reflecting the aviation market reality; the high values observed near the large- and medium-size airports indicate that the MARs are highly competitive markets, providing several alternative accessible options of similar LOS (level of service) to passengers, also recognized by the previous studies for the passengers’ airport choice behavior. This contrasts to the large airports located in the central regions, ATL, MSP, and DEN where catchment areas are relatively larger and show concentrated patterns of low values with small variations, which in turn indicates a stability of their catchment areas regarding the passenger airport choice problem. It should be noted that this research is not intended to delineate a clear geographic boundaries of airport catchment area. Rather, it is to examine geographic distribution of potentially stable and unstable areas, regarding the passenger airport choice and airport leakage problem based on trip time efficiency. The ground-access base boundaries provide a useful frame to evaluate them.
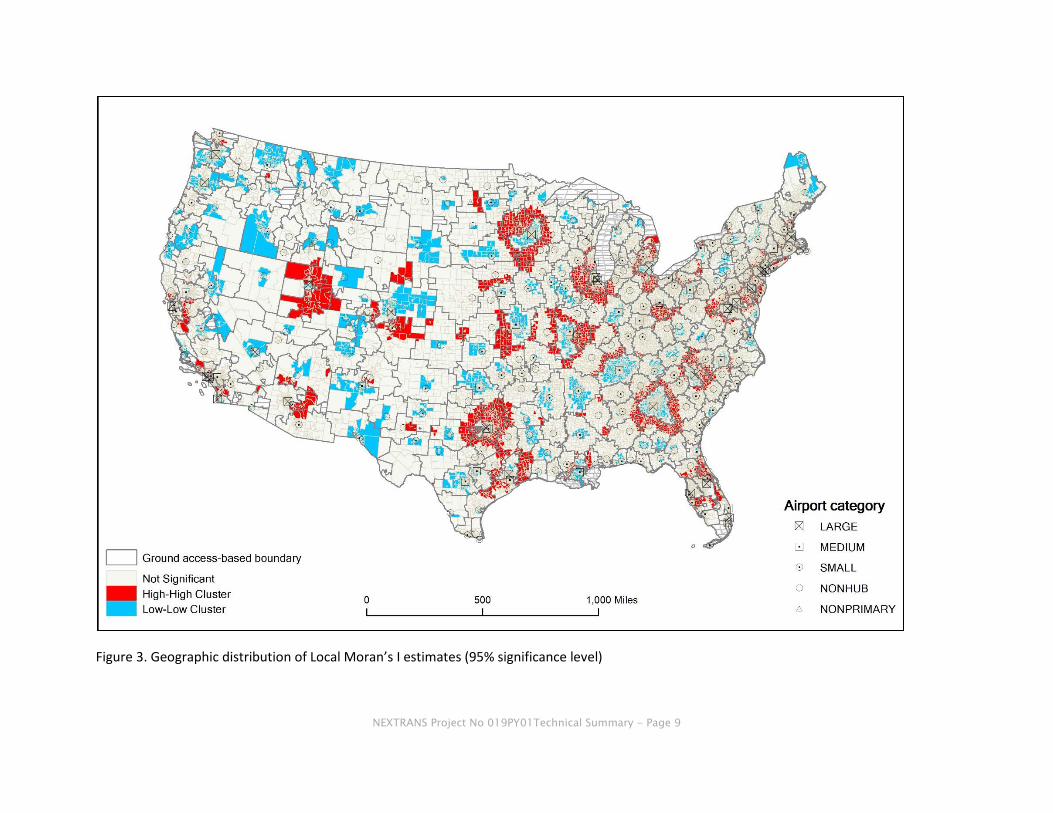
To explore spatial clusters of the relative time estimates, local Moran’s I (Anselin, 1995), which is one of well-known Local Indicators of Spatial Association (LISA), is applied. It measures at a local area scale the tendency of each spatial unit (e.g. tract) to have a value that is correlated with the values in the nearby areas. Through quadrants of Moran scatterplot, four types of relationships are identified between a tract and its adjacent tracts: High-High (H-H), Low-Low (L-L), High-Low(H-L), and Low-High (L-H). For example, H-L relationship indicates a tract with high value is surrounded by tracts with low values. Focusing on H-H and L-L, Figure 1 represents spatial clusters of these relationships at 95% significance level (p=0.05). H-H clusters (red cells) are likely to be regions that experience severe leakage problem because superior routing ability of nearby larger airport(s) can attract local trip demands while L-L clusters (blue cells) are the opposite. In addition to the MARs including San Francisco, Los Angeles, Dallas-Houston, Washington-Baltimore, New York city, Chicago, the high value clusters are also observed, surrounding L-L clusters around somewhat isolated core or medium-size airports: SLC (Utah),

NEXTRANS Project No 019PY01Technical Summary - Page 5
MSP (Minnesota), DEN (Denver), MCI and STL (Missouri), ATL (Georgia), CLT (North Carolina), BNA (Tennessee). Those airports provide more efficient routing service with wider connections than nearby smaller airports, so possibly attract local trip demands from larger areas beyond their catchment areas.
In sum, the relative time ratio is useful to explore the potential areas situated in the passenger leakage problem with respect to the journey time efficiency: high values indicate that the nearest airport provides less competitive air service in comparison with other accessible points so that passengers using the airport need to spend more time for their air journeys and might want to use another accessible point to reduce the time, i.e. the passenger leakage problem is expected to occur. In contrast, low values mean that the nearest airport serve for the local trip demand market with fairly competitive air service. The regions of low values are observed across airports of varying sizes, so their competitiveness can be a base in marketing strategy for both of major and local airports.
References
Anselin, L. (1995). Local indicators of spatial association—LISA. Geographical analysis, 27(2), 93-115.
Başar, G., & Bhat, C. (2004). A parameterized consideration set model for airport choice: an application to the San Francisco Bay area. Transportation Research Part B: Methodological, 38(10), 889-904.
Ben-Ayed, O. (2013). Timetabling hub-and-spoke parcel distribution inter-facility network. International Journal of Advanced Operations Management, 5(2), 159-180.
Borenstein, S. (1992). The evolution of US airline competition. The Journal of Economic Perspectives, 6(2), 45-73.
Fuellhart, K. (2007). Airport catchment and leakage in a multi-airport region: The case of Harrisburg International. Journal of Transport Geography, 15(4), 231-244.
Gosling, G. (2006). Predictive reliability of airport ground access mode choice models. Transportation Research Record: Journal of the Transportation Research Board, 1951, 69-75.
Gupta, S., Vovsha, P., & Donnelly, R. (2008). Air passenger preferences for choice of airport and ground access mode in the New York City metropolitan region. Transportation Research Record: Journal of the Transportation Research Board, 2042, 3-11.
Hess, S., & Polak, J. W. (2006). Exploring the potential for cross-nesting structures in airport-choice analysis: a case-study of the Greater London area. Transportation Research Part E: Logistics and Transportation Review, 42(2), 63-81.
Hess, S., & Polak, J. W. (2005). Mixed logit modelling of airport choice in multi-airport regions. Journal of Air Transport Management, 11(2), 59-68.

NEXTRANS Project No 019PY01Technical Summary - Page 6
Lian, J. I., & Rønnevik, J. (2011). Airport competition–Regional airports losing ground to main airports. Journal of Transport Geography, 19(1), 85-92.
Lieshout, R. (2012). Measuring the size of an airport’s catchment area. Journal of Transport Geography, 25, 27-34.
Park, Y., & O’Kelly, M. E. (2017). Exploring accessibility from spatial interaction data: An evaluation of the Essential Air Service (EAS) program in the contiguous US air transport system. Environment and Planning A, 49(4), 930-951.
Pels, E., Nijkamp, P., and Rietveld, P. (2000). Airport and airline competition for passengers departing from a large metropolitan area. Journal of Urban Economics, 48(1), 29-45.
The Economist. (Sep 29, 2005). The travel industry: Flying from the computer. Retrieved from: http://www.economist.com/node/4455692.
Vowles, T.M., Lück, M. (2013). Low Cost Carriers in the USA and Canada. In Gross, S., Lück, M. (Eds.), The Low Cost Carrier Worldwide (pp. 61-78), Burlington, VT: Ashgate Publishing.
Windle, R., & Dresner, M. (1995). Airport choice in multiple-airport regions. Journal of Transportation Engineering, 121(4), 332-337.

NEXTRANS Project No 019PY01Technical Summary - Page 7
Figure 1. Geographic distribution of tract-specific relative journey time ratios with ground access time-based airport catchment areas (white boundaries)
NEXTRANS Project No 019PY01Technical Summary - Page 8
Figure 2. Distribution of relative ratios in MARs (left to right: LA and San Francisco, Dallas, Washington-Baltimore, New York)
NEXTRANS Project No 019PY01Technical Summary - Page 9
Figure 3. Geographic distribution of Local Moran’s I estimates (95% significance level)

NEXTRANS Project No 019PY01Technical Summary - Page 10
Contacts For more information:
Morton O’Kelly The Ohio State University 1036 Derby Hall, 154 N Oval Mall Columbus, OH 43210 [email protected] (614) 292-8744
NEXTRANS Center Purdue University - Discovery Park 3000 Kent Ave. West Lafayette, IN 47906 [email protected] (765) 496-9724 www.purdue.edu/dp/nextrans