integration of natural resources into local government ... · web viewintegration of natural...
TRANSCRIPT

Integration of Natural Resource management into Local Government Decision Making
INTEGRATION OF NATURAL RESOURCES INTO LOCAL GOVERNMENT DECISION MAKING
TANZANIA COUNTRY REPORT
NOVEMBER 2009
G.KAJEMBE & E- MARAGERI
for
World Bank
WB3496-708/07
Project ID No. P058706
TZ/KEN/UGA Draft Country Report Page a

Contents
1. Executive Summary..............................................................................................................e
1.1 Main conclusions of the Tanzania case study............................................................................g
2. Introduction............................................................................................................................1
2.1 Background................................................................................................................................1
2.2 Study objective...........................................................................................................................2
2.3 Key concepts and definitions.....................................................................................................2
2.4 Study team and methodology....................................................................................................2
2.5 Structure of the report...............................................................................................................4
3. Socio Economic Importance of Natural resources................................................................6
3.1 Natural Resources Endowments................................................................................................6
3.1.1 Forest Resources...................................................................................................................6
3.1.2 Wildlife resources..................................................................................................................6
3.1.3 Marine Fisheries....................................................................................................................7
3.2 Contribution of natural resources to the economy...................................................................8
3.3 Natural Resources and Livelihoods..........................................................................................11
3.3.1 Loss of revenue....................................................................................................................13
4. Institutional framework for local NR Management..............................................................15
4.1 Local Government Administrative Structure and Functions....................................................15
4.1.1 LG Administrative Structures...............................................................................................15
4.1.2 Assignment of NRM functions to LGA according to LG Legislation.....................................16
4.1.3 LG Finance...........................................................................................................................18
4.1.4 LG Human Resources...........................................................................................................19
4.1.5 Local government reform programme................................................................................20
4.1.6 Opportunities and Challenges arising from LGRP for integration of NRM..........................20
4.1.7 Zanzibar Specific Issues.......................................................................................................21
4.2 Forest Policy and Legislation....................................................................................................22
4.2.1 Forest Policy of 1998...........................................................................................................22
4.2.2 Forest Act No. 14 of 2002....................................................................................................22
4.3 Wildlife Policy and the Conservation Act.................................................................................23
4.3.1 Wildlife Policy of 1998.........................................................................................................23
4.3.2 Wildlife Conservation Act No. 12 of 1974...........................................................................23
4.4 National Land Policy and Act....................................................................................................24
4.4.1 National Land Policy of 1999...............................................................................................24
4.4.2 The National Land Act 1999................................................................................................24
b

4.4.3 National Water Policy of 2002.............................................................................................24
4.5 Marine Policy and legislation...................................................................................................25
5. Experiences From Case Study Districts..............................................................................26
5.1 General Profile of the Districts.................................................................................................26
5.1.1 Overview.............................................................................................................................26
5.1.2 Natural Resources...............................................................................................................28
5.2 Legal and Institutional Framework..........................................................................................29
5.3 Local Government Planning Processes....................................................................................30
5.3.1 History of Planning in Tanzania...........................................................................................30
5.3.2 Opportunities and Obstacles to Development (O & OD)....................................................31
5.4 Local Government Regulatory Processes.................................................................................33
5.5 Natural Resource Sector Staff Position....................................................................................33
5.6 Natural Resource Revenue and Expenditure in the study districts..........................................34
6. Overall Conclusions............................................................................................................36
6.1 Incomplete Devolution............................................................................................................36
6.1.1 A ‘Cocktail’ of Deconcentration and Devolution.................................................................36
6.1.2 Local Democracy and improvement in natural resource management..............................36
6.2 Behavioural, Institutional and legal issues to resolve..............................................................37
6.2.1 The Dilemma of Let the ‘Power Go’....................................................................................37
6.2.2 Resistance to change: Decentralization and entrenched patronage patterns....................37
6.2.3 Lack of LG Institutional capacity?........................................................................................38
6.2.4 Management Plans..............................................................................................................39
6.2.5 incentives for integrating NR into LG Decision Making Mechanisms..................................39
6.2.6 Village leaders as law makers, law enforcers as well as judges..........................................39
6.3 Revenue generation from NRs.................................................................................................39
6.3.1 Reducing Management transaction costs...........................................................................39
6.3.2 Local Community uncertainty.............................................................................................40
6.3.3 The ‘others’: Private Sector and NGOs................................................................................40
6.4 Corruption................................................................................................................................40
6.4.1 Corruption in NR Sector.......................................................................................................40
6.5 Creating local accountability and Integration of local knowledge...........................................41
6.5.1 Emergence of a culture of standing up for one’s rights......................................................41
6.5.2 AAs, BMUs and Village Natural Resources Committees accountability..............................41
6.5.3 Integrating Local Knowledge in the Management of Natural Resources............................41
6.5.4 The Importance of Social Learning......................................................................................42
c

7. Conclusions & Recommendations for LG NR Grant...........................................................43
7.1 Proposals for NR Sector Window of the LGCDG......................................................................43
7.2 NR Grant Design Issues and Challenges...................................................................................46
7.2.1 Formula...............................................................................................................................46
7.2.2 Investment menu................................................................................................................47
7.2.3 Sharing with lower level local governments........................................................................48
7.2.4 Planning...............................................................................................................................48
7.2.5 Capacity building and Technical Assistance.........................................................................48
7.2.6 M&E.....................................................................................................................................48
7.3 Concluding Assessment of LG NR Grant...................................................................................49
8. References..........................................................................................................................50
9. Annex..................................................................................................................................52
Annex 1: Proposed NRM Grant Structure (Option 1)............................................................................52
Annex 2: NRM Investment Grant Structure - Option 2..........................................................................54
Annex 3: Basic LGA Finance and HR Data..............................................................................................55
Annex 4: People Met.............................................................................................................................58
List of Tables Table 1: Key Issues Explored in Case Study...................................................................................................f
Table 2: Issues Investigated during the field study......................................................................................3
Table 3: Ministry of Natural Resources and Tourism Annual Revenue 2003 and 2004...............................9
Table 4: Budget of the Ministry of Natural Resources and Tourism, by Sub-sector, 2002 -2004..............11
Table 5: Natural Resources Sector Staff in the Study Districts...................................................................33
Table 6: Income from Forestry and Fisheries subsectos for Morogoro district*.......................................34
Table 7: Income from forestry and wildlife subsectors for kiteto district..................................................34
Table 8: Income and expenditure from forstry, fisheries (marine) and wildlife subsectors for mafia district................................................................................................................................................35
Table 9: Income and expenditure from forestry, wildlife and fisheries subsector for muleba district......35
Table 10: implications of the two LG NR grant options..............................................................................46
Table 11: Local government financial resources FY 2001/02 - 2005/05....................................................55
Table 12: Expenditure decentralisation in Tanzania..................................................................................55
Table 13: Public Sector and LG Employment 1995-2006...........................................................................56
Table 14: Main Development Grants available to LGAs and associated guidelines/conditions................56
d
1. EXECUTIVE SUMMARY This report is part of a wider East African comparative study that explores experiences with local governments’ management of natural resources. Three country reports form the base for a synthesis report.
The rationale for study is the significant socio economic importance of natural resources and increasing – yet possibly underexploited – role of local governments in sustainably managing these resources in Tanzania, Kenya and Uganda.
The overall objective of this assignment was to explore and gain understanding as to what approaches are currently used by local governments to support natural resource management (NRM) and to identify mechanisms that would ensure natural resource management is further integrated into the planning and implementation processes of local government in the above three countries.
Fieldwork in Tanzania was conducted in four districts (see box 1 below). In each district the team explored local governments’ natural management practices with emphasis on three key sectors: forestry, fishery and wild life. The selection of the four districts was made primarily to capture a reasonable spectrum of the substantive variation in natural resource availabilities and management practices in local governments.
Box 1: Case Study Districts
District
(Region)
Land Area (Km2)
Key Features
Morogoro
(Morogoro Region)
11,925.00 Agriculture is the dominating economic activity but the district also includes substantive forest areas and has implementation experiences from Wild Life Management Areas. Also minor activities in support of fishery.
Mafia
(Coast Region)
1,017.00 Marine fishery is the dominating economic activity for the vast majority of residents on this island and also significant resource for district local revenue. Approximately half the district is designated marine reserve. Several modalities for community-based management of marine resources are implemented. There are also minor activities on support of wildlife and forestry.
Kiteto
(Manyara Region)
1,668.00 Kiteto district include significant forest areas and the concept of Participatory Forest Management has been applied for several years with substantive donor support. It is probably the district in Tanzania that has progressed most in implementing commercial use of the forest through PFM. There are also minor activities in support of wild life management and fishery.
Muleba*
(Kagera Region)
3,444.00 The district has both significant fishery resources (lake Victoria) and forest resources but has compared to other parts of Tanzania received limited donor/project support for NRM and the district was selected in part to identify typical non-donor funded NRM practices.
* Muleba district has over 20 Islands in the Lake Victoria with a surface water of 7,295 Km2
Initial literature review and fieldwork identified and explored a range of key issues in relation to local governments’ management of natural resources (summarised in table below).
e

TABLE 1: KEY ISSUES EXPLORED IN CASE STUDY
Issue Specific questions
Locally available Natural Resources
Overview of the available natural resources in the district -how much under jurisdiction of LG and how much outside LG jurisdiction: forestry, fisheries and wildlife
Legal and Institutional Framework
Views of central Government as well as LG staff and councillors regarding the appropriateness of current policies, laws and regulations for each of the main NRM sectors (forestry, wildlife, fisheries, water and land) The extent to which key management functions are assigned local
governments for NRM in a manner that facilitate the integration of NRM in LG planning,
The extent to which local government legislation, sector legislation, and subsidiary regulations are harmonized,
The extent to which various user committees have a clearly established legal and accountability relationship to local government institutions
Local Government NRM Staff Issues
Do LGs have the right number of qualified staff to undertake NRM functions? Is the staff motivated? And does NRM staff in local governments work primarily according to CG instructions or LG guidance?
Local Government Planning and Budget Process
Which NRM issues are included in LG plans and budgets at both District and sub district (ward, village) level,
How these issues have been integrated in LG plans and budgets – through O&OD or other processes?
Whats the relative importance of NR sectors compared to other sectors? Possibly to identify dominant interests in the planning process?
Local Government Regulatory Processes
What bylaws have been passed by the LGs? What key achievements have been noted? What have main problems been?
Local Government Revenue Collection Processes
What sources of revenue are generated from natural resource management,
What are the key achievements? And key obstacles?
Plans and activities by community sector groups
What types of user groups have been established? What are the main activities? Incomes/expenditures How do they relate to local government structures? What are the key achievements? And key obstacles?
NGOs and CBOs What NGOs and CBOs are active in the district? What are their main activities?
Donor Project and Harmonization
What donors and projects are active in the district? What are their main activities? What are the budgets and plans, are they
all reflected in LG budgets and accounts? What are the key achievements? And key challenges?
f

A common key aspect explored in all three countries is the extent to which ‘local government maturity’ determines the effectiveness of local governments NRM that mainly is analysed across the three countries in the comparative synthesis report.
On request, a final ‘unique’ major key issue explored in the Tanzania case study was the proposed local government Natural Resource (NR) Grant that seeks to mainstream various existing (donor funded) NR projects into the Local government Development Grant (LGDG) system.
1.1 MAIN CONCLUSIONS OF THE TANZANIA CASE STUDY 1. LGAs in Tanzania today have substantive formal and informal functions for natural resource
management and in particular in the forestry sector. It can be argued that many important policy and legal developments as well as practical experience have taken place within the last decade to justify and enable a more participatory approach for NRM through LGAs.
2. However, the legal assignment of functions for NRM to LGAs in Tanzania is still incomplete, as mandates of LGAs for management of NRs are only vaguely described in local Government Act and not clearly stipulated in relevant sector legislation in correspondence to the policy of decentralization by devolution. Real devolution of NRM is most contested when it threatens the widely occurring extraction of lucrative natural resource through local and centrally located elites.
3. The Tanzanian Village Government structures represent unique opportunities for institutionalization of democratic and community based management of NRs that have not yet been fully exploited. At the same time, underlying land tenure issues need to be addressed to make investments into land-based NRM sustainable.
4. NR sectors (in particular wildlife and fishery) have to a large extent created various formal and informal local institutions (i.e. Wildlife Management Areas or Beach Management Units) for management of NR in parallel to local government institutions. This temporarily satisfies demands on increased local ownership, but ultimately prevents a more integrated local approach to planning, budgeting and follow-up for NRM.
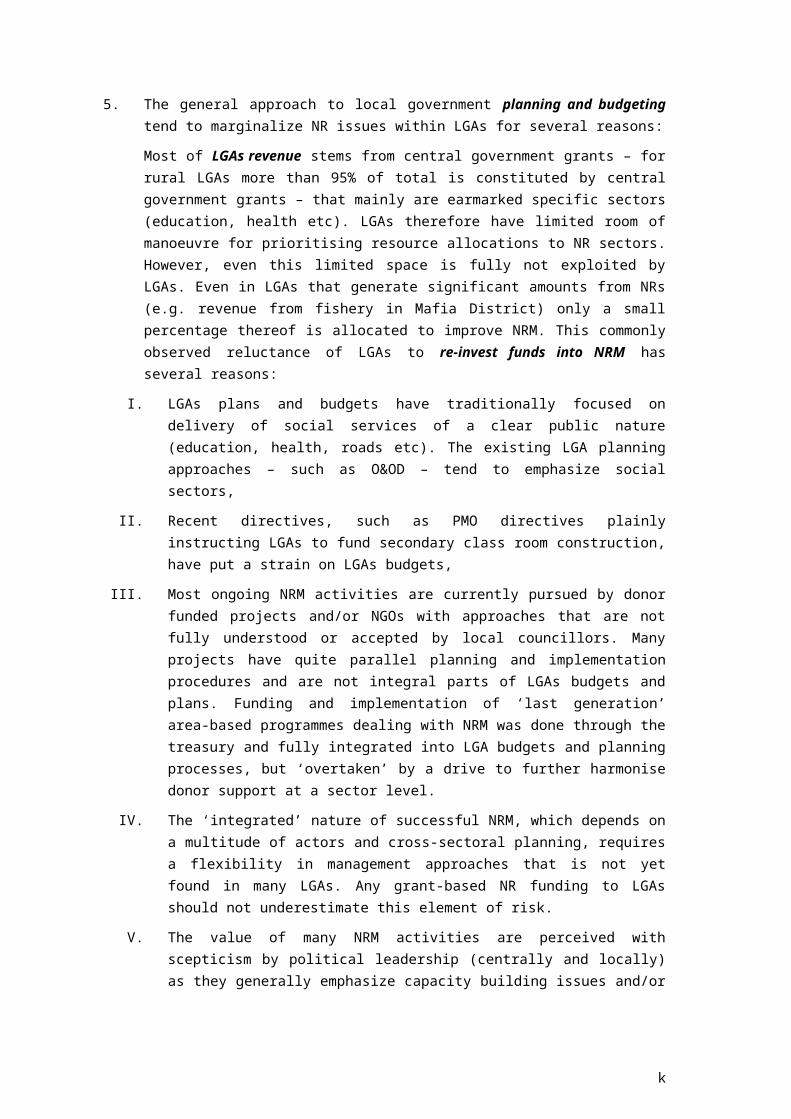
5. The general approach to local government planning and budgeting tend to marginalize NR issues within LGAs for several reasons:
Most of LGAs revenue stems from central government grants – for rural LGAs more than 95% of total is constituted by central government grants – that mainly are earmarked specific sectors (education, health etc). LGAs therefore have limited room of manoeuvre for prioritising resource allocations to NR sectors. However, even this limited space is fully not exploited by LGAs. Even in LGAs that generate significant amounts from NRs (e.g. revenue from fishery in Mafia District) only a small percentage thereof is allocated to improve NRM. This commonly observed reluctance of LGAs to re-invest funds into NRM has several reasons:
I. LGAs plans and budgets have traditionally focused on delivery of social services of a clear public nature (education, health, roads etc). The existing LGA planning approaches – such as O&OD – tend to emphasize social sectors,
II. Recent directives, such as PMO directives plainly instructing LGAs to fund secondary class room construction, have put a strain on LGAs budgets,
g

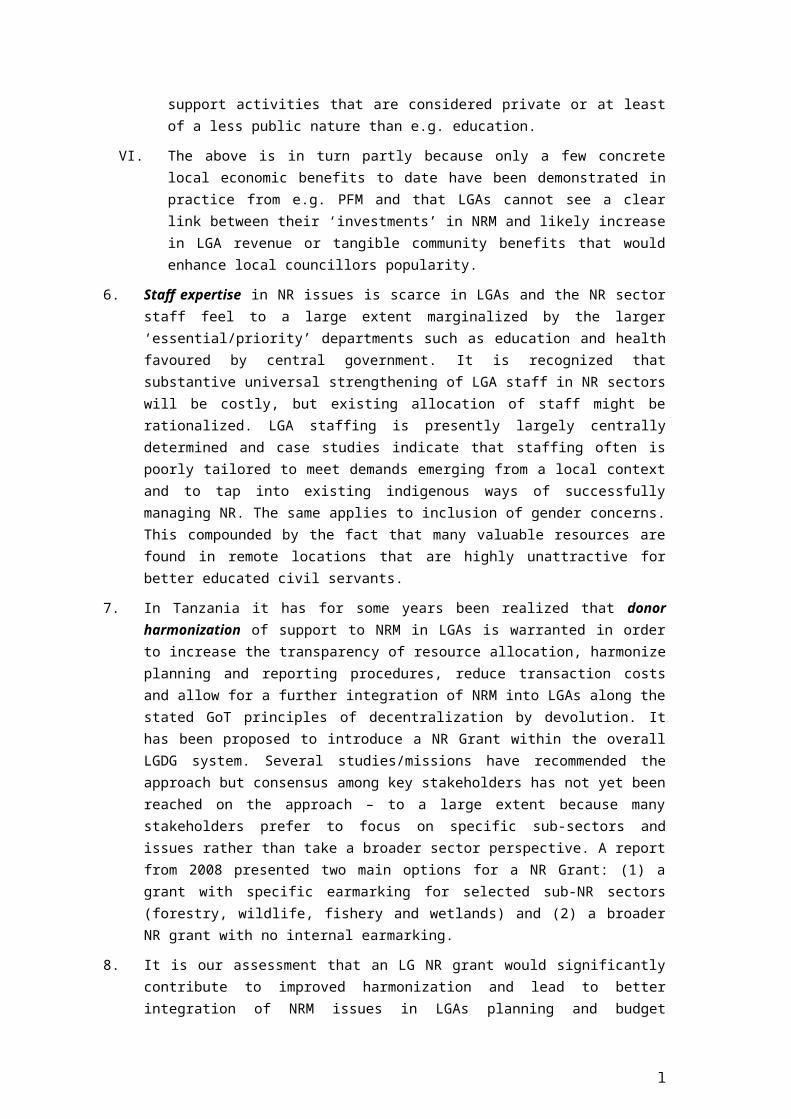
III. Most ongoing NRM activities are currently pursued by donor funded projects and/or NGOs with approaches that are not fully understood or accepted by local councillors. Many projects have quite parallel planning and implementation procedures and are not integral parts of LGAs budgets and plans. Funding and implementation of ‘last generation’ area-based programmes dealing with NRM was done through the treasury and fully integrated into LGA budgets and planning processes, but ‘overtaken’ by a drive to further harmonise donor support at a sector level.
IV. The ‘integrated’ nature of successful NRM, which depends on a multitude of actors and cross-sectoral planning, requires a flexibility in management approaches that is not yet found in many LGAs. Any grant-based NR funding to LGAs should not underestimate this element of risk.
V. The value of many NRM activities are perceived with scepticism by political leadership (centrally and locally) as they generally emphasize capacity building issues and/or support activities that are considered private or at least of a less public nature than e.g. education.
VI. The above is in turn partly because only a few concrete local economic benefits to date have been demonstrated in practice from e.g. PFM and that LGAs cannot see a clear link between their ‘investments’ in NRM and likely increase in LGA revenue or tangible community benefits that would enhance local councillors popularity.
6. Staff expertise in NR issues is scarce in LGAs and the NR sector staff feel to a large extent marginalized by the larger ‘essential/priority’ departments such as education and health favoured by central government. It is recognized that substantive universal strengthening of LGA staff in NR sectors will be costly, but existing allocation of staff might be rationalized. LGA staffing is presently largely centrally determined and case studies indicate that staffing often is poorly tailored to meet demands emerging from a local context and to tap into existing indigenous ways of successfully managing NR. The same applies to inclusion of gender concerns. This compounded by the fact that many valuable resources are found in remote locations that are highly unattractive for better educated civil servants.
7. In Tanzania it has for some years been realized that donor harmonization of support to NRM in LGAs is warranted in order to increase the transparency of resource allocation, harmonize planning and reporting procedures, reduce transaction costs and allow for a further integration of NRM into LGAs along the stated GoT principles of decentralization by devolution. It has been proposed to introduce a NR Grant within the overall LGDG system. Several studies/missions have recommended the approach but consensus among key stakeholders has not yet been reached on the approach – to a large extent because many stakeholders prefer to focus on specific sub-sectors and issues rather than take a broader sector perspective. A report from 2008 presented two main options for a NR Grant: (1) a grant with specific earmarking for selected sub-NR sectors (forestry, wildlife, fishery and wetlands) and (2) a broader NR grant with no internal earmarking.
8. It is our assessment that an LG NR grant would significantly contribute to improved harmonization and lead to better integration of NRM issues in LGAs planning and budget procedures – in particular if consensus can be reached on a general NR grant. However, the introduction of such a system will not in itself resolve many of the basic legal and institutional/capacity challenges in the sector, which prevents a fully integrated local government approach to NRM (for instance lack of clear and fair regulations for sharing of
h

NR revenues and lack of common institutional arrangements at village level for management of wildlife, fishery and forestry). Furthermore it must be realized that the challenges for design and implementation of the system in practice are very significant even if commitment to design principles can be gathered and sustained. These challenges relate to practical approaches for:
a) design of transparent and relevant formula,
b) practical procedures for fund sharing with lower level local governments,
c) considering ‘unique’ local conditions in a large and diverse Tanzania and respecting indigenous NR use patterns versus the need to standardise cost efficient procedures,
d) development of meaningful and practical minimum conditions and performance measurements,
e) M&E and national level support,
f) substantial institutional capacity building including initially substantial technical assistance based on comprehensive training needs assessment (both technical and managerial),
g) mobilization and sustaining regular and reliable levels of funding for the system.
i

2. INTRODUCTION
2.1 BACKGROUND This report is part of a wider East African comparative study that explores experiences with local governments’ management of natural resources. The rationale for study is the significant socio- economic importance of natural resources and increasing – yet possibly underexploited – role of local governments in sustainably managing these resources.
Natural Resources play an important role in economic growth and poverty reduction in Tanzania, Kenya and Uganda. In these countries, despite a progressing urbanization, the majority of the population lives in rural areas and depends on natural resources for their livelihood. Natural resources also contribute a significant portion of GDP and comprise a large percentage of these countries’ exports. Given their importance in these countries, the sustainable gender sensitive management of natural resources particularly in ways that can benefit the poor can provide a strong base for economic growth and hence pathways out of poverty. Sustainable NRM, for example maintaining of forest cover or water shed management, also contributes to mitigate expected impacts of climate change.
Decentralization reforms are currently ongoing in the three countries in the study. The nature of these reforms varies greatly although Tanzania and Uganda share many common features with regards to building fairly strong local governments with broad service delivery mandates over the last two decades. Kenya on the other hand has not embarked on any substantive devolution process since its independence. However some local governments also in Kenya still exercise significant powers with respect to utilization of natural resources. All three countries have embarked on other forms of “decentralization” whereby various user groups are given specific mandates in most sectors, including for management of natural resources.
Some of these decentralization reforms have fundamentally transformed the institutional setup and conditions for natural resource management. Among other things, depending on when a country instituted the decentralization reforms, or when responsibilities for natural resource management were devolved to particular local governments or the support accorded to the local government, the capacity of institutions responsible for natural resource management varies. Within and across countries, some local institutions are nascent and still in their formative stages, some are in an intermediate stage of development, while others are fully mature and capacitated.
At whatever level of maturity the potential of local government institutions to promote sustainable natural resource management critically hinges on: (i) understanding the importance of a sustainable natural resource base to economic growth and poverty reduction, (ii) how natural resource management is integrated in the institutions, (iii) presence of appropriate and responsive institutions, (iv) suitable capacity, planning and implementation tools, and (v) financing instruments/mechanisms that are in sync or tailored to the maturity level of the institutions.
This report is the Tanzania Country report for the assignment: Integration of Natural Resource Management into Local Government Decision Making” which is a comparative study undertaken in the three East African countries. One report is developed for each country in addition to one comparative synthesis report. The work is commissioned by the World Bank as an input to analysis of
NRM in LGs, TAN Final Report 1
the sector. The work is not directly linked to particular programme formulation or programme activities but is intended to broadly inform the World Bank, the respective national Governments and other interested stakeholders on issues related to the challenges and opportunities for integration of natural resource management issues into local governments.
2.2 STUDY OBJECTIVE
The overall objective of this assignment is to explore and gain understanding as to what approaches are currently used by LGs to support natural resource management and to identify mechanisms that would ensure natural resource management is fully integrated into the planning and implementation processes of local government in the above three countries.
However, the Tanzania case study also serves as an input to the specific ongoing discussion of aid harmonization in the natural resource management sector in the country through the Local Government Development Grant (LGDG) system as recommended by several recent reviews and sector studies1.
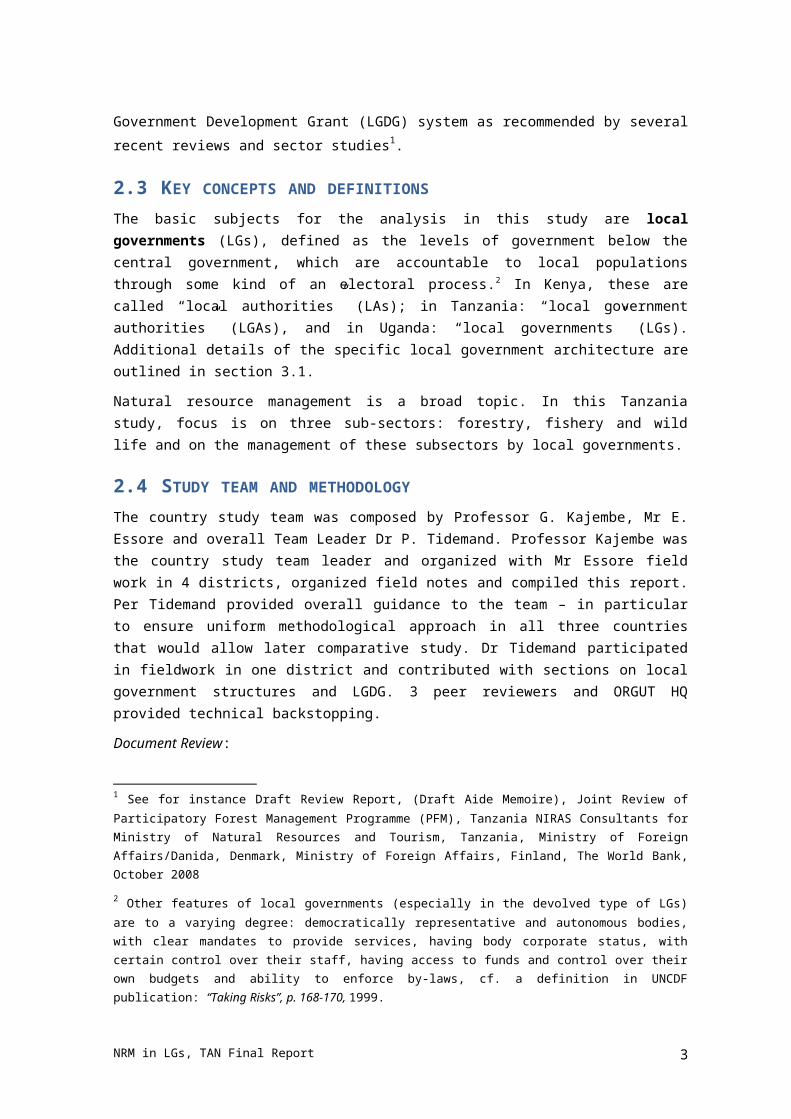
2.3 KEY CONCEPTS AND DEFINITIONS The basic subjects for the analysis in this study are local governments (LGs), defined as the levels of government below the central government, which are accountable to local populations through some kind of an electoral process.2 In Kenya, these are called “local authorities” (LAs); in Tanzania: “local government authorities” (LGAs), and in Uganda: “local governments” (LGs). Additional details of the specific local government architecture are outlined in section 3.1.
Natural resource management is a broad topic. In this Tanzania study, focus is on three sub-sectors: forestry, fishery and wild life and on the management of these subsectors by local governments.
2.4 STUDY TEAM AND METHODOLOGY
The country study team was composed by Professor G. Kajembe, Mr E. Essore and overall Team Leader Dr P. Tidemand. Professor Kajembe was the country study team leader and organized with Mr Essore field work in 4 districts, organized field notes and compiled this report. Per Tidemand provided overall guidance to the team – in particular to ensure uniform methodological approach in all three countries that would allow later comparative study. Dr Tidemand participated in fieldwork in one district and contributed with sections on local government structures and LGDG. 3 peer reviewers and ORGUT HQ provided technical backstopping.
Document Review:
A desk study involving literature review on natural resource management in the decentralized government system was done. It focused on examining the importance of natural resources at the national and local livelihood level, policies, laws and institutions governing natural resources as well 1 See for instance Draft Review Report, (Draft Aide Memoire), Joint Review of Participatory Forest Management Programme (PFM), Tanzania NIRAS Consultants for Ministry of Natural Resources and Tourism, Tanzania, Ministry of Foreign Affairs/Danida, Denmark, Ministry of Foreign Affairs, Finland, The World Bank, October 2008
2 Other features of local governments (especially in the devolved type of LGs) are to a varying degree: democratically representative and autonomous bodies, with clear mandates to provide services, having body corporate status, with certain control over their staff, having access to funds and control over their own budgets and ability to enforce by-laws, cf. a definition in UNCDF publication: “Taking Risks”, p. 168-170, 1999.
NRM in LGs, TAN Final Report 2
as the decision-making process in planning and financing natural resource management in the decentralized system.
Consultations with leaders in key sectors and support ministries:
Consultations with staff from the Prime Ministers Office Regional Administration and Local Government as well as relevant sector staff in Department of Fisheries, Wildlife and Forestry took place.
Presentations of preliminary findings
Preliminary findings of the study team were presented on two occasions to government, donor, client and NGO representatives in Dar es Salaam.
Consultations with local Governments:
After selecting the 4 field phase districts in consultation with the client (WB), a letter of introduction from the Permanent Secretary PMO-RALG outlining the objective and framework of the study was sent to the DED in each district to facilitate mobilization of officers and access to key documentation. Focus discussions were held with technical planning teams and political leaders both at the district level and in two sample sub-counties in each district. Focus meetings at the district level included technical officers in charge of the natural resources (forestry, wildlife, fisheries, land and water) plus financial management staff. In addition the team met:
Members of the District management team responsible for natural resource management,
Other professional staff in the district involved in natural resource management,
Councillors working with natural resource management,
Key NGOs and CBOs
At ward and village level, focus discussions were held with Ward Development Committees, Village Governments, members of Beach Management Units, WMA members, and community members.
In the 4 districts the team also reviewed additional background information and statistics including
Copies of the latest development plans,
Budgets and accounts for activities related to natural resource management, - both expenditure and income data,
Overview of staffing positions of personnel working with natural resource management.
Table below gives an overview of the issues explored during fieldwork:
TABLE 2: ISSUES INVESTIGATED DURING THE FIELD STUDY
Issue Specific questions
Locally available Natural Resources
Provide and overview of the available natural resources in the district: Forest, - types and acreage – how much under jurisdiction of LG and
how much outside LG jurisdiction Fisheries, Wildlife
Legal and Institutional Framework
Comments from your staff and councillors regarding the appropriateness of current policies, laws and regulations for each of the main NRM sectors
NRM in LGs, TAN Final Report 3

(forestry, wildlife, fisheries, water and land) The extent to which key management functions are assigned local governments for NRM in a manner that facilitate the integration of NRM in LG planning,The extent to which local government legislation, sector legislation, and subsidiary regulations are harmonized,The extent to which various user committees have a clearly established legal and accountability relationship to local government institutions
Local Government NRM staff issues
Do LGs have the right number of qualified staff to undertake NRM functions? Is the staff motivated? And does NRM staff in local governments work primarily according to CG instructions or LG guidance?
Local Government Planning Process
What issues are included in LG plans and budgets at both District, ward and village levels,How these issues have been integrated in LG plans and budgets – through O&OD or other processes?To what extent is it possible to determine who (which social categories) that have been particularly dominant in getting their views and interest secured in this process?
Local Government Regulatory Processes
What bylaws have been passed by the LGs?What key achievements have been noted?What have main problems been?
Local Government revenue Collection Processes
What sources of revenue are generated from natural resource management,Tables of income and expenditures for the last 3 years,What are the key achievements? And key obstacles?
Plans and activities by community sector groups
What types of user groups have been established? (how many, when, by whom?)What are the main activities?Tables of income and expenditures for the last 3 years for these groups,What are the key achievements? And key obstacles?
Local Government Budget Process
Copy of the latest plan and budget,To what extent are al natural resource management issues reflected in the plan and budget?
NGOs and CBOs What NGOs and CBOs are active in the district?What are their main activities?
Donor Project and harmonization
What donors and projects are active in the district?What are their main activities? What are the budgets and plans, are they all reflected in LG budgets and accounts?What are the key achievements? And key challenges?
2.5 STRUCTURE OF THE REPORT
This chapter provides the general background to the study as well as an outline of the objectives and methodology of the study.
Chapter 3 provides a broad overview of natural resource management’s issues in Tanzania with emphasis on the macro-economic, social and broad political aspects.
NRM in LGs, TAN Final Report 4

Chapter 4 gives a general overview of the key institutional arrangements for local government’s management of natural resources in Tanzania. This includes a brief general overview of the LG system and the sector policies and institutional arrangements for three key natural resource sub-sectors: forestry, fishery and wild life.
Chapter 5 presents main findings from fieldwork in four districts regarding local experiences with local governments management of natural resource management,
Chapter 6 summarizes key findings, conclusions and lessons from a combined analysis of secondary sources and fieldwork findings.
The final chapter 7 presents a discussion of recently proposed LG NR grant in Tanzania in light of the study findings.
NRM in LGs, TAN Final Report 5

3. SOCIO ECONOMIC IMPORTANCE OF NATURAL RESOURCES
3.1 NATURAL RESOURCES ENDOWMENTS
Natural Resources in Tanzania constitute a wealth asset. Forestry, Wildlife and Fisheries resources, are relatively abundant in the country though there are signs of over exploitation, which in certain locations, is massive and well-organised.
3.1.1 FOREST RESOURCES
As far as forest resources are concerned, it is estimated that about 40% of the total land area of Tanzania, which is equivalent to 33.5 million hectares, is covered by forests and woodlands. Out of these 33.5 million hectares, almost two thirds consists of woodlands on general land that lacks proper management. The pressure on this land is growing fairly fast due to expansion of population growth, agricultural activities, livestock grazing, fires and other human activities, and consequently the raw material supply from natural forests has been rapidly decreasing.
About 13 million hectares of this total forest area have been gazetted as forest reserves. About 1.6 million hectares within the gazetted forest reserves are under water catchments management. Plantation forests are estimated to be in the range of 180,000 – 220,000 ha and divided as follows: Industrial plantations (within forest reserves) under the management of Forestry and Beekeeping Division about 80,000 ha; Wattle plantations, most of which are owned by Tanganyika Wattle Company Limited about 10,000 – 20,000 ha; Rubber plantations about 1,800 ha; Plantations under District Councils Management or owned by various institutions, village communities and private individuals may be 70,000 – 140,000 ha.
3.1.2 WILDLIFE RESOURCES
The high diversity and endemism of wildlife species has made Tanzania one the four mega diversity nations along with Democratic Republic of Congo, Brazil and Indonesia. The country has 316 known mammals (15 endemics), 1,016 birds (24 endemics), 290 reptiles (61 endemics), 133 amphibians (49 endemics) and over 10,000 plants of which 1,122 are endemics (WRI 2001). In the Afro-tropical realm, Tanzania ranks fourth in terms of diversity of mammals, second for birds, third for reptiles, amphibians and higher plants (Cumming 1999). The wildlife species that Tanzania possesses are of huge economic importance realized through consumptive and non-consumptive use.
Over 30% of the country’s land surface has been devoted for wildlife conservation to capture these potentials. Land areas that offer consumptive wildlife use include Game Reserves occupying approximately 95,000 km2 and Game Controlled Areas, comprising of 58,565 km2. The non-consumptive use of wildlife such as game viewing, research and education are pursued in country’s 14 national parks: These include: Kilimanjaro (750 km2), Serengeti (14,750 km2), Manyara (325 km2), Tarangire (2,600 km2), Katavi (2,252 km2), Udzungwa (1,000 km2), Mahale (400 km2), Rubondo (460 km2), Arusha (117 km2), Mikumi (3,230 km2), Ruaha (23,000 km2) and Gombe (52 km2). Ngorongoro Conservation Area (8,320 km2) is the highest category of wildlife protected areas where human habitation is allowed. Along with non-consumptive use of wildlife through game viewing tourism, pastoralism and limited cultivation is allowed in prescribed zones.
NRM in LGs, TAN Final Report 6
There seems to be an agreement among conservationists and hunters that there is a general decline in wildlife populations in many areas of Tanzania. The number of hunting concessions has, therefore, ceased to be viable. Typically they point to habitat loss and illegal off take of bushmeat by local communities as the main reasons for the alleged decrease (World Bank, 2005). It is argued that growing human population are turning game areas into ecological islands surrounded by cultivated and semi-urban land, risking that these areas loose their economic value for the hunting and tourism industry. The 1995 WRI report on status of the world habitats showed that already in the 1990’s about 43% of Tanzania’s original habitats had been lost. The report showed that only 505,134 km 2 of the previous habitat (886,200 km2) remained. The loss is linked to observed extinctions of fauna species in different localities of the country (Miller and Harris, 1977; Newmark 1996; Brooks et al., 2002).
The problem of illegal offtake of wildlife species - the second largest crime in the world after narcotic drugs - is well documented. The most popular cases of poaching occurred between 1970s and 1980s. They involved two of country’s charismatic wildlife species - rhino and elephant. Tanzania had its rhino driven to the verge of extinction when its population dropped by 93% from 3,795 in 1981 to 275 individuals only by 1992 (Adams & McShane 1996). Selous Game Reserve in southern Tanzania alone recorded 50% loss of this species within a decade from 1976 when the number stood at 110,000. In Serengeti, the population dropped by 80% between 1975 and 1986 (Dublin & Douglas-Hamilton 1987). Tanzania’s elephant population dropped by 72% from 1977 to 1991. Poaching is still rampant today due to factors such as increased human population, worsening of economic situation and political factors. In Serengeti – one of the flagship conservation area in the world – over 200,000 herbivores were killed annually (Campbell and Hoffer 1995). Civil wars in Burundi, Rwanda and Democratic Republic of Congo had also implications on poaching of wildlife species, making them vulnerable to extinction.
3.1.3 MARINE FISHERIES
Marine Fisheries in Tanzania are dealt with separately by Fisheries Departments of Mainland Tanzania and Zanzibar. Therefore, Marine Fisheries can in principle be divided into Two Territorial Seas and Two Exclusive zones; Mainland and Zanzibar.
To simply the analysis, there are five distinct marine fisheries of economic relevance in Tanzania:
1. Mainland Prawns;
2. Mainland artisanal;
3. Mainland Exclusive Economic Zone (EEZ);
4. Zanzibar artisanal; and
5. Zanzibar Exclusive Economic Zone (EEZ)
With regard to prawn fisheries, there is evidence at TAFIRI, the Tanzania Fisheries Research Institute, that prawn stocks in the Rufiji Delta are steadily decreasing. However, no quotas have been imposed by the Tanzanian Government. Albeit lack of government control, the Trawler Owners Association has voluntarily reduced the length of the season by one month (March to October) and reduced the number of nets used on its beam waters. The fact that this has happened is a clear indication that the prawn fisheries has been operating at a level that cannot sustain increased exploitation. However, the government has not yet imposed effective controls beyond these voluntary measures.
NRM in LGs, TAN Final Report 7

Prawn catch is also associated with fish by-catch, which provides an important source of fish supply to the domestic market (World Bank, 2005).
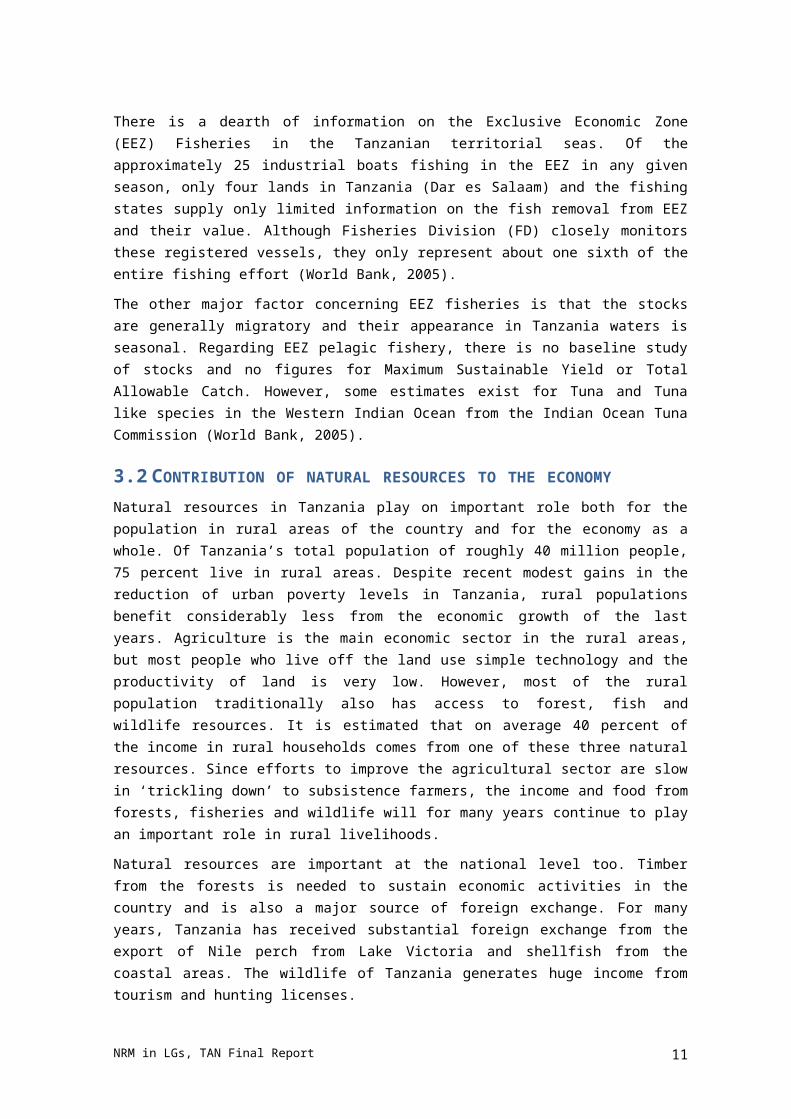
There is a dearth of information on the Exclusive Economic Zone (EEZ) Fisheries in the Tanzanian territorial seas. Of the approximately 25 industrial boats fishing in the EEZ in any given season, only four lands in Tanzania (Dar es Salaam) and the fishing states supply only limited information on the fish removal from EEZ and their value. Although Fisheries Division (FD) closely monitors these registered vessels, they only represent about one sixth of the entire fishing effort (World Bank, 2005).
The other major factor concerning EEZ fisheries is that the stocks are generally migratory and their appearance in Tanzania waters is seasonal. Regarding EEZ pelagic fishery, there is no baseline study of stocks and no figures for Maximum Sustainable Yield or Total Allowable Catch. However, some estimates exist for Tuna and Tuna like species in the Western Indian Ocean from the Indian Ocean Tuna Commission (World Bank, 2005).
3.2 CONTRIBUTION OF NATURAL RESOURCES TO THE ECONOMY
Natural resources in Tanzania play on important role both for the population in rural areas of the country and for the economy as a whole. Of Tanzania’s total population of roughly 40 million people, 75 percent live in rural areas. Despite recent modest gains in the reduction of urban poverty levels in Tanzania, rural populations benefit considerably less from the economic growth of the last years. Agriculture is the main economic sector in the rural areas, but most people who live off the land use simple technology and the productivity of land is very low. However, most of the rural population traditionally also has access to forest, fish and wildlife resources. It is estimated that on average 40 percent of the income in rural households comes from one of these three natural resources. Since efforts to improve the agricultural sector are slow in ‘trickling down’ to subsistence farmers, the income and food from forests, fisheries and wildlife will for many years continue to play an important role in rural livelihoods.
Natural resources are important at the national level too. Timber from the forests is needed to sustain economic activities in the country and is also a major source of foreign exchange. For many years, Tanzania has received substantial foreign exchange from the export of Nile perch from Lake Victoria and shellfish from the coastal areas. The wildlife of Tanzania generates huge income from tourism and hunting licenses.
The National Strategy for Growth and Poverty Reduction of Poverty (Mkakati wa Kukuza Uchumi na Kuondoa Umaskini Tanzania – MKUKUTA) was approved by the government in April 2005. It is being implemented between 2005/06 – 2009/10. The strategy subscribes to the principles of sustainable and equitable development (URT, 2005) and considers the important role of NR. The operational starting points of these principles include:
Renewable natural resources should be exploited on the bases of maximizing profits and sustaining yields. Resources should not be driven to extinction, regardless of the dictates of present value maximization. Hence, harvesting rates should not exceed regeneration rates and waste emissions should not exceed absorptive capacities.
Non-renewable natural resources should be exploited at a rate equal to the creation of renewable substitutes. Revenue from the exploitation of non-renewable resources should contain an income component and a capital component. The capital component should be
NRM in LGs, TAN Final Report 8

used to invest in building up a new renewable asset to replace the non-renewable one at the point of its exhaustion.
Revenue generated from natural resources should be shared equitably, in particular with the rural communities on whose land these resources are located.
These macroeconomics of sustainability require integrating qualitative development and growth in Gross Domestic Product (GDP) more fully, giving equal weight to the pro-poor growth and the maintenance of a sustainable natural resource base.
Currently natural resources contribute 5.7% of GDP in Tanzania. Due to various policy failures, Tanzania’s natural resource endowments are still not harnessed in an optimal way to achieve both economic growth and poverty reduction. Kapinga (2008) argues that policy failures are due to poor design; lack of resources and poor coordination. Poor coordination and lack of monitoring and evaluation may be caused by having too many actors, each pursuing his/her own objectives or inclinations. Studies carried out in Tanzania revealed that due to weakness in governance regimes, resources are offered below market prices to the benefit of a few powerful winners and to the loss of the majority of the rural population (Milledge, et. al., 2007). The weaknesses in governance regimes in forestry, wildlife and fisheries include primarily:
lack of transparency and accountability in issuing rights to extract resources and accrue revenues from them;
inequitable sharing of benefits with communities; and
weak monitoring and surveillance of stocks.
In all four principal sectors providing natural capital in the growth equation – forestry, wildlife, fisheries, and mining – royalties are set arbitrarily and do not reflect scarcity (World Bank, 2007). Royalties are, hence, not used as policy instrument of intertemporal resource pricing and sustained yield management. As long as these weaknesses are not addressed, a substantial base of economic growth will be slowly eroded and poverty reduction objectives are unlikely to be achieved. Commonly for forestry, wildlife, and fisheries, a great share of the economic contribution does not enter GDP and export statistics and hence not taken into account in analyses of growth.
A general problem, confirmed by the field findings of this study, is the unavailability and poor quality data.
An overview of annual revenue earned by the Ministry of Natural Resources and Tourism (MNRT) from its key departments in 2003 and 2004 is presented in figure 2.1. Although revenue is an important measure for growth, it does not capture all contributions to economic and rural development by the respective sectors.
TABLE 3: MINISTRY OF NATURAL RESOURCES AND TOURISM ANNUAL REVENUE 2003 AND 2004
Revenue source Amount of revenue (Tshs billion)
2002/03 2003/04
Forestry
Wildlife
Fisheries
5.29
9.17
6.99
5.82
9.55
9.70
NRM in LGs, TAN Final Report 9

Tourism 0.83 0.96
Source: Ministry of Natural Resources and Tourism (2007). Note: Amounts include revenue collected and retained at source.
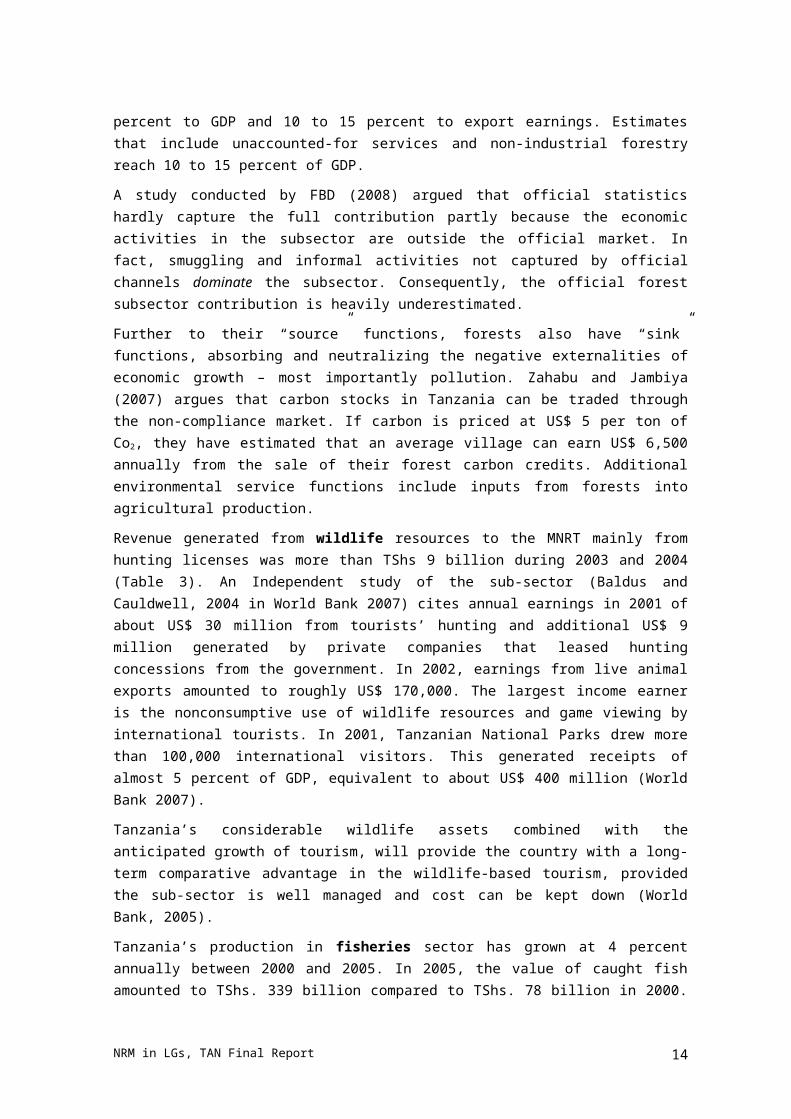
Forestry provided more than TShs. 5 billion in government revenue in 2003 and 2004 as table 3 shows. It officially contributes 2 to 3 percent to GDP and 10 to 15 percent to export earnings. Estimates that include unaccounted-for services and non-industrial forestry reach 10 to 15 percent of GDP.
A study conducted by FBD (2008) argued that official statistics hardly capture the full contribution partly because the economic activities in the subsector are outside the official market. In fact, smuggling and informal activities not captured by official channels dominate the subsector. Consequently, the official forest subsector contribution is heavily underestimated.
Further to their “source” functions, forests also have “sink” functions, absorbing and neutralizing the negative externalities of economic growth – most importantly pollution. Zahabu and Jambiya (2007) argues that carbon stocks in Tanzania can be traded through the non-compliance market. If carbon is priced at US$ 5 per ton of Co2, they have estimated that an average village can earn US$ 6,500 annually from the sale of their forest carbon credits. Additional environmental service functions include inputs from forests into agricultural production.
Revenue generated from wildlife resources to the MNRT mainly from hunting licenses was more than TShs 9 billion during 2003 and 2004 (Table 3). An Independent study of the sub-sector (Baldus and Cauldwell, 2004 in World Bank 2007) cites annual earnings in 2001 of about US$ 30 million from tourists’ hunting and additional US$ 9 million generated by private companies that leased hunting concessions from the government. In 2002, earnings from live animal exports amounted to roughly US$ 170,000. The largest income earner is the nonconsumptive use of wildlife resources and game viewing by international tourists. In 2001, Tanzanian National Parks drew more than 100,000 international visitors. This generated receipts of almost 5 percent of GDP, equivalent to about US$ 400 million (World Bank 2007).
Tanzania’s considerable wildlife assets combined with the anticipated growth of tourism, will provide the country with a long-term comparative advantage in the wildlife-based tourism, provided the sub-sector is well managed and cost can be kept down (World Bank, 2005).
Tanzania’s production in fisheries sector has grown at 4 percent annually between 2000 and 2005. In 2005, the value of caught fish amounted to TShs. 339 billion compared to TShs. 78 billion in 2000. About 75 % of revenue comes from freshwater fisheries, and only 25 % from marine fisheries. However, the number of foreign vessels licensed to operate in the Exclusive Economic Zone (EEZ) on the mainland and Zanzibar has increased from fewer than 10 in 1998 to more than 170 in 2004, corresponding to revenue of US$ 3.3 million. In terms of export earnings, fisheries contributed 8 percent of total exports in 2005 (US$ 142 million), the export value of Nile perch alone being US$ 129 million. Again, a great share of the marine catch does not enter GDP and export statistics but plays an important role in livelihood support. The official number of artisanal fishermen has doubled since 1995, reaching close to 115,000 in 2005.
It is obvious from the data provided, these natural resource based sectors make an important contribution to both formal and subsistence economies.
NRM in LGs, TAN Final Report 10

However, of the three natural resource sub-sectors, only fisheries is a net contributor to the Treasury.
Forestry and Wildlife are subsidized through government allocations to cover their current expenditures and through foreign grant allocations to finance their operational budgets. Table 4 shows government recurrent budget allocations to the sectors: Forestry and Wildlife each received 29 % of the MNRT budget in 2003/04, followed by Fisheries (18 %) and Tourism (11 %).
Generally speaking, the real contribution of Natural Resources to the Tanzania economy is underestimated – and still not properly understood by those entrusted with informed policy making. There is potential through improved efficiency in the management of NR to increase their contribution to all levels of the national economy, including at community level where the impact of declining NR is felt most.
TABLE 4: BUDGET OF THE MINISTRY OF NATURAL RESOURCES AND TOURISM, BY SUB-SECTOR, 2002 -2004
Subsector 2002/03 2003/04
Tshs thousand % Tshs thousand %
Forestry and Beekeeping 4,897,656 24.0 7,633,913 29.0
Wildlife 6,593,025 33.0 7,586,736 29.0
Fisheries 3,688,280 18.0 4,648,202 18.0
Tourism 2,208,073 11.0 2,880,761 11.0
Others 2,856,131 14.0 3,507,741 13.0
Total 20,243,165 100.0 26,257,352 100.0
3.3 NATURAL RESOURCES AND LIVELIHOODS
There is a shared understanding among researchers, policy makers and development practitioners that many rural households in developing countries are highly dependent on natural resources. Poor people often depend directly on non-cultivated natural resources. The World Bank’s Forest Strategy notes that more than 1.6 billion people depend to varying degrees on forests for their livelihoods. About 60 million indigenous people are almost wholly dependent on forests. Some 350 million who live within or adjacent to dense forests depend on them to a high degree for subsistence.
In recent years, there has been increasing interest in the contribution that natural resources make to local rural employment and income also in Tanzania (FBD, 2008).
With a few notable exceptions, however, there has been limited empirical research on the level of dependence across different socio-economic groups. The contribution of natural resources to the welfare of rural livelihoods is regularly overlooked in poverty surveys. Empirical investigation of dependency of natural resources may help to improve macro-level poverty estimates and improve policy planning and execution.
In Tanzania, forests provide about 75% of building materials and 100% of indigenous medicinal plants and supplementary food products. Furthermore, 95% of Tanzania’s energy consumption is in the form of fuelwood (URT, 1998); that consumption includes major input factors in rural industries such as tobacco curing and fish smoking. The fact that Tanzania is a net importer (!) of forest
NRM in LGs, TAN Final Report 11

products is a sign of lost opportunities in income generation for the local economy (World Bank, 2007).
Forestry sub-sector is a potential economic undertaking for millions of workforce of Tanzania. Although the national statistics hardly reflect the entire economic benefits of the sub-sector, the complex chain of activities within the sub-sector is capable of formally or informally employing a good number of relatively unskilled labour force utilizing simpler technology. Participatory Forest Management, successfully introduced and piloted in several area-based programmes, has already shown that communities in charge of forest management can earn substantial benefits in a sustainable manner, for example in the SULEDO Forest. GoT has a keen interest in seeing such practices being scaled up.
Wildlife sub-sector on the other hand, provides uncounted for subsistence values. Well over two thirds of the people eat bushmeat, with up to 95% of the rural population in Tanzania claiming that it is one of their main meat protein source. Part of the considerable proceeds from tourism is meant to be ploughed back to local communities, ‘compensating’ them for their limited access to land or wildlife. However, the potential for local development from wildlife-related tourism has not been fully tapped in most areas. In the Serengeti-Mara ecosystem, for example, the number of households earning income from tourism varies from 3 to 12 percent in Loliondo Game Reserve and Ngorongoro Conservation Area respectively (World Bank, 2007).
It is hypothesized that absence of wildlife-related benefits provides little incentive for local communities to support conservation efforts. Consequently, high levels of illegal utilization and unsustainable use of wildlife resources persist, leading to a loss of opportunities for economic growth and poverty reduction.
While poaching and illegal trafficking is often associated with adjacent communities (Kideghesho et al 2005), a study carried out in Katavi National Park showed that the majority of poachers did not reside in the villages adjacent to the park but rather in the district headquarters or further removed location (World Bank, 2005).
To address some of these inherent problems, 1998 Wildlife Policy has prescribed the establishment of Wildlife Management Areas (WMAs) which will enable communities to manage wildlife on their lands and derive the benefits. The regulations detailing WMA procedures were released by the end of 2002. Some 16 pilot WMAs were proposed in Tanzania. Area-based programmes helped in recent years to design and implement successful pilot WMAs that truly benefit local communities, for example the Burunge WMA. Out of these, ten have already attained Authorized Association (AA) status.
Marine Fisheries have a significant importance for employment and income levels along the coastal regions in Tanzania. Poverty along coastal regions is widespread, on average 85 % of the sample population of a survey conducted for the “Blueprint 2050” study survives on less than a dollar a day (World Bank, 2005). The average monthly per capita consumption expenditures in 2003 for the sample population of the same study was about USD 21. This is roughly two-thirds of the established poverty line of USD 30 (Ruitenbeck, et. al., 2005).
Outside the urban centres, marine fisheries are a vital source of employment and income as well as an important source of nutrition and alternative to expensive meat. Direct benefits of marine
NRM in LGs, TAN Final Report 12

fisheries to the local population are presently derived from artisanal fisheries and fish by-catch from prawn fishing, which is sold on the domestic market.
While commercial fisheries, in particular in the EEZ, represent potential for economic growth, the impact on poverty reduction will depend on how the license revenue earned by the Government is translated into benefits for local people. The effect of Fisheries Agreements on poverty reduction will depend on the creation of economic “spin-offs” and associated development activities. These are expected to be negligible as no fish is expected to be landed ashore and few supplies will be sourced from the country (World Bank, 2005). It is for example, unlikely that foreign vessels will employ Tanzanian nationals as crews in addition to what is stipulated in the Fisheries Agreements. If none such “spin-off” effects are created, the net impact of commercial fisheries on poverty reduction may be negative, provided that it competes with artisanal fisheries over the same resource.
Although EEZ Fisheries and artisanal fisheries cover different zones, foreign vessels sometimes transect from the EEZ into coastal zone. It will consequently be important to impose strict policy measures to protect the resource rights of the local population. Otherwise, poverty might be aggravated as a livelihood base is withdrawn while catch by foreign vessels, who can access the EEZ water and have more efficient technology increases.
The competition for scarce natural resources has changed the constellation among actors. ‘The Lake is no longer ours’, lament tens of thousands of fishermen and fisherwomen around Lake Victoria after foreign investors, the national elite and the Government have gained control over the major fish resources. Yet it has to be acknowledged that the fish industries actually maintain a large number of fishermen and people working in their related support services as well as those trading locally in processed fish products.
There are major conflicts about natural resources, and such conflicts take place at several levels. Each natural resource leads to its own type of conflict. Many researchers talk about “the natural resources curse” which is highly relevant concept for Africa, including Tanzania (Collier, 2007). Tanzania has not been successful in managing its natural resources in a sustainable and equitable manner, nor has the country been able to achieve significant economic growth in its utilization of these resources.
3.3.1 LOSS OF REVENUE
A comprehensive study conducted after the completion of the famous “Mkapa Bridge” in South-Eastern Tanzania showed an upsurge in extensive illegal exploitation of forests. Logs worth tens of millions of USD were exported illegally, primarily to China and other countries in Asia. Taxes and royalties were paid for only four % of the logs that were harvested. The study estimated that Tanzania annually lost USD 52 million of its potential revenue, due to illegal logging (Milledge, 2007).
Reports from the fisheries and wildlife sectors also show that politicians and representatives of the Government allow these resources to be plundered by national and international companies, provided they themselves obtain a share of the profit made by the companies. Both in the fisheries and wildlife subsectors, licenses are allocated to investors at a price that is only a fraction of the market price. Corrupt representatives of the Government earn huge amounts of money that should have gone into the Treasury. The development partners in Dar es Salaam recently notified the Government that the fees which the Government received from the wildlife subsector were minimal. The Government only charged USD 8,000 for hunting blocks that had much higher market values.
NRM in LGs, TAN Final Report 13

The Government accepted the complaint by the development partners and increased the fees to USD 40,000 per block. However, many of the politicians who control these hunting blocks resisted the move and argued against. They argued that increased fees would lower their profit margins and therefore demanded that they should remain at the old levels (British High Commission, Dar es Salaam, 2007).
The trawlers (about 150 coming from EU countries and the Far East) that operate within the Exclusive Economic Zone in the Indian Ocean only pay USD 18,000 annually to obtain a license. On a good day of fishing, the trawlers are able to catch fish of the same value as the annual fees. It has been estimated that if the Government had charged Market Value of these licences, the Treasury could have collected USD 20 million annually for the trawlers’ licenses (Development Partner Group, Dar es Salaam, 2005). It is also well known that the export of nile perch from Lake Victoria has been heavily underreported for many years in order to avoid taxation.
NRM in LGs, TAN Final Report 14
4. INSTITUTIONAL FRAMEWORK FOR LOCAL NR MANAGEMENT
4.1 LOCAL GOVERNMENT ADMINISTRATIVE STRUCTURE AND FUNCTIONS
In this section we provide a brief overview of the institutional framework, the local government system and relevant sector policies in Tanzania of relevance for understanding potential scope and challenges for integration of NRM in local governments in Tanzania.
The Government of Tanzania on the mainland over the last decade has pursued a decentralisation policy that has increased the importance of local government structures in delivery of the most important basic services. The system is in the rural areas based on District councils with an additional layer of Villages with their own local government status. The latter have the potential to play a significant role in natural resource management issues.
In Zanzibar the situation is quite different: even though local government structures have been established in law, they remain far less resourced than in the mainland and play only an insignificant role in delivery of basic services with some role in selected natural resource management issues.
4.1.1 LG ADMINISTRATIVE STRUCTURES
The current local government system in the rural areas of Tanzania mainland is a two-tier LG system with LG Councils at District and Village Levels. In addition the LG system operates with administrative committees at ward and sub-village (Kitongoji) levels. The same system of fully-fledged LG Councils at community is not found in urban areas where only administrative units are found below the respective urban authorities. (See Figure 2 for an overview of number and types of LG structures).
The number of LG structures has increased significantly over the last four years; the major changes are results of urbanization and decisions regarding formalizing the urban local government status of a number of upcoming or existing urban settlements that previously haven’t been declared as urban areas. The number of rural local governments has also increased but not so drastically.
In addition to the LG structures, Tanzania also has a system of deconcentrated administrations; the Regional Administrations, which includes a secretariat at regional level and staff at district and divisional level. In principle the Regional Administration is primarily to play oversight and advisory functions to LGAs that in principle are main implementers of local serviced delivery of most basic services.
Local governments are meant to be primary held accountable to their citizens through regular elections held in rural areas at district and village level. The two types of elections are managed by the National Election Committee and PMO-RALG respectively. It is mandatory for candidates to be nominated by a political party. The fact that individuals cannot stand for elections has caused some critique (Shivji et al 1999) as it in a situation of significant one-party dominance (CCM) and in particular at village level may be a hindrance for wider citizen choice.
Surveys from REPOA (2003 and 2006) indicate that citizens feel that the lowest level of local governments are more accountable than the higher levels. During the last decade, several sector specific local institutions have emerged in order to enhance local service providers’ accountability to local citizens. However, the relationship between these sector specific user groups/committees and the general local government structures is occasionally confused and lead in some instances to
NRM in LGs, TAN Final Report 15

undermining of the general local government structures. During field work we explored the extent to which this was be an issue with the specific institutions created for LGAs management of NRM.
4.1.2 ASSIGNMENT OF NRM FUNCTIONS TO LGA ACCORDING TO LG LEGISLATION
Under the Local Government Laws, 1982 No.7 (District Authorities) and No.8 (Urban Authorities), LGAs have been assigned wide-ranging, but also very broad and occasionally vaguely formulated functions, including the major social sectors such as primary education, primary health care, rural water supply as well as local government roads, agricultural development and a broad range of natural resource management issues discussed in more detail further below.
The Local Government legislation is fairly general and brief regarding the specific mandate of local governments in management of natural resources, however it is for instance stated (Local Government/District Authorities Act 1982, Section 118) that ‘it shall be the function of every District Council to formulate, coordinate and supervise the implementation of all plans for the economic, commercial, industrial and social development’ and:
Prohibit or regulate the use of any agricultural land,
Make provision for the prohibition or regulation of livestock husbandry,
To take all the necessary measures to provide for the protection and proper utilization of the environment for sustainable development,
Establish, preserve, maintain, improve and regulate the use of forest and forestry produce,
Prohibit or regulate the hunting , capture, killing or sale of animals or birds,
License, regulate or supervise in any other way such trades and occupations as the Minister may, by notice in the Gazette, prescribe
in Schedule 2 of the Act it is also mentioned that District Councils may “regulate wells, control and regulate use of water”
However it should be noted that for each of the key sectors (forestry, fisheries, water and wildlife etc) they all have – in their sector legislation - their own additional provisions regarding institutional arrangements and specific division of roles and responsibilities including degree of devolution to local government authorities.
NRM in LGs, TAN Final Report 16

WARD DEVELOPMENT COMMITTEES
2,546
VITONGOJI
56,901
MITAA 2,83456,901
FIGURE 1: LOCAL GOVERNMENTS AND ADMINISTRATIVE UNITS: LAYERS AND NUMBERS
URBAN COUNCILS RURAL COUNCILS
NRM in LGs, TAN Final Report
VILLAGE COUNCILS
10,018
CITYCouncil
MUNICIPALCouncil
TOWNCouncil
DISTRICTCouncil
Townships
20+ (increasing)
17
4.1.3 LG FINANCE
The Local Government Reform Policy states in broad terms that the Government’s objectives are to:
a) improve on LGA revenue generation;
b) promote transparency and fairness in the allocation of sufficient funds;
c) encourage equity in access to services; and
d) ensure efficient use of resources for service delivery at all levels of government.
In brief this policy has to date not led to significant improvements in LGAs own revenue collection powers have primarily been pursued through reforms of the fiscal transfers from central governments to LGAs of both recurrent and development funds:
In 2004 cabinet endorsed a system for formula based recurrent sector block grants, which since July 2004 have been, introduced for health and education and subsequent years also for others sectors. The intention of the reforms as supported by LGRP has been to ensure that (a) LGAs receive funds in a more transparent and equitable manner and (b) that each LGA is given more budget discretion. However, the intended policy has not been fully implemented in practice: the allocation of funds does not follow the formula and LGAs can in practice only budget for the small OC components3.
The introduction of the Local Government Capital Development Grant (LGCDG4) system on a nationwide basis in July 2005. This reform initiative aims to decentralize development funds from Government and Development Partners to LGAs through a formula based grant system that gives LGAs significant autonomy and also provide strong incentives for LGAs to adhere to basic governance measurements that are assessed on an annual basis.
The Government issued in 2004 a letter Policy on fiscal decentralisation of the development budget that outlined the intentions of the Government of gradually mainstreaming various donor funded projects and sector development grant systems into the overall LGCDG, this has later been refined and operationalised5. In addition to the core non-sector specific LGDG of approximately 1.5 USD/capita, several sector specific development grant “windows’ have been introduced. In this Fiscal Year that includes agriculture, health, education, water and the amount of development funds allocated on a formula base to LGAs is now very substantive and beginning to transform the way development projects in practice are planned, budgeted and implemented towards a more decentralized system. However, many separate project-funding modalities continue in parallel in most sectors. As further discussed in chapter 7, Government and Development partners have debated and started to pursue options for integration of earmarked funding for the NR sector through the same LGDG modality.
3 For most recent discussion of this see Boex, Jamie and Per Tidemand: Intergovernmental Funding Flows and Local budget Execution in Tanzania, Final report 2008
4 From 2009 the system is referred to as the Local Government Development Grant System (LGDG).
5 Further refined in the form of PMO-RALG/ LGRP: Strategy For Implementation Of Government Policy on Devolution of The Development Budget (Draft 30th January 2006) and updated letter of Sectoral policy for LGSP II.
NRM in LGs, TAN Final Report 18

OVERALL TRENDS IN LGA REVENUES AND EXPENDITURES
The basic features of LGA revenues and expenditures are depicted in table of Annex 3.
The most important trend over the last five years can be summarized as follows:
Fiscal transfers from central government (Local Grants) have increased significantly with more than 100% for recurrent expenditures over the last 5 years,
LGA own revenue sources have remained more or less stagnant (with increasing revenue in urban areas and stagnating/declining revenue in rural areas),
Development grants have been introduced with a modest budget of some 10 million USD in 2004 and rapidly grown to approximately 200 million USD in latest annual budget,
On average LGAs generate only approximately 5-10% of the total budgets and rural LGAs generate a lower rate than urban LGAs (on average 1 USD per capita compared to 4 USD capita in Urban LGAs),
In spite of the significant overall increase in LGAs budgets, they only manage approximately 20% of public expenditures in Tanzania – of which payment of salaries is the biggest expenditure item of LGAs (they employ 75% of all public servants).
Data on actual expenditures at LGA level have been notoriously difficult to obtain, but reporting systems are now improving and data more reliable.
However, the broad patterns of LGA expenditures are very clear: 75% of LGA expenditures are on health and education – mainly because of the salary component for primary school teachers and health personnel. Data on LG expenditures on natural resource management are not displayed in the routine monitoring data from PMO-RALG but data from case study districts are presented in chapter 5.
4.1.4 LG HUMAN RESOURCES
The LGR Policy foresaw a complete devolution of personnel management to local governments. However, this part of the Policy is probably the one that has proved most controversial to implement. Under the LGR some efforts have been made to introduce local systems for recruitment, discipline and other aspects of HRM within the local governments but the system is in both law and practice a mix of centralized and decentralized HRM for local government staff: they are only to a limited extent effectively hired and fired locally6 as the Government simultaneously with the LGR decided to establish a unified public service (Public Service Act 2004).
Key aspects in LG human resource management include
Steady increase in LGA employment as relative to total public sector employment. Currently approximately 65% of all public servants are employed by LGAs7, the rest is employed by central government including Regional Secretariats and Executive Agencies.
Steady but very slow implementation of the LGA Restructuring exercise in LGAs – in particular the implementation of decisions regarding retrenchments and filling vacant posts with staff with adequate formal qualifications.
6 For details see Shivji 2006, and background paper to LGR Evaluation 2007 (Tidemand and Ndunguru)
7 PO-PSM: State of Public Service June 2005.
NRM in LGs, TAN Final Report 19
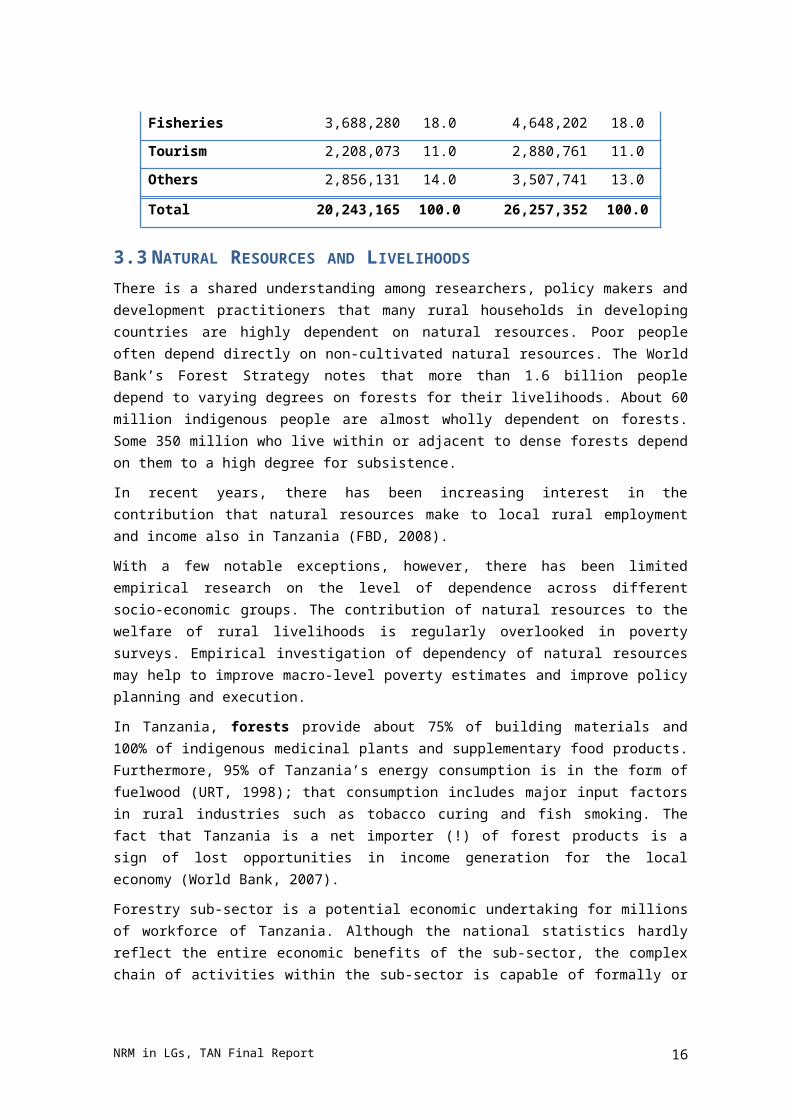
Significant and persistent problems in attraction and retaining of staff in districts considered “remote” or marginalised. This has recently been documented in great detail in a recent consultancy report commissioned by PMO-RALG8.
It is generally acknowledged that there are some curious and unfortunate biases in the way staff are deployed across local governments. For instance it is well known that teachers, and in particular female teachers, are far more numerous in urban local governments at the expense of the populations in rural local governments. Even for agricultural staff, there are some biases towards urban local governments. The presently nationally available data9 does not provide data on forestry and fishery staff etc.
4.1.5 LOCAL GOVERNMENT REFORM PROGRAMME
On Tanzania mainland the Local Government Reforms have from 2000 up to July 2008 mainly been implemented through a reform programme staffed by a contract employed team within PMO-RALG. The programme was headed by a LGRP coordinator that reported directly to the PS PMO-RALG. The reform team included managers responsible for each of the main reform outcomes (fiscal decentralization, legal, human resources etc) as well as six zonal reform teams. The programme was financed through a basket fund with contributions mainly from bilateral development partners. In addition to the LGRP programme some additional LGR related activates have been ongoing in the sectors just as the World Bank has supported some urban related LG reform activities as well as a block grant for local government small scale capital/development.
The programme ended July 2008 and PMO-RALG. A second phase reform programme will continue within PMO-RALG, with future reform activities fully “mainstreamed” within PMO-RALG rather than managed by some form of PMU. Technical assistance will be made available to the implementing entities to establish efficient and effective management, M&E and reporting structures.
To date the main focus of the local government reform has been on cross cutting and general issues such as overall principles of LG finance, support to general improved LGA budgeting and financial management and support for general HR management. When sectors have been involved, most attention has been paid to education and health with very limited attention directed towards the role of LGAs management of NRM. The LGCDG funds are accordingly mainly spent on education and health. Various sectors, such as agriculture and urban environment have subsequently established earmarked sector funding within the LGCDG framework but the specific challenges of these sectors that are much more complex than health or education have not featured highly o the overall LGR Agenda.
4.1.6 OPPORTUNITIES AND CHALLENGES ARISING FROM LGRP FOR INTEGRATION OF NRM
In summary, Tanzania has embarked on a fairly ambitious local government reform programme. The present local government set-up and reform ambition provides a number of opportunities for participatory integration of natural resource management issues within the local government system. In particular it can be observed that:
8 PMO-RALG/LGRP 2005: The Staffing Problems of Peripheral or Otherwise Disadvantaged Local Government Authorities, Consultancy Report by Crown Management (Ted Valentine, Per Tidemand, Nazar Sola and Alloyce Maziku)
9 E.g. the publicized data on LG staffing available on the PMO-RALG website www.logintanzania.net – this only provides data on the traditional key sectors such as education, health, roads, water and administrative staff.
NRM in LGs, TAN Final Report 20

Local Governments are legally mandated to provide the bulk of basics services in the main sectors, including major social sectors (education, health etc) as well as for natural resource management;
Detailed legal arrangements including harmonization of sector legislation as well as corresponding regulations are yet to be fully developed and harmonized. Previous studies on sector legal harmonization have focused on education, health and other social service delivery sectors while only limited systematic work has been completed for the natural resource sectors,
While functions have been broadly assigned to the local governments in Tanzania, it is clear from the various reviews of the local government reform programme that the corresponding devolution of financial and human resources lack behind. The extent of fiscal and human resource autonomy has been assessed for the key sectors of education and health, but the major LG studies have not included detailed assessments for the natural resource sectors.
The Tanzanian local government system is significantly different from many other in the region since the very small units of villages are given formal recognition as fully fledged local governments. This particular feature of the Tanzanian local government system allows in principle for a very substantial devolution of responsibilities for NRM to “community level”. However, the study findings confirm that the level of “maturity” of the village governments must be considered to be a constraining factor
4.1.7 ZANZIBAR SPECIFIC ISSUES
It should be noted that local government arrangements are not at considered as Union matters and as such the local government system on Zanzibar is completely different from the mainland. In Zanzibar it is regulated by the Zanzibar Constitution and separate Zanzibar local government legislation10. In brief it can be noted that the Zanzibar local government system differs from the Tanzania mainland in the following manner:
The rural local governments (District Councils) have almost no staff – contrary to the mainland, all key sector staff (including fishery and forestry staff) are central government staff and only nominally coordinated at district level through the office of the District Commissioner – completely separate from the District Council,
The Rural local governments have compared to the local governments on mainland relative few and fairly vaguely formulated mandates,
The budgets and financial resources of the Zanzibar local governments are with the exception of Zanzibar Municipality miniscule compared to the mainland,
In Zanzibar there are no lower level democratic institutions similar to the Mainland Village Governments. Instead the communities are ruled through a system of centrally appointed Shehia and corresponding set of locally appointed (not elected) committees,
However, interestingly the Government of Zanzibar has at least on paper still pursued similar policies of “decentralisation” of NRM – reflected in:
Establishment of Community Forestry Management Groups (The Forest Resources Management and Conversation Act no 10 of 1996),
10 For a brief description of the local government system in Zanzibar see www.dege.biz/Zanzibar.pdf
NRM in LGs, TAN Final Report 21
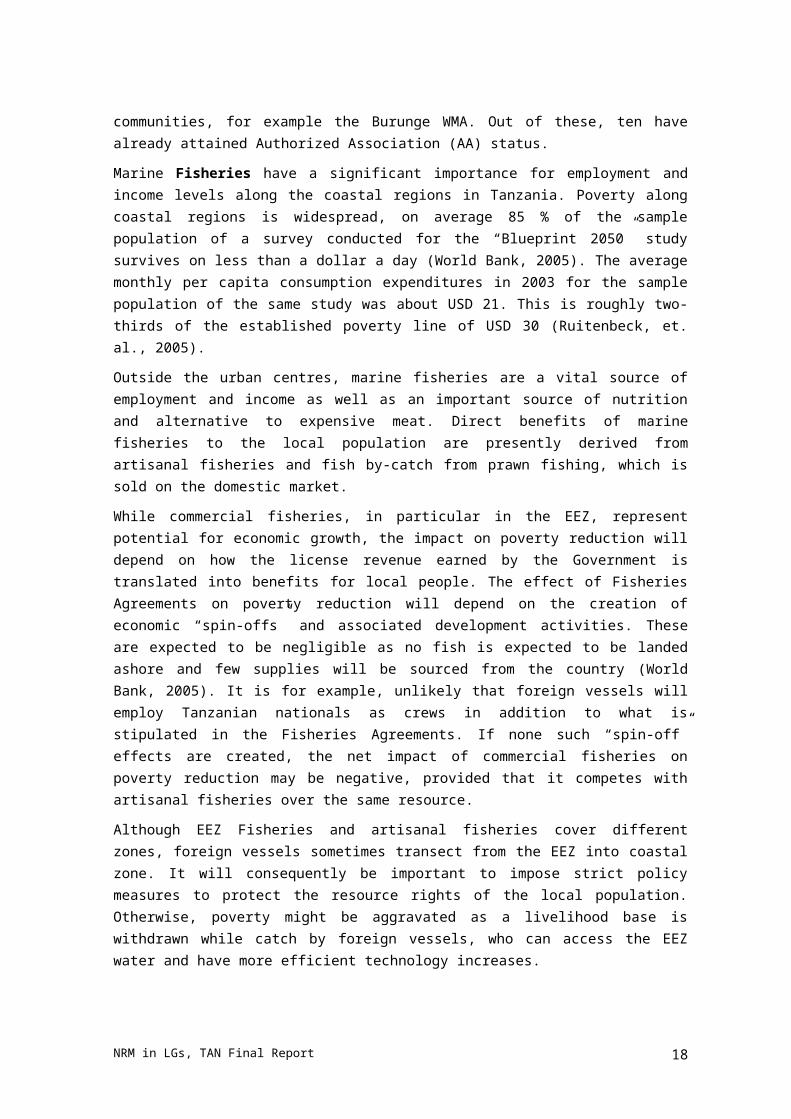
Establish of Community Fishery and Marine Conservation Groups – including revenue sharing schemes (under pilot schemes such as the MENAI BAY CONSERVATION AREA,)
Establishment of Environmental Management Groups (under the Environmental Management for Sustainable Development Act of 1996),
Several large Tanzanian development programmes are implemented on both the Mainland and Zanzibar are trying to support common principles of decentralization and community ownership in the sectors (e.g. the TASAF and MACEMP). However, the basic institutional arrangements, in particular the “maturity” of the local government system in Zanzibar is fundamentally different from the Mainland.
4.2 FOREST POLICY AND LEGISLATION
4.2.1 FOREST POLICY OF 1998
The National Forest Policy of 1998 among others allows use of forest reserves under participatory management arrangements as a means to motivate local communities to participate in forest management.
The major flaws in the National Forest Policy include
I. public ownership that creates “open access areas”,
II. insecure land tenure and
III. weak or absence of proper definition of property rights.
These have contributed to excessive harvesting through illegal harvesting and lack of investment incentives on forest activities.
Also, there is unregulated and uncontrolled trade in wood and non-wood forest products, which instigates uncontrolled exploitation of such products, accelerating forest destruction and degradation.
4.2.2 FOREST ACT NO. 14 OF 2002
The Act states that a ‘joint management’ can be entered into between the Director of Forestry and Beekeeping and community groups living adjacent to and deriving whole or a part of their livelihoods from a national forest reserves.
The Act prohibits some activities in forest reserves except for people with legal concessions, licenses or permits. These include: cutting down, felling, digging or removing any tree. Also the Act allows permits/license to be granted for some activities in forest reserves including felling or extracting timber for domestic use, commercial, export, mining purposes or for prospecting and exploration of mineral resources.
However, the Act also has a number of flaws. The Act does not set limits of bags for consumptive uses or limits of acceptable use for non-consumptive uses. Regarding hunting, the Forest Act gives powers to the Director responsible for forest reserves to issue permits to enter a forest reserve only. Hunting permits must be like previously sought and obtained from the Director of Wildlife.
Regarding compounding and prosecution of offences, the Forest Act give powers only to the Director of Forestry and Beekeeping or an officer specifically authorized by the Director by notice published in the government gazette. The law seems not to devolve powers to the lower cadre of forest officers or lower offices.
NRM in LGs, TAN Final Report 22
4.3 WILDLIFE POLICY AND THE CONSERVATION ACT
4.3.1 WILDLIFE POLICY OF 1998
The Wildlife Policy of Tanzania (WPT) defines wildlife as ‘species of wild and indigenous animals and plants, and their constituent habitats and ecosystems, found in Tanzania, as well as exotic species that have been introduced in Tanzania, and that are temporarily maintained in captivity or have become established in the wild’.
Wildlife Policy of Tanzania lists game viewing, tourist (or trophy or sport) hunting, resident hunting (licensed hunting for meat by residents), ranching, farming and live animal trade as the recognized forms of wildlife utilization allowed in Mainland Tanzania. The Wildlife Division is responsible for issuing hunting and capturing permits for wildlife occurring in forest reserves. Before holders of such permits can legally hunt or capture wild animals in forest reserves however, they must seek and obtain entry permits from the Director of Forestry and Beekeeping. The Forestry and Beekeeping Division and not the Wildlife Division can introduce and conduct game viewing in forest reserves.
Furthermore, Wildlife Policy of Tanzania permits small-scale animal cropping by rural communities practising community – based conservation (CBC). Generally, it is understood that CBC is supposed to be practised on village lands and where possible, on general lands. It is not known therefore, if this could be extended to neighbouring forest reserves.
No specific bag limits are set by the Policy for consumptive use of wild animals in forest reserves or elsewhere. However, the policy promotes sustainable utilization quotas through a scientific basis and monitoring of wildlife populations that are consumptively utilized. Also, it exercises control of wildlife utilization activities. The quotas are set annually per species per specified area (hunting block).
4.3.2 WILDLIFE CONSERVATION ACT NO. 12 OF 1974
The main focus of wildlife conservation Act No. 12 of 1974 (WCA) is on creation, protection and management of Game Reserves, Game Controlled Areas and Partial Game Reserves and Control of use of wildlife and other natural resources their in.
Forest Reserves are not part of these. However, section 17 of the Act, gives powers to the Minister responsible for wildlife by order published in the government gazette, to prohibit, restrict or regulate hunting, killing or capture of any animal or class of animals in any area of Tanzania Mainland in certain periods of the year. Such a period is termed as ‘close season’. Currently, the ‘close season’ runs from January 1 to June 30 and the ‘open (hunting) season’ is from July 1 to December 31 each year. Also the Director of Wildlife is given powers to kill or authorize the killing of any animal in any place outside national parks and the Ngorongoro Conservation Area.
Section 20 of the Act prevents the Director of Wildlife from granting permission for hunting, killing, capturing or wounding wild animals in national parks and Ngorongoro Conservation Area. Since forest reserves are not mentioned, implicitly it means the Director has legal powers to issue permits/licenses for hunting, killing and capturing wild animals in those reserves. Every hunting or capture permit or license must specify the species and number of animals, which may lawfully be hunted or captured by the holder of the permit or license and the permit/license is valid for a prescribed period of time. The permit/license holder must record in the spaces provided on the permit/license all relevant details of all animals shot (even if not killed) or captured by him or her and, at the expiry of such permit/license, surrender it to the licensing officer.
NRM in LGs, TAN Final Report 23
4.4 NATIONAL LAND POLICY AND ACT
4.4.1 NATIONAL LAND POLICY OF 1999
The National Land Policy (NLP) has two objectives, which are relevant to this assignment: ensuring that land is put to its most productive use to promote rapid social and economic development of the country, and protecting land resources from degradation for sustainable development. Also the policy aims at protecting so-called sensitive areas, which include water catchment areas, mountains, forests and seasonal migration routes of wildlife, to mention just few. These areas shall not be allocated to individuals. Also, development of hazardous lands, which include areas of steep slopes is prevented.
Furthermore, NLP states that certificates of occupancy shall be issued to all government and public properties, including forest reserves and that shifting cultivation is prohibited. The Policy also states in relation to these that before user rights for mining, timber harvesting, hunting etc. are considered, existing land tenure rights should be recognized.
4.4.2 THE NATIONAL LAND ACT 1999
The Land Act interprets land to include ‘the surface of the earth and the earth below the surface and all substances other than minerals and petroleum forming part of or below the surface, things naturally growing on the land, buildings and other structures permanently affixed to the land’ (URT, 1999). Land is divided into three categories: general land; village land; and reserved land. According to this classification, national forest reserves are reserved lands.
The Land Act states that ‘hazardous land’ is land the development of which is likely to pose danger to life or lead to the degradation of or environmental destruction on that or contiguous land and includes, among others, ‘land on slopes with gradient exceeding any angle which the Minister (for the time being responsible for lands) shall, after taking account of proper scientific advice, specify’. Being hazardous they cannot be put to any economic use except, perhaps for eco-tourism, but this is not stated in the Act.
4.4.3 NATIONAL WATER POLICY OF 2002
The National Water Policy (NWP) identifies water resources as rivers, lakes, wetlands, springs, reservoirs and groundwater aquifers and acknowledges that water is critical to ecological systems and to the maintenance of the environment.
National Water Policy lists types of water uses as domestic and for supplying livestock, agriculture, industry, mining and energy production, fisheries, sustenance of the environment/ecosystem, wildlife and tourism, forestry and beekeeping and navigation. Water uses are usually prioritized. First priority goes to basic human needs. Water for the environment to protect the ecosystems that underpin our water sources, now and in the future is given second priority. Other uses following after these two are subject to social and economic criteria.
As far as NWP is concerned, there are no procedures and guidelines to ensure sustainability of ecological systems. Therefore, no exact degree of allowable use of water is stated. The policy states only that ‘water allocations and use shall be carried out considering the principles of sustainability so that the resources remain viable for the use of the present and future generations’.
NRM in LGs, TAN Final Report 24

4.5 MARINE POLICY AND LEGISLATION
Marine Fisheries are governed by national legislation as well as international conventions. The international conventions include the UN convention on the Law of the Sea (UNCLOS) and the related Fish Stock Agreements. These impose roles and responsibilities on the coastal state (Tanzania) as well as on the Distant Water Fishing Nations (DWFN). Therefore, illegal activities in the marine context include illegal activities of vessels of DWFN, which contravene national legislation and international obligations.
The 1970 Fisheries Act provides the basis for the national policy framework. It was reviewed in 2002 with the aim to ‘ensure promotion of sustainable fisheries, ensuring adhering to regulations and conservation of resources’ (URT, 2004).
On the mainland, 80 % of the fishing effort is freshwater based and lake fisheries (and export) dominate the policy agenda with marine fisheries somewhat neglected. For example, the Fisheries Master Plan (funded by JICA) is heavily weighted towards the lakes and rivers but there is a marine component (10 % in real terms), which is designed to fit traditional craft with donated outboard motors and better net technology. The effects of these measures on an already fragile stock situation along the coast have not been assessed.
It should be acknowledged, however, that at the moment there are projects aiming to deal more comprehensively with marine fisheries including the World Bank/Global Environmental Facility (GEF) supported ‘Marine and Coastal Environmental Management Project’ (MACEMP) designed to strengthen governance of the EEZ and the near-shore marine environment as well as supporting livelihoods of the coastal communities.
The fact that fisheries are administered by two separate Fisheries Departments (Mainland and Zanzibar) increases transaction costs and the need for co-ordination and exchange of information. There is duplication of effort and neither entity can afford to carry out surveillance unilaterally.
The 1998 Deepsea Fishing Authority Act by contrast has status as a United Republic Law and so applies equally to both Mainland and Zanzibar. The implementation of the Act is however stalled, due to reservations from the Zanzibar Government. An important vehicle for the management of the EEZ is therefore missing. Efforts to regulate resource access in EEZ fisheries are undertaken by each Fisheries Division unilaterally by issuing licenses.
However, enforcement is too lax and the fiscal regime inadequate to enable resource rent capture. There are no onboard observers on the vessels although it is a condition of licenses. Moreover, there is no enforcement of catch reporting or vessel arrival or departure. There are no catch limits attached to the license, allowing vessels to take as much fish as is available with scant information being returned to the coastal state.
NRM in LGs, TAN Final Report 25

5. EXPERIENCES FROM CASE STUDY DISTRICTS
5.1 GENERAL PROFILE OF THE DISTRICTS
5.1.1 OVERVIEW
After concluding the desk study, a field phase was conducted in Morogoro District in Morogoro Region; Kiteto District in Manyara Region; Mafia District in Coast Region; and Muleba District in Kagera Region.
In each district the team explored local governments’ natural resources management practices with emphasis on three key sectors: forestry, fishery and wildlife. The selection of the four districts was made primarily to capture a reasonable spectrum of the substantive variation in natural resource availability, management practices as well as the level of maturity in local governments as summarized in box 2.
Box 2: Case Study Districts
District
(Region)
Land Area (Km2)
Key features
Morogoro
(Morogoro region)
11,925.00 Agriculture is the dominating economic activity but the district also includes substantive forest areas and has implementation experiences from Wild Life Management Areas. Minor activities in support of fishery.
Mafia District
(Coast Region)
1,017.00 Marine fishery is the dominating economic activity for the vast majority of residents on this island and also significant resource for district local revenue. Approximately half the district is designated marine reserve. Several modalities for community-based management of marine resources are implemented. Minor activities on support of wildlife and forestry.
Kiteto
(Manyara Region)
1,668.00 Kiteto district include significant forestry areas and the concept of Participatory forestry Management has been applied for several years with substantive donor support. It is probably the district in Tanzania that has progressed most in implementing commercial use of the forest through PFM. Minor activities in support of wild life management and fishery.
Muleba*
(Kagerea Region)
3,444.00 The district has both significant fishery resources (lake Victoria) and forestry resources but has compared to other parts of Tanzania received limited donor/project support for NRM and the district was selected in part to identify typical non-donor funded NRM practices.
* Muleba district has over 20 Islands in the Lake Victoria with a surface water of 7,295 Km2
NRM in LGs, TAN Final Report 26

The study was conducted in Kiteto, Morogoro Rural, Muleba and Mafia
NRM in LGs, TAN Final Report 27

5.1.2 NATURAL RESOURCES
All the four districts are endowed with natural resources of interest to this study namely forests, wildlife and fisheries.
MOROGORO DISTRICT
In Morogoro district, forest covers an area of about 7,155 Km2 which account for 60% of the total land area. Forest Reserves cover an area of about 117,100 ha.
The Selous Game Reserve is partly in the district. The Reserve is home to almost 60,000 elephants with a high concentration of buffalos, wild dogs, hippos, lions, impala, giraffe and zebra. The district also hosts two Wildlife Management Areas (WMAs) namely Ukutu under a Community Based Organization (CBO) and Jukumu and Wami-Mbiki under an Wami-Mbiki Authorized Association (AA).
Morogoro district has a good network of seasonal and permanent streams/rivers that support aquatic resources basically fisheries. Main rivers include Mvuha, Bwakira, Ruvu and Mape. The district has 249 dams of varying sizes. It is estimated that the district has over 800 improved beehives and over 1500 traditional beehives.
KITETO DISTRICT
Kiteto district has one central government forest reserve called Njoge. The reserve is located in both Kongwa district (Dodoma Region) and Kiteto district (Manyara Region). The reserve covers an area of about 466 ha. Similarly there is one Community Forest called SULEDO situated in the south-eastern corner of Kiteto District. The forest is situated inside the legally gazetted borders of nine registered villages, in the three wards of Sunya, Lengatei and Dongo, from which the forest derives its name. SULEDO (Su = Sunya, Le = Lengatei and Do = Dongo).
The SULEDO forest is vast and species rich miombo woodland covering an area of 167,416 ha. In 1993, the regional forest administration by then Arusha Region planned to set aside and gazette this large forest as a Central Government Forest Reserve. As a consequence, forest inventory was carried out as well as establishing boundaries by placing beacons on the ground to mark the area planned for gazettement. However, no survey of socio-economic conditions was done and hence no consultations with the local people. This triggered an immediate negative response among villagers as the establishment of central Government Forest Reserve would have made a major land use change threatening the livelihoods and undermining the very life style of the surrounding communities.
The villagers were of the opinion that the government be advised to change the idea and leave the villagers to continue with the responsibility. The alternative idea was forwarded to higher authorities and as a result a socio-economic study was carried out in 1994, which finally suggested that villagers should manage the forest. This was well before the new Forest Act which empowers villagers to own and manage forests on their village land was enacted. The proposal was approved for implementation in June 1995. Since then, surveying, mapping and finally gazettement of the area gave the forest the status of Village Land Forest Reserve which is recognized in the new Forest Act (Forest Act No. 14 of 2002).
Wildlife is more concentrated in the northern part of the district due to fact that, it receives migratory wildlife species from Tarangire National Park. Key wildlife species include Zebras, Wildebeests, Buffalos and Elephants. The district hosts Makame Wildlife Management Area (WMA) with an Authorized Association (AA).
NRM in LGs, TAN Final Report 28

Almost the whole district is suitable for beekeeping. Until recently, only traditional beekeeping has been practised using traditional beehives. At the moment it is estimated that there are over 18,000 and about 150 traditional and modern beehives respectively producing about 32,000 Kg of honey and 4,000 Kg of beeswax annually.
MAFIA DISTRICT
The most important aspect in Mafia district as far as natural resources are concerned is the presence of Mafia Island Marine Park. The district is also part of the Marine and Coastal Management Programme (MACEMP). It has huge potential of tourism based on unspoilt beaches and diving areas. Fisheries alone contribute between 60% and 70% of the district income.
MULEBA DISTRICT
Muleba district has miombo and riverine forests. Miombo woodlands are estimated to cover about 47,851 ha whilst riverine forests cover about 82 ha. Plantations are estimated to cover about 150 ha. The district council manages 14 woodlots which cover a total area of 47 ha. There are additional woodlots owned by churches, schools, CBOs, NGOs and individuals. There are two lakes namely Victoria and Burigi. Lake Burigi is shared by three districts: Kagagwe (30%); Biharamulo (10%) and Muleba (60%). Muleba district’s economy depends to a greater extent on fisheries.
The district has two Game Reserves namely Biharamulo and Burigi with about 54 Km2 in total with a number of wildlife species including sable, antelopes, waterbucks, sitatunga, baboons, monkeys and hippos. Bumbire Island in Lake Victoria is one of the most important bird sites in Tanzania.
5.2 LEGAL AND INSTITUTIONAL FRAMEWORK
In all the four case study districts, legal frameworks and policies supporting natural resources management are in place including Forest, Wildlife, Land, Beekeeping and Water Polices and legislations.
However, the general finding was that neither policies nor legislations have been strongly institutionalized in the management of natural resources in any of the districts visited. In short, the policies and legislations are not seen as reference points in the district planning processes when it comes to natural resources although Local Government Act (1982) provides a room for different sectors including natural resources to develop by laws so long these don’t contradict the principal laws.
The conservation of forests, wildlife and fishery has to be understood in a specific political and institutional context. In the broadest sense it operates at multiple political and institutional levels from global to the local levels. The conservation is currently based on a decentralization paradigm. Decentralization is usually defined as an act by which central government formally cedes power to actors and institutions at lower levels in the political administrative and territorial hierarchy (Wild et al., 2009). Decentralization reforms typically aim to achieve several broad objectives (Ribot, 2004) namely:
I. Dismantling or downsizing central government;
II. Consolidating central power by shedding risks and burdens; central government would like to be almost risk free with little load but retaining all strategic powers;
III. Increasing local participation and local democracy;
IV. Implementation efficiency and equity of local service delivery; and
NRM in LGs, TAN Final Report 29

V. Strengthening local governance
One clear challenge seen in both WMAs and BMUs in the study districts with reference to institutional framework are power imbalances in investor negotiations. The private sector as observed in Ukutu WMA, BMUs in Mafia and Muleba districts is a key actor in making either WMAs or BMUs become real business entities. The private sector is a powerful actor with a high degree of self-interest and considerable knowledge on business. Attempts of some investors to own both WMA and BMU formulation processes present a significant challenge. The unequal power relation puts for example the Ukutu WMA at a distinct disadvantage. Unfortunately there are many examples where communities have benefited little from private sector involvement (Sheona et al., 2001 in Kajembe and Lalika 2008).
5.3 LOCAL GOVERNMENT PLANNING PROCESSES
5.3.1 HISTORY OF PLANNING IN TANZANIA
Since independence in 1961, the Government sought to have participatory planning with a view to attaining a bottom-up oriented national development (URT, 2007). The Government’s efforts to achieve this could be seen in the various measures taken to steer people’s participation in shaping their development. These efforts could be categorized into three broad phases, the 1961 – 1966 (immediately after independence); 1967 – 1992 (Arusha Declaration); and 1992 – 2002 (reforms’ era).
The first period, 1961 – 1966, was led by the independence vision. The goal was to attain higher standards of living by fighting three enemies namely: illiteracy, diseases and poverty. The second period, 1967 – 1992, was led by the Arusha Declaration, driven by the philosophy of socio-economic liberation based on socialism and self-reliance as a long-term national development goal. The strategy for implementing the Arusha Declaration also aimed at ‘devolution of powers’ to the people. As a result, the Local Government Authorities of the colonial administration were abolished in 1972, to pave way for the introduction of the Regional Decentralization. Under Regional Decentralization, Village Governments, District Development Committees and Regional Development Committees were established to enable more participation in decision-making. This was provided for by the Regional Decentralization Act of 1972.
In order to enhance the decentralization process by devolution, the Local Government Authorities were re-established by Act No. 7 – 10 of 1982. This was in accordance with the constitution of the United Republic of Tanzania of 1977, Articles 145 and 146 which allow the establishment of Local Government Authorities to facilitate transfer of responsibilities and power to the people. These local Government Authorities have the right and power to participate, and to involve the people in the planning and implementation of development programmes within their jurisdiction.
The period 1992 – 2002 was characterized by Reforms in the public sector. The Government of The United Republic of Tanzania (Mainland) undertook the reforms in order to increase efficiency and the capacity of the public sector to deliver quality services. The reforms centred in the following areas:
Civil Service reforms
Local Government reforms
Financial Sector reform
Legal Sector reform
Planning and budgeting reform
NRM in LGs, TAN Final Report 30

Parastatal Organizations reform
Restructuring of the Regional Administration
These reforms aim at changing the role of the central Government from directly involving itself in production and service delivery, to that of policy formulation, coordination, advisory, capacity strengthening of Local Governments, private sector and Non Government Organizations, and to create an enabling environment for the local Government Authorities to perform. The Local Government Authorities are required to assume the role of implementers and facilitators of all development activities, service delivery, rule of law and strengthening of democracy to speed up community development.
Although the government has continuously set a conducive environment for the people to participate as explained above, yet, the planning process continued to be dominated by government planners/economists, bureaucrats and donors who have an illusory feeling of control and efficiency, based on ‘we know, they (communities) do not know’. Therefore, effective participation in planning and decision making remained essentially remote.
5.3.2 OPPORTUNITIES AND OBSTACLES TO DEVELOPMENT (O & OD)
The Opportunities and Obstacles to Development (O&OD) methodology as claimed to be used in the four case study districts is a comprehensive participatory planning process which was developed to overcome many of the short coming of classical planning methodologies (URT, 2007).
The government believes that O&OD will promote self-help spirit, mobilize material and human resources, and enhance transparency and accountability in:
Planning
Decision making
Implementation and management of development activities
The methodology is said to be institutionalized in the Local Government Authority Structures. The planning process starts at the village level then at the ward level up to the district council.
Experience from the field indicated that this is more easily said then done. Worse still, if at all O & OD is practised, natural resources are still only marginally taken into consideration. Discussions with villagers, ward and district officials showed that the priority has always been and still is on education, health, water and roads. These are the very national priorities. Discussions with District Planning Officers in the case study districts showed the following major steps being followed in the planning process:
Receiving Medium Term Planning and Budgeting Guidelines issued annually by the PMO – RALG.
Ward Executive Officers (WEOs) are then required to submit development plans and budgets prepared in supposedly participatory manner. The plans and budgets are for the 50% of the total amount given as Local Government Capital Development Grant (LG & CDG). Usually no Indicative Planning Figures (IPFs) are provided.
WEOs inform the Ward Development Councils (WDCs) about the requirements from the district councils to submit development plans and budgets.
Based on the deliberations at WDCs, Village Executive Officers (VEOs) and Village Chairpersons initiate the process of developing plans and budgets. This is being done
NRM in LGs, TAN Final Report 31

through convening village government meetings at which the previous year plans are reviewed and then decisions are made on the priorities which are then submitted to WEOs for presentation to the WDCs.
While the plans are on their way to the District Councils, VEOs and Village Chairpersons convene Village Assemblies and present the plans submitted to the WEOs and try to convince the villagers that the plans are in their best interest.
Thereafter, the endorsed development plans by the Ward Development Committees are sent to the District Councils.
At the district level, each Head of Department (HoD) pick issues of his/her interest from the consolidated plans and include them in the sectoral plans. Thereafter, the plans are presented to the District Councils through the Council Management Teams (CMTs).
Thereafter, the consolidated district plans and budgets are submitted to the Regional Secretariats for comments.
Then, the consolidated plans and budgets are tabled at the District Councils’ Finance and Development Committees.
Furthermore, the overall district plans and budgets which include comments from the Regional Secretariats (RSs) are submitted to the Full Councils for approval.
Finally, the plans and budgets are submitted to the Ministry of Finance and PMO – RALG for funding.
Though Tanzania advocates about the philosophy of Decentralization by Devolution (D by D) which adheres to downward accountability, the steps narrated above indicates clearly that the real situation is upward accountability to the central government. As argued by Ribot (2002) this is essentially administrative or deconcentration decentralization instead of Decentralization by Devolution model which is downwardly accountable.
In short, Natural Resources are hardly given attention in O & OD Planning Methodology as they are not part of the national priorities (Box 3).
Box 3: 0 & OD Planning in practice
NRM in LGs, TAN Final Report
According to DPLO Mafia, planning is about nothing but setting priorities. The planning process is at all levels in conformity with the national guidelines and procedure to O&OD which empowers community to be the basis of the district plans. The O&OD plans are often overruled by political decisions. The actual implementation of the O&OD plans requires support and assistance from technical staff. With the current financial situation it is difficult to give the communities the support they need.
32
5.4 LOCAL GOVERNMENT REGULATORY PROCESSES
Participation in the exercise of environmental regulatory powers can transform local communities into ‘environmental subjects’. When the local government has meaningful powers and is open to be influenced by the people it represents, local people are transformed from ‘managed subjects’ into ‘engaged citizens’ (Kajembe and Lalika, 2008).
By providing a domain of discretion and substantive powers, natural resources have potential to strengthen, legitimize and sustain local authorities. Local governments, no matter how imperfect they may be, serve multiple purposes and are permanent public institutions, as they can be sustained beyond the end of area based projects and outside interventions.
However, in the four case study districts, local governments didn’t seem to have meaningful powers and local communities don’t seem to influence them in a meaningful way. SULEDO village Forest Reserve is a case in point whereby instead of the village governments of the nine villages surrounding the forest to make a by-law and be endorsed by the Kiteto district council, the Division of Forestry and Beekeeping is supposed to issue a model by law to be adopted. Here the interests of ‘engaged citizens’ are not necessarily the same as those of the LG. Immediate local needs and the central levels desire to retain an overall ‘national’ outlook needed to be reconciled with outside facilitation. Complicating matters was a conflict of interest between the District Commissioner on one hand and the District Council and the Suledo Zonal Office on the other hand. SULEDO has recently entered into a contract with a private company for controlled and sustainable extracting timber, generating substantial revenue for the benefiting communities.
In Mafia, the District Forest Officer (supposedly on behalf of the District Council) was chased by the local communities when he tried to enforce the ban on tree cutting. This shows that citizens can not yet be regarded as engaged citizens as they are supposed to be.
5.5 NATURAL RESOURCE SECTOR STAFF POSITION
Discussions and observations in the case study districts show that local governments in Tanzania today have no adequate manpower required for competent, effective and efficient management of natural resources as Table 5 shows:
TABLE 5: NATURAL RESOURCES SECTOR STAFF IN THE STUDY DISTRICTS
Sector DistrictMorogoro Kiteto Mafia Muleba
Forestry 2 BSc1 Diploma
1 Certificate
3 Diploma 1 Diploma 1 BSc1 Diploma
Wildlife 1 Diploma 1 BSc 0 1 DiplomaFisheries 1 Diploma 0 2 MSc
1 Diploma2 MSc
4 Diploma
As Kajembe and Lalika (2008) argue, capacity is essential to exercise power and responsiveness. Local governments still require the following: Technical Knowledge and Skills; Financial Management Skills; Ability to call technical expertise; Ability to negotiate and Ability to use courts of laws.
Substantial capacity is necessary, for example, to harvest the huge SULEDO Forest Reserve in Kiteto district. Discussions with Central Government Officials indicated that they are reluctant to transfer powers to the Local Governments until the time when they will have the capacity. This may sound
NRM in LGs, TAN Final Report 33
reasonable, but many researchers claim that it is unlikely that local governments can develop skills without having powers to exercise and practice them. Once the powers are transferred, local governments may require capacity.
With regard to human resource management issues i.e. recruitment, disciplinary action, transfer and even termination are all aspects of human resource management in which central government is extensively involved. Discussion with the District Human Resources Management Officers in the study districts show that transfer of staff is an aspect that LGAs still have no influence or control over. PMO-RALG and RAS (for some staff) can transfer the staff based at the local government to other places as they deem fit. These transfers are usually affected without consulting LGAs.
With respect to disciplining staff, councillors have powers to discipline some of the staff except those appointed by the President or Minister responsible for local government authorities. However, even for those they can take disciplinary action against, any disciplinary action is required to be reported to the Permanent Secretary PO-PSM for review. According to civil service Act, No. 8 of 2002, the civil service commission is the appellate authority for all staff whose disciplinary authority is the local government authority. This is to say, the disciplinary action taken by the councillors can always be challenged by the commission.
The complexity of the human resource management issues make councillors think that it is an area that they have no control over and which in their opinion, central government has not decentralized (Orgut Consulting AB, 2008). This is due to the fact that discretion in this aspect is too limited and subsequently, accountability can hardly be demanded from the councillors.
5.6 NATURAL RESOURCE REVENUE AND EXPENDITURE IN THE STUDY DISTRICTS
Tables 6 – 9 show revenue generated and expenditure for the three key sub-sectors forestry, wildlife and fisheries. In aggregate terms fisheries was found to generate a substantial amount of income to LGs particularly in Mafia and Muleba districts. The study also found that there was almost no allocation for NRM from own resources. Again, the tables show how little reliable data is available in the field or at central government.
TABLE 6: INCOME FROM FORESTRY AND FISHERIES SUBSECTOS FOR MOROGORO DISTRICT*
Year Forestry - TAS Fisheries – TAS1999 10,618,857.75 Data not available2000 17,460,661.80 Data not available2001 18,264,194.60 180,000,000.002002 Data not available 182,000,000.002003 Data not available 185,000,000.002004 Data not available 176,000,000.002005 Data not available 156.000,000.002006 Data not available 188,000,000.00
* No expenditure data was available
TABLE 7: INCOME FROM FORESTRY AND WILDLIFE SUBSECTORS FOR KITETO DISTRICT
Year Forestry -TAS Wildlife - TAS1997 Data not available 10,955,156.001998 Data not available 14,336,310.001999 Data not available 19,505,764.002000 544,830.00 20,694,831.00
NRM in LGs, TAN Final Report 34

2001 1,143,250.00 39,937,945.002002 733,150.00 314,469.00*2003 852,000.00 15,223,869.00
*Data was from local hunting only and nothing was available from tourist hunting.
TABLE 8: INCOME AND EXPENDITURE FROM FORSTRY, FISHERIES (MARINE) AND WILDLIFE SUBSECTORS FOR MAFIA DISTRICT
YEAR Forestry - TAS Fisheries - TAS Wildlife - TASIncome Expenditure Income Expenditure Income Expenditure
2007/08* 220,000.00 Data not available 140,000,000.00 11,721,314.00 Data not available 2,193,600.00*Data was available only for 2007/08
TABLE 9: INCOME AND EXPENDITURE FROM FORESTRY, WILDLIFE AND FISHERIES SUBSECTOR FOR MULEBA DISTRICT
YEAR Forestry - TAS Wildlife - TAS Fisheries - TASIncome Expenditure Income Expenditure Income Expenditure
2005/2006 1,159,250.00 5,695,000.00 154,400.00 7,890,059.00 120,023,920.00 17,408,568.002006/2007 2,265,210.00 9,974,200.00 396,916.00 7,890,087.00 242,673,940.00 19,056,270.002007/2008 1,803,500.00 15,197,200.00 44,304.00 10,736,778.00 223,874,900.00 32,640,000.00
The tables show that with the exception of fisheries, both forestry and wildlife tend to generate inadequate revenues to cover even their own expenditures. The deficits have in most cases been covered by the funds from Development partners
NRM in LGs, TAN Final Report 35

6. OVERALL CONCLUSIONS
6.1 INCOMPLETE DEVOLUTION
6.1.1 A ‘COCKTAIL’ OF DECONCENTRATION AND DEVOLUTION
Decentralization has been implemented in the study districts in all key natural resources sub-sectors namely forestry, wildlife and fisheries. Decentralization is usually referred to as the transfer of power from the central government to lower levels in a political – administrative and territorial hierarchy. Decentralization refers to a transfer to lower-level central government authorities, which are upwardly accountable to the central government (Ribot, 2002). In contrast, political or democratic decentralization refers to the transfer of authority to representatives and downwardly accountable actors such as elected local governments (Ribot, 2002).
Tanzania claims to adhere to political or democratic decentralization popularly referred to as ‘Decentralization by Devolution’ (D by D). However, experience from the study districts showed a cocktail of decentralization by deconcentration and decentralization by devolution. In Morogoro district for example, two cases of Wildlife Management Areas (WMAs) namely Wami-Mbiki and Ukutu testifies to this reality. In Ukutu WMA under Jukumu Community Based Organization (CBO), one can observe the presence of administrative or decentralization by deconcentration model, whereby GTZ was managing the WMA from Wildlife Division Headquarters in Dar es Salaam without involving the district council. Discussion with the Morogoro district council officials indicated that they were not involved in the planning and implementation of the WMA until recently when GTZ left the area that is when the government through the Wildlife Division saw the need to involve the district. The involvement however, is just in theory as there are no operational funds. In the case of Wami-Mbiki, one would see a case of decentralization by devolution whereby the district councils of Morogoro, Mvomero and Bagamoyo were involved in both planning and implementation.
Cases of decentralization by deconcentration or administrative decentralization were similarly observed in Mafia and Kiteto districts. In Mafia district, the Rumaki (Rufiji, Mafia and Kilwa) project is facilitated/implemented by WWF. In Kiteto, the Sida-financed Land Management Programme (LAMP) still acts as a facilitator to consolidate ‘best practises’ in decentralised forestry and wildlife NRM that are meant to be used by the central government for scaling up in suitable locations.
A rather classical case of D by D model could be observed in Muleba district with Katembe Magadini Beach Management Unit (BMU) as a case in point. In this BMU, seemingly effective decentralization by devolution with a realm of local discretionary power under representative authorities has been created not withstanding the challenges being faced by the unit.
6.1.2 LOCAL DEMOCRACY AND IMPROVEMENT IN NATURAL RESOURCE MANAGEMENT
Experience from the study districts showed clearly that local democracy can improve natural resource management while at the same time natural resource management can enable good governance to emerge.
Several area-based programmes have shown that by building organised ‘pressure’ from below (village and sub-village levels), LGAs can actually be moved/motivated to pay more attention to and invest in NRM - provided that funding is made available to make up for the lack of government grants and that required local technical expertise is made accessible for LGAs.
NRM in LGs, TAN Final Report 36

Democratic representation as demonstrated by the presence of an Authorized Association (AA) at Wami-Mbiki WMAs; Village Natural Resources Committee at Sunya Village, Kiteto; Beach Management Unit (BMUs) in Mafia and Muleba districts helped to incorporate local knowledge and multiple local voices, and hence implications on decision making on natural resource management. Strengthening such organisations through outside support programmes was often needed to overcome initial resistance from political stakeholders in LGAs that saw their highly lucrative exploitation of NR suddenly threatened.
Just as democratic decentralization may improve natural resource management, equitable natural resource use and public control of natural resources can be a lever to promote local democracy. Furthermore, by providing a domain of discretion and substantive powers, natural resources have the potential to strengthen, legitimize, and sustain local authorities and transform local people from managed subjects into engaged citizens.
6.2 BEHAVIOURAL, INSTITUTIONAL AND LEGAL ISSUES TO RESOLVE
6.2.1 THE DILEMMA OF LETTING THE ‘POWER GO’
Tanzania has a history of state dominance over decision making dating back to colonialism and socialism eras. The notion of involving local communities in the management of natural resources has found its way in most policies and legislations in Tanzania, but field visits confirm it still has yet to be fully institutionalized at the district level and downwards.
Natural resources managers particularly at ministerial level are reluctant to let ‘the power go’. The case of Ukutu WMA being managed from Dar es Salaam until recently is a living example.
Similarly, the delay to issue harvesting authority for SULEDO Forest Reserve, Kiteto by the Director of Forestry and Beekeeping took considerable time to resolve. Here the importance of neutral outside facilitators (i.e. provided by the LAMP programme) that, over extended periods of time, ‘broker’ agreements is confirmed. Such demand-driven facilitation helps overcome a raft of seemingly small but actually crucial legal and administrative hurdles that steadily emerge when ‘new ways of doing things’ are tested, which ultimately become institutionalised and find their way into legislation. This need for patient, continuous follow up and linking LGs with central level actors should also be considered when designing new ways of channelling funds through a NR sector grant arrangement.
6.2.2 RESISTANCE TO CHANGE: DECENTRALIZATION AND ENTRENCHED PATRONAGE PATTERNS
It is widely recognised that Decentralization by Devolution underlying CBNRM threatens entrenched patronage patterns from the highest level of central government to the front-line natural resource managers.
As observed in the case of Ukutu WMA, it threatens powerful urban-based commercial interests who fear losing access to productive natural resources, in this case wildlife. It threatens the roles of local elites and government administrators already present in the local area as observed in the case of Wami-Mbiki.
It is no wonder therefore that integration of natural resources into local government decision making in Tanzania is progressing slowly. The partial implementation has often led to a perception that decentralization in natural resources management is not working: those who are threatened by the decentralization are quick to declare it a failure.
NRM in LGs, TAN Final Report 37

Integration of natural resources into local government decision making involve relocation of power, producing winners, losers and resistance as observed in the case of BMUs in both Mafia and Muleba districts as well as in the case of WMA in Ukutu, Morogoro.
Integration of natural resources into local government decision making is about asking the rich and powerful to give up some of their wealth and power to the poor and marginalized people. Even if there are long-term benefits for the well off, resistance, out of fear and self-interests is inevitable.
Promoters of community based natural resource management, therefore, can only move towards getting things right by confronting resistance and by identifying and seizing opportunities – again and again.
DECENTRALIZED NRM AS AN ARENA OF POLITICAL STRUGGLE
Discussions with different stakeholders in the study districts indicated that decentralized natural resources management has created a new ‘arena of political struggle’ and that the rules of the game in this arena are contested and still in the process of being settled.
6.2.3 LACK OF LG INSTITUTIONAL CAPACITY?
A ‘general’ lack of capacity is often quoted a as a reason not to integrate natural resources into local government decision making mechanisms. Local governments receiving powers they have never held before may not have the skills to exercise those powers effectively. Capacity is necessary for the powers that require skilled action to exercise for example logging in the SULEDO Forest Reserve. However, many powers, such as the power to decide who should exploit the SULEDO Forest Reserve do not require special skills. Capacity therefore should be evaluated with respect to specific goals. As Ribot (2004) argues, when faced with the question of whether local capacity constitute a bottleneck to successful decentralization reforms, before attempting to offer an answer, one should ask ‘capacity to do what?’
The notion of ‘lacking in capacity’ is readily used in Tanzania as an excuse to retain central control over lucrative aspects of natural resources. Also as Ribot (2004) argues capacity arguments can be a cover for maintaining the ‘corrupt rent – seeking opportunities’ for central agency actors. Even when local governments genuinely lack capacity as in the case of Mafia district, capacity sometimes will follow power, that is, people learn from exercising power.
Evaluations of area-based programmes that facilitated an inclusion of NR issues into District council budgets and that were fully integrated into LGA structures often noted a considerable increase in LG staff motivation levels as many technical officers were for the first time able to plan, budget for and implement activities in their otherwise chronically underfunded sectors. In other terms, the ‘lack of capacity’ has also to be understood as a ‘lack of opportunity’ for many officers to actually apply their skills in practise. This ‘empowerment’ of staff can, as stated earlier, only be maintained if an LG knows that funds for NR will be predictable and available in the future as well.
As argued by the Muleba District Planning Officer, capacity arguments and technical arguments for retaining powers at the center should be weighed with great care. At the center there is much fear of losing power. It can be argued that:
Powers that are less conflictual should be devolved before those that are more conflictual.
Powers that are less likely to threaten long-term sustainability should be devolved before those that are certain to cause damages if misused
NRM in LGs, TAN Final Report 38

Powers that do not require any funding should be transferred before powers requiring funds and
Powers requiring little local skills should be transferred before those requiring high technical or financial management capacity.
6.2.4 MANAGEMENT PLANS
The practice of requiring local communities to have complex management plans before they are allowed to manage and use local resources is blocking natural resources decentralizations (refer to the case of SULEDO).
Requiring local users to adhere to minimum ‘standards’ may be a better option than requiring them to develop complex management plans.
6.2.5 INCENTIVES FOR INTEGRATING NR INTO LG DECISION MAKING MECHANISMS
District councils have competing problems to attend. Discussions with local communities in the study districts revealed that they rarely choose natural resources during the O and OD planning exercises.
Therefore, local governments need specific incentives to get involved in natural resources issues as amply revealed in the study districts.
Central government, development partners and NGOs can play a role in creating incentives for district councils and local communities to invest in natural resources management.
6.2.6 VILLAGE LEADERS AS LAW MAKERS, LAW ENFORCERS AS WELL AS JUDGES
It is a problem that villages leaders are often law makers, law enforces as well as judges in cases of resource conflicts.
Although the 1982 Local Government (District Authorities)Act stipulates that conflicts must be settled in court, the reality as observed by the team is that conflict are almost invariably settled at the village level. Villagers in conflict with leadership are in difficult situation, as it is complicated to appeal to higher levels in the local government system without a letter from the same leaders and because access to courts is time consuming and expensive. Hence, village institutions – despite being elected – still have characteristics of ‘fused powers’ where the legislative, executive and judiciary powers are held by one body.
Thus, the very strength of Tanzania village institutions in relation to decentralized natural forest management - that they are well organized and capable managing – also comprises a potential weakness in terms of achieving social equity.
6.3 REVENUE GENERATION FROM NRS
6.3.1 REDUCING MANAGEMENT TRANSACTION COSTS
Management transaction costs are likely to be reduced due to proximity of local institutions for taxation and fee paying as observed in the case of BMUs in Muleba, which are involved in giving fishing licenses. This activity was formerly handled by the fisheries Department of Muleba district council.
6.3.2 LOCAL COMMUNITY UNCERTAINTY
NRM in LGs, TAN Final Report 39
Short time horizons and uncertainty as to whether reforms will last tend to create opportunism and encourage resource over exploitation. Local communities expect too much too soon from decentralization. Conflicts and frustrations are part of the nature of the transition.
If decentralizations in natural resources management are to unfold, they will need time to stabilize and for the local people to have confidence that the powers they received will stay.
6.3.3 THE ‘OTHERS’: PRIVATE SECTOR AND NGOS
DISTRICT COUNCILS AS ‘POWER BROKERS’ BETWEEN PRIVATE SECTORS AND LOCAL COMMUNITIES
The private sector as observed in Ukutu WMA, Morogoro and in fisheries sub-sector in Mafia and Muleba districts is a necessary partner. However, there are many examples where communities have benefited little from private sector involvement. For instance in Zambia, tourism partnerships have provided little more than an opportunity for employment for a very small number of community members (Sheona et al., 2001 in Kajembe et al., 2003) and research in East Africa shows similar results.
Private sector is a powerful actor with a high degree of self interest and considerable knowledge of business. District councils must be empowered to serve as capable ‘power brokers’ that can meet the private sector competently and with confidence.
NON-GOVERNMENTAL ORGANIZATIONS AS ‘FIELDS OF POWER AND AUTHORITY’
NGOs can act to achieve collective ends but they are themselves fields of power and authority and not merely collective actors supporting democracy. The conflict between the district councils of Morogoro, Mvomero and Bagamoyo and the Danish Hunting Company NGO which was facilitating the formation of the Wami-Mbiki Authorized Association is a case in point.
As observed in the case of Wami-Mbiki WMA, a strong NGO –out of obvious self interest- is likely to push representative authorities to pursue the NGOs agenda.
6.4 CORRUPTION
6.4.1 CORRUPTION IN NR SECTOR
Tanzania has in recent years witnessed an increasing and intensified debate on corruption. This openness is a positive sign of increased transparency, stronger media and more active Parliament among others. The most spectacular recent events has been the misuse of more than 130 million USD from the Bank of Tanzania External Payments Account leading to the dismissal of the Governor of the Bank of Tanzania in December 2007 and the Richmond scandal that led to the resignation of the Prime Minister in February 2008 on account of mismanagement of the 170 million USD procurement of electricity supply. Yet the country does not perform well in the latest ranking of Transparency International.
One of the very positive trends in Tanzania in recent years has been an increase in public attention to the extensive corruption in the country. For many years the discussion on corruption in Tanzania mainly took place at a general level, without making reference, to specific cases. During the last four to five years this has changed and a number of very concrete cases have been brought up in the media.
Several major corruption cases have also recently been well documented in the NR sector that provide some useful insights into aspects of local government NRM. A particular well-documented case is the analysis of illegal exploitation of the forest in southern Tanzania (Milledge et al 2007). The
NRM in LGs, TAN Final Report 40

study documented how exploitation of the forest exploded after a new bridge was opened over the Rufiji River in 2003. The study documented how logs worth tens of millions of USD were illegally exported – mainly to China. The study estimated that Tanzania annually lost 52 million USD of its potential revenue due to illegal logging. An interesting observation from this study of corrupt practices was that so many government institutions colluded and benefited – from the very top, through regional and district administration to village institutions – which indicated a very problematic lack of separation of powers and lack of independent watchdogs. The intended system of checks and balances failed to work and so much quoted nascent civil society is so far from able to make any substantial difference.
ELITE CAPTURE AND SYSTEMIC CORRUPTION
Experience from all the study districts indicated the district councils are first of all upwardly accountable to the central government. In the authors’ opinion, the local government reforms simply tend to enact a theatrical image of reform for donor audiences. Effective decentralization requires creation of realm of local discretionary powers which is missing at least in the study districts. It is in our opinion that local governments in Tanzania are still passive or even colluding subjects in a well-established culture of elite capture and corruption.
6.5 CREATING LOCAL ACCOUNTABILITY AND INTEGRATION OF LOCAL KNOWLEDGE
6.5.1 EMERGENCE OF A CULTURE OF STANDING UP FOR ONE’S RIGHTS
Yet the field visits also support the claim that a culture of standing up for one’s rights and demanding recourse is emerging and taking root to challenge the previous perception that, unlike elsewhere, Tanzanians are entirely ‘uncritical’ citizens. The situation observed in Ukutu and Wami-Mbiki WMAs, whereby members were questioning and demanding clarifications on financial matters and about the delay of having an Authorized Association Status (AA) in Ukutu and lack of transparency in Wami-Mbiki are such cases. In short, local communities are sensitive when it comes to lack of transparency and accountability among the leaders.
6.5.2 AAS, BMUS AND VILLAGE NATURAL RESOURCES COMMITTEES ACCOUNTABILITY
Authorized Associations (AAs) in Wildlife Management Areas (WMAs); Beach Management Units (BMUs) in fisheries and Village Natural Resources committees appeared to be relatively successful as community based natural resources management institutions, provided they do not become ‘elitists’ but remain accountable to the local communities. Mechanisms to ensure this need to be put in place by developing clear working terms of references for these local level governance structures with periodic training to improve their skills on natural resources management as well as on governance issues including accountability, transparency and equity.
Furthermore, the greater the authority and power such institutions receive and the more the state is willing ‘to let it go’, the more likely are to succeed.
6.5.3 INTEGRATING LOCAL KNOWLEDGE IN THE MANAGEMENT OF NATURAL RESOURCES
Environmental characteristics (e.g. tree and wildlife species) vary greatly from area to area and change over time, as do the multiple and overlapping claims and social meanings attached to natural resources. As a result, natural resources management often requires more local knowledge than other sectors, such as education and health. Democratic representation can help to incorporate local
NRM in LGs, TAN Final Report 41

knowledge and multiple local voices, and hence the implications of actions into decision making about natural resource use.
Natural resources are particularly well suited for reinforcing representative local authorities. First, the great variability of natural resources privileges certain kinds of local knowledge over outside expert knowledge. Second, natural resources can support local authorities by providing them with substantive powers. Natural resources can support local authorities by providing them with finances through taxation and fees and with powers over lucrative activities and subsistence goods that are meaningful and necessary to local people and their livelihoods.
6.5.4 THE IMPORTANCE OF SOCIAL LEARNING
Building Community Based Natural Resources Management (CBNRM) institutions that are representative of different interests among local actors and sensitive to the dynamics of power relations in the communities is intensive and time consuming process. It calls for involving all actors, regardless of their socio-economic status in the negotiation process.
Differences and conflicts of interest need to be worked out and collective stakes should be strengthened through a ‘social learning process’. It should be emphasized that any attempt to speed up implementation and ignore the social learning process will condemn the philosophy of integration of natural resources into local governance to failure in the long run.
NRM in LGs, TAN Final Report 42

7. CONCLUSIONS & RECOMMENDATIONS FOR LG NR GRANTIt has for some time been discussed in Tanzania to mainstream the various donor supported projects in the NR sector into local governments planning and budget process by integration of external funding through the design of some form of a NR sector block grant to LGAs through the LGCDG system. The summary statements from the PFM Sector Review below illustrate the issues and direction of the debate.
SUMMARY RECOMMENDATIONS OF PFM REVIEW FOR NR SWAP THROUGH LGDG SYSTEM
The mission recommends the PFM/forestry sector should be integrated in a wider natural resources sector (NR) SWAp with an associated ring-fenced natural resources sector grant under the LGCDG system. This would require appropriate inter-ministerial institutional arrangements, including a NR Sector Steering Committee with (probably) MNRT as the lead ministry, and in addition PMO-RALG, VPO/ DoE and the ministries of lands, water, livestock services and fisheries. A DP-supported natural resources sector (umbrella) programme would facilitate the establishment of the NR SWAp. This could take a shape that would be comparable to the ongoing ASDP, and it could have two broad components: a national support component and a local support component. In order to ensure that the decentralised level is being supported as much as possible it is recommendable that the fund distribution to the two broad components is regulated by setting a ceiling for the amount (TZS) or share (%) of the fund that can go to the national support component. One of the major concerns with the NR SWAp by use of the LGCDG funding mechanism is that the decentralised part of forestry, like e.g. PFM, will not be given sufficient attention and thus means for development. This potential drawback should, however, be tackled by learning from e.g. agriculture, where funds are earmarked for a few sub-sectors. A ring-fenced NR grant could for example initially have 2-3 such sub-sectors with forestry as one of them, which the review mission recommends.
In this chapter we will, based on our analytical work and previous experiences with design of similar LG grant modalities, discuss the proposed initiative and the extent to which it will facilitate integration of natural resource management into LGAs in an effective, efficient and sustainable manner. The chapter will
1. Present an overview of the proposed approach for integration into LGDG,
2. Discuss experiences from the LGDG and existing sector windows of the LGDG
3. Present the potential benefits and key challenges of such a NR SWAP,
4. Conclude
7.1 PROPOSALS FOR NR SECTOR WINDOW OF THE LGCDG A debate on whether and how in practice to fund NRM through the LGDG system is ongoing in Tanzania. The most elaborate discussions and proposal are found in a design proposal developed April 2008 by a consultant team working for MNR and Norwegian Embassy11.
The proposal was developed as a response to concerns over fragmentation of support modalities for NRM in LGAs and a subsequent need for harmonization and further integration of support modalities into existing government and LGA planning modalities.
The objective of the proposed grant is defined (see box below) and two main options for its design presented.
11 Ministry of Natural Resources and Tourism, Prime Minister’s Office Regional Administration and Local Government: Design proposals for a Local Government Natural Resources Management Grant - A report submitted to the Royal Norwegian Embassy, Dar es Salaam by Pfliegner, Blomley, Sola April 2008
NRM in LGs, TAN Final Report 43

PROPOSED OBJECTIVE OF NR GRANT
The LG-NRM Grant represents a financial transfer mechanism for sustainable and decentralised natural resource management mainstreamed into district development planning processes with the following overall objectives:
To support protection, management and sustainable use of natural resources.
To establish robust CBNRM at local level that maximise sustainable returns to communities.
To support economic investments and income generating activities, that reinforce sustainable NRM at local level.
To support the collection, consolidation, retention and reinvestment of sustainable NRM revenues.
In addition to these physical objectives, a number of process outcomes are anticipated:
To strengthen fiscal decentralisation – both local revenue collection and inter-governmental transfers.
To strengthen accountability, transparency and financial management in sustainable NRM at LG levels.
To bring NRM into the formal economy, by generating and collecting sustainable revenues that are reinvested into NRM, thereby decreasing need for long term, external assistance.
To consolidate, harmonise and mainstream all NRM funding (DPs, national NR revenues channelled to LGAs and local NR revenues).
To increase data availability at local level in ways that support more effective NRM decision-making.
Two main options for design were presented in the consultants report. (Figure below)
NRM in LGs, TAN Final Report 44

TWO MODELS FOR LG GRANT DESIGN
OPTION 1: NRM GRANT WITH INTERNAL RING FENCING:
Following the preparation of the environmental action plans, local government authorities will identify core sub sectors that require investment, as a result of identified threats or opportunities. LGAs may qualify for one or more of the four sub-sector grants (forestry & beekeeping, wildlife, fisheries and wetlands).
OPTION 2: CONSOLIDATED NRM GRANT.
This consolidated grant provides a single transfer mechanism to support the implementation of the Environment Action Plans developed with Grant 1. As with Option 1, the grant is conditional, formula-based and universally available to qualifying LGAs.
In the report it is suggested, “the indicator of Performance Measure for both design options would be ‘DEAP developed and implemented’. This is in line with the Agriculture Sector Grant and would avoid a complex system of performance assessment comprising many indicators. A scoring system would still need to be agreed upon indicating the total score, minimum score below which a penalty applies and the minimum score to receive the performance bonus based on the performance assessment - The above MCs and PMs need to be integrated into the existing LGCDG assessment manual”.
NRM in LGs, TAN Final Report 45

The Report presents the pro and cons for the two options and recommends option 2 – the Consolidated NRM Grant “because it meets the primary objectives of grant, is in line with the governments stated D by D policy and consequently is most likely to be accepted by the LGCDG SC as an approved sector window”
TABLE 10: IMPLICATIONS OF THE TWO LG NR GRANT OPTIONS
Option 1: NRM Grant with Internal Ring Fencing: Option 2: Consolidated NRM Grant Can track funds by specific sub-sectors at district,
regional and national levels. DPs and MNRT Divisional staff retain control over
internal allocation within and between sub sectors.
DPs can opt in or out of different sub-sectors. Ensures national priority policy areas that may not
be prioritised locally (e.g. wetlands, catchment forests) get an assured allocation.
Allows the conditional linkage of sub-sector grant to sub-sector revenue collection, (e.g. fisheries grant tied to co-funding from fisheries revenue)
Less likely to be accepted by LGCDG SC due to multiple, ring fenced grants
Contradicts D by D policy by placing strong conditionality
More complicated to administer and higher transaction costs
Less likely to achieve synergies between sub sectors and may lead to increased compartmentalisation of sub-sectors
Central government / DPs cannot earmark funds by sub-sector but they are able to track actual expenditures by sub-sectors
Supports decentralisation by devolution by empowering LGA decision making over resource allocation
More likely to achieve synergies between sub sectors
Possibility that local priorities (e.g. community based forest management) may take precedence over national policy priority areas (eg wetlands or catchment forest protection)
More likely to be accepted by LGCDG Steering Committee
Requires strong technical guidance for planning and budgeting from line ministries to ensure that national policy objectives and priorities are met
Less complicated to administer Separates more clearly the financial transfer
mechanism from technical guidance for planning, budgeting and implementation
7.2 NR GRANT DESIGN ISSUES AND CHALLENGES The design report point to a number of challenges – in particular the need for creation of consensus on the basic principles of design – i.e. agreement on option 1 or 2. It appears from consultations that many of the development partners supporting existing NR projects targeted for “mainstreaming” through the NR Grant are hesitant to support in particular option 2, whereas views of Government are more supportive, although full integration (option 2) at present mainly is supported by MOFEA and PMORALG rather than many of the sector stakeholders.
However, even if consensus may be generated for one of the two main design options, it will still be challenging to design the LG Grant. Below we summarize based on experiences with other similar grants key design issues and challenges. It should be noted that the issues below are inter related. If for instance the investment menu is restricted to support of LGAs core regulatory and capacity building functions it would have implications for other aspects of the grant design – for instance rules for sharing the grant between HLG and LLGs.
7.2.1 FORMULA
A formula for distribution of resources across local governments has to be agreed upon The Consultant team presented some preliminary ideas, but much further work is required to ensure that the formula will be need based, in support of the overall grant objectives and based on objectively verifiable indicators. The “NR sector” is very different from e.g. education and health sectors (that currently constitute the vast majority of LG fiscal transfers) where the service delivery responsibilities
NRM in LGs, TAN Final Report 46

(service standards) are rather uniform across the country. The needs for LGA support to NRM vary enormously across the country and may not easily be captured by simple nationally available statistics (forest cover etc).
The fact NRM also should result in increased revenues for both LGAs and communities (much different from e.g. health and education) also complicates the development of a formula since own revenue potential from NRs also should be catered for when developing a formula for external support to LGA. It could be argued that LGA should co-finance any CG fiscal transfers for NRM at a much higher level than core LGDG (currently co-financed with 5%). For instance Mafia District council generate almost 4 times the average of rural per capita won revenue almost entirely from fishery related taxes and fees. If a NR grant is to finance fishery related activities it could be argued that Mafia should allocate part of its own revenue arising from the sector.
However, rather than base requirements on co financing from realized revenue generation it would be most appropriate to base it on estimates of revenue potential. This in turn will be a challenging (but not impossible) exercise.
7.2.2 INVESTMENT MENU
It has tentatively been proposed to have a fairly broad investment menu (i.e. broad list of eligible expenditures) for the NR grant (or for each of the sub-elements of the grant). For instance it is for the fishery sector proposed to include the following type of investments:
1. Establishment and facilitation of BMUs at village level
2. Awareness, information sharing, M&E, reporting
3. Technical training of district staff
4. Fisheries law enforcement
5. Increasing and improving fisheries revenue collection
6. Fisheries related capital development (for boats, equipment, computers etc)
7. Sustainable/“wise-use” fisheries investments
8. Running cost of community fisheries mgt (patrol, law enforcement, book keeping, meetings)
9. Fisheries user group NRM capital investments (boats, etc)
Similar types of expenditure are suggested for other sub-sectors (forestry, wildlife etc) see Annex 1.
The discussion of “investment menu” is interesting and challenging because it requires very explicit articulation of what role LGAs are expected to play in the various sub-sectors. This is otherwise kept rather vague in legislation and policy and often subject to significant variation across various districts because of differences in supporting projects.
Some expenditure categories may be controversial – in particular grant support for community user groups (illustrated for the fishery sector in item 7-9 above) as these are essentially supporting private sector development and either be in the form of facilitation of credit or with substantive user contributions (as under the DADG). Agreement on such funding rules may be a challenging exercise and appears at present unresolved.
NRM in LGs, TAN Final Report 47

7.2.3 SHARING WITH LOWER LEVEL LOCAL GOVERNMENTS
The LGDG is shared 50-50 between HLGs (District Councils, Municipal Councils) and LLGs (Village Governments as well as Wards and user groups). The consultant’s report on LG NR Grant proposes a similar system to be applied to the LG NR Grant. However, it may require more analysis of the assumed balance between different expenditures where e.g. item 1-6 in the list above for the fishery sector refer to HLG responsibilities and items 7-9 to “community” investments that not necessary are managed best to a formula based allocation of resources to all villages/wards in a given district.
7.2.4 PLANNING
A common set of planning guidelines will have to be issued. This will probably be based on review and harmonisation of various existing project specific guidelines. Most projects are at present targeting very specific sub-sectors and it will be a challenge to reach consensus on harmonizing the various approaches. The experience from the agriculture sector is not that encouraging: the process of formulating planning guides was very lengthy and the guidelines produced became rather bureaucratic and not user friendly. From review of the ASDP it also appears that actual planning procedures continue to vary substantially from the intended participatory and analytical processes. The ‘planning fatigue’ experienced by communities that regularly are asked to plan according to their local development priorities but see little done in the end must also be considered.
7.2.5 CAPACITY BUILDING AND TECHNICAL ASSISTANCE
Capacity building under the LGDG system is mainly provided to LGAs through a “block grant” for capacity building; the CBG. It has been proposed to use the same approach for the LG NR grant. However, it should be noted that the recent LGSP Mid Term observed significant problems with the management of the CBG and recommended much stronger PMO-RALG oversight and guidance. To provide CB through such a mechanism will require substantive work for e.g. development of detailed performance measures.
CB may also require selection of long- and/or short-term national and/or international technical assistance and other capacity building service providers who can deliver quality training and other CB to PMO-RALG itself, the LGs and relevant actors within the lower LG system. This should only take place once training needs for NR Grant management are comprehensively understood and documented and a strategy is in place that describes how CB can be steadily taken over by the LG system itself. For example, after lengthy preparatory processes, LGRP II recognised the need for substantial initial management and performance follow-up support through external technical capacity building and service providers. This was deemed necessary as a risk was identified, based on experience from phase I, that funds may otherwise simply be spent on allowances for selected staff with minimal impact on actual performance of the LGAs.
7.2.6 M&E
If the LG NR grant becomes an integral part of the LGDG system it will allow for inclusion of some sector specific performance measurements (PMs) that will be assessed as part of the annual LGDG assessments and which will provide the basis for giving LGAs incentives (or penalties) for adherence to the same PMs. For the core LGDG the system of minimum Conditions and Performance Measures has proved to be a very effective tool for ensuring LGAs adherence to good governance criteria. However, the recent LGSP Mid Term review also demonstrated that several of the PMs applied were too vague and therefore not led to meaningful measurements or incentives. It appears that most of the PMs for the agriculture sector has suffered same problems. The design of PMs has therefore to
NRM in LGs, TAN Final Report 48

be well thought and based on realistic beach marking of the existing situation in LGAs. Additional M&E problems were reported in the LGSP MTR as neither outputs nor impact at present is adequately measured by existing systems. PLANREP was intended to ensure M&E of outputs whereas the LGMD was intended to measure impact – none of these are yet operational.
7.3 CONCLUDING ASSESSMENT OF LG NR GRANT If the NR Grant is agreed upon as the future modality for channelling financial resources to local governments for NRM it will certainly resolve some – but certainly not all - of the key problems for integration of NRM into local government planning. Some key issues likely to be resolved through such a grant modality include:
The current problems with lack of transparency and inequalities in distribution of (donor funded) funds for NRM in LGAs will be overcome if they in future are to be distributed through a LG NR Grant,
The corresponding use of a common system will decrease transaction costs related to planning and reporting,
Over time it would also allow for more significant community involvement in LGAs NRM activities as funds for NRM activities will be more clearly reflected in overall LGA budgets rather than managed through project specific procedures where rules of the game are unknown to communities,
If option 2 is supported it will also enable a much more integrated approach to planning and delivery of LG services in support for NRM rather than the current compartmentalized approach,
If performance measures are smartly designed – it will be possible to provide incentives to those LGA that follow “good practices” for NRM. Simultaneously a system will be in pace that can monitor sector progress nationally across LGAs.
However, as noted above, it will be a challenge to design the LG NR grant in an appropriate manner. Substantive analytical and design work will be required. In addition it is obvious that even a well-designed LG NR Grant will not resolve all the problems in relation to proper management of NRM in LGAs.
As stated earlier, sustainable NR management must in most cases be understood in a typical local context, not least if considering indigenous knowledge, gender, religious or cultural concerns that often impact considerably on NR management practises, are to be taken seriously. ‘One shoe fits all’ approaches are likely to fail if they are designed in a too rigid manner that does not allow local users (i.e the countries’ most diverse 120 plus LGs) to adapt them to their needs. We should remember that harmonisation is a means to an end and not an end in itself. Ultimately, like in the case of the ASDP or the LGRP, the success of these undertakings will be measured by their ability to deliver better public services to the population at large.
Therefore a significant number of basic policy and institutional issues requires attention before NRM can be ‘fully integrated into LGAs’. This includes in particular issues identified in our report regarding collection and sharing of revenues from natural resources, relations between sub-sector specific institutions such as the WMA, BMUs etc and LG institutions, the interrelation with other reforms impacting on the LGs staffing situation and the mechanisms for building the specific capacity required within LGs to competently handle NR earmarked funding.
NRM in LGs, TAN Final Report 49

8. REFERENCES Adams, J.S. and McShane, T.O. (1996). The Myth of Wild Africa: Conservation without Illusion, W.W.
Norton & Company, New York:, p 282 + xix
Agrawal, A. and J.C. Ribot (1999). Accountability in Decentralization: A Framework with South Asian and African cases. Journal of Developing Areas 33, summer: 473 – 502.
British High Commission, Dar es Salaam (2007). Bigwigs grab hunting blocks, Kiswahili Press Summary, December 3, 2007.
Brooks, T.M., Mittemeier, R.A., Mittemeier, C.G., da Fonseca, G.A.B. et. al. (2002). Habitat loss and extinction in the hotspots of biodiversity. Conservation biology 16(4): 909 – 923.
Campbell, K. and Hofer, H. (1995). People and wildlife: Spatial dynamics and zones of interaction. In: Sinclair A, Arcese P (eds) Serengeti II: Dynamics, Management and Conservation of an Ecosystem. The University of Chicago Press, Chicago, pp 534-570
Collier, P. (2007). The Bottom Billion. Why the Poorest countries Are Failing and What can Be Done About It? Oxford. Oxford University Press.
Cumming, David H.M. (1999). Study on the Development of Transboundary Natural Resources Management Areas in Southern Africa - Environmental Context: Natural Resources, Land Use, and Conservation. Biodiversity Support Programme, Washington DC, USA.
Development Partner Group, Dar es Salaam (2005). Fisheries in Tanzania, Discussion Paper.
Dublin, H. T., and I. Douglas-Hamilton. (1987). Status and trends of elephants in the Serengeti-Mara ecosystem. African Journal of Ecology 25:19-33.
FBD (2008). Tanzania Forest sector outlook study (2008 – 2018). Final Report. The Forest Policy Implementation Support (FOPIS) of the Forest and Beekeeping Division (FBD). Ministry of Natural Resources and Tourism, Dar es Salaam.
Jansen, Eirik G: Does Aid Work? – Reflections on a natural resources programme in Tanzania. U4 Anti-Corruption Resource Centre (www.u4.no )
Kajembe, G.C. and M.C.S. Lalika (2008). Midterm Evaluation of the Ugalla Community Landscape Conservation Project (UCLCP). Report submitted to Africare – Tanzania Country Office, Dar es Salaam.
Kajembe, G.C.; D.M. Gamassa and B.K. Kaale (2003). Participatory Evaluation Report for the Ugalla Community Conservation Project, Tabora, Tanzania. Report Submitted to Africare – Tanzania Country Office, Dar es Salaam.
Kapinga, D.S. (2008). Rural Development Issues. Reading Material for DS 612. Development Studies Institute, Sokoine University of Agriculture, Morogoro, Tanzania.
Kideghesho, J.R., Røskaft, E., Kaltenborn, B.P. and Mokiti, T.M.C. (2005) Serengeti shall not die’: Can the ambition be sustained? International Journal of Biodiversity Science and Management 3(1):150 -166
Milledge, S.A.H. Gelvas, K.I. and Ahrends, A. (2007). Forestry Governance and National Development: Lessons Learned from Logging Boom in Southern Tanzania. A study Authorized by the Ministry of Natural Resources and Tourism, supported by the Tanzania Development Partners Group and conducted by TRAFFIC East/Southern Africa.
Miller, R.I. and Harris, L.D., (1977). Isolation and extirpation in wildlife reserves. Biological Conservation, 2:311-315.
NRM in LGs, TAN Final Report 50

Newmark, W.D. (1996). Insularisation of Tanzania parks and the local extinction of large mammals. Conservation Biology, 10:1549-1556.
Orgut Consulting AB (2008). Africa Local Council oversight and social Accountability Project (ALCOSA). Country Report on Accountability in Local Councils (Draft Report).
Ribot, J.C. (2002). Rebellion, Representation, and Enfranchisement in the Forest Villages of Makoulibantang, Eastern Senegal. In: People, Plants, and Justice: The Politics of Nature Conservation. Edited by Zerner, C. New York: Columbia University Press.
Ribot, J.C. (2004). Waiting for Democracy: The Politics of Choice in Natural Resource Decentralization. World Resources Institute, Washington, DC.
Ruitenbeck, J.; Hewawasam, I.; Ngoile, M. (eds). (2005). Blueprint 2050, sustaining the Marine Environment in Mainland Tanzania and Zanzibar. The World Bank.
URT (1998) National Forest Policy.
URT (2005). National Strategy for Growth and Reduction of Poverty (NSGRP). Vice President’s Office, Dar es Salaam.
URT (2007). The opportunities and Obstacles to Development: A Community Participatory Planning Methodology. Prime Minister’s Office, Dodoma Tanzania
Wild, R.; Kajembe, G.C. and Lalika, M. (2009). Mid-Term Review Report for Eastern Selous Community Wildlife and Natural Resources Management Project. Submitted to Belgium Technical Cooperation (BTC).
World Bank (2005). Study on Growth and Environment Links for the Preparation of Country Economic Memorandum (CEM). Part 2: Uncaptured Growth Potential Forestry, Wildlife and Marine Fisheries. Final Report, World Bank.
World Bank (2007). Harnessing Natural Resources for Sustainable Growth: The contribution of National Resources to Growth. In: Sustaining and Sharing Economy Growth, Vol. II p 211 – 224.`1
WRI (World Resources Institute). (1995). World Resources Report 1994-95. A Guide to The Global Environment: People and the Environment. World Bank, Washington DC.
WRT (World Resource Institute) (2001). Facts and Figures: Environment Data Biodiversity and Protected Arcas. World Bank, Washington, DC.
Zahabu, E. and Jambia, G. (2007). Community-Based Forest Management and Carbon Payments: Real Possibilities for Poverty Reduction. The Arc Journal (21): 25 – 27.
NRM in LGs, TAN Final Report 51

9. ANNEX
ANNEX 1: PROPOSED NRM GRANT STRUCTURE (OPTION 1)
THIS OPTION SUGGESTS INTERNAL RING-FENCING OF SPECIFIC NR SUBSECTORS
Grant type Illustrative investments Minimum conditions Allocation criteria
2.1 Forestry & Bee-keeping
Establishment and facilitation of PFM (CBFM and JFM) at village levelAwareness, information sharing, M&E, reportingTechnical training of district staffForestry law enforcement Increasing Forestry / beekeeping revenue collectionForestry related capital development (for vehicles, equipment, computers etc)Sustainable/”wise-use” forestry and beekeeping investments at local levelRunning cost of PFM (patrol, law enforcement, book keeping, meetings)User group NRM capital investments (bicycles, beehives etc.)
Qualified for CDGDEAP prepared and integrated into DDPDFO/DBO in place with minimum qualificationsMinimum % of district covered in forestMinimum % of forest revenues being reinvested into forestry
Land Area +Population +Poverty: (50%)Forest Cover: (50%)
2.2 Wildlife
Establishment and facilitation of WMAs at village levelAwareness, information sharing, M&E, reportingTechnical training of district staffWildlife law enforcement Increasing collection from wildlife revenueWildlife related capital development (for vehicles, equipment, computers etc)Sustainable/“wise-use” – wildlife investmentsRunning cost of community WMA (patrol, law enforcement, book keeping, meetings)- Wildlife user group (Authorised Association) capital investments
Qualified for CDGDEAP prepared and integrated into DDPDGO in place with suitable qualificationsSuitable wildlife indicator – (to be developed)Minimum % of district wildlife revenues being reinvested into wildlife management
Land Area +Population +Poverty: (50%)Suitable wildlife indicator (to be determined): (50%)
2.3 Fisheries
Establishment and facilitation of BMUs at village levelAwareness, information sharing, M&E, reportingTechnical training of district staffFisheries law enforcement Increasing and improving fisheries
Qualified for CDGDEAP prepared and integrated into DDPDistrict Fisheries Officer in place with suitable qualificationsSuitable fisheries
Land area, population, poverty (50%)Area of open water/wetlands or length of coastline (50%)
NRM in LGs, TAN Final Report 52

revenue collectionFisheries related capital development (for boats, equipment, computers etc)Sustainable/“wise-use” fisheries investmentsRunning cost of community fisheries mgt (patrol, law enforcement, book keeping, meetings)- Fisheries user group NRM capital investments (boats, etc)
indicator (eg minimum fish catch/head?)Minimum % of fisheries revenues being invested back into fisheries
2.4 Wetlands
Establishment and facilitation of Sustainable Wetlands Management at village levelAwareness, information sharing, M&E, reportingTechnical training of district staffLaw enforcement Increasing and improving collection of wetlands revenueCapital development (for boats, equipment, computers etc)Sustainable/ “wise-use” wetlands investmentsRunning cost of community wetlands mgt (patrol, law enforcement, book keeping, meetings)- User group NRM capital investments (boats, beehives, fish farming)
Qualified for CDGDEAP prepared and integrated into DDPDistrict Officer designated with wetlands responsibility in place with suitable qualificationsWetlands indicator: (eg: Minimum % of district area covered in wetlandsMinimum % of wetlands revenues being invested back into wetlands
Land area, population, poverty (50%)Area of open water/wetlands or length of coastline (50%)
NRM in LGs, TAN Final Report 53
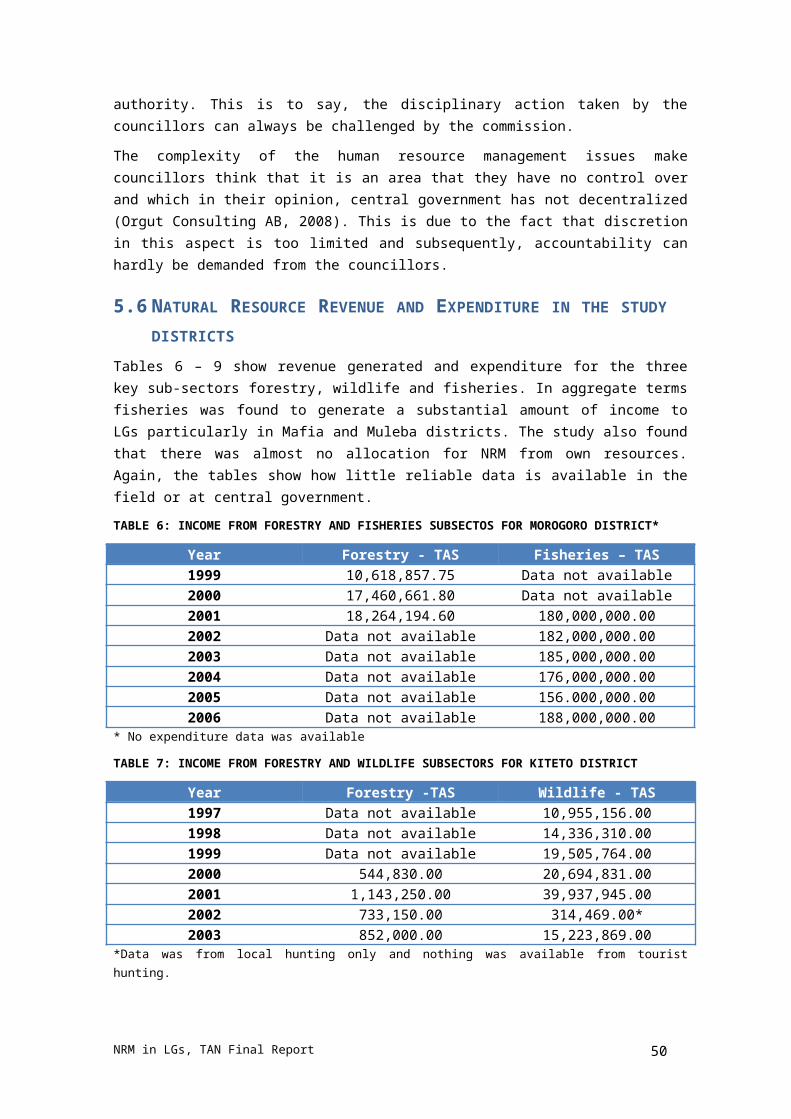
ANNEX 2: NRM INVESTMENT GRANT STRUCTURE - OPTION 2
Grant type Illustrative investments Minimum conditions Allocation criteria
2. NRM Investment Grant
Establishment of Community Based Natural Resource Management (CBNRM) at village levelAwareness, information sharing, M&E, reporting.Technical training and CBNRM extension servicesNR law enforcement Sustainable/ “wise-use” NR investmentsIncreasing NRM revenue collection- NR related capital development (for vehicles, equipment, etc for extension and enforcement
Qualified for CDGDEAP prepared and integrated into DDPDistrict NR Officer in place plus relevant sectoral staffMinimum % of NR revenues being invested back into NRM
Land area, population, poverty (50%)
Forest cover (reserved and unreserved) + Area of open water/wetlands or length of coastline + Wildlife indicator (50%)
NRM in LGs, TAN Final Report 54
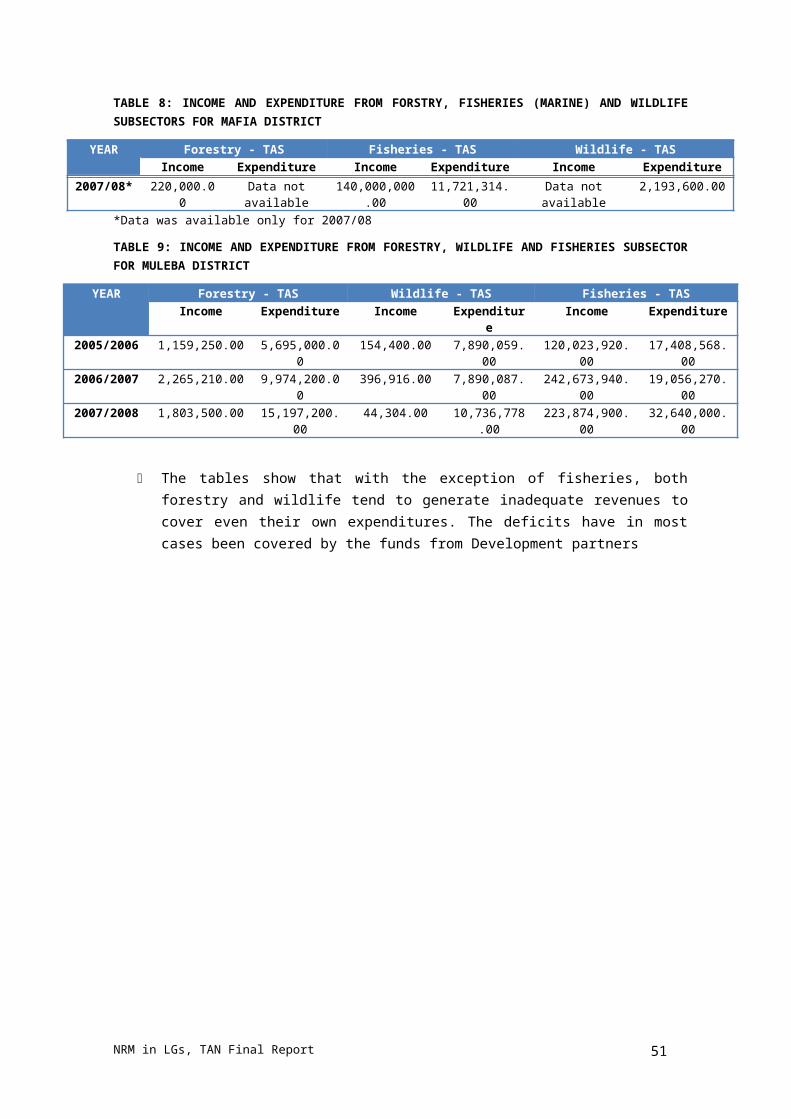
ANNEX 3: BASIC LGA FINANCE AND HR DATA TABLE 11: LOCAL GOVERNMENT FINANCIAL RESOURCES FY 2001/02 - 2005/0512
2001/02 2002/03 2003/04 2004/05 2005/06TShs. Million
Local Grants (incl. GPG) 201,119.0 247,027.3 313,872.7 386,767.8 452,831.2Own Source Revenues 51,200.2 57,740.2 48,343.6 42,871.4 49,291.0Local Borrowing 50.0 225.0 442.5 250.5 1,495.9
Total252,369.
2304,992.
5362,658.
8429,889.
7503,618.
1Percent of local government resources
Local Grants (incl. GPG) 79.7 81.0 86.5 90.0 89.9Own Source Revenues 20.3 18.9 13.3 10.0 9.8Local Borrowing 0.0 0.1 0.1 0.1 0.3Total 100.0 100.0 100.0 100.0 100.0
Notes: Data reflects actual amounts as reported by LGAs. Until 2003/04, own source revenues and borrowing data are based on calendar years. Until 2004/05, borrowing is as reported by LGLB and Local Grants are based on budget amounts reported by Ministry of Finance. Totals may not add up due to rounding.Source: Local Government Fiscal Review 2006 which has computed data from PMO-RALG; Ministry of Finance; and Local Government Loans Board.
The financial resources at LGA level have doubled over the last five years, but this occurred in a period of significant expansion of public expenditures in Tanzania generally and LGA share of total public expenditure has remained relatively unchanged at around 20% in the period.
TABLE 12: EXPENDITURE DECENTRALISATION IN TANZANIA
Central Local Total Central Local TotalTshs. billion Percent of total
2001/02 998.5 252.4 1,250.9 79.8% 20.2% 100.0%2002/03 1,212.4 305.0 1,517.4 79.9% 20.1% 100.0%2003/04 1,479.8 362.7 1,842.5 80.3% 19.7% 100.0%2004/05 1,835.7 429.9 2,265.6 81.0% 19.0% 100.0%2005/06 2,223.7 534.4 2,758.2 80.6% 19.4% 100.0%Source: LG Fiscal Review 2006
12 Note that data from LG Fiscal Reviews generally exclude development funding unless explicitly mentioned.
NRM in LGs, TAN Final Report 55

TABLE 13: PUBLIC SECTOR AND LG EMPLOYMENT 1995-2006
1995 1996 1997 1999 2000 2002 2003 2004 2005 2006Central 108,363 101,074 97,146 92,393 92,951 90,928 92,436 90,708 91,950 97,775
Regional 24,119 22,667 19,192 16,637 10,172 10,088 10,302 10,064 9,835 9,481
Local G 163,255 163,297 156,842 155,397 169,285 177,812 189,979 187,149 204,606 219,573
Total 295,737287,03
8273,18
0264,42
7272,40
8278,82
8292,71
7287,92
1306,39
1326,82
9
LG share 55% 57% 57% 59% 62% 64% 65% 65% 66% 67%
Local teachers 110,116 116,713 116,801 126,744 144,286 154,186
Teachers share of all LG Employees 65% 66% 61% 67% 70% 70%
non-teacher LG 59,169 61,099 73,178 60,405 60,320 65,387
Non teacher growth rate 4.2% 19.8% -17.5% -0.1% 8.4%
TABLE 14: MAIN DEVELOPMENT GRANTS AVAILABLE TO LGAS AND ASSOCIATED GUIDELINES/CONDITIONS
S/N Grant Guidelines/Conditions
1 Capital Development Grant (CDG)
To construct new infrastructure or to rehabilitate existing ones according to locally defined priorities against a broad investments menu
2 Capital Building Grant (CBG)
This is a capacity building grant to assist LGAs to improve their capacity and performance to enable them meet the CDG minimum access conditions to access additional funds through performance measurement process. 40% or 50% of CBG funds are required to be used at sub-district level i.e. ward, village and sub-village. There are also additional conditions provided in Local Government Capital Development Grant (LGCDG) system implementation and operational manual that indicate how these funds are to be used
3 District Agricultural Development Grant (DADG)
The agricultural grant is meant to fund local public agricultural investments and is seen as an earmarked top-up to CDG to be allocated to LGAs that meet the DADG minimum conditions. Investments to be funded have to be identified through participatory planning process inline with the LGCDG system
4 Agriculture - Capacity Building Grant (A-CBG)
This is a capacity building grant that all districts receive irrespective of whether they meet the minimum conditions to access DADG top up. The fund is to be used to improve functional areas to meet the minimum conditions and the performance criteria in subsequent years.
5 Rural Water Supply and Sanitation Programme (RWSSP)
This is the LGCDG water sector window consisting of a capital development grant (RWSSP – CDG) and a capacity building grant (RWSSP-CBG). The RWSSP – CDG can be used for implementation of infrastructure such as drilling of boreholes, construction of dams and piped systems, installation of pumps and construction of demo latrines
6 Primary Education Development Grant (PEDG)
This is a grant received by all LGAs and is meant to fund education – specific development investments
7 Other Grants LGAs also receive other development grants limited to regions (area-based
NRM in LGs, TAN Final Report 56

programmes), sectors and purposes. These include Participatory Agriculture Development and Empowerment Project (PADEP); District Agriculture Sector Investments Project (DASIP): Urban Development and Environment Management (UDEM); Participatory Forest Management/Sustainable Wetlands Management (PFM/SWM); Local Government/Village Transportation Grants (LGTP/VTTP); Council Premise Development Grant and UNICEF support for social planning and budgeting. Each of these development grants are earmarked for specific purposes and allocated based on earmarked, purpose – specific criteria. LGAs receiving these grants are required to consult specific requirements and regulations and discuss with PMO-RALG and other sector Ministries for guidance as required and appropriate.
Source: LGAs Planning and Budget Guidelines for the FY 2008/09 – 2010/11
NRM in LGs, TAN Final Report 57

ANNEX 4: PEOPLE MET
LIST OF PEOPLE MET – MULEBA DISTRICT
S/N Name Title1 Lubanzibwa P.R.M District Administrative Secretary2 Mohamed kisiri Ag. DED3 F. Materu District planning officer4 John Nnko DNRLEO5 Tinzara Ag .DT6 Lusa Council solicitor7 Ezekiel Raphael Ag .District game officer8 Sadock Bamwongeza Ag .District fisheries officer9 Juliana Arubert District land officer10 Baraka s. Otuoma District forest officerMEMBERS OF WDC MET RUHANGA WARD -MULEBA1 Robert Thadeo Councillor-Chair2 Respicius selestine Ward Executive Committee-WEO3 Josephat Mwebesa Village chair4 Fortunatus Stima Village Executive Officer5 Pameras Mshumbus Village Executive officer6 Eryandery Patricia Ward education coordinator7 Aloysia Theonest Member of village government8 Kabyemela Katundu Elite leader9 Dedorus P.Rwekaza Village chair10 Victor Shumbusho Ngaza Agriculture/livestock officerMEMBERS OF KATEMBE BMUs/ WDC MET1 Kambona Tibasima Secretary BMU2 Goldiani A.Kamugisha VEO-Kangaza 3 Josbert K.Anatory VEO-Kaziramuyaga4 George N. Isilimura Village chair -Kangaza5 Salehe Mustapha Chair harmlet6 Chrizant Joseph Village chair -Katembe7 Herman Joseph WEO8 Chaina B. Katainawabo Chair -BMU9 Richard Buchweishaija VEO-Katembe10 Berickson Bijanda VEO-Kyota11 Alphonce K. Musomi Chair-Kyota12 Patrick Denis Member BMU13 Dues Makoro Member BMU14 Deogratias Modesta Member BMU15 Esta Wasanda Member BMU
NRM in LGs, TAN Final Report 58
LIST OF PEOPLE MET –MOROGORO DISTRICT
S/N Name Title1. Godfrey S. Ngalaya RAS-morogoro2. Mushi E. Regional secretariat natural resource advisor3. Eden A. Munisi District Executive Director-Morogoro4. Ande Mallango District lands natural resource environment officer5. Yasin M. Msangi Acting district Planning officer6. Iddi Ndabagenga District game officer7. William P.C. Chambua District fisheries officer8. Amin Mushi Principal forest assistant9. Beda karani District forest officer10. Salehe Mangawe Village executive officer-Gwatta11. Nichacholous Mao Representative Wambiki12. Jackson Mirambo Secretary environmental committee13. Aman Monyo Community representative14. Rashid Holela Chairperson JUKUMU15. Hashimu Mnemeo Ag. Secretary-JUKUMU16. Athuman masseneka Member central committee-JUKUMU17. Juma Gumi Treasurer18. Juma nyoka member19. Zamoyoni Zuberi member20. Haji Kizinga member21. Selemani Ndago member22. Salumu hamisi Mwamba Discipline master23. Said kastam Secretary of the board24. Bakari Nyalupata Secretary disciplines25. Riziki J. Kitangu Board member26. Josephine Damas member27. Nasoro Mbande member28. Yahaya Rajab Malindi Village Executive officer Muhunga Mkola29. Mohamed R.semindu Chairperson Muhunga mkola village30. 53 villagers of Muhunga
NRM in LGs, TAN Final Report 59

LIST OF PEOPLE MET-MAFIA DISTRICT
S/n Name Title1 Lewis Kalinjuna District Executive Director -Kiteto2 Paul Likonja District lands natural resources and
environment officer3 Hon. Manzie mangochie District commissioner4 Upendo Omary. District Water Engineer5 Sebastian K. Mlinda Ag. District Education Officer6 Eng. G.S.Kijara District Engineer7 Shabani Zueri DIS8 Anita Makota District Community Development Officer9 M.H.Njate Ag. DALDO10 T.M.Soko Ag. DTO11 Kunezero H. kanyangemu For WIC MIMP12 Waziri S. Mkumbwa District Forest Officer13 Paul M. Kugopya District Natural resource Officer14 Agness E. Mtani District Secondary education Coordinator14 District Planning Officer15 Hatibu Mwalimu Hatibu Chair-NRC-Ndagoni village16 Mwanamvura Ahamadi Ass. Secretary NRC-Ndagoni village17 Wema Haji Member NRC-Ndagoni18 Mohaamed Bakari Member NRC19 Juma Mwamdani juma Councillor Baleni ward20 Mzee m. kay Ward Executive officer-Baleni ward21 Issa Ibrahim Ngaya Member VG22 Mahomudo A. Juma Member VG23 Ally Athuman Pasanya Member VG24 Hamisi mwalomu Member VG25 Swalehe Juma kombo Member VG26 Mohamed Bahati Member VG27 Hamisi jimile Member VG28 Mwanaidi Habibu Yahaya Member VG29 Zafa Hassan abdalla Member VG30 Mwamboga Mfaume Secretary BMu-Ndagoni31 Mwananvura Ahamad Treasurer –Ndagoni BMU32 Hassan Ahmad Store keeper-BMU33 Makungu Tamaki Elite advisor-BMU34 Ally H. Mbaga Member-BMU35 Makame bakary Member36 Mwanema Athumani Member 37 Zakia Thomas Member 38 Hadia jimile Member 39 Tatu Kilobo Member 40 Halifa A. Jongo Member 41 Haruni Mohamedi Member 42 Mussa Makame Member 43 Juma m. Juma Member WDC
NRM in LGs, TAN Final Report 60
44 Mzee M. Kai WEO-member WDC45 Mwinchande Faki VEO-member WDC46 Mohamed J. Maneno Member WDC47 Amedeli C. Kaishiga Member WDC48 Mohamed S. Mohamed VEO-member WDC49 Issa Ibrahimu Nganu V/chair-member WDC50 Alli Mohamed makame V/chair-member WDC51 Ahmad Mgeni Member WDC52 Mohamed A. Juma Member WDC53 Hulka Hassan VEO-Dongo village54 Rehema A. Shehe Chair, VG-dogani55 Fatuma H.Chwaya Member-BMU56 Hamisi Makuya VG-member57 Umami A. Chuo VG-member58 Abdalla Abeid Chair-BMU59 Mussa I. Hamisi BMu-member60 Mwanamaraka Hassan BMU-member61 Melele G.S.A Sen.warden conser & devel.62 Munezero H.Kanyangemu Sen.warden tourism&public relations
LIST OF PEOPLE MET –KITETO DISTRICT
S/N Name Title1 Limo A.A District Executive Director -Kiteto2 Nsuli Phosphor Ag. District lands Natural resources
Environment Officer3 Shabani Luono District Forest Officer4 Minja M.S. District Forest Officer5 Cornelia Mfinanga Senior water technician6 Gerald Mariti Game Officer7 Elipokea Nko Ag. Beekeeping officer8 Magesa Rodson District Planning officer9 Karia Wallace District Treasurer10 Lutema D.M Human Resource Officer11 Lembile Ole Kone Councillor –Kijungu ward12 Samson Mbaiyo Chairperson Indeme society13 Fredy elias Laaltolia Secretary-Indeme society14 Emanuel chamba Chairperson V/G Sunya14 BAKARI hemedi Secretary suledo zone15 Ndupa Mdhengi Secretary V/G Sunya16 Mwande Vuiza member17 Hassan Jama member18 Mumo Mlei Chairperson sungusungu19 Hadija Omar member20 Athumani Magwira Member, V/G21 Salim Mzigo Secretary ward tribunal22 Puputo Omary Invitee23 Juma Kibinda Chairperson, malimbir
NRM in LGs, TAN Final Report 61

24 Neema laizar member25 Abdi Puputo Member, V/G26 Hadija Mdowe member27 Agriper Mngulwi Agricultural extension officer28 Julieth Wilson member29 Mwande V. Mwande member
NRM in LGs, TAN Final Report 62