integrative annotation of v ariants read the full ar ticle...
TRANSCRIPT
Integrative Annotation of Variants from 1092 Humans: Application to Cancer GenomicsEkta Khurana, Yao Fu, Vincenza Colonna, Xinmeng Jasmine Mu, Hyun Min Kang, Tuuli Lappalainen, Andrea Sboner, Lucas Lochovsky, Jieming Chen, Arif Harmanci, Jishnu Das, Alexej Abyzov, Suganthi Balasubramanian, Kathryn Beal, Dimple Chakravarty, Daniel Challis, Yuan Chen, Declan Clarke, Laura Clarke, Fiona Cunningham, Uday S. Evani, Paul Flicek, Robert Fragoza, Erik Garrison, Richard Gibbs, Zeynep H. Gümüş, Javier Herrero, Naoki Kitabayashi, Yong Kong, Kasper Lage, Vaja Liluashvili, Steven M. Lipkin, Daniel G. MacArthur, Gabor Marth, Donna Muzny, Tune H. Pers, Graham R. S. Ritchie, Jeffrey A. Rosenfeld, Cristina Sisu, Xiaomu Wei, Michael Wilson, Yali Xue, Fuli Yu, 1000 Genomes Project Consortium, Emmanouil T. Dermitzakis, Haiyuan Yu, Mark A. Rubin, Chris Tyler-Smith,* Mark Gerstein*
Introduction: Plummeting sequencing costs have led to a great increase in the number of personal genomes. Interpreting the large number of variants in them, particularly in noncoding regions, is a current challenge. This is especially the case for somatic variants in cancer genomes, a large propor-tion of which are noncoding.
Methods: We investigated patterns of selection in DNA elements from the ENCODE project using the full spectrum of variants from 1092 individuals in the 1000 Genomes Project (Phase 1), includ-ing single-nucleotide variants (SNVs), short insertions and deletions (indels), and structural variants (SVs). Although we analyzed broad functional annotations, such as all transcription-factor binding sites, we focused more on highly specifi c categories such as distal binding sites of factor ZNF274. The greater statistical power of the Phase 1 data set compared with earlier ones allowed us to differ-entiate the selective constraints on these categories. We also used connectivity information between elements from protein-protein-interaction and regulatory networks. We integrated all the informa-tion on selection to develop a workfl ow (FunSeq) to prioritize personal-genome variants on the basis of their deleterious impact. As a proof of principle, we experimen-tally validated and characterized a few candidate variants.
Results: We identifi ed a specifi c subgroup of noncoding categories with almost as much selective constraint as coding genes: “ultra-sensitive” regions. We also uncovered a number of clear patterns of selection. Elements more consistently active across tissues and both maternal and paternal alleles (in terms of allele-specifi c activity) are under stronger selection. Variants disruptive because of mecha-nistic effects on transcription-factor binding (i.e. “motif-breakers”) are selected against. Higher network connectivity (i.e. for hubs) is associated with higher constraint. Additionally, many hub pro-moters and regulatory elements show evidence of recent positive selection. Overall, indels and SVs follow the same pattern as SNVs; however, there are notable exceptions. For instance, enhancers are enriched for SVs formed by nonallelic homologous recombination. We integrated these patterns of selection into the FunSeq prioritiza-tion workfl ow and applied it to cancer variants, because they present a strong contrast to inherited polymorphisms. In particular, applica-tion to ~90 cancer genomes (breast, prostate and medulloblastoma) reveals nearly a hundred candidate noncoding drivers.
Discussion: Our approach can be readily used to prioritize vari-ants in cancer and is immediately applicable in a precision-medi-cine context. It can be further improved by incorporation of larger-scale population sequencing, better annotations, and expression data from large cohorts.
FIGURES IN THE FULL ARTICLE
Fig. 1. Fraction of rare (DAF < 0.5%) SNPs.
Fig. 2. Fraction of rare SNPs in noncoding categories.
Fig. 3. SNPs in protein-protein interaction (PPI) network.
Fig. 4. Functional annotations of indels and SVs.
Fig. 5. Functional implications of positive selection.
Fig. 6. Functional interpretation of disease variants.
SUPPLEMENTARY MATERIALS
Materials and MethodsSupplementary TextFig. S1 to S29Tables S1 to S12References (49–90)Data S1 to S7
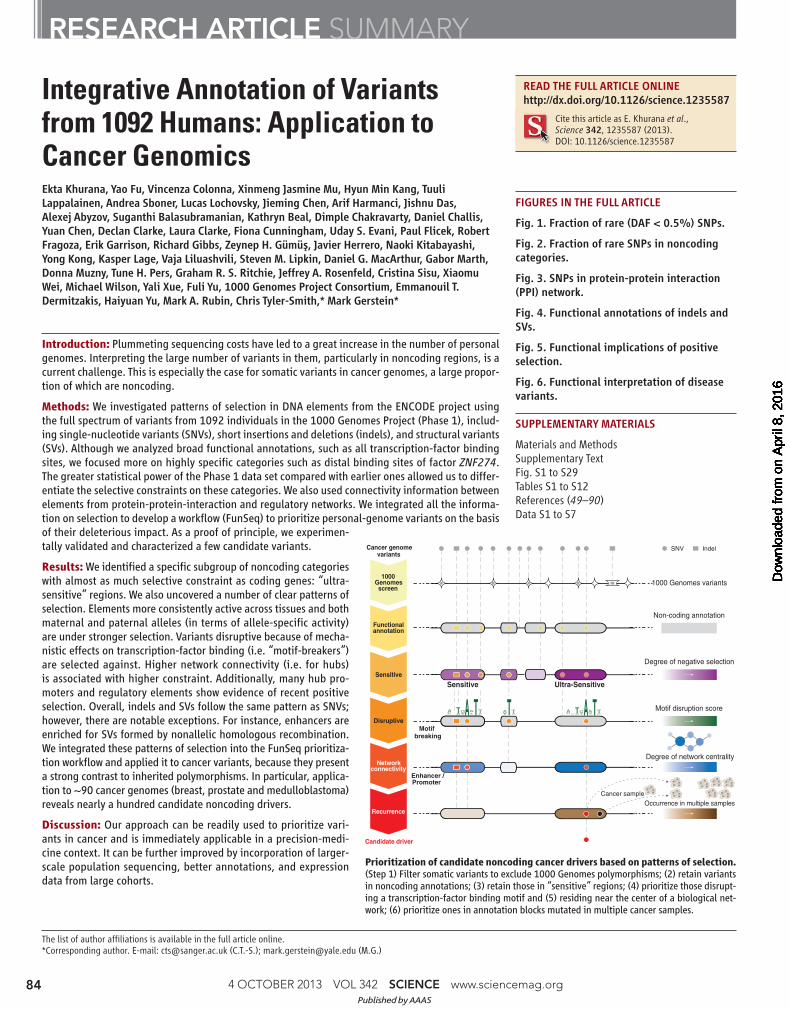
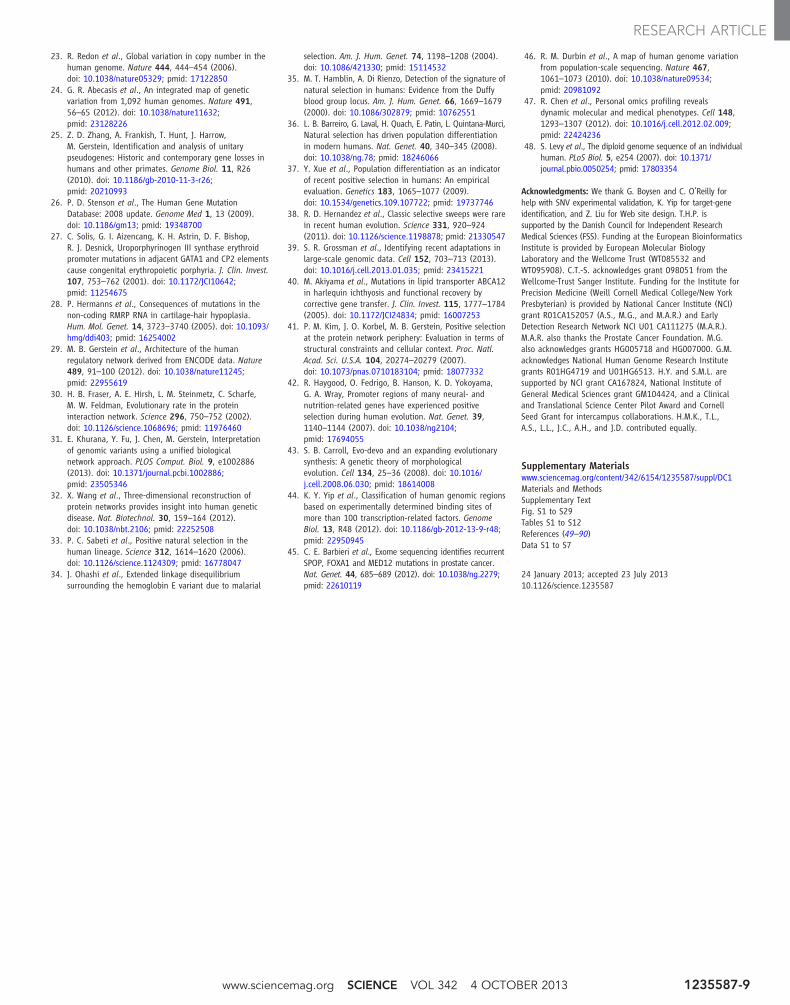
Prioritization of candidate noncoding cancer drivers based on patterns of selection. (Step 1) Filter somatic variants to exclude 1000 Genomes polymorphisms; (2) retain variants in noncoding annotations; (3) retain those in “sensitive” regions; (4) prioritize those disrupt-ing a transcription-factor binding motif and (5) residing near the center of a biological net-work; (6) prioritize ones in annotation blocks mutated in multiple cancer samples.
READ THE FULL ARTICLE ONLINEhttp://dx.doi.org/10.1126/science.1235587
Cite this article as E. Khurana et al., Science 342, 1235587 (2013). DOI: 10.1126/science.1235587
The list of author affi liations is available in the full article online.*Corresponding author. E-mail: [email protected] (C.T.-S.); [email protected] (M.G.)
A T A
Recurrence
1000 Genomesscreen
Cancer genome variants
Sensitive
Disruptive
Networkconnectivity
Functionalannotation
GCA
T
G
AC
GAT
ATGATTC
A
Ultra-Sensitive
1000 Genomes variants
Motif breaking
Non-coding annotation
GCA
TGAC
GAT
ATG
GTATC
AT
Sensitive
Enhancer /
Degree of negative selection
Occurrence in multiple samples
Degree of network centrality
Motif disruption score
Candidate driver
G
A TTTC
AG
Promoter
Cancer sample
IndelSNV
4 OCTOBER 2013 VOL 342 SCIENCE www.sciencemag.org 84
RESEARCH ARTICLE SUMMARY
Published by AAAS
on A
pril
8, 2
016
Dow
nloa
ded
from
on
Apr
il 8,
201
6D
ownl
oade
d fr
om o
n A
pril
8, 2
016
Dow
nloa
ded
from
on
Apr
il 8,
201
6D
ownl
oade
d fr
om o
n A
pril
8, 2
016
Dow
nloa
ded
from
on
Apr
il 8,
201
6D
ownl
oade
d fr
om o
n A
pril
8, 2
016
Dow
nloa
ded
from
on
Apr
il 8,
201
6D
ownl
oade
d fr
om o
n A
pril
8, 2
016
Dow
nloa
ded
from
on
Apr
il 8,
201
6D
ownl
oade
d fr
om
Integrative Annotation of Variantsfrom 1092 Humans: Applicationto Cancer GenomicsEkta Khurana,1,2* Yao Fu,1* Vincenza Colonna,3,4* Xinmeng Jasmine Mu,1* Hyun Min Kang,5
Tuuli Lappalainen,6,7,8 Andrea Sboner,9,10 Lucas Lochovsky,1 Jieming Chen,1,11 Arif Harmanci,1,2
Jishnu Das,12,13 Alexej Abyzov,1,2 Suganthi Balasubramanian,1,2 Kathryn Beal,14
Dimple Chakravarty,9 Daniel Challis,15 Yuan Chen,3 Declan Clarke,16 Laura Clarke,14
Fiona Cunningham,14 Uday S. Evani,15 Paul Flicek,14 Robert Fragoza,13,17 Erik Garrison,18
Richard Gibbs,15 Zeynep H. Gümüş,10,19 Javier Herrero,14 Naoki Kitabayashi,9 Yong Kong,2,20
Kasper Lage,21,22,23,24,25 Vaja Liluashvili,10,19 Steven M. Lipkin,26 Daniel G. MacArthur,22,27
Gabor Marth,18 Donna Muzny,15 Tune H. Pers,24,28,29 Graham R. S. Ritchie,14
Jeffrey A. Rosenfeld,30,31,32 Cristina Sisu,1,2 Xiaomu Wei,13,26 Michael Wilson,1,33 Yali Xue,3
Fuli Yu,15 1000 Genomes Project Consortium,† Emmanouil T. Dermitzakis,6,7,8 Haiyuan Yu,12,13
Mark A. Rubin,9 Chris Tyler-Smith,3‡ Mark Gerstein1,2,34‡
Interpreting variants, especially noncoding ones, in the increasing number of personal genomesis challenging. We used patterns of polymorphisms in functionally annotated regions in 1092humans to identify deleterious variants; then we experimentally validated candidates. We analyzedboth coding and noncoding regions, with the former corroborating the latter. We found regionsparticularly sensitive to mutations (“ultrasensitive”) and variants that are disruptive because ofmechanistic effects on transcription-factor binding (that is, “motif-breakers”). We also foundvariants in regions with higher network centrality tend to be deleterious. Insertions and deletionsfollowed a similar pattern to single-nucleotide variants, with some notable exceptions (e.g., certaindeletions and enhancers). On the basis of these patterns, we developed a computational tool (FunSeq),whose application to ~90 cancer genomes reveals nearly a hundred candidate noncoding drivers.
Whole-genome sequencing has revealedmillions of variants per individual. How-ever, the functional implications of the
vast majority of these variants remain poorlyunderstood (1). It is well established that var-iants in protein-coding genes play a crucial rolein human disease. Although it is known that non-coding regions are under negative selection andthat variants in them have been linked to disease,their role is generally less well understood (2–9).
In particular, whereas some studies have dem-onstrated a link between common variants fromgenome-wide association studies (GWASs) andregulatory regions (2, 3), the deleterious effectsof rare inherited variants and somatic cancer mu-tations in noncoding regions have not been ex-plored in a genome-wide fashion. Recently, threestudies reported noncoding driver mutations inthe TERT promoter in multiple tumor types, in-cluding melanomas and gliomas (10–12). In lightof these studies and the growing availability ofwhole-genome cancer sequencing (13–20), an in-tegrated framework facilitating functional inter-pretation of noncoding variants would be useful.
One may think to identify noncoding regionsunder strong selection purely through mamma-lian sequence conservation, and ultraconservedelements have been found in this fashion (21).However, signatures of purifying selection iden-tified by using population-variation data couldprovide better insights into the importance of a
genomic region in humans than evolutionary con-servation. This is because many regions of thegenome show human-specific purifying selection,whereas other regions conserved across mam-mals show a lack of functional activity and selec-tion in humans (7). Thus, identifying the specificelements under particularly strong purifying se-lection among humans could provide novel insights.
Besides single-nucleotide polymorphisms(SNPs), the human genome also contains othervariants, including small insertions and deletions(indels) and larger structural variants (SVs) (22).They account for more nucleotide differencesamong humans than SNPs; hence, an under-standing of their relationship with functional el-ements is crucial (23).
We used the full range of sequence polymor-phisms (ranging from SNPs to SVs) from 1092humans to study patterns of selection in variousfunctional categories, especially noncoding reg-ulatory regions (24). We identified specific ge-nomic regions where variants are more likely tohave strong phenotypic impact. The list of theseregions includes groups of coding genes and spe-cific sites within them and, importantly, particularnoncoding elements. By further comparing pat-terns of polymorphisms with somatic mutations,we show how this list can aid in the identificationof cancer drivers. We used multiple experimentalmethods for validation, including yeast two-hybridexperiments, Sanger sequencing of independent
cancer samples, and relevant gene-expression mea-surements. Furthermore, we provide a softwaretool that allows researchers to prioritize non-coding variants in disease studies.
Genomic Elements Under Strong PurifyingSelection: Ultrasensitive RegionsEnrichment of rare variants can be used to esti-mate the strength of purifying selection in differ-ent functional categories (24). As expected, wefound that having variants from 1092 individualsallowed us to detect specific functional catego-ries under strong purifying selection with greater
RESEARCHARTICLE
1Program in Computational Biology and Bioinformatics, YaleUniversity, New Haven, CT 06520, USA. 2Department of Mo-lecular Biophysics and Biochemistry, Yale University, NewHaven, CT 06520, USA. 3Wellcome Trust Sanger Institute,Wellcome Trust Genome Campus, Cambridge, CB10 1SA, UK.4Institute of Genetics and Biophysics, National Research Coun-cil (CNR), 80131 Naples, Italy. 5Center for Statistical Genet-ics, Biostatistics, University of Michigan, Ann Arbor, MI 48109,USA. 6Department of Genetic Medicine and Development, Uni-versity of Geneva Medical School, 1211 Geneva, Switzerland.7Institute for Genetics and Genomics in Geneva (iGE3), Univer-sity of Geneva, 1211 Geneva, Switzerland. 8Swiss Institute ofBioinformatics, 1211 Geneva, Switzerland. 9Institute for Pre-cision Medicine and the Department of Pathology and LaboratoryMedicine, Weill Cornell Medical College and New York–Presbyterian Hospital, New York, NY 10065, USA. 10The HRHPrince Alwaleed Bin Talal Bin Abdulaziz Alsaud Institute forComputational Biomedicine, Weill Cornell Medical College,New York, NY 10021, USA. 11Integrated Graduate Program inPhysical and Engineering Biology, Yale University, New Haven,CT 06520, USA. 12Department of Biological Statistics and Com-putational Biology, Cornell University, Ithaca, NY 14853, USA.13Weill Institute for Cell and Molecular Biology, Cornell Univer-sity, Ithaca, NY 14853, USA. 14European Molecular Biology Lab-oratory, European Bioinformatics Institute, Wellcome Trust GenomeCampus, Hinxton, Cambridge CB10 1SD, UK. 15Baylor Collegeof Medicine, Human Genome Sequencing Center, Houston, TX77030, USA. 16Department of Chemistry, Yale University, NewHaven, CT 06520, USA. 17Department of Molecular Biology andGenetics, Cornell University, Ithaca, NY 14853, USA. 18Depart-ment of Biology, Boston College, Chestnut Hill, MA 02467, USA.19Department of Physiology and Biophysics, Weill Cornell Med-ical College, New York, NY, 10065, USA. 20Keck BiotechnologyResource Laboratory, Yale University, New Haven, CT 06511, USA.21Pediatric Surgical Research Laboratories, MassGeneral Hospitalfor Children, Massachusetts General Hospital, Boston, MA 02114,USA. 22Analytical and Translational Genetics Unit, MassachusettsGeneral Hospital, Boston, MA 02114, USA. 23Harvard MedicalSchool, Boston, MA 02115, USA. 24Center for Biological SequenceAnalysis, Department of Systems Biology, Technical University ofDenmark, Lyngby, Denmark. 25Center for Protein Research, Uni-versity of Copenhagen, Copenhagen, Denmark. 26Department ofMedicine, Weill Cornell Medical College, New York, NY 10065,USA. 27Program in Medical and Population Genetics, Broad In-stitute of Harvard and Massachusetts Institute of Technology(MIT), Cambridge, MA 02142, USA. 28Division of Endocrinologyand Center for Basic and Translational Obesity Research, Children’sHospital, Boston, MA 02115, USA. 29Broad Institute of MIT andHarvard, Cambridge, MA 02142, USA. 30Department of Medi-cine, Rutgers New Jersey Medical School, Newark, NJ 07101,USA. 31IST/High Performance and Research Computing, RutgersUniversity Newark, NJ 07101, USA. 32Sackler Institute for Com-parative Genomics, American Museum of Natural History,New York, NY 10024, USA. 33Child Study Center, Yale University,New Haven, CT 06520, USA. 34Department of Computer Science,Yale University, New Haven, CT 06520, USA.
*These authors contributed equally to this work.†A full list of participants and institutions is available in thesupplementary materials.‡Corresponding author. E-mail: [email protected] (C.T.-S.);[email protected] (M.G.)
www.sciencemag.org SCIENCE VOL 342 4 OCTOBER 2013 1235587-1
power than previously possible (2, 7, 9). In par-ticular, the increased number of samples provideda better estimate of allele frequencies, making pos-sible the measurement of differential selectiveconstraints between specific categories [e.g., be-tween motifs of transcription-factor (TF) fami-lies HMG and MADs box] (figs. S4 and S5).
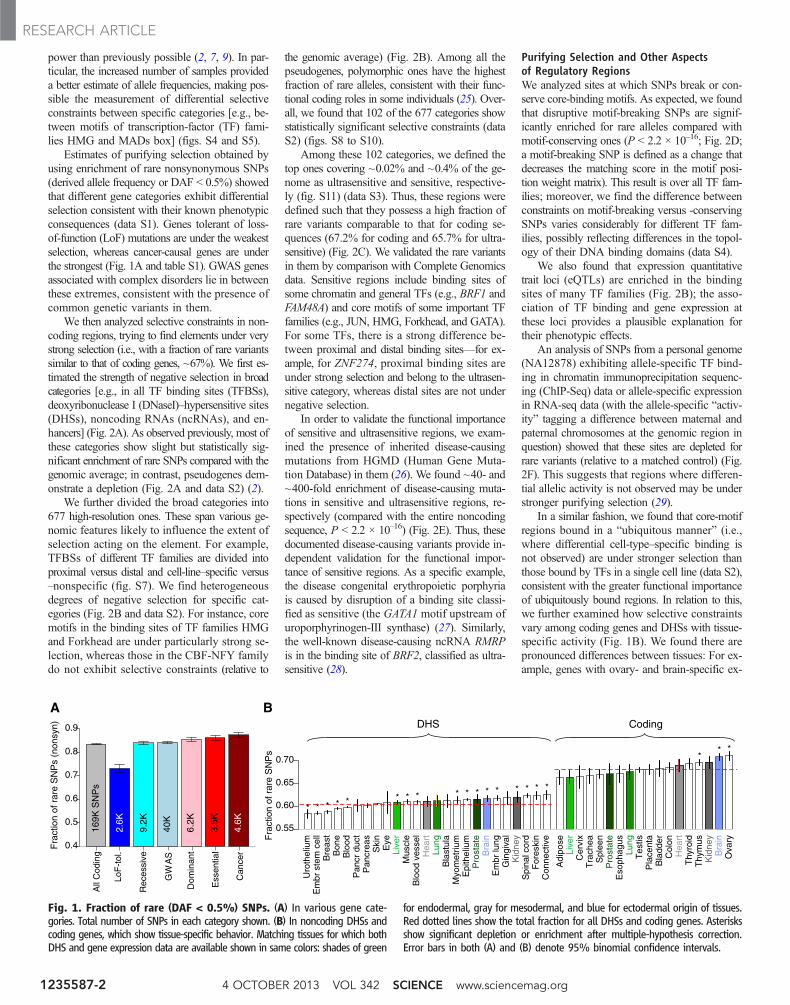
Estimates of purifying selection obtained byusing enrichment of rare nonsynonymous SNPs(derived allele frequency or DAF < 0.5%) showedthat different gene categories exhibit differentialselection consistent with their known phenotypicconsequences (data S1). Genes tolerant of loss-of-function (LoF) mutations are under the weakestselection, whereas cancer-causal genes are underthe strongest (Fig. 1A and table S1). GWAS genesassociated with complex disorders lie in betweenthese extremes, consistent with the presence ofcommon genetic variants in them.
We then analyzed selective constraints in non-coding regions, trying to find elements under verystrong selection (i.e., with a fraction of rare variantssimilar to that of coding genes, ~67%). We first es-timated the strength of negative selection in broadcategories [e.g., in all TF binding sites (TFBSs),deoxyribonuclease I (DNaseI)–hypersensitive sites(DHSs), noncoding RNAs (ncRNAs), and en-hancers] (Fig. 2A). As observed previously, most ofthese categories show slight but statistically sig-nificant enrichment of rare SNPs compared with thegenomic average; in contrast, pseudogenes dem-onstrate a depletion (Fig. 2A and data S2) (2).
We further divided the broad categories into677 high-resolution ones. These span various ge-nomic features likely to influence the extent ofselection acting on the element. For example,TFBSs of different TF families are divided intoproximal versus distal and cell-line–specific versus–nonspecific (fig. S7). We find heterogeneousdegrees of negative selection for specific cat-egories (Fig. 2B and data S2). For instance, coremotifs in the binding sites of TF families HMGand Forkhead are under particularly strong se-lection, whereas those in the CBF-NFY familydo not exhibit selective constraints (relative to
the genomic average) (Fig. 2B). Among all thepseudogenes, polymorphic ones have the highestfraction of rare alleles, consistent with their func-tional coding roles in some individuals (25). Over-all, we found that 102 of the 677 categories showstatistically significant selective constraints (dataS2) (figs. S8 to S10).
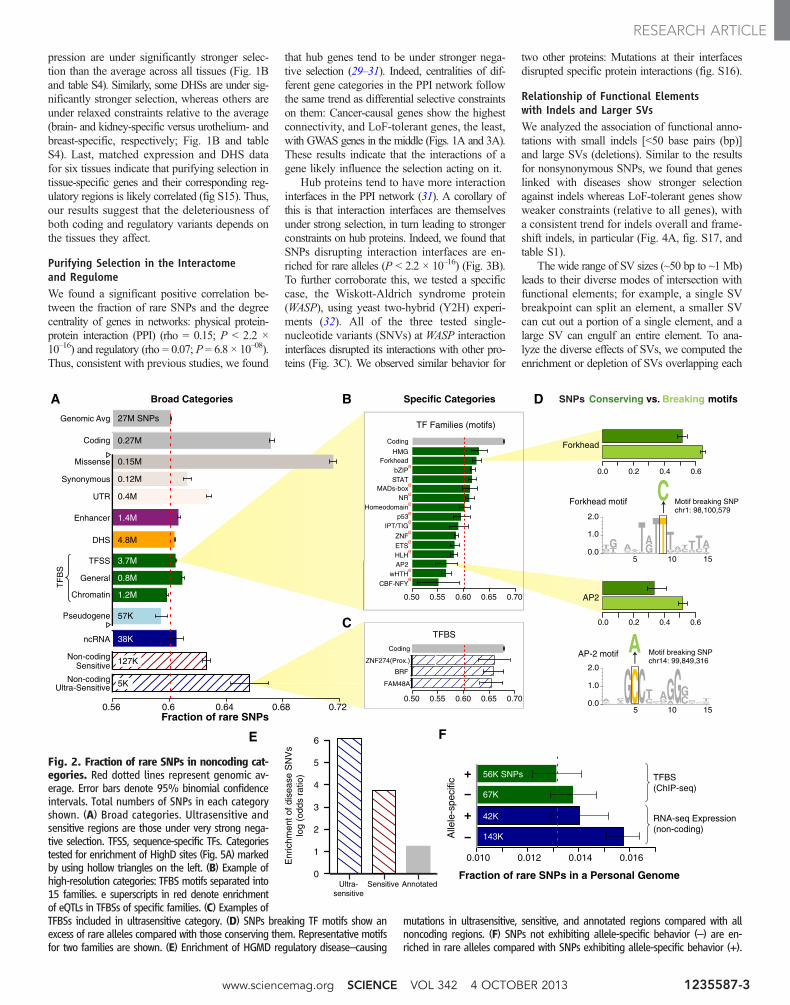
Among these 102 categories, we defined thetop ones covering ~0.02% and ~0.4% of the ge-nome as ultrasensitive and sensitive, respective-ly (fig. S11) (data S3). Thus, these regions weredefined such that they possess a high fraction ofrare variants comparable to that for coding se-quences (67.2% for coding and 65.7% for ultra-sensitive) (Fig. 2C). We validated the rare variantsin them by comparison with Complete Genomicsdata. Sensitive regions include binding sites ofsome chromatin and general TFs (e.g., BRF1 andFAM48A) and core motifs of some important TFfamilies (e.g., JUN, HMG, Forkhead, and GATA).For some TFs, there is a strong difference be-tween proximal and distal binding sites—for ex-ample, for ZNF274, proximal binding sites areunder strong selection and belong to the ultrasen-sitive category, whereas distal sites are not undernegative selection.
In order to validate the functional importanceof sensitive and ultrasensitive regions, we exam-ined the presence of inherited disease-causingmutations from HGMD (Human Gene Muta-tion Database) in them (26). We found ~40- and~400-fold enrichment of disease-causing muta-tions in sensitive and ultrasensitive regions, re-spectively (compared with the entire noncodingsequence, P < 2.2 × 10⁻¹⁶) (Fig. 2E). Thus, thesedocumented disease-causing variants provide in-dependent validation for the functional impor-tance of sensitive regions. As a specific example,the disease congenital erythropoietic porphyriais caused by disruption of a binding site classi-fied as sensitive (the GATA1 motif upstream ofuroporphyrinogen-III synthase) (27). Similarly,the well-known disease-causing ncRNA RMRPis in the binding site of BRF2, classified as ultra-sensitive (28).
Purifying Selection and Other Aspectsof Regulatory RegionsWe analyzed sites at which SNPs break or con-serve core-binding motifs. As expected, we foundthat disruptive motif-breaking SNPs are signif-icantly enriched for rare alleles compared withmotif-conserving ones (P < 2.2 × 10⁻¹⁶; Fig. 2D;a motif-breaking SNP is defined as a change thatdecreases the matching score in the motif posi-tion weight matrix). This result is over all TF fam-ilies; moreover, we find the difference betweenconstraints on motif-breaking versus -conservingSNPs varies considerably for different TF fam-ilies, possibly reflecting differences in the topol-ogy of their DNA binding domains (data S4).
We also found that expression quantitativetrait loci (eQTLs) are enriched in the bindingsites of many TF families (Fig. 2B); the asso-ciation of TF binding and gene expression atthese loci provides a plausible explanation fortheir phenotypic effects.
An analysis of SNPs from a personal genome(NA12878) exhibiting allele-specific TF bind-ing in chromatin immunoprecipitation sequenc-ing (ChIP-Seq) data or allele-specific expressionin RNA-seq data (with the allele-specific “activ-ity” tagging a difference between maternal andpaternal chromosomes at the genomic region inquestion) showed that these sites are depleted forrare variants (relative to a matched control) (Fig.2F). This suggests that regions where differen-tial allelic activity is not observed may be understronger purifying selection (29).
In a similar fashion, we found that core-motifregions bound in a “ubiquitous manner” (i.e.,where differential cell-type–specific binding isnot observed) are under stronger selection thanthose bound by TFs in a single cell line (data S2),consistent with the greater functional importanceof ubiquitously bound regions. In relation to this,we further examined how selective constraintsvary among coding genes and DHSs with tissue-specific activity (Fig. 1B). We found there arepronounced differences between tissues: For ex-ample, genes with ovary- and brain-specific ex-
0.55
0.60
0.65
0.70
0.4
0.5
0.6
0.7
0.8
0.9
A
Fra
ctio
n of
rar
e S
NP
s (n
onsy
n)
All
Cod
ing
LoF
-tol
.
Rec
essi
ve
GW
AS
Dom
inan
t
Ess
entia
l
Can
cer
B
Fra
ctio
n of
rar
e S
NP
s
DHS Coding
Bon
e
Uro
thel
ium
Em
br s
tem
cel
lB
reas
t
Blo
odP
ancr
duc
tP
ancr
eas
Ski
nE
yeLi
ver
Mus
cle
Blo
od v
esse
lH
eart
Lung
Bla
stul
aM
yom
etriu
mE
pith
eliu
mP
rost
ate
Bra
inE
mbr
lung
Gin
giva
lK
idne
yS
pina
l cor
dF
ores
kin
Con
nect
ive
Adi
pose
Live
rC
ervi
xT
rach
eaS
plee
nP
rost
ate
Eso
phag
usLu
ngT
estis
Pla
cent
aB
ladd
erC
olon
Hea
rtT
hyro
idT
hym
usK
idne
yB
rain
Ova
ry
* ******
******* ***
***
169K
SN
Ps
2.6K
9.2K
40K
6.2K
3.5K
4.6K
Fig. 1. Fraction of rare (DAF < 0.5%) SNPs. (A) In various gene cate-gories. Total number of SNPs in each category shown. (B) In noncoding DHSs andcoding genes, which show tissue-specific behavior. Matching tissues for which bothDHS and gene expression data are available shown in same colors: shades of green
for endodermal, gray for mesodermal, and blue for ectodermal origin of tissues.Red dotted lines show the total fraction for all DHSs and coding genes. Asterisksshow significant depletion or enrichment after multiple-hypothesis correction.Error bars in both (A) and (B) denote 95% binomial confidence intervals.
4 OCTOBER 2013 VOL 342 SCIENCE www.sciencemag.org1235587-2
RESEARCH ARTICLE
pression are under significantly stronger selec-tion than the average across all tissues (Fig. 1Band table S4). Similarly, some DHSs are under sig-nificantly stronger selection, whereas others areunder relaxed constraints relative to the average(brain- and kidney-specific versus urothelium- andbreast-specific, respectively; Fig. 1B and tableS4). Last, matched expression and DHS datafor six tissues indicate that purifying selection intissue-specific genes and their corresponding reg-ulatory regions is likely correlated (fig S15). Thus,our results suggest that the deleteriousness ofboth coding and regulatory variants depends onthe tissues they affect.
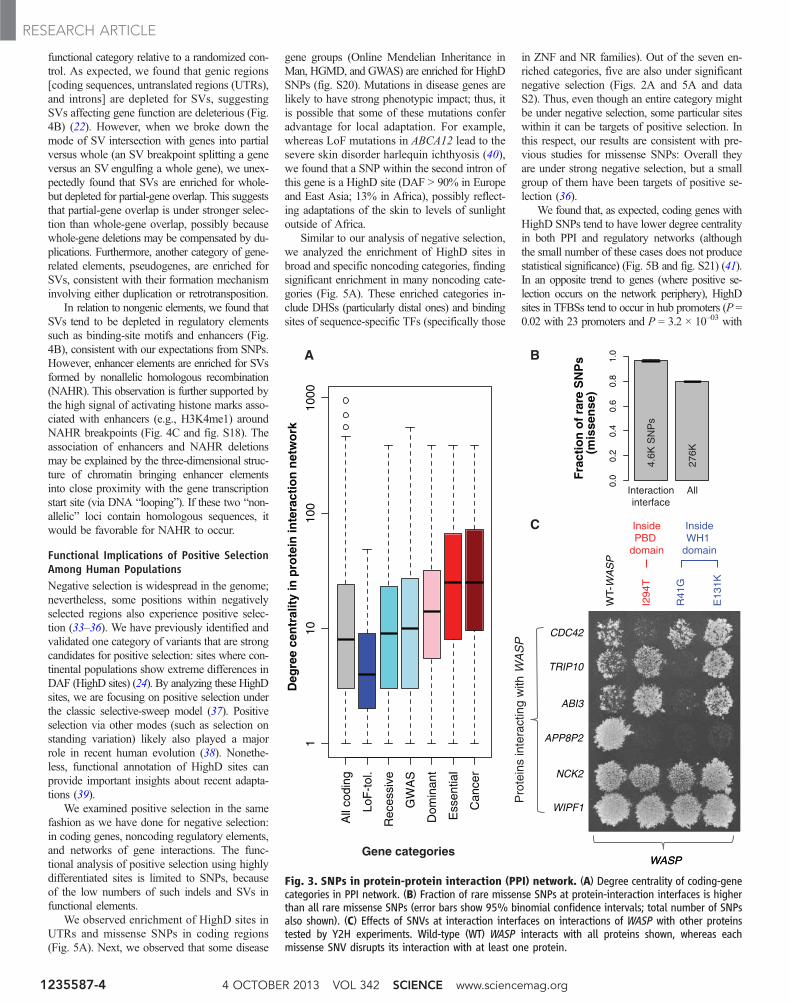
Purifying Selection in the Interactomeand RegulomeWe found a significant positive correlation be-tween the fraction of rare SNPs and the degreecentrality of genes in networks: physical protein-protein interaction (PPI) (rho = 0.15; P < 2.2 ×10⁻¹⁶) and regulatory (rho = 0.07; P = 6.8 × 10–08).Thus, consistent with previous studies, we found
that hub genes tend to be under stronger nega-tive selection (29–31). Indeed, centralities of dif-ferent gene categories in the PPI network followthe same trend as differential selective constraintson them: Cancer-causal genes show the highestconnectivity, and LoF-tolerant genes, the least,with GWAS genes in the middle (Figs. 1A and 3A).These results indicate that the interactions of agene likely influence the selection acting on it.
Hub proteins tend to have more interactioninterfaces in the PPI network (31). A corollary ofthis is that interaction interfaces are themselvesunder strong selection, in turn leading to strongerconstraints on hub proteins. Indeed, we found thatSNPs disrupting interaction interfaces are en-riched for rare alleles (P < 2.2 × 10⁻¹⁶) (Fig. 3B).To further corroborate this, we tested a specificcase, the Wiskott-Aldrich syndrome protein(WASP), using yeast two-hybrid (Y2H) experi-ments (32). All of the three tested single-nucleotide variants (SNVs) at WASP interactioninterfaces disrupted its interactions with other pro-teins (Fig. 3C). We observed similar behavior for
two other proteins: Mutations at their interfacesdisrupted specific protein interactions (fig. S16).
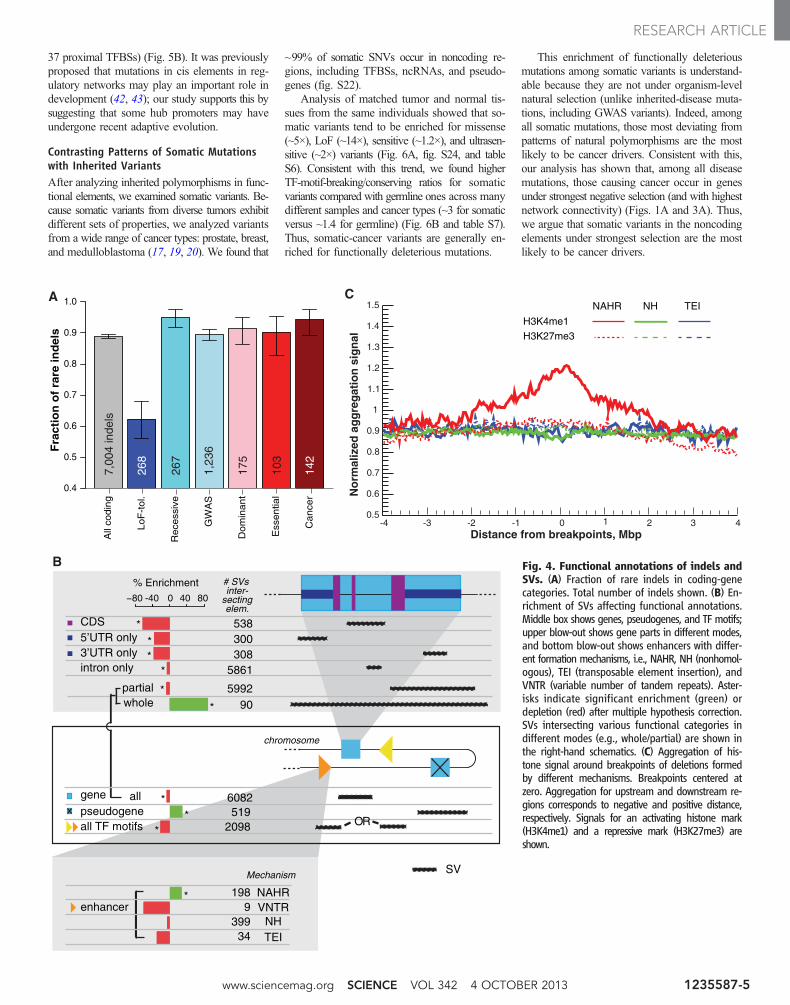
Relationship of Functional Elementswith Indels and Larger SVsWe analyzed the association of functional anno-tations with small indels [<50 base pairs (bp)]and large SVs (deletions). Similar to the resultsfor nonsynonymous SNPs, we found that geneslinked with diseases show stronger selectionagainst indels whereas LoF-tolerant genes showweaker constraints (relative to all genes), witha consistent trend for indels overall and frame-shift indels, in particular (Fig. 4A, fig. S17, andtable S1).
The wide range of SV sizes (~50 bp to ~1 Mb)leads to their diverse modes of intersection withfunctional elements; for example, a single SVbreakpoint can split an element, a smaller SVcan cut out a portion of a single element, and alarge SV can engulf an entire element. To ana-lyze the diverse effects of SVs, we computed theenrichment or depletion of SVs overlapping each
0.56 0.6 0.64 0.68 0.72C GC0.0
1.0
2.0
GTCA
C ATCG
5C
G
TTCG
CGA
10AGC
GTCG
G
C
A
15AGCT
0.0 0.2 0.4 0.6
Coding
HMGForkhead
bZIP e
STATMADs-box
NR e
e
Homeodomain e
p53 e
IPT/TIG e
ZNF e
ETS e
HLH e
AP2wHTH e
CBF-NFY e
Coding
ZNF274(Prox.)
BRF
FAM48A
TF Families (motifs)
TFBS
A
Fraction of rare SNPs
Broad Categories Specific Categories
E
Coding
Genomic Avg
Enhancer
ncRNA
DHS
TF
BS
Pseudogene
Non-codingSensitive
Non-codingUltra-Sensitive
TFSS
General
Chromatin
B
C
D
0.0 0.2 0.4 0.6
SNPs Breaking vs. Conserving motifs
AP2
Forkhead
A
C
AP-2 motif Motif breaking SNPchr14: 99,849,316
T0.0
1.0
2.0
CGT
ATG
TGCA
5G
CTA
CTG
ATT10AG
TGA
G
ACT
CGAT
ACT
15GTA
Forkhead motif Motif breaking SNPchr1: 98,100,579
−
+
−
+
Fraction of rare SNPs in a Personal Genome
0.010 0.012 0.014 0.016
TFBS(ChIP-seq)
RNA-seq Expression(non-coding)
Alle
le-s
peci
fic
F
0.50 0.55 0.60 0.65 0.70
0.50 0.55 0.60 0.65 0.70
38K
1.4M
56K SNPs
67K
42K
143K
127K
57K
3.7M
0.8M
1.2M
Enr
ichm
ent o
f dis
ease
SN
Vs
l
og (
odds
rat
io)
Ultra-sensitive
Sensitive Annotated0
1
2
3
4
5
6
Missense
Synonymous
UTR
0.15M
0.12M
0.4M
0.27M
27M SNPs
4.8M
5K
Fig. 2. Fraction of rare SNPs in noncoding cat-egories. Red dotted lines represent genomic av-erage. Error bars denote 95% binomial confidenceintervals. Total numbers of SNPs in each categoryshown. (A) Broad categories. Ultrasensitive andsensitive regions are those under very strong nega-tive selection. TFSS, sequence-specific TFs. Categoriestested for enrichment of HighD sites (Fig. 5A) markedby using hollow triangles on the left. (B) Example ofhigh-resolution categories: TFBS motifs separated into15 families. e superscripts in red denote enrichmentof eQTLs in TFBSs of specific families. (C) Examples ofTFBSs included in ultrasensitive category. (D) SNPs breaking TF motifs show anexcess of rare alleles compared with those conserving them. Representative motifsfor two families are shown. (E) Enrichment of HGMD regulatory disease–causing
mutations in ultrasensitive, sensitive, and annotated regions compared with allnoncoding regions. (F) SNPs not exhibiting allele-specific behavior (–) are en-riched in rare alleles compared with SNPs exhibiting allele-specific behavior (+).
www.sciencemag.org SCIENCE VOL 342 4 OCTOBER 2013 1235587-3
RESEARCH ARTICLE
functional category relative to a randomized con-trol. As expected, we found that genic regions[coding sequences, untranslated regions (UTRs),and introns] are depleted for SVs, suggestingSVs affecting gene function are deleterious (Fig.4B) (22). However, when we broke down themode of SV intersection with genes into partialversus whole (an SV breakpoint splitting a geneversus an SV engulfing a whole gene), we unex-pectedly found that SVs are enriched for whole-but depleted for partial-gene overlap. This suggeststhat partial-gene overlap is under stronger selec-tion than whole-gene overlap, possibly becausewhole-gene deletions may be compensated by du-plications. Furthermore, another category of gene-related elements, pseudogenes, are enriched forSVs, consistent with their formation mechanisminvolving either duplication or retrotransposition.
In relation to nongenic elements, we found thatSVs tend to be depleted in regulatory elementssuch as binding-site motifs and enhancers (Fig.4B), consistent with our expectations from SNPs.However, enhancer elements are enriched for SVsformed by nonallelic homologous recombination(NAHR). This observation is further supported bythe high signal of activating histone marks asso-ciated with enhancers (e.g., H3K4me1) aroundNAHR breakpoints (Fig. 4C and fig. S18). Theassociation of enhancers and NAHR deletionsmay be explained by the three-dimensional struc-ture of chromatin bringing enhancer elementsinto close proximity with the gene transcriptionstart site (via DNA “looping”). If these two “non-allelic” loci contain homologous sequences, itwould be favorable for NAHR to occur.
Functional Implications of Positive SelectionAmong Human PopulationsNegative selection is widespread in the genome;nevertheless, some positions within negativelyselected regions also experience positive selec-tion (33–36). We have previously identified andvalidated one category of variants that are strongcandidates for positive selection: sites where con-tinental populations show extreme differences inDAF (HighD sites) (24). By analyzing these HighDsites, we are focusing on positive selection underthe classic selective-sweep model (37). Positiveselection via other modes (such as selection onstanding variation) likely also played a majorrole in recent human evolution (38). Nonethe-less, functional annotation of HighD sites canprovide important insights about recent adapta-tions (39).
We examined positive selection in the samefashion as we have done for negative selection:in coding genes, noncoding regulatory elements,and networks of gene interactions. The func-tional analysis of positive selection using highlydifferentiated sites is limited to SNPs, becauseof the low numbers of such indels and SVs infunctional elements.
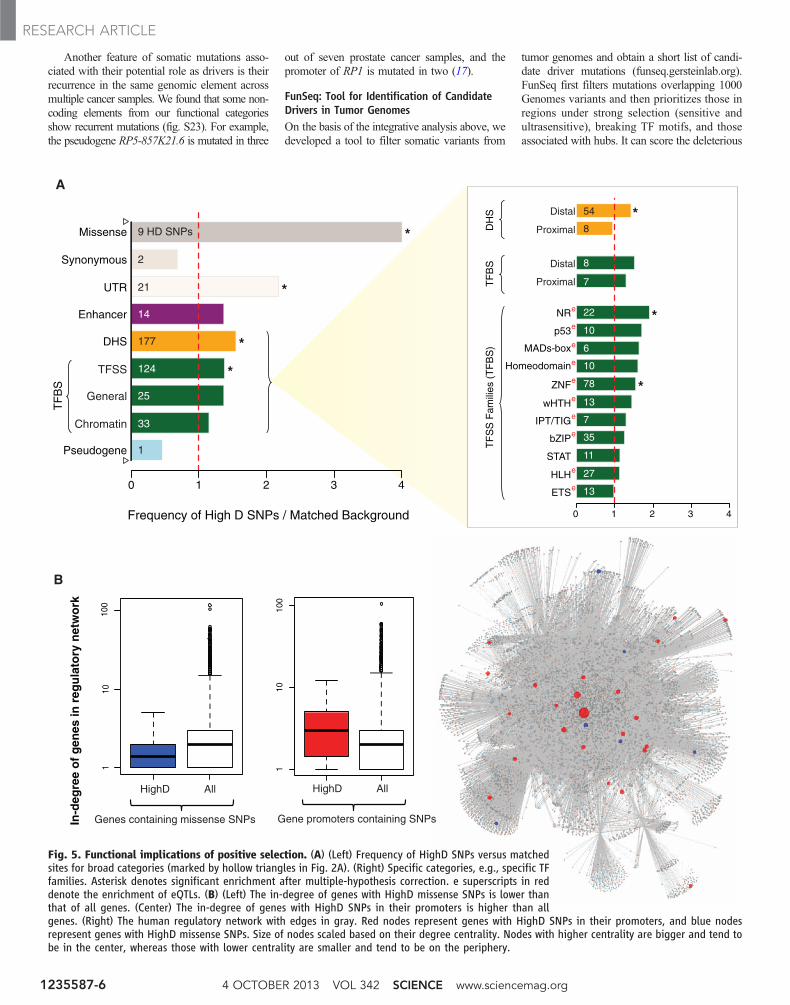
We observed enrichment of HighD sites inUTRs and missense SNPs in coding regions(Fig. 5A). Next, we observed that some disease
gene groups (Online Mendelian Inheritance inMan, HGMD, and GWAS) are enriched for HighDSNPs (fig. S20). Mutations in disease genes arelikely to have strong phenotypic impact; thus, itis possible that some of these mutations conferadvantage for local adaptation. For example,whereas LoF mutations in ABCA12 lead to thesevere skin disorder harlequin ichthyosis (40),we found that a SNP within the second intron ofthis gene is a HighD site (DAF > 90% in Europeand East Asia; 13% in Africa), possibly reflect-ing adaptations of the skin to levels of sunlightoutside of Africa.
Similar to our analysis of negative selection,we analyzed the enrichment of HighD sites inbroad and specific noncoding categories, findingsignificant enrichment in many noncoding cate-gories (Fig. 5A). These enriched categories in-clude DHSs (particularly distal ones) and bindingsites of sequence-specific TFs (specifically those
in ZNF and NR families). Out of the seven en-riched categories, five are also under significantnegative selection (Figs. 2A and 5A and dataS2). Thus, even though an entire category mightbe under negative selection, some particular siteswithin it can be targets of positive selection. Inthis respect, our results are consistent with pre-vious studies for missense SNPs: Overall theyare under strong negative selection, but a smallgroup of them have been targets of positive se-lection (36).
We found that, as expected, coding genes withHighD SNPs tend to have lower degree centralityin both PPI and regulatory networks (althoughthe small number of these cases does not producestatistical significance) (Fig. 5B and fig. S21) (41).In an opposite trend to genes (where positive se-lection occurs on the network periphery), HighDsites in TFBSs tend to occur in hub promoters (P =0.02 with 23 promoters and P = 3.2 × 10–03 with
All
codi
ng
LoF
-tol
.
Rec
essi
ve
GW
AS
Dom
inan
t
Ess
entia
l
Can
cer
Deg
ree
cen
tral
ity
in p
rote
in in
tera
ctio
n n
etw
ork
110
100
1000
Gene categories
0.0
0.2
0.4
0.6
0.8
1.0
Fra
ctio
n o
f ra
re S
NP
s(m
isse
nse
)
Interactioninterface
All
A B
WASPWASP
WT-
WA
SP
I294
T
R41
G
E13
1K
CDC42
WIPF1
TRIP10
ABI3
APP8P2
NCK2
InsidePBD
domain
InsideWH1
domain
Pro
tein
s in
tera
ctin
g w
ith W
AS
PC
4.6K
SN
Ps
276K
Fig. 3. SNPs in protein-protein interaction (PPI) network. (A) Degree centrality of coding-genecategories in PPI network. (B) Fraction of rare missense SNPs at protein-interaction interfaces is higherthan all rare missense SNPs (error bars show 95% binomial confidence intervals; total number of SNPsalso shown). (C) Effects of SNVs at interaction interfaces on interactions of WASP with other proteinstested by Y2H experiments. Wild-type (WT) WASP interacts with all proteins shown, whereas eachmissense SNV disrupts its interaction with at least one protein.
4 OCTOBER 2013 VOL 342 SCIENCE www.sciencemag.org1235587-4
RESEARCH ARTICLE
37 proximal TFBSs) (Fig. 5B). It was previouslyproposed that mutations in cis elements in reg-ulatory networks may play an important role indevelopment (42, 43); our study supports this bysuggesting that some hub promoters may haveundergone recent adaptive evolution.
Contrasting Patterns of Somatic Mutationswith Inherited VariantsAfter analyzing inherited polymorphisms in func-tional elements, we examined somatic variants. Be-cause somatic variants from diverse tumors exhibitdifferent sets of properties, we analyzed variantsfrom a wide range of cancer types: prostate, breast,and medulloblastoma (17, 19, 20). We found that
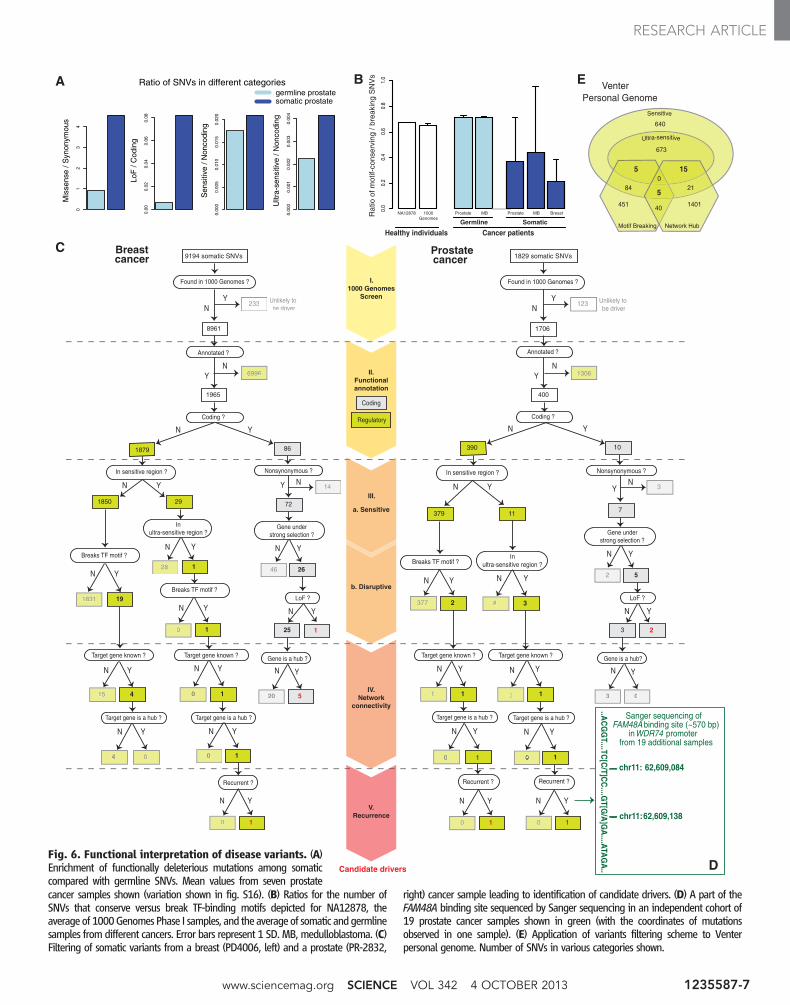
~99% of somatic SNVs occur in noncoding re-gions, including TFBSs, ncRNAs, and pseudo-genes (fig. S22).
Analysis of matched tumor and normal tis-sues from the same individuals showed that so-matic variants tend to be enriched for missense(~5×), LoF (~14×), sensitive (~1.2×), and ultrasen-sitive (~2×) variants (Fig. 6A, fig. S24, and tableS6). Consistent with this trend, we found higherTF-motif-breaking/conserving ratios for somaticvariants compared with germline ones across manydifferent samples and cancer types (~3 for somaticversus ~1.4 for germline) (Fig. 6B and table S7).Thus, somatic-cancer variants are generally en-riched for functionally deleterious mutations.
This enrichment of functionally deleteriousmutations among somatic variants is understand-able because they are not under organism-levelnatural selection (unlike inherited-disease muta-tions, including GWAS variants). Indeed, amongall somatic mutations, those most deviating frompatterns of natural polymorphisms are the mostlikely to be cancer drivers. Consistent with this,our analysis has shown that, among all diseasemutations, those causing cancer occur in genesunder strongest negative selection (and with highestnetwork connectivity) (Figs. 1A and 3A). Thus,we argue that somatic variants in the noncodingelements under strongest selection are the mostlikely to be cancer drivers.
All
codin
g
LoF
-tol.
Rece
ssiv
e
GW
AS
Dom
inant
Ess
entia
l
Cance
r
Fra
ctio
n o
f ra
re in
del
s
0.4
0.5
0.6
0.7
0.8
0.9
1.0A
B
C
Distance from breakpoints, Mbp-4 -3 -2 -1 0 4
No
rmal
ized
ag
gre
gat
ion
sig
nal
0.5
0.6
0.7
0.8
0.9
1
1.1
1.2
1.3
1.4
1.5
1 2 3
H3K4me1H3K27me3
NAHR NH TEI
−80 0 40 80
all
CDS5’UTR only3’UTR onlyintron only
all TF motifs
enhancerNAHRVNTR
NHTEI
pseudogene
-40
% Enrichment
OR
SV
*
*
**
*
*
**
538300308
5861
6082519
2098
whole * 90
partial * 5992
1989
39934
# SVs
chromosome
inter-sectingelem.
Mechanism
gene
267
7,00
4 in
dels
268
1,23
6
175
103
142
Fig. 4. Functional annotations of indels andSVs. (A) Fraction of rare indels in coding-genecategories. Total number of indels shown. (B) En-richment of SVs affecting functional annotations.Middle box shows genes, pseudogenes, and TF motifs;upper blow-out shows gene parts in different modes,and bottom blow-out shows enhancers with differ-ent formation mechanisms, i.e., NAHR, NH (nonhomol-ogous), TEI (transposable element insertion), andVNTR (variable number of tandem repeats). Aster-isks indicate significant enrichment (green) ordepletion (red) after multiple hypothesis correction.SVs intersecting various functional categories indifferent modes (e.g., whole/partial) are shown inthe right-hand schematics. (C) Aggregation of his-tone signal around breakpoints of deletions formedby different mechanisms. Breakpoints centered atzero. Aggregation for upstream and downstream re-gions corresponds to negative and positive distance,respectively. Signals for an activating histone mark(H3K4me1) and a repressive mark (H3K27me3) areshown.
www.sciencemag.org SCIENCE VOL 342 4 OCTOBER 2013 1235587-5
RESEARCH ARTICLE
Another feature of somatic mutations asso-ciated with their potential role as drivers is theirrecurrence in the same genomic element acrossmultiple cancer samples. We found that some non-coding elements from our functional categoriesshow recurrent mutations (fig. S23). For example,the pseudogene RP5-857K21.6 is mutated in three
out of seven prostate cancer samples, and thepromoter of RP1 is mutated in two (17).
FunSeq: Tool for Identification of CandidateDrivers in Tumor GenomesOn the basis of the integrative analysis above, wedeveloped a tool to filter somatic variants from
tumor genomes and obtain a short list of candi-date driver mutations (funseq.gersteinlab.org).FunSeq first filters mutations overlapping 1000Genomes variants and then prioritizes those inregions under strong selection (sensitive andultrasensitive), breaking TF motifs, and thoseassociated with hubs. It can score the deleterious
0 1 2 3 4
0 1 2 3 4
Missense
Synonymous
Enhancer
UTR
DHS
TF
BS
Pseudogene
Frequency of High D SNPs / Matched Background
TF
SS
Fam
ilies
(T
FB
S)
NRe
p53e
ZNFe
Homeodomaine
wHTHe
bZIPe
HLHe
MADs-boxe
STAT
IPT/TIGe
ETSe
*
*
*
*
*
*
*
110
100
110
100
In-d
egre
e o
f g
enes
in r
egu
lato
ry n
etw
ork
Genes containing missense SNPs
HighD All
Gene promoters containing SNPs
HighD All
A
B
TFSS
General
Chromatin
DH
ST
FB
S Distal
Proximal
Distal
Proximal9 HD SNPs
2
21
14
177
124
33
1
54
8
8
7
22
10
78
10
13
35
27
6
11
7
13
25
Fig. 5. Functional implications of positive selection. (A) (Left) Frequency of HighD SNPs versus matchedsites for broad categories (marked by hollow triangles in Fig. 2A). (Right) Specific categories, e.g., specific TFfamilies. Asterisk denotes significant enrichment after multiple-hypothesis correction. e superscripts in reddenote the enrichment of eQTLs. (B) (Left) The in-degree of genes with HighD missense SNPs is lower thanthat of all genes. (Center) The in-degree of genes with HighD SNPs in their promoters is higher than allgenes. (Right) The human regulatory network with edges in gray. Red nodes represent genes with HighD SNPs in their promoters, and blue nodesrepresent genes with HighD missense SNPs. Size of nodes scaled based on their degree centrality. Nodes with higher centrality are bigger and tend tobe in the center, whereas those with lower centrality are smaller and tend to be on the periphery.
4 OCTOBER 2013 VOL 342 SCIENCE www.sciencemag.org1235587-6
RESEARCH ARTICLE
0.0
0.2
0.4
0.6
0.8
1.0
Rat
io o
f mot
if-co
nser
ving
/ br
eaki
ng S
NV
sA
Ultr
a-se
nsiti
ve /
Non
codi
ng
Mis
sens
e / S
ynon
ymou
s
Ratio of SNVs in different categories0
12
34
LoF
/ C
odin
g0.
000.
020.
040.
060.
08
Sen
sitiv
e / N
onco
ding
0.00
00.
005
0.01
00.
015
0.02
0
0.00
00.
001
0.00
20.
003
0.00
4
germline prostatesomatic prostate
B
C
Found in 1000 Genomes ?
8961
Annotated ?
Coding ?
Nonsynonymous ?
86
72
14
In sensitive region ?
LoF ?
125
29 1850
1879
In ultra-sensitive region ?
128
191831
Breaks TF motif ?
YN
YN
Y N
YN
YN
Y
Unlikely to be driver
N
10
Breaks TF motif ?
YN
Recurrent ?
10
YN
Gene is a hub ?
5
YN
E
Target gene known ?
10
YN
YN
Target gene is a hub ?
0 1
YN
Gene under strong selection ?
26
YN
20
46
6996
233
YN
Target gene known ?
415
YN
YN
Target gene is a hub ?
04
1829 somatic SNVs
123
Found in 1000 Genomes ?
1706
Nonsynonymous ?
10
7
3
In sensitive region ?
390
LoF ?
2
11 379
In ultra-sensitive region ?
382377
Breaks TF motif ?
YN
YN
YN
YN
YN
YNY
Unlikely tobe driver
N
Target gene known ?
11
YN
Recurrent ?
Target gene known ?
12
YN
YN
Target gene is a hub ?
1
..AC
GG
T....TC[C
/T]CC
....GT[G
/A]G
A....ATA
GA
..
chr11: 62,609,084
62,609,138
Annotated ?
Coding ?
YN
Gene under strong selection ?
5
YN
2
1306
Recurrent ?
YN
Target gene is a hub ?
1 0
3
chr11:
Candidate drivers
Gene is a hub?
0
YN
3
9194 somatic SNVs Breast cancer
Prostate cancer
1965 400
10
YN
10
YN
Sanger sequencing of FAM48A binding site (~570 bp)
in WDR74 promoter from 19 additional samples
Network HubMotif Breaking
VenterPersonal Genome
451
05
673
15
584 21
140140
640
D
V.Recurrence
a. Sensitive
IV. Network
connectivity
II. Functionalannotation
Regulatory
Coding
I.1000 Genomes
Screen
III.
NA12878 1000Genomes
Prostate MBProstateMB Breast
Germline Somatic
Healthy individuals Cancer patients
b. Disruptive
Fig. 6. Functional interpretation of disease variants. (A)Enrichment of functionally deleterious mutations among somaticcompared with germline SNVs. Mean values from seven prostatecancer samples shown (variation shown in fig. S16). (B) Ratios for the number ofSNVs that conserve versus break TF-binding motifs depicted for NA12878, theaverage of 1000GenomesPhase I samples, and the averageof somatic andgermlinesamples from different cancers. Error bars represent 1 SD. MB, medulloblastoma. (C)Filtering of somatic variants from a breast (PD4006, left) and a prostate (PR-2832,
right) cancer sample leading to identification of candidate drivers. (D) A part of theFAM48A binding site sequenced by Sanger sequencing in an independent cohort of19 prostate cancer samples shown in green (with the coordinates of mutationsobserved in one sample). (E) Application of variants filtering scheme to Venterpersonal genome. Number of SNVs in various categories shown.
www.sciencemag.org SCIENCE VOL 342 4 OCTOBER 2013 1235587-7
RESEARCH ARTICLE
potential of variants in single or multiple genomesand output the results in easy-to-use formats (i.e.,“decorated” variant call format files, fig. S29 anddata S6). The scores for each noncoding variantvary from 0 to 6, with 6 corresponding to maxi-mum deleterious effect. When multiple tumor ge-nomes are given as input, FunSeq also identifiesrecurrent mutations in the same element. Althoughour emphasis is on noncoding variants, it alsooutputs scores for coding variants.
We demonstrate the application of FunSeqas a workflow on representative breast and pros-tate cancer genomes (Fig. 6C). In the breast cancersample, the workflow yielded one noncoding SNVlikely to have strong phenotypic consequences:This SNV (i) occurs in an ultrasensitive region(BRF2 binding site); (ii) breaks a PAX-5 TF bind-ing motif; (iii) is associated with a network hub(44); and (iv) is recurrent—that is, the regulatorymodule contains somatic mutations in multiplebreast-cancer samples. In a similar fashion, theprostate-cancer sample revealed two noncodingSNVs predicted to have strong functional conse-quences (Fig. 6C). One of these is in an ultra-sensitive region (FAM48A binding site) and liesin the promoter ofWDR74 gene (a hub in the PPInetwork with degree centrality = 56). We furthertested the presence of mutations in this bindingsite by polymerase chain reaction followed bySanger sequencing in an independent cohort of19 prostate-cancer samples (45). We found thatone sample in the cohort also harbors mutationsin this region (Fig. 6D and fig. S25). Further-more, we also observed increased expression ofWDR74 in the tumor relative to benign samples(fig. S26). These experimental results providesupport for a likely functional role of this candi-date driver.
A large-scale application of our tool to threemedulloblastoma, 21 breast, and 64 prostate can-cer genomes provided a total of 98 noncodingcandidate drivers (table S8 and data S6) (17–20).Among these candidates, 68 occur in sensitiveregions, 55 break TF motifs, and 90 target net-work hubs.
Generalized Identification of DeleteriousVariants in Personal GenomesAlthough we envision the most effective use ofour tool for tumor genomes, it can also be ap-plied to germline sequences to identify poten-tially deleterious variants. We applied it to fourpersonal genomes: Snyder, Venter, NA12878, andNA19240 (46–48). Out of ~3 million SNVs, wewere able to identify ~15 (range from 6 to 26)noncoding SNVs per individual with high scoresfrom FunSeq (>4), indicating their potential del-eterious effects (Fig. 6E, tables S9 and S10, anddata S6 and S7). Thus, our approach can be usedto prioritize noncoding variants in personal ge-nomes as well.
DiscussionWe identified the sensitive and ultrasensitive non-coding elements, which exhibit depletion of com-
mon polymorphisms and strong enrichment ofknown, inherited disease-causing mutations. Be-cause they cover a small fraction of the entiregenome (comparable to the exome), these re-gions can be probed alongside exome sequencesin clinical studies. We found that functionallydisruptive noncoding mutations tend to be understrong selection: In an analogous manner to LoFvariants in coding genes, variants that break mo-tifs in TF binding sites are selected against. Thereis a close relation between connectivity in biolog-ical networks and selective constraints: Higherconnectivity is generally associated with higherconstraint. Furthermore, selection against indelsand large SVs acts in a similar fashion as againstSNPs overall; however, the large size of SVssometimes leads to a complex relation with func-tional elements. On the basis of these patterns ofnegative selection in functional elements, we de-veloped a workflow and a corresponding softwaretool to prioritize noncoding variants in diseasestudies.
The prioritization scheme presented in ourpaper can be readily extended by incorporationof genomic polymorphisms from larger popula-tions and higher-resolution functional annotations.Moreover, with the availability of RNA-seq datafrom large cohorts, additional genomic featuressuch as eQTLs can be folded in. Our approachcan be immediately applied in precision medi-cine studies to prioritize noncoding variants forfollow-up characterization, particularly candidatedriver mutations in cancer, and it can be furtherextended in the future.
Materials and MethodsDetails of all data sets and methods are providedin the supplementary materials. A brief summaryof major data sets and methods is provided here.SNPs, indels, and SVs from 1000 Genomes PhaseI release were used to investigate patterns of selec-tion in DNA elements (24). Noncoding annota-tions were obtained from ENCODE Integrativepaper release (2). Although we did analyze broadfunctional annotations, such as all TFBSs, wefocused on highly specific categories such as distalbinding sites of factor ZNF274. A randomizationprocedure, similar to the Genome Structure Cor-rection (2), was developed by considering the de-pendency structure of different categories to dealwith multiple hypothesis correction while iden-tifying the categories under significantly strong se-lection. Patterns of somatic mutations were obtainedfrom seven prostate cancer (17), three medullo-blastoma (20), and 21 breast cancer genomes(19), whereas driver mutations were also identi-fied in additional 57 prostate cancer genomes (18).
References and Notes1. B. Yngvadottir, D. G. Macarthur, H. Jin, C. Tyler-Smith,
The promise and reality of personal genomics.Genome Biol. 10, 237 (2009). doi: 10.1186/gb-2009-10-9-237; pmid: 19723346
2. I. Dunham et al., An integrated encyclopedia of DNAelements in the human genome. Nature 489, 57–74(2012). doi: 10.1038/nature11247; pmid: 22955616
3. M. T. Maurano et al., Systematic localization of commondisease-associated variation in regulatory DNA. Science337, 1190–1195 (2012); 10.1126/science.1222794.doi: 10.1126/science.1222794; pmid: 22955828
4. L. D. Ward, M. Kellis, Interpreting noncoding geneticvariation in complex traits and human disease.Nat. Biotechnol. 30, 1095–1106 (2012). doi: 10.1038/nbt.2422; pmid: 23138309
5. A. Visel et al., Targeted deletion of the 9p21 non-codingcoronary artery disease risk interval in mice. Nature464, 409–412 (2010). doi: 10.1038/nature08801;pmid: 20173736
6. W. Lee, P. Yue, Z. Zhang, Analytical methods for inferringfunctional effects of single base pair substitutions inhuman cancers. Hum. Genet. 126, 481–498 (2009).doi: 10.1007/s00439-009-0677-y; pmid: 19434427
7. L. D. Ward, M. Kellis, Evidence of abundant purifyingselection in humans for recently acquired regulatoryfunctions. Science 337, 1675–1678 (2012); 10.1126/science.1225057. doi: 10.1126/science.1225057;pmid: 22956687
8. X. J. Mu, Z. J. Lu, Y. Kong, H. Y. Lam, M. B. Gerstein,Analysis of genomic variation in non-coding elementsusing population-scale sequencing data from the1000 Genomes Project. Nucleic Acids Res. 39,7058–7076 (2011). doi: 10.1093/nar/gkr342;pmid: 21596777
9. B. Vernot et al., Personal and population genomicsof human regulatory variation. Genome Res. 22,1689–1697 (2012). doi: 10.1101/gr.134890.111;pmid: 22955981
10. S. Horn et al., TERT promoter mutations in familialand sporadic melanoma. Science 339, 959–961(2013); 10.1126/science.1230062. doi: 10.1126/science.1230062; pmid: 23348503
11. F. W. Huang et al., Highly recurrent TERT promotermutations in human melanoma. Science 339, 957–959(2013); 10.1126/science.1229259. doi: 10.1126/science.1229259; pmid: 23348506
12. P. J. Killela et al., TERT promoter mutations occurfrequently in gliomas and a subset of tumors derivedfrom cells with low rates of self-renewal. Proc. Natl. Acad.Sci. U.S.A. 110, 6021–6026 (2013). doi: 10.1073/pnas.1303607110; pmid: 23530248
13. D. Bell et al., Integrated genomic analyses of ovariancarcinoma. Nature 474, 609–615 (2011). doi: 10.1038/nature10166; pmid: 21720365
14. D. M. Muzny et al., Comprehensive molecularcharacterization of human colon and rectal cancer.Nature 487, 330–337 (2012). doi: 10.1038/nature11252; pmid: 22810696
15. P. S. Hammerman et al., Comprehensive genomiccharacterization of squamous cell lung cancers. Nature489, 519–525 (2012). doi: 10.1038/nature11404;pmid: 22960745
16. T. J. Hudson et al., International network of cancergenome projects. Nature 464, 993–998 (2010).doi: 10.1038/nature08987; pmid: 20393554
17. M. F. Berger et al., The genomic complexity of primaryhuman prostate cancer. Nature 470, 214–220 (2011).doi: 10.1038/nature09744; pmid: 21307934
18. S. C. Baca et al., Punctuated evolution of prostatecancer genomes. Cell 153, 666–677 (2013).doi: 10.1016/j.cell.2013.03.021; pmid: 23622249
19. S. Nik-Zainal et al., Mutational processes molding thegenomes of 21 breast cancers. Cell 149, 979–993(2012). doi: 10.1016/j.cell.2012.04.024;pmid: 22608084
20. T. Rausch et al., Genome sequencing of pediatricmedulloblastoma links catastrophic DNA rearrangementswith TP53 mutations. Cell 148, 59–71 (2012).doi: 10.1016/j.cell.2011.12.013; pmid: 22265402
21. G. Bejerano et al., Ultraconserved elements in the humangenome. Science 304, 1321–1325 (2004); 10.1126/science.1098119. doi: 10.1126/science.1098119;pmid: 15131266
22. R. E. Mills et al., Mapping copy number variation bypopulation-scale genome sequencing. Nature 470,59–65 (2011). doi: 10.1038/nature09708;pmid: 21293372
4 OCTOBER 2013 VOL 342 SCIENCE www.sciencemag.org1235587-8
RESEARCH ARTICLE
23. R. Redon et al., Global variation in copy number in thehuman genome. Nature 444, 444–454 (2006).doi: 10.1038/nature05329; pmid: 17122850
24. G. R. Abecasis et al., An integrated map of geneticvariation from 1,092 human genomes. Nature 491,56–65 (2012). doi: 10.1038/nature11632;pmid: 23128226
25. Z. D. Zhang, A. Frankish, T. Hunt, J. Harrow,M. Gerstein, Identification and analysis of unitarypseudogenes: Historic and contemporary gene losses inhumans and other primates. Genome Biol. 11, R26(2010). doi: 10.1186/gb-2010-11-3-r26;pmid: 20210993
26. P. D. Stenson et al., The Human Gene MutationDatabase: 2008 update. Genome Med 1, 13 (2009).doi: 10.1186/gm13; pmid: 19348700
27. C. Solis, G. I. Aizencang, K. H. Astrin, D. F. Bishop,R. J. Desnick, Uroporphyrinogen III synthase erythroidpromoter mutations in adjacent GATA1 and CP2 elementscause congenital erythropoietic porphyria. J. Clin. Invest.107, 753–762 (2001). doi: 10.1172/JCI10642;pmid: 11254675
28. P. Hermanns et al., Consequences of mutations in thenon-coding RMRP RNA in cartilage-hair hypoplasia.Hum. Mol. Genet. 14, 3723–3740 (2005). doi: 10.1093/hmg/ddi403; pmid: 16254002
29. M. B. Gerstein et al., Architecture of the humanregulatory network derived from ENCODE data. Nature489, 91–100 (2012). doi: 10.1038/nature11245;pmid: 22955619
30. H. B. Fraser, A. E. Hirsh, L. M. Steinmetz, C. Scharfe,M. W. Feldman, Evolutionary rate in the proteininteraction network. Science 296, 750–752 (2002).doi: 10.1126/science.1068696; pmid: 11976460
31. E. Khurana, Y. Fu, J. Chen, M. Gerstein, Interpretationof genomic variants using a unified biologicalnetwork approach. PLOS Comput. Biol. 9, e1002886(2013). doi: 10.1371/journal.pcbi.1002886;pmid: 23505346
32. X. Wang et al., Three-dimensional reconstruction ofprotein networks provides insight into human geneticdisease. Nat. Biotechnol. 30, 159–164 (2012).doi: 10.1038/nbt.2106; pmid: 22252508
33. P. C. Sabeti et al., Positive natural selection in thehuman lineage. Science 312, 1614–1620 (2006).doi: 10.1126/science.1124309; pmid: 16778047
34. J. Ohashi et al., Extended linkage disequilibriumsurrounding the hemoglobin E variant due to malarial
selection. Am. J. Hum. Genet. 74, 1198–1208 (2004).doi: 10.1086/421330; pmid: 15114532
35. M. T. Hamblin, A. Di Rienzo, Detection of the signature ofnatural selection in humans: Evidence from the Duffyblood group locus. Am. J. Hum. Genet. 66, 1669–1679(2000). doi: 10.1086/302879; pmid: 10762551
36. L. B. Barreiro, G. Laval, H. Quach, E. Patin, L. Quintana-Murci,Natural selection has driven population differentiationin modern humans. Nat. Genet. 40, 340–345 (2008).doi: 10.1038/ng.78; pmid: 18246066
37. Y. Xue et al., Population differentiation as an indicatorof recent positive selection in humans: An empiricalevaluation. Genetics 183, 1065–1077 (2009).doi: 10.1534/genetics.109.107722; pmid: 19737746
38. R. D. Hernandez et al., Classic selective sweeps were rarein recent human evolution. Science 331, 920–924(2011). doi: 10.1126/science.1198878; pmid: 21330547
39. S. R. Grossman et al., Identifying recent adaptations inlarge-scale genomic data. Cell 152, 703–713 (2013).doi: 10.1016/j.cell.2013.01.035; pmid: 23415221
40. M. Akiyama et al., Mutations in lipid transporter ABCA12in harlequin ichthyosis and functional recovery bycorrective gene transfer. J. Clin. Invest. 115, 1777–1784(2005). doi: 10.1172/JCI24834; pmid: 16007253
41. P. M. Kim, J. O. Korbel, M. B. Gerstein, Positive selectionat the protein network periphery: Evaluation in terms ofstructural constraints and cellular context. Proc. Natl.Acad. Sci. U.S.A. 104, 20274–20279 (2007).doi: 10.1073/pnas.0710183104; pmid: 18077332
42. R. Haygood, O. Fedrigo, B. Hanson, K. D. Yokoyama,G. A. Wray, Promoter regions of many neural- andnutrition-related genes have experienced positiveselection during human evolution. Nat. Genet. 39,1140–1144 (2007). doi: 10.1038/ng2104;pmid: 17694055
43. S. B. Carroll, Evo-devo and an expanding evolutionarysynthesis: A genetic theory of morphologicalevolution. Cell 134, 25–36 (2008). doi: 10.1016/j.cell.2008.06.030; pmid: 18614008
44. K. Y. Yip et al., Classification of human genomic regionsbased on experimentally determined binding sites ofmore than 100 transcription-related factors. GenomeBiol. 13, R48 (2012). doi: 10.1186/gb-2012-13-9-r48;pmid: 22950945
45. C. E. Barbieri et al., Exome sequencing identifies recurrentSPOP, FOXA1 and MED12 mutations in prostate cancer.Nat. Genet. 44, 685–689 (2012). doi: 10.1038/ng.2279;pmid: 22610119
46. R. M. Durbin et al., A map of human genome variationfrom population-scale sequencing. Nature 467,1061–1073 (2010). doi: 10.1038/nature09534;pmid: 20981092
47. R. Chen et al., Personal omics profiling revealsdynamic molecular and medical phenotypes. Cell 148,1293–1307 (2012). doi: 10.1016/j.cell.2012.02.009;pmid: 22424236
48. S. Levy et al., The diploid genome sequence of an individualhuman. PLoS Biol. 5, e254 (2007). doi: 10.1371/journal.pbio.0050254; pmid: 17803354
Acknowledgments: We thank G. Boysen and C. O’Reilly forhelp with SNV experimental validation, K. Yip for target-geneidentification, and Z. Liu for Web site design. T.H.P. issupported by the Danish Council for Independent ResearchMedical Sciences (FSS). Funding at the European BioinformaticsInstitute is provided by European Molecular BiologyLaboratory and the Wellcome Trust (WT085532 andWT095908). C.T.-S. acknowledges grant 098051 from theWellcome-Trust Sanger Institute. Funding for the Institute forPrecision Medicine (Weill Cornell Medical College/New YorkPresbyterian) is provided by National Cancer Institute (NCI)grant R01CA152057 (A.S., M.G., and M.A.R.) and EarlyDetection Research Network NCI U01 CA111275 (M.A.R.).M.A.R. also thanks the Prostate Cancer Foundation. M.G.also acknowledges grants HG005718 and HG007000. G.M.acknowledges National Human Genome Research Institutegrants R01HG4719 and U01HG6513. H.Y. and S.M.L. aresupported by NCI grant CA167824, National Institute ofGeneral Medical Sciences grant GM104424, and a Clinicaland Translational Science Center Pilot Award and CornellSeed Grant for intercampus collaborations. H.M.K., T.L.,A.S., L.L., J.C., A.H., and J.D. contributed equally.
Supplementary Materialswww.sciencemag.org/content/342/6154/1235587/suppl/DC1Materials and MethodsSupplementary TextFig. S1 to S29Tables S1 to S12References (49–90)Data S1 to S7
24 January 2013; accepted 23 July 201310.1126/science.1235587
www.sciencemag.org SCIENCE VOL 342 4 OCTOBER 2013 1235587-9
RESEARCH ARTICLE
DOI: 10.1126/science.1235587, (2013);342 Science
et al.Ekta KhuranaCancer GenomicsIntegrative Annotation of Variants from 1092 Humans: Application to
This copy is for your personal, non-commercial use only.
clicking here.colleagues, clients, or customers by , you can order high-quality copies for yourIf you wish to distribute this article to others
here.following the guidelines
can be obtained byPermission to republish or repurpose articles or portions of articles
): April 8, 2016 www.sciencemag.org (this information is current as of
The following resources related to this article are available online at
/content/342/6154/1235587.full.htmlversion of this article at:
including high-resolution figures, can be found in the onlineUpdated information and services,
/content/suppl/2013/10/02/342.6154.1235587.DC1.html can be found at: Supporting Online Material
/content/342/6154/1235587.full.html#relatedfound at:
can berelated to this article A list of selected additional articles on the Science Web sites
/content/342/6154/1235587.full.html#ref-list-1, 36 of which can be accessed free:cites 90 articlesThis article
/content/342/6154/1235587.full.html#related-urls38 articles hosted by HighWire Press; see:cited by This article has been
/cgi/collection/geneticsGenetics
subject collections:This article appears in the following
registered trademark of AAAS. is aScience2013 by the American Association for the Advancement of Science; all rights reserved. The title
CopyrightAmerican Association for the Advancement of Science, 1200 New York Avenue NW, Washington, DC 20005. (print ISSN 0036-8075; online ISSN 1095-9203) is published weekly, except the last week in December, by theScience
on A
pril
8, 2
016
Dow
nloa
ded
from