integrative approaches to exploring functional …
TRANSCRIPT

INTEGRATIVE APPROACHES TO EXPLORING FUNCTIONAL ROLES OF
CLANDESTINE SPECIES: A CASE STUDY OF AQUATIC SNAKES WITHIN ISOLATED
WETLAND ECOSYSTEMS
by
JOHN D. WILLSON
(Under the Direction of J. Whitfield Gibbons)
ABSTRACT
Understanding the functional roles of species is critical to making informed conservation
and management decisions. Although the roles of many common species have been thoroughly
studied, species that are infrequently encountered are often assumed to be rare and of minor
functional significance. Snakes are among the most secretive vertebrates and consequently, we
know little about snake population ecology, predator-prey relationships, or the roles that snakes
play within ecosystems. Prompted by this lack of knowledge, I used novel and integrative
methods to investigate the roles of these inconspicuous and difficult-to-sample predators.
Specifically, I (1) used mark-recapture, stable isotope analyses, and laboratory experiments to
estimate the predatory role of aquatic snakes within an isolated fishless wetland, (2) investigated
ways in which prey communities may mediate snake’s roles, and (3) theoretically evaluated
ways in which snakes, as ectotherms, may differ from comparable endothermic predators in their
interactions with prey populations.
Using advanced mark-recapture analyses to develop a thorough understanding of factors
that affect detectability in aquatic snakes, I estimated snake population density at Ellenton Bay,

an isolated, 6 ha freshwater wetland in South Carolina, USA. I found that snakes exist at
extremely high densities (>170 snakes ha-1) within this productive habitat. Using data on snake
density, growth rate, diet, and mass conversion efficiency, I estimated that snakes consumed over
200 kg of amphibian prey annually at Ellenton Bay, translating into >150,000 kJ ha-1 of energy
flow from secondary to tertiary consumers within the food web. Additionally, I demonstrated
that aquatic salamanders, which are characteristic of fishless wetlands, represent a higher quality
prey for watersnakes than sunfish, which are characteristic of permanent wetlands. Watersnakes
consumed more and larger salamanders than sunfish with less impairment to post-prandial
locomotor performance. Thus, although snakes can be extremely important predators within
some aquatic ecosystems, snake’s roles may be mediated by prey community composition.
Finally, using a mathematical predator-prey model, I demonstrated that shifting predator
numerical responses from those characteristic of endotherms to more linear curves characteristic
of ectotherms was generally stabilizing to predator-prey dynamics, indicating that snakes may
exhibit more stable predator-prey interactions than those of endothermic predators.
INDEX WORDS: black swamp snake, banded watersnake, Seminatrix pygaea, Nerodia
fasciata, diet, stable isotopes, food webs, trophic niche, population dynamics, mark-recapture, program MARK, robust design, population estimation, detectability, physiological ecology, feeding ecology, prey handling, locomotor performance, digestive physiology, specific dynamic action (SDA), population modeling, predator-prey interactions, life-history, ectothermy, reptiles.

INTEGRATIVE APPROACHES TO EXPLORING FUNCTIONAL ROLES OF
CLANDESTINE SPECIES: A CASE STUDY OF AQUATIC SNAKES WITHIN ISOLATED
WETLAND ECOSYSTEMS
by
JOHN D. WILLSON
B.S., Davidson College, 2002
A Dissertation Submitted to the Graduate Faculty of The University of Georgia in Partial
Fulfillment of the Requirements for the Degree
DOCTOR OF PHILOSOPHY
ATHENS, GEORGIA
2009

© 2009
John D. Willson
All Rights Reserved

INTEGRATIVE APPROACHES TO EXPLORING FUNCTIONAL ROLES OF
CLANDESTINE SPECIES: A CASE STUDY OF AQUATIC SNAKES WITHIN ISOLATED
WETLAND ECOSYSTEMS
by
JOHN D. WILLSON
Major Professor: J. Whitfield Gibbons
Committee: Michael E. Dorcas Patricia A. Gowaty Melissa A. Pilgrim Pejman Rohani
Electronic Version Approved: Maureen Grasso Dean of the Graduate School The University of Georgia May 2009

iv
ACKNOWLEDGEMENTS
First and foremost, I would like to thank my advisor and mentor, Whit Gibbons. Not only
do I owe much of my professional success to Whit’s endless enthusiasm, selfless promotion, and
depthless knowledge, but the Gibbons family also served as a home-away-from-home throughout
my graduate career. I would also like to thank Mike Dorcas who served as both my
undergraduate mentor and as a member of my doctoral committee. Mike inspired me to turn a
passion for natural history into a career in herpetology and he continues to be an exceptional role
model, friend, colleague. The other members of my doctoral committee, Melissa Pilgrim, Patty
Gowaty, and Pej Rohani, also deserve particular thanks for their generous support and guidance
throughout my graduate career.
A primary goal of my dissertation research was to explore new ecological fields and join
my knowledge of snake ecology with innovative methods that have seldom been applied to
reptiles. Thus, my dissertation relied heavily on collaboration and many co-authors were
instrumental in my research. I would particularly like to thank Whit Gibbons, Bill Hopkins,
Melissa Pilgrim, Pej Rohani, Chris Romanek, Brian Todd, and Chris Winne, all of whom were
involved in data collection, analysis, or editing of my dissertation research.
I am truly grateful to have had the opportunity to conduct my doctoral research at the
Savannah River Ecology Lab (SREL). The opportunities offered by SREL and its inspiring
atmosphere contributed greatly to my professional development. However, SREL’s true strength
lies in its people and I would never have made it through graduate school without the support
and camaraderie of other students, friends, and colleagues at SREL including: Kimberly

v
Andrews, Kurt Buhlmann, Sarah DuRant, Luke Fedewa, Xav Glaudas, Gabrielle Graeter, Judy
Greene, Cris Hagen, Ryan Holem, Tom Luhring, Brian Metts, Tony Mills, Melissa Pilgrim, Sean
Poppy, Bob Reed, Betsie Rothermel, Leslie Ruyle, David Scott, Brian Todd, Tracey Tuberville,
Jamie Williams, Chris Winne, Meredith Wright, and Cameron Young. In particular, Chris
Winne, Sarah DuRant, Brian Todd, and Melissa Pilgrim were all great friends who greatly
influenced me, both personally and professionally during my time as a graduate student. I also
had the privileged opportunity to mentor two exceptional undergraduate students while at SREL,
Andrew Durso and Evan Eskew. Both were rewarding experiences that taught me a lot about
myself and my future as an educator.
Finally, I would like to thank my family; parents – Tom and Janet Willson and sister –
Susan Willson. Without their constant support, encouragement, and tolerance of my obsessions,
none of this would have been possible. Any success of mine reflects their hard work and
exceptional example.
My research was supported by a Graduate Research Fellowship from the National
Science Foundation and by a Grant-In-Aid-of-Research from the Society for Integrative and
Comparative Biology. Additional support was provided by the Savannah River Ecology
Laboratory Graduate Research Program, the University of Georgia, and by the Environmental
Remediation Sciences Division of the Office of Biological and Environmental Research, U.S.
Department of Energy through Financial Assistance Award no. DE-FC09-07SR22506 to the
University of Georgia Research Foundation.

vi
TABLE OF CONTENTS
Page
ACKNOWLEDGEMENTS........................................................................................................... iv
LIST OF TABLES......................................................................................................................... ix
LIST OF FIGURES ....................................................................................................................... xi
CHAPTER
1 INTRODUCTION AND LITERATURE REVIEW .....................................................1
Literature Cited........................................................................................................10
2 ECOLOGICAL AND METHODOLOGICAL FACTORS AFFECTING
DETECTABILITY AND POPULATION ESTIMATION IN “UNCATCHABLE”
SPECIES .................................................................................................................16
Introduction .............................................................................................................17
Methods ...................................................................................................................21
Results .....................................................................................................................28
Discussion ...............................................................................................................30
Acknowledgements .................................................................................................39
Literature Cited........................................................................................................40
3 EFFECTS OF TERRESTRIAL RESOURCE PULSES ON TROPHIC NICHE
WIDTH AND OVERLAP IN TWO SYMPATRIC AQUATIC SNAKE SPECIES:
A STABLE ISOTOPE APPROACH ......................................................................52
Introduction .............................................................................................................53

vii
Methods ...................................................................................................................56
Results .....................................................................................................................62
Discussion ...............................................................................................................65
Acknowledgements .................................................................................................71
Literature Cited........................................................................................................71
4 THE PREDATORY ROLE OF AQUATIC SNAKES WITHIN AN ISOLATED
WETLAND ECOSYSTEM: A CASE STUDY IN EVALUATING
FUNCTIONAL ROLES OF CLANDESTINE SPECIES.......................................83
Introduction .............................................................................................................84
Methods ...................................................................................................................86
Results .....................................................................................................................93
Discussion ...............................................................................................................96
Acknowledgements ...............................................................................................100
Literature Cited......................................................................................................101
5 PREY MORPHOLOGY CONSTRAINS FEEDING ECOLOGY OF AN AQUATIC
GENERALIST PREDATOR: IMPLICATIONS FOR WETLAND
CONSERVATION................................................................................................115
Introduction ...........................................................................................................116
Methods .................................................................................................................119
Results ...................................................................................................................130
Discussion .............................................................................................................133
Acknowledgements ...............................................................................................142
Literature Cited......................................................................................................142

viii
6 THE ROLE OF ECTOTHERMY IN VERTEBRATE PREDATOR-PREY
DYNAMICS: DOES INCREASING METABOLIC EFFICIENCY ALTER THE
STABILITY OF PREDATOR-PREY INTERACTIONS?...................................158
Introduction ...........................................................................................................159
Model.....................................................................................................................164
Parameter Estimation ............................................................................................170
Results ...................................................................................................................171
Discussion .............................................................................................................173
Acknowledgements ...............................................................................................176
Literature Cited......................................................................................................177
7 CONCLUSION..........................................................................................................186

ix
LIST OF TABLES
Page
Table 2.1: List of a priori candidate models designed to evaluate support for temporary
emigration, behavioral responses to traps, and time-varying capture probability in
aquatic snakes at Ellenton Bay, South Carolina, USA..................................................45
Table 2.2: Variations of the most parameterized candidate model (Model 1) evaluating support
for sex effects in capture probability, recapture probability, or temporary emigration in
aquatic snakes at Ellenton Bay, South Carolina, USA..................................................46
Table 2.3: Model rankings for Nerodia fasciata sampled over a one year period at Ellenton Bay,
South Carolina, USA.....................................................................................................47
Table 2.4: Model rankings for Seminatrix pygaea sampled over a one year period at Ellenton
Bay, South Carolina, USA. ...........................................................................................48
Table 2.5: Temporary emigration parameters (γ’’ and γ’), capture probably (p), and recapture
probability (c) estimates for Nerodia fasciata and Seminatrix pygaea generated from
models with no temporary emigration (TE), constant random temporary emigration,
and Markovian temporary emigration. ..........................................................................49
Table 4.1: Estimated consumption of amphibian prey by snakes at Ellenton Bay between May
2005 and May 2006.....................................................................................................108
Table 4.2: Estimated distribution of prey consumption by snakes across prey taxonomic
groups… ......................................................................................................................109
Table 5.1: Nutritional composition of Ambystoma talpoideum and Lepomis marginatus ..........149

x
Table 5.2: Metabolic parameters (mean ± 1 SE) of Nerodia fasciata fed prey items (Ambystoma
talpoideum and Lepomis marginatus) equal to 25% of snake body mass and held at
25 °C............................................................................................................................150
Table 6.1: Model parameter estimates for stereotypical specialist endothermic and ectothermic
predators, the least weasel (Mustela nivalis) and the adder (Vipera berus), and
parameter values used in simulations ..........................................................................180

xi
LIST OF FIGURES
Page
Figure 2.1: Capture summary for N. fasciata and S. pygaea at Ellenton Bay from May 2005 to
May 2006.......................................................................................................................50
Figure 2.2: Seasonal variation in capture (p) and recapture (c) probabilities for Nerodia fasciata
and Seminatrix pygaea at Ellenton Bay in 2005 and 2006............................................51
Figure 3.1: Diet composition of banded watersnakes and black swamp snakes at Ellenton Bay
from May 2005 to April 2006 based on gut-content analysis .......................................76
Figure 3.2: Seasonal availability of amphibian prey at Ellenton Bay including (a) fully aquatic
groups (salamanders and tadpoles) and (b) migratory adult and metamorphic
anurans….......................................................................................................................77
Figure 3.3: Average δ13C and δ15N values (± 1 SE) of amphibian prey captured at Ellenton Bay
in 2005 and 2006 ...........................................................................................................78
Figure 3.4: Seasonal shifts in isotopic composition of amphibian prey and snakes at Ellenton
Bay.................................................................................................................................79
Figure 3.5: Overall trophic niche breadth of (a) banded watersnakes and (b) black swamp snakes
at Ellenton Bay as indicated by carbon and nitrogen isotope composition...................80
Figure 3.6: Ontogenetic and seasonal shifts in δ13C and δ15N values for banded watersnakes (a
and b) and black swamp snakes (c and d) .....................................................................81
Figure 3.7: Seasonal shifts (arrows) in mean carbon and nitrogen isotope values (± 1 SE) for
banded watersnakes at Ellenton Bay .............................................................................82

xii
Figure 4.1: Aquatic snakes are abundant at Ellenton Bay, though they are seldom seen during
visual searches .............................................................................................................110
Figure 4.2: Seasonal distribution of captures of (a) Nerodia fasciata and (b) Seminatrix pygaea at
Ellenton Bay from May 2005 to April 2006. ..............................................................111
Figure 4.3: Population estimates (± 1 SE) of (a) Nerodia fasciata and (b) Seminatrix pygaea at
Ellenton Bay from May 2005 to April 2006 ...............................................................112
Figure 4.4: Diet composition of Nerodia fasciata and Seminatrix pygaea at Ellenton Bay from
May 2005 to April 2006 ..............................................................................................113
Figure 4.5: Mean (± 1 SE) seasonal growth rates of (a) Nerodia fasciata and (b) Seminatrix
pygaea at Ellenton Bay from May 2005 to April 2006...............................................114
Figure 5.1: Prey profiles of permanent (n = 8) and isolated, periodically dry (n = 8) wetlands
located on the Savannah River Site, South Carolina, USA, based on prey numerical
abundance (a) and biomass (b) ....................................................................................151
Figure 5.2: Mean (± 1 SE) abundance of Nerodia fasciata within permanent (n = 8) and isolated,
periodically dry (n = 8) wetlands located on the Savannah River Site, South Carolina,
USA .............................................................................................................................152
Figure 5.3: Morphological differences between paedomorphic Ambystoma talpoideum and
Lepomis marginatus, including (a) maximum width and (b) maximum height of
prey…..........................................................................................................................153
Figure 5.4: Number of prey consumed (mean ± 1 SE) by juvenile Nerodia fasciata fed
Ambystoma talpoideum or Lepomis marginatus of different sizes .............................154
Figure 5.5: Handling times (mean ± 1 SE) of juvenile Nerodia fasciata fed Ambystoma
talpoideum or Lepomis marginatus of different sizes .................................................155

xiii
Figure 5.6: Mean (± 1 SE) oxygen consumption by juvenile Nerodia fasciata (n = 11 per
treatment) fed an Ambystoma talpoideum or Lepomis marginatus equal to 25% of the
snake’s body mass at 25 °C.........................................................................................156
Figure 5.7: Post-feeding locomotor impairment of juvenile Nerodia fasciata (n = 8 per treatment)
fed Ambystoma talpoideum and Lepomis marginatus.................................................157
Figure 6.1: Conceptualized representation of prey (= energy) allocation in endothermic and
ectothermic vertebrate predators .................................................................................181
Figure 6.2: Numerical response and vital rate curves of rodent-eating snakes and endothermic
specialist predators ......................................................................................................182
Figure 6.3: Vital rate (survival, reproductive rate, or recruitment rate) curves obtained from the
generalized vital rate function ( tφ ) and varying values of λ (‘degree of
ectothermy’)….. ..........................................................................................................183
Figure 6.4: Operating diagram of the general predator-prey model, illustrating the destabilizing
effects of surplus killing and increased predator birth rate on predator-prey
dynamics…..................................................................................................................184
Figure 6.5: Operating diagrams illustrating the stability of predator-prey interactions in which
slopes of vital rate curves (survivorship, predator birth rate, recruitment rate) are
altered to represent increasing ‘degree of ectothermy’ (λ) at increasing levels of
‘surplus killing’ (A-C) and maximum predator reproductive rate (D-F) ....................185

CHAPTER 1
INTRODUCTION AND LITERATURE REVIEW
The turn of the 21st century has seen Earth’s human population exceed six billion and has
marked unprecedented levels of natural resource consumption, global transportation, and urban
expansion. In light of the magnitude and diversity of effects that these activities are having on
the environment, ecologists and conservation biologists are confronted with increasingly difficult
decisions in their prioritization of conservation resources. The desire to maximize the success of
limited conservation initiatives has prompted increased interest in ecosystem ecology, with the
frequent goal of understanding the role of individual species or functional groups in maintaining
overall ecosystem integrity (Grimm 1995; Lyons and Schwartz 2001; Vanni et al. 2002). Among
the functional groups within ecosystems, particular attention has been paid to high-level
predators, and the roles of predators have been demonstrated in a variety of terrestrial and
aquatic systems (e.g., Paine 1966, 1969; Estes and Palmisano 1974; Soulé et al. 1988; McLaren
and Peterson 1994). In many cases, predators play an important direct role in regulating prey
populations (Erlinge et al. 1984; Hanski et al. 2001; Korpimaki et al. 2004; Sundell 2006), and
predators can indirectly influence abundance of lower trophic levels through trophic cascades
(Pace et al. 1999; Polis et al. 2000; Schmitz et al. 2000). So-called “keystone” predators can play
roles disproportionate to their abundance by maintaining biodiversity through preferential
predation on competitively-superior prey taxa (Paine 1966, 1969). Although major groups of
predatory vertebrates include mammals, birds, fish, amphibians, and reptiles, the roles of
1

herpetofauna as predators remain largely unaddressed. Particularly, although all snakes are
strictly carnivorous and many species are top predators within food webs (Greene 1997), our
knowledge of the role of snakes within ecosystems is extremely limited.
Because of their secretive behavior, snakes are often encountered with a frequency that
belies their true abundance and have historically been undervalued as ecosystem components.
For example, in an early edition of the Golden Guide to Reptiles and Amphibians, Zim and
Smith (1953) stated: “as a group they [reptiles] are neither ‘good’ nor ‘bad,’ but are interesting
and unusual, although of minor importance. If they should all disappear, it would not make much
difference one way or the other.” However, due in part to their low energetic requirements,
snakes often exist at population densities an order of magnitude or more greater than comparable
endothermic predators (Pough 1980). Resting metabolic rates of reptiles are generally 10 – 20%
of those of similarly-sized endotherms (Pough 1980). Snakes’ low metabolic demands allow for
efficient transfer of ingested energy across trophic levels. For example, adders (Vipera berus)
and least weasels (Mustela rixosa), similarly-sized European predators that specialize on
microtine rodents, have assimilation efficiencies of 49% and 2.3%, respectively (Pough 1980).
Consequently, V. berus occur at population densities (4 -14 per hectare; Parker and Plummer
1987) 20 – 1400 times greater than those of M. rixosa (0.01 – 0.20 per hectare; Hanski et al.
2001). Small-bodied aquatic (Regina alleni and Seminatrix pygaea) and terrestrial (Diadophis
punctatus) snakes have both been documented to reach densities of greater than 1000 per hectare
in Florida (Godley 1980), and Kansas (Fitch 1975), respectively. Even large-bodied terrestrial
snakes can reach high densities in suitable habitat. For example, one Chinese island hosts
spectacular densities (274 per hectare) of a large endemic pit-viper, Gloydius shedaoensis (Sun et
al. 2001). Because snakes often exist at high densities and are capable of efficient assimilation of
2
biomass and energy, they presumably comprise important functional components of many
ecosystems. However, although numerous studies have examined the effects of prey availability
on snake demography, growth, and survival (e.g., Forsman and Lindell 1991; 1997; Shine and
Madsen 1997; Madsen and Shine 2000a, 2000b; Madsen et al. 2006; Sperry and Weatherhead
2008), and a few studies have examined the effects of snake predation on prey behavior (e.g.,
Getz et al. 1990; Kotler et al. 1993; Bouskila 1995), few studies have evaluated snakes’
functional roles as predators or their impacts on prey populations.
Perhaps the most dramatic evidence of the potential impacts of snake predation arises
from situations where non-native snakes have been introduced into naive ecosystems. For
example, the accidental introduction of the brown treesnake (Boiga irregularis) into the island
nation of Guam has had catastrophic effects on native birds, bats, and lizards, driving several
species to extinction and leaving much of the island devoid of most native vertebrates (Fritts and
Rodda 1998; Rodda and Savage 2007). Similarly, introduction of the viperine watersnake (Natrix
maura) to the island of Mallorca has been proposed as a cause of the decline of an endemic
midwife toad (Alytes mulentensis; Moore et al. 2004). Some cases where snake abundance or
prey consumption has been quantified are difficult to interpret because the area occupied by
foraging snakes is unknown. For example, Ineich et al. (2007) estimated that approximately
1,400 sea kraits (Laticauda laticaudata and L. saintgironsi) inhabiting a 6-ha islet in the South
Pacific consumed over 36,000 eels (972 kg) from surrounding reefs annually. However, although
their results clearly show that snakes are important predators in coral reef ecosystems, this
predation pressure may be spread over as much as 130 ha of surrounding coral reef habitat
(Ineich et al. 2007). Conversely, in his classic study of the foraging ecology of the striped
crayfish snake (Regina alleni), Godley (1980) used systematic sampling to estimate snake
3

density and prey consumption over a quantified area within an unusually uniform habitat: mats
of introduced water hyacinth (Eichhorina crassipes) in Florida. Godley (1980) employed a
dredging method to systematically sample R. alleni and their primary prey, crayfish and odonate
naiads. Godley (1980) calculated that the mean density of R. alleni was 1289 snakes per hectare
and estimated that snakes consumed 9.6% and 90.7% of the standing biomass of crayfish and
odonate naiads, respectively, during the fall, when snake feeding rates were highest. Despite a
limited number of intensive studies such as Godley's, our overall knowledge of the effects of
snake predation on prey populations is minimal.
Often, a necessary first step in evaluating functional roles of species within ecosystems is
to determine the abundance of each species or functional group. Thus, we have gleaned much of
our knowledge of the effects of community structure on ecosystem processes from studies of
species groups that are relatively easy to survey, such as grassland plants (e.g., Tilman et al.
1997) or sessile invertebrates (e.g., Paine 1966, 1969; Pringle et al. 1999). Snakes are among the
most secretive of all terrestrial vertebrates, leading some authors to label snakes as generally
intractable (Parker and Plummer 1987) or question the feasibility of monitoring snake
populations using conventional methods such as mark-recapture (Turner 1977; Shine 1987; Fitch
1987; Parker and Plummer 1987). Harvey (2005) demonstrated the cryptic nature of snakes by
randomly centering 50 m by 50 m (0.25 ha) search plots on individual massasauga rattlesnakes
(Sistrurus catenatus), located by radio-telemetry. In less that 5% of plot searches were observers
able to locate the snake within a 20-minute search period. Due to snakes’ cryptic behavior and
low or sporadic activity patterns, many researchers have relied on counts or other indices of
relative abundance as indicators of snake population density (Dorcas and Willson in press).
However, using counts as indicators of density requires assuming a consistent (generally positive
4
and linear) relationship between population density and the index of abundance, an assumption
that is likely seldom reasonable for snakes (Dorcas and Willson in press). For example, research
on B. irregularis has found no correlation between visual counts and population density
estimated by mark-recapture (Rodda et al. 2005) and has demonstrated that snake surveys may
suffer from observer bias (Rodda 1993). Such evidence necessitates the incorporation of
detection probability into population monitoring (Mazerolle et al. 2007).
Recent advances in mark-recapture analytical techniques allow researchers to estimate
population density of species with low or variable recapture probability (Dorcas and Willson in
press). Particularly powerful is the so-called “robust design” analysis (Pollock 1982) which uses
a combination of demographically open and closed population models to estimate both
population size and survivorship over long, demographically open intervals with minimal
violation of model assumptions (Pollock et al. 1990; Bailey et al. 2004). Importantly, robust
design also allows for incorporation of time and group (e.g., sex or age) varying capture and
recapture probabilities, behavioral responses to traps (i.e., “trap-happy” or “trap-shyness”) and
temporary emigration (individuals becoming unavailable for capture during some sampling
intervals; Kendall et al. 1997; Bailey et al. 2004). Although accounting for these factors can
greatly improve accuracy and precision of population estimates, the implementation of robust
design analysis requires careful design of sampling methodology. Consequently, these methods
have only recently been applied to herpetofauna (Mazerolle et al. 2007) and have yet to be
applied to snake populations.
Quantifying diet is also essential for understanding the functional role of species in
regard to energy processing, transfer, and storage within ecosystems. Traditionally, gut or fecal
contents have been examined to determine diet composition (e.g., Votier et al. 2003; Mushinsky
5

and Hebrard 1977; Mushinsky et al. 1982). However, such direct dietary analyses often incur
bias due to difficulty in accurately measuring relative abundance of different prey items, lack of
temporal integration of diet composition (i.e., samples are snapshots), and failure to account for
variation in assimilation rates, potentially resulting in over or under-representation of certain
items in diet (Bearhop et al. 1999; Votier et al. 2003; Bearhop et al. 2004). For snakes, these
complications may be exacerbated by infrequent feeding intervals, changes in behavior related to
meal size (e.g., extent of basking or reduced locomotor ability), near complete digestion of many
food items, and difficulty of detecting small food items by manual palpation. For example,
because snakes are able to consume spectacularly large whole prey (up to 150% of the snake’s
own body mass; Greene 1983), and because large prey take longer to digest (Andrade et al.
1997), impair snakes’ abilities to crawl or swim (Garland and Arnold 1983; Ford and
Shuttlesworth 1986; Shine and Shetty 2001; Mehta 2006), and are more obvious to the observer,
it is likely that large diet items are overrepresented in many assessments of snake diet. Because
stable isotope composition of consumer tissue reflects diet in predictable ways, examination of
variance structure in stable isotope composition has been proposed as a robust tool for evaluating
diet without incurring bias associated with gut content analyses (Beahop et al. 2004; Newsome et
al. 2007). However, using stable isotopes as diet indicators requires careful consideration of
spatial and temporal variation in prey availability and isotopic composition (Bearhop et al.
2004). Few studies to date have characterized suitable study systems or employed the sampling
designs necessary to implement this powerful tool effectively.
Finally, thorough assessment of a predator’s role requires not only knowledge of prey
consumption, but also an understanding of the reciprocal interaction between predator and prey
populations. The study of predator-prey interactions has shed considerable light on numerous
6

ecological processes. For example, investigations of the characteristically cyclic dynamics of
high latitude microtine rodents (reviewed in Hanski et al. 2001; Korpimaki et al. 2004) have
demonstrated that life-history differences between predator functional groups can result in
profound differences in predator-prey interactions. The ability of generalist predators to switch
prey types allows them to maintain high population densities and mount rapid functional
responses to increases in prey abundance, stabilizing population dynamics (Andersson and
Erlinge 1977; Hanski et al. 1991). Although snakes are strict carnivores and can exist at high
densities, snake population biology and particularly how snakes interact with prey populations
remain poorly understood (Gragg et al. 2007; Dorcas and Willson in press; Nowak et al. in
press). For example, in a recent review Nowak et al. (in press) found that of 301 studies of
predator-prey dynamics, none focused on terrestrial ectothermic predators. Moreover, ectotherms
display a suite of physiological and life-history attributes that make them fundamentally different
from mammalian and avian predators. However, the population dynamic consequences of these
physiological and life-history differences on predator-prey interactions remain unexplored
(Nowak et al. in press), and no studies have incorporated snake predation into theoretical
predator-prey models.
To date, few studies have accurately determined snake population density, fewer have
extended their results to assess the role that snakes play as predators, and none have incorporated
snake predation into theoretical predator-prey models. My dissertation takes an integrative,
multidisciplinary approach to generate a comprehensive understanding of functional roles that
snakes, though infrequently observed, can play in ecosystems. My research draws on techniques
and concepts from field population monitoring and mark-recapture statistics, stable isotope food-
web ecology, laboratory physiological and performance experiments, and mathematical predator-
7

prey population modeling to investigate the roles that snakes play as predators. Although my
dissertation focuses particularly on snakes, the approach is one that can be applied to a variety of
inconspicuous or difficult-to-sample species.
In Chapters 2 – 4 of my dissertation I present a case study of aquatic snakes within
Ellenton Bay, an isolated 6 ha fishless freshwater wetland in South Carolina, USA, to illustrate
the role that snakes can play in some ecosystems. In Chapter 2, I use intensive field sampling and
advanced robust design mark-recapture analytical techniques (Pollock 1982; Pollock et al. 1990)
in program MARK (White and Burnham 1999) to evaluate factors influencing detectability of
two species of secretive aquatic snakes. I construct several a priori mark-recapture models
incorporating various combinations of time and group (sex)-varying capture and recapture
probabilities, behavioral responses to traps (i.e., “trap-happiness” or “trap-shyness”), and
temporary emigration and rank models for each species using Akaike’s information criterion
(AIC; Akaike 1973). I use patterns of model support and parameter estimates from those models
to evaluate factors affecting the accuracy and precision of population estimates for secretive
snake species.
In Chapter 3, I use stable isotope techniques to evaluate diets of aquatic snakes within an
isolated wetland, Ellenton Bay, where amphibian breeding migrations cause dramatic seasonal
shifts in prey abundance. Although stable isotopes have been proposed as an unbiased tool for
quantifying diet (Bearhop et al. 2004; Newsome et al. 2007), their use requires careful
consideration of spatial and temporal variation in prey availability and isotopic composition
(Bearhop et al. 2004). I use stable isotopes (C and N) to examine trophic niche characteristics of
two sympatric aquatic snakes (N. fasciata and S. pygaea) in response to seasonal migrations of
amphibian prey. Specifically, I characterize snake and prey isotope compositions through time,
8

space, and ontogeny. I also assess seasonal availability of prey taxa and compare seasonal snake
and prey isotope profiles to assess the effects of temporal resource pulses (breeding amphibian
migrations) on trophic niche width and diet overlap between the two snake species.
In Chapter 4, I assess the functional role that aquatic snakes play as predators by
estimating the biomass of amphibians consumed by snakes at Ellenton Bay over a one year
period. To accomplish this goal, I synthesize snake population density estimates obtained using
mark-recapture (Chapter 2), stable isotope and field data on snake diets (Chapter 3), snake
growth rates measured in the field, and mass conversion efficiency data obtained in the
laboratory. Specifically, I use these data to estimate snake density and standing biomass, biomass
of prey consumed by snakes over a one year period, and distribution of consumption by snakes
across amphibian prey taxa. My results shed light on snakes’ roles as predators within fishless
wetland ecosystems and their role in transfer of biomass and energy between the wetlands and
surrounding terrestrial habitats.
Having used a case study to demonstrate the role that snakes can play within fishless
wetland ecosystems, in Chapter 5, I evaluate how differing prey communities may cause
variation in snakes’ roles among aquatic ecosystems. Specifically, I evaluate ways in which prey
characteristic of fishless wetlands may facilitate the important functional role that snakes play
within these ecosystems. I present data on prey composition of isolated (fishless) and permanent
(fish inhabited) wetlands to establish that aquatic salamanders (Ambystoma) are the primary prey
available to snakes in isolated wetlands and centrarchid fish (sunfish; Lepomis spp.) are the
dominant prey in permanent wetlands. I then conduct a series of three laboratory experiments
that investigate ways in which Ambystoma differ from Lepomis as potential food items for
juvenile N. fasciata. Specifically, I compare nutritional composition and morphology of the prey
9

taxa and use a series of repeated-measures experiments to examine handling (number of prey
consumed, maximum prey size, and handling time), digestive metabolism (specific dynamic
action, SDA), and post-prandial locomotor performance (reduction in maximum crawling speed)
of snakes fed Ambystoma and Lepomis. My results document ways in which prey differ in their
suitability as prey for snakes, potentially leading to variation in snakes' functional importance
among aquatic ecosystems.
In Chapter 6, I broaden the scope of my findings to evaluate how snakes interact with
prey populations over long time scales. Specifically, I develop a mathematical predator-prey
model to theoretically explore how the physiological and life-history attributes of ectotherms
make predator-prey relationships involving snakes different from those involving comparable
endothermic predators (e.g., mammals). I argue that a fundamental difference between
endothermic and ectothermic predators lies in their responses to variation in prey abundance.
Due to high energetic demands, endothermic specialist predators expire rapidly when prey
become scarce and have limited abilities to translate abundant prey into reproductive output.
Functionally, this creates steep, approaching threshold, curves relating vital rates to prey
abundance. Ectotherms, conversely, have superior capabilities for energy storage and higher
reproductive potential, allowing vital rates to respond more linearly to increasing prey
abundance. I construct a discrete-time predator-prey model that explores the population dynamic
consequences of shifting vital rate curves from those characteristic of endotherms to more linear
curves characteristic of ectotherms.
LITERATURE CITED
Akaike, H. 1973. Information theory and an extension of the maximum likelihood principle. Pages 267-281 in B. N. Petrov and F. Cazakil, editors. Internal symposium information theory. Second edition. Akademiai Kidao, Budapest, Hungary.
10

Andersson, M. and S. Erlinge. 1977. Influence of predation on rodent populations. Oikos 29:591-597.
Andrade, D. V., A. P. Cruz-Neto, and A. S. Abe. 1997. Meal size and specific dynamic action in
the rattlesnake Crotalus durissus (Serpentes : Viperidae). Herpetologica 53:485-493. Bailey, L. L., T. R. Simons, and K. H. Pollock. 2004. Estimating detection probability
parameters for Plethodon salamanders using the robust capture-recapture design. Journal of Wildlife Management 68:1-13.
Bearhop, S., C. E. Adams, S. Waldron, R. A. Fuller, and H. Macleod. 2004. Determining trophic
niche width: a novel approach using stable isotope analysis. Journal of Animal Ecology 73:1007-1012.
Bearhop, S., D. R. Thompson, S. Waldron, I. C. Russell, G. Alexander, and R. W. Furness. 1999.
Stable isotopes indicate the extent of freshwater feeding by cormorants Phalacrocorax carbo shot at inland fisheries in England. Journal of Applied Ecology 36:75-84.
Bouskila, A. 1995. Interactions between predation risk and competition: a field study of
kangaroo rats and snakes. Ecology 76:165-178. Dorcas, M. E., and J. D. Willson. in press. Innovative Methods for Studies of Snake Ecology and
Conservation. In: Snakes: Ecology and Conservation, S. J. Mullin and R. A. Seigel (Eds.). Cornell University Press, Ithaca, NY.
Erlinge, S., Goransson, Hogstedt, Jansson, O. Liberg, J. Loman, I. N. Nilsson, T. Vonshantz, and
M. Sylven. 1984. Can vertebrate predators regulate their prey? American Naturalist 123:125-133.
Estes, J. A., and J. F. Palmisano. 1974. Sea otters: their role in structuring nearshore
communities. Science 185:1058-1060. Fitch, H. S. 1975. A demographic study of the ringneck snake (Diadophis punctatus) in Kansas.
University of Kansas Museum of Natural History Miscellaneous Publications 62:1-53. Fitch, H. S. 1987. Collecting and life-history techniques. In: Snakes: Ecology and Evolutionary
Biology, R. A. Seigel, J. T. Collins and S. S. Novak (Eds.). McGraw-Hill, Inc., New York. pp. 143-164.
Ford, N. B. and G. A. Shuttlesworth. 1986. Effects of variation in food intake on locomotory
performance of juvenile garter snakes. Copeia 1986:999-1001. Forsman, A., and L. E. Lindell. 1991. Trade off between growth rate and energy storage in male
Vipera berus (L.) under different prey densities. Functional Ecology 5:717-723.
11

Forsman, A., and L. E. Lindell. 1997. Responses of a predator to variation in prey abundance: survival and emigration of adders in relation to vole density. Canadian Journal of Zoology 75:1099-1108.
Fritts, T. H. and G. H. Rodda. 1998. The role of introduced species in the degradation of island
ecosystems: a case history of Guam. Annual Review of Ecology and Systematics 29:113-140.
Garland, T. and S. J. Arnold. 1983. Effects of a full stomach on locomotory performance of
juvenile garter snakes (Thamnophis elegans). Copeia 1983:1092-1096. Getz, L. L., N. G. Solomon, and T. M. Pizzuto. 1990. The effects of predation of snakes on
social organization of the prairie vole, Microtus ochrogaster. American Midland Naturalist 123:365-371.
Godley, J. S. 1980. Foraging ecology of the striped swamp snake, Regina alleni, in Southern
Florida. Ecological Monographs 50:411-436. Gragg, J. E., G. H. Rodda, J. A. Savidge, G. C. White, K. Dean-Bradley, and A. R. Ellingson.
2007. Response of brown treesnakes to reduction of their rodent prey. Journal of Wildlife Management 71:2311-2317.
Greene, H. W. 1983. Dietary correlates of the origin and radiation of snakes. American Zoologist
23:431-441. Greene, H. W. 1997. Snakes: the Evolution of Mystery in Nature. University of California Press,
Los Angeles, CA. Grimm, N. B. 1995. Why link species and ecosystems? A perspective from ecosystem ecology.
In C. G. Jones and J. H. Lawton (eds.), Linking Species and Ecosystems, pp. 5-15. Chapman & Hall, New York.
Hanski, I., L. Hansson, and H. Henttonen. 1991. Specialist predators, generalist predators, and
the microtine rodent cycle. Journal of Animal Ecology 60:353-367. Hanski, I., H. Henttonen, E. Korpimaki, L. Oksanen, and P. Turchin. 2001. Small-rodent
dynamics and predation. Ecology 82:1505-1520. Harvey, D. S. 2005. Detectability of a large-bodied snake (Sistrurus c. catenatus) by time-
constrained searches. Herpetological Review 36:413-415. Ineich, I., X. Bonnet, F. Brischoux, M. Kulbicki, B. Seret, and R. Shine. 2007. Anguilliform fishes and sea kraits: neglected predators in coral-reef ecosystems. Marine Biology
151:793-802.
12

Kendall, W. L., J. D. Nichols, and J. E. Hines. 1997. Estimating temporary emigration using capture-recapture data with Pollock's robust design. Ecology 78:2248-2248.
Korpimaki, E., P. R. Brown, J. Jacob, and R. P. Pech. 2004. The puzzles of population cycles
and outbreaks of small mammals solved? Bioscience 54:1071-1079. Kotler, B. P., J. S. Brown, R. H. Slotow, W. L. Goodfriend, and M. Strauss. 1993. The influence
of snakes on the foraging behavior of gerbils. Oikos 67:309-316. Lyons, K. G., and M. W. Schwartz. 2001. Rare species loss alters ecosystem function - invasion
resistance. Ecology Letters 4:358-365. Madsen, T., and R. Shine. 2000a. Rain, fish and snakes: climatically driven population dynamics
of Arafura filesnakes in tropical Australia. Oecologia 124:208-215. Madsen, T., and R. Shine. 2000b. Silver spoons and snake body sizes: prey availability early in
life influences long-term growth rates of free-ranging pythons. Journal of Animal Ecology 69:952-958.
Madsen, T., B., Ujvari, R. Shine, and M. Olsson. 2006. Rain, rats and pythons: climate-driven
population dynamics of predators and prey in tropical Australia. Austral Ecology 31:30-37.
Mazerolle, M. J., L. L. Bailey, W. L. Kendall, J. A. Royle, S. J. Converse, and J. D. Nichols.
2007. Making great leaps forward: accounting for detectability in herpetological field studies. Journal of Herpetology 41:672-689.
Mehta, R. S. 2006. Meal size effects on antipredator behavior of hatchling trinket snakes, Elaphe
helena. Ethology 112:649-656. McLaren, B. E., and R. O. Peterson. 1994. Wolves, moose, and tree rings on Isle Royale. Science
266:1555-1558. Moore, R. D., R. A. Griffiths, C. M. O’Brien, A. Murphy, and D. Jay. 2004. Induced defenses in
an endangered amphibian in response to an introduced snake predator. Oecologia 141:139-147.
Mushinsky, H. R., and J. J. Hebrard. 1977. Food partitioning by five species of water snakes in
Louisiana. Herpetologica 33:162-166. Mushinsky, H. R., J. J. Hebrard, and D. S. Vodopich. 1982. Ontogeny of water snake foraging
ecology. Ecology 63:1624-1629. Newsome, S. D., C. Martinez del Rio, S. Bearhop, and D. L. Phillips. 2007. A niche for isotopic
ecology. Frontiers in Ecology and the Environment 5:429-435.
13

Nowak, E. M., T. C. Theimer, and G. W. Schuett. 2008. Functional and numerical responses of predators: where do vipers fit in the traditional paradigms? Biological Reviews 83:601-620.
Pace, M. L., J. J. Cole, S. R. Carpenter, and J. F. Kitchell. 1999. Trophic cascades revealed in
diverse ecosystems. Trends in Ecology & Evolution 14:483-488. Paine, R. T. 1966. Food web complexity and species diversity. American Naturalist 100:65-75. Paine, R. T. 1969. A note on trophic complexity and community stability. American Naturalist
103:91-93. Parker, W. S. and M. V. Plummer. 1987. Population Ecology, p. 253-301. In: R. A. Seigel, J. T.
Collins and S. S. Novak, (eds.), Snakes: Ecology and Evolutionary Biology. McGraw-Hill, Inc., NY.
Polis, G. A., A. L. W. Sears, G. R. Huxel, D. R. Strong, and J. Maron. 2000. When is a trophic
cascade a trophic cascade? Trends in Ecology & Evolution 15:473-475. Pollock, K. H. 1982. A capture-recapture design robust to unequal probabilities of capture.
Journal of Wildlife Management 46:757-760. Pollock, K. H., J. D. Nichols, C. Brownie, and J. E. Hines. 1990. Statistical inference for capture-
recapture experiments. Wildlife Monographs 1-97. Pough, F. H. 1980. The Advantages of ectothermy for tetrapods. American Naturalist 115:92-
111. Pringle, C. M., N. Hemphill, W. H. McDowell, A. Bednarek, and J. G. March. 1999. Linking
species and ecosystems: different biotic assemblages cause interstream differences in organic matter. Ecology 80:1860-1872.
Rodda, G. H. 1993. Where's Waldo (and the snakes)? Herpetological Review 24:44-45. Rodda, G. H., E. W. I. Campbell, T. H. Fritts, and C. S. Clark. 2005. The predictive power of
visual searching. Herpetological Review 36:259-264. Rodda, G. H. and J. A. Savidge. 2007. Biology and impacts of pacific island invasive species. 2.
Boiga irregularis, the Brown Tree Snake (Reptilia : Colubridae). Pacific Science 61:307-324.
Schmitz, O. J., P. A. Hamback, and A. P. Beckerman. 2000. Trophic cascades in terrestrial
systems: a review of the effects of carnivore removals on plants. American Naturalist 155:141-153.
14

Shine, R. 1987. Intraspecific variation in thermoregulation, movements and habitat use by Australian blacksnakes, Pseudechis porphyriacus (Elapidae). Journal of Herpetology 21:165-177.
Shine, R. and S. Shetty. 2001. Moving in two worlds: aquatic and terrestrial locomotion in sea
snakes (Laticauda colubrina, Laticaudidae). Journal of Evolutionary Biology 14:338-346.
Shine, R., and T. Madsen. 1997. Prey abundance and predator reproduction: rats and pythons on
a tropical Australian floodplain. Ecology 78:1078-1086. Soulé, M. E., D. T. Bolger, A. C. Alberts, J. Wright, M. Sorice, and S. Hill. 1988. Reconstructed
dynamics of rapid extinctions of chaparral-requiring birds in urban habitat islands. Conservation Biology 2:75-91.
Sperry, J. H. and P. J. Weatherhead. 2008. Prey-mediated effects of drought on condition and
survival of a terrestrial snake. Ecology 89:2770-2776. Sun, L., R. Shine, Z. Debi, and T. Zhengren. 2001. Biotic and abiotic influences on activity
patterns of insular pit-vipers (Gloydius shedaoensis, Viperidae) from north-eastern China. Biological Conservation 97:387-389.
Sundell, J. 2006. Experimental tests of the role of predation in the population dynamics of voles
and lemmings. Mammal Review 36:107-141. Tilman, D., J. Knops, D. Wedin, P. Reich, M. Ritchie and E. Siemann. 1997. The influence of
functional diversity and composition on ecosystem processes. Science 277:1300-1302. Turner, F. B. 1977. The dynamics of populations of squamates, crocodilians, and
rhynchocephalians. Pages 157-264 in C. Gans and D. W. Tinkle, editors. Biology of the Reptilia, vol. 7. Academic Press, New York.
Vanni, M. J., A. S. Flecker, J. M. Hood and J. L. Headworth. 2002. Stoichiometry of nutrient
recycling by vertebrates in a tropical stream: linking species identity and ecosystem processes. Ecology Letters 5:285-293.
Votier, S. C., S. Bearhop, A. MacCormick, N. Ratcliffe, and R. W. Furness. 2003. Assessing the
diet of great skuas, Catharacta skua, using five different techniques. Polar Biology 26:20-26.
White, G. C., and K. P. Burnham. 1999. Program MARK: survival estimation from populations
of marked animals. Bird Study 46:120-139. Zim, H. S., and H. M. Smith. 1953. Reptiles and Amphibians: A Guide to Familiar American
Species. Golden Press, New York.
15

CHAPTER 2
ECOLOGICAL AND METHODOLOGICAL FACTORS AFFECTING DETECTABILITY
AND POPULATION ESTIMATION IN “UNCATCHABLE” SPECIES1
1 Willson, J. D., B. D. Todd, and C. T. Winne. To be submitted to Journal of Wildlife Management.
16

INTRODUCTION
With anthropogenic impacts on global ecosystems expanding at an alarming rate,
recognition of the critical need to monitor animal populations is growing rapidly. For some
species or situations, population monitoring can be as simple as taking direct census counts.
However, in most situations census counts provide an incomplete assessment of population
status because detection probabilities are < 1 and may vary among individuals or over time
(Pollock et al. 2002, Mazerolle et al. 2007). Mark-recapture models allow for incorporation of
detectability into estimates of population size and vital rates (e.g., survivorship) and they have a
long tradition as powerful tools in wildlife management (reviewed in Pollock et al. 1990).
However, when capture, and especially recapture, rates are low, mark-recapture analyses quickly
lose power, generating imprecise parameter estimates with large associated standard errors
(Kendall et al. 1995), a factor that can hamper effective management of wildlife populations.
The application of mark-recapture techniques to particularly secretive species confronts
the researcher with a unique set of challenges. For example, parameters related to detection
probability (e.g., capture probability, recapture probability, temporary emigration) are often
considered “nuisance parameters” when studying easily observed species (Murray and Patterson
2006). When detectability is low, however, understanding variation in capture probability is
critical. Identifying and accounting for biological or methodological factors that contribute to
low or variable detection probabilities can significantly improve the accuracy and precision of
parameter estimates in secretive species (Bailey et al. 2004b, c). For example, application of
advanced mark-recapture methods recently revealed that subterranean behavior was a major
factor influencing capture probability of woodland salamanders (Bailey et al. 2004b). The
appropriate modification of mark-recapture models increased capture and recapture probabilities
17

and dramatically improved the precision of population estimates (Bailey et al. 2004b, c). Recent
advances in mark-recapture analytical methods have provided a variety of tools to researchers
interested in monitoring populations of secretive species (e.g., Pollock 1982, Norris and Pollock
1996, Kendall et al. 1997, Pledger 2000, Bailey et al. 2004a, Yang and Chao 2005). However,
few studies provide a comprehensive approach for implementing these techniques to optimize
monitoring of species with low capture probability. Here we use aquatic snakes as a case study
for applying advanced mark-recapture techniques to improve accuracy and precision of
population parameter estimates for species that are poorly understood and notoriously difficult to
sample.
Snakes are among the most secretive of all terrestrial vertebrates. Despite the fact that
snakes often occur at high densities (e.g., Fitch 1975, Godley 1980, Sun et al. 2001), numerous
reports exist where rates of snake capture per unit sampling effort are abysmally low and/or
many snakes are marked, but few, if any, are ever recaptured (Dorcas and Willson 2009). Low
recapture rates have led some authors to label snakes as generally intractable (Parker and
Plummer 1987) or to question the feasibility of using mark-recapture methods to estimate snake
population parameters (Fitch 1987, Parker and Plummer 1987, Shine 1987). Indeed, standard
errors associated with snake population size and vital rate estimates are often large (reviewed in
Parker and Plummer 1987) and in many cases, assumptions of mark-recapture models are
obviously violated. However, intrinsic intractability is only one of several potential and not
mutually exclusive phenomena that can contribute to low capture probability in snakes and other
secretive wildlife. Specifically, several factors may deflate capture or recapture probability and
result in biased or imprecise population and vital rate estimates. We discuss two of these factors
in detail below.
18

Unequal catchability - Historically, the two most popular population estimators are the
demographically closed Lincoln-Peterson index (Lincoln 1930; discussed in detail in Pollock et
al. 1990) and the demographically open Cormack-Jolly-Seber model (Seber 1982; Lebreton et al.
1992). Classically, both of these models assume constant and equal capture probability across all
individuals and sampling occasions (Pollock et al. 1990). Numerous authors have suggested that
this assumption is seldom met, as capture probability is likely to vary between demographic
groups (e.g., sexes, or sizes or reproductive classes), over time (e.g., across seasons, years, or
with environmental conditions), or based on an animal’s prior capture experience (e.g., animals
may become trap-happy or trap-shy). The mistake of assuming constant capture probability in
models when variation in the population actually exists can substantially bias parameter
estimates (Pollock et al. 1990, Bailey et al. 2004b). Evidence suggests that the behavior of many
species can lead to violation of the equal catchability assumption. For example, although few
studies have estimated capture probability in snakes, reproductive female Aspic vipers (Vipera
aspis) are much more catchable by visual encounter surveys than non-reproductive females
(Bonnet and Naulleau 1996). Also, Gragg et al. (2007) demonstrated that prey abundance has a
strong influence on capture probability of brown treesnakes (Boiga irregularis) in baited traps;
application of rodenticide reduced prey abundance and increased snake capture probability by 22
– 65%.
Temporary emigration – Temporary emigration occurs when a portion of the population
of interest is alive and present at the study site, but is unavailable for capture during a sampling
interval (Kendall et al. 1997). Temporary emigration can result from a variety of factors
including behavior (e.g., inactivity) or aspects of the sampling method or design. For example, if
sampling is not homogenous across the population, temporary emigration can result from
19

animals moving between well-sampled and under-sampled areas. Additionally, it is possible to
differentiate between two forms of temporary emigration in mark-recapture analyses: completely
random temporary emigration, in which a random portion of the population is unavailable for
capture during a given sampling occasion; and Markovian temporary emigration, in which an
individual’s likelihood of emigrating is dependent on whether it was available for capture during
the previous sample (Kendall et al. 1997). If random temporary emigration exists, but is not
accounted for, capture probability will be underestimated and the precision of parameter
estimates will be reduced (Kendall et al. 1997, Bailey et al. 2004b). The consequences of
Markovian temporary emigration on population size and survivorship estimates are complex and
have not been thoroughly explored in the literature (Kendall et al. 1997).
Recent decades have seen rapid advances in the statistical analysis of mark-recapture
data. Software packages (e.g., program MARK; White and Burnham 1999) are currently
available that allow stratified analyses, wherein individuals are divided into demographic groups
that may differ in capture probability (Mazerolle et al. 2007), and which allow the inclusion of
individual covariates that may affect capture probability (Pollock 2002). Moreover, mark-
recapture analyses have been developed that allow for incorporation of unequal catchability and
temporary emigration (Pollock et al. 1990, Kendall et al. 1997). Particularly powerful is the so-
called “robust design” analysis which uses a combination of demographically open and closed
population models to estimate both population size and survivorship with minimal violation of
model assumptions (Pollock et al. 1990, Bailey et al. 2004b). First introduced by Pollock (1982),
robust design consists of a series of widely-spaced primary sampling intervals, across which
survivorship is estimated using an open model approach. Each primary sampling interval
consists of several short secondary samples (often successive days), across which population size
20

and capture probability parameters are estimated, assuming demographic closure. Because closed
models are used within secondary sampling intervals, these models can incorporate time-varying
capture probabilities and trap responses. Perhaps most importantly, robust design models are
currently the only models that can account for the presence of temporary emigration (Kendall et
al. 1997). Despite the obvious advantage of robust design analyses, their implementation requires
careful study design. Consequently, these methods have only recently been applied to
herpetofauna (Mazerolle et al. 2007) and have not yet been applied to snake populations (Dorcas
and Willson 2009).
In this study, we evaluated factors influencing detectability of snakes using high-intensity
robust-design sampling. We sampled two species of semi-aquatic snakes at an isolated wetland
in South Carolina, USA over a one-year period, yielding > 2,500 captures of > 900 individuals.
We constructed a priori models using various combinations of time and group (sex)-varying
capture and recapture probabilities, behavioral responses to traps (i.e., “trap-happiness” or “trap-
shyness”), and temporary emigration, and ranked models for each species using Akaike’s
information criterion (AIC; Akaike 1973). We use patterns of model support and parameter
estimates from those models to interpret behavioral and methodological phenomena affecting
detectability of these notoriously secretive species.
METHODS
Study site
Ellenton Bay is an isolated Carolina bay freshwater wetland located on the Department of
Energy’s Savannah River Site in the Upper Coastal Plain of South Carolina, USA. Ellenton Bay
is characterized by relatively shallow water (generally < 1 m deep) and abundant emergent
21

vegetation, including grasses (predominantly Panicum sp.), water lilies (Nymphaea odorata), and
water-shields (Brasenia schreberi). Although water levels are variable across years (Willson et
al. 2006; Winne et al. 2006b), the bay typically holds water year-round and can achieve a surface
area of approximately 10 ha in wet years. However, during the sampling period for this study
(May 2005 – May 2006), water levels remained relatively constant with the wetland surface area
covering approximately 5.4 ha. Severe droughts have rendered Ellenton Bay dry on at least three
occasions in the past three decades, most recently during 1987–1990 and 2000–2003. Thus,
Ellenton Bay is currently devoid of fish, crayfish, and large, permanently aquatic salamanders
(Siren sp. and Amphiuma means). Importantly, Ellenton Bay is a discrete wetland isolated from
other wetlands by an extensive matrix of forested uplands; the closest large wetland is 3.2 km
away. Despite extensive sampling, only 2 of > 1,000 marked N. fasciata have been documented
moving between Ellenton Bay and other wetlands and no inter-wetland movement was detected
during the time period of this study. The closest known population of S. pygaea is 5.7 km from
Ellenton Bay and no S. pygaea have ever been documented moving between Ellenton Bay and
any other wetlands.
Study species
Although seven species of semiaquatic snakes are present at Ellenton Bay, two species
dominate captures (94% of snake captures in 2005 and 2006): the black swamp snake
(Seminatrix pygaea) and banded watersnake (Nerodia fasciata). Seminatrix pygaea is considered
the smallest semi-aquatic snake in North America (maximum total length 555 mm; Gibbons and
Dorcas 2004) and is endemic to the Coastal Plain of the Southeastern US from North Carolina to
southern Alabama. Because it is highly aquatic, seldom leaving aquatic habitats or basking above
water (Gibbons and Dorcas 2004, Winne et al. 2006b), its abundance and status across much of
22

its range are largely unknown and it is considered a species of concern in South Carolina,
Georgia, and Alabama. Nerodia fasciata is larger (maximum total length 1588 mm; Gibbons and
Dorcas 2004) and is ubiquitous in the Southeastern US, occurring in virtually all types of aquatic
habitats. This species is occasionally observed foraging along wetland margins or basking on
emergent vegetation. Both S. pygaea and N. fasciata feed primarily on amphibians at Ellenton
Bay, with S. pygaea specializing on paedomorphic mole salamanders, Ambystoma talpoideum
(Willson et al. in review). Both species are viviparous and give birth in July and August in our
region. Moreover, when the wetland holds water, virtually all mature females of both species are
reproductive (Winne et al. 2006b; J. D. Willson and C. T. Winne, Savannah River Ecology
Laboratory, unpublished data), eliminating the need to separate adult females into reproductive
and non-reproductive groups.
Capture methods
We captured snakes at Ellenton Bay from May 2005 to May 2006. Within this period, we
designed a temporal sampling regime to fit Pollock’s (1982) robust design. Robust design
requires a demographically-open study period punctuated by primary sampling intervals that
each consist of a series of secondary samples within which demographic closure is assumed. To
meet this framework, we sampled snakes monthly (primary samples) from May–September 2005
for 10 consecutive days (secondary samples), and for 6 consecutive days in the additional
primary periods of October 2005, March 2006, and April 2006.
We captured snakes using plastic minnow traps (model 700; N.A.S Incorporated,
Marblehead, Ohio), the most effective method for capturing these species in heavily-vegetated
aquatic habitats (Willson et al. 2005, Willson et al. 2008). During each primary sampling period,
we set 465 traps spaced approximately 2 m apart in a continuous transect around the aquatic
23

periphery of the wetland. We placed traps in shallow water with the uppermost portion of the
trap above water to prevent drowning of captured snakes. Although traps were not intentionally
baited, incidental capture of amphibians resulted in ‘natural baiting’ of traps (Seigel et al. 1995,
Winne 2005). We checked traps daily in the early morning and recorded each snake’s capture
location to within 10 m.
Following capture, we recorded sex (by inspection of tail morphology and/or cloacal
probing), snout-vent length (SVL), and body mass for each snake captured. We then marked
each snake with a unique code by branding ventral scales (Winne et al. 2006a) before releasing it
at its capture location on the day of capture. Importantly, robust design studies assume that all
individuals are available for capture on all sampling occasions. Because we always released
snakes on their day of capture, all individuals were available for capture within the wetland on
each day of sampling.
For simplicity, we restricted analyses to animals born before the study started. We
identified N. fasciata born during the study (2005 young-of-year) by their body size and
excluded them from analyses. Seminatrix pygaea are small enough at birth that they can escape
through the mesh of minnow traps and are therefore uncatchable until they reach ~200 mm SVL
(Willson et al. 2008), at greater than nine months of age (J. D. Willson and C. T. Winne,
unpublished data). Thus, we included all captured S. pygaea in mark-recapture analyses. Our
capture histories for both species included sex as a grouping factor to allow for testing of sex-
specific effects on the parameters of interest in the model selection procedure described below.
Mark-recapture modeling
The primary goal of our mark-recapture analysis was to examine factors affecting
detectability of two secretive aquatic snake species. We used an overall model selection
24

procedure that included the following steps: (1) we identified 8 a priori candidate models that
offered contrasting biological representations of the role of capture probability, recapture
probability, and temporary emigration in our study species, (2) we used our most highly
parameterized candidate model to evaluate the role of sex in these factors, (3) where sex effects
on parameters were supported, we modified our 8 candidate models to include sex effects for
those parameters and then compared the fit of the 8 candidate models using AIC, and (4) we ran
a subsequent post hoc analysis to investigate support for Markovian temporary emigration and its
effect on detectability parameters.
We used Program MARK (White and Burnham 1999) to construct and evaluate mark-
recapture models. We used the Huggins closed captures form of the robust design model which
conditions population estimates separate from the model likelihood and generally performs better
with sparse data resulting from small samples sizes or infrequent recaptures (Huggins 1989,
1991, L. Bailey, Patuxent Wildlife Research Center, personal communication). We assumed
capture and recapture probabilities within primary periods were constant (i.e., no day-to-day
variation among consecutive secondary samples). More general models are possible (Kendall et
al. 1997), but are heavily parameterized, often failing to computationally converge when
recapture rates are low or the number of primary periods is great. Thus, our most heavily
parameterized model included capture (p) and recapture (c) probabilities that varied among
primary periods and also allowed for a behavioral response to traps (i.e., p ≠ c) and constant
random temporary emigration (γ).
In our a priori selection of candidate models, we fixed survival rates to simplify model
structure and increase precision of estimated parameters, following the methods of Bailey et al.
(2004a). We used annual survival estimates from unpublished Cormack Jolly-Seber models of N.
25

fasciata and S. pygaea at Ellenton Bay from 2005–2008. Models found evidence for yearly
variation in survivorship but no support for sex differences in survival during 2005-2006. Yearly
survival estimates for N. fasciata and S. pygaea from 2005-2006 were 0.92 and 0.88,
respectively. Repeating our model selection procedure (see below) using conservative yearly
survival estimates of 0.50 and 0.70 for both species did not alter model rankings, demonstrating
that our results are robust to survivorship assumptions. We used month as a common
denominator between our primary periods and adjusted interval lengths in Program MARK
accordingly. Therefore, we converted yearly survival estimates into monthly rates of 0.993 for N.
fasciata and 0.989 for S. pygaea.
We first established eight candidate models (Table 2.1) to evaluate support for the
presence of temporary emigration (γ) as well as behavioral responses to traps and temporal
variation in capture and recapture probabilities among primary periods. These models were
generated a priori to test all possible parameter combinations and were organized as follows:
Models 1 and 2 were heavily parameterized, allowing for behavioral responses to traps (p
≠ c) and capture and recapture probabilities that varied across primary sampling periods. Model
1 included constant random temporary emigration whereas temporary emigration was fixed at
zero in model 2.
Models 3 and 4 allowed for behavioral responses (p ≠ c), but did not allow p and c to
vary over primary periods. Model 3 included constant random temporary emigration whereas
temporary emigration was fixed at zero in model 4.
Models 5 and 6 allowed p and c to vary over primary periods but did not include a
behavioral response to traps (p = c). Model 5 included constant random temporary emigration
whereas temporary emigration was fixed at zero in model 6.
26

Models 7 and 8 were the simplest models tested, including no behavioral response to
traps and constant p and c among primary periods. Model 7 included constant random temporary
emigration whereas temporary emigration was fixed at zero in model 8.
Possible sex differences greatly increased the number of alternative models required to
test all parameter permutations. Rather than including all sex-varying model permutations in our
primary model selection procedure, we first evaluated sex differences in detectability parameters
(p, c, and γ) by modifying the most parameterized candidate model (Model 1; see Table 2.2). Our
permutations of this model included: (1a) no sex differences in parameters; (1b) sex differences
in γ; (1c) sex differences in p and c; and (1d) sex differences in all three parameters. If there was
support for sex differences in any of these parameters, the affected parameter was allowed to
vary between the sexes when subsequently testing the 8 candidate models to evaluable
detectability (Table 2.1).
Markovian temporary emigration occurs when an animal’s probability of being available
for capture in the study area during a primary sampling period is dependent on whether it was
available for capture during the previous primary period. It is accounted for computationally by
allowing γ’ – the probability that an animal stays away from the study area given that it was a
temporary emigrant in the previous primary period, to differ from γ” – the probability that an
animal available for capture in the previous primary period becomes unavailable for capture in
the current primary period. Because the causes and consequences of Markovian temporary
emigration are poorly understood (Bailey et al. 2004b), we did not include Markovian temporary
emigration in our primary model selection procedure. Instead, we performed a post hoc analysis
comparing models with constant random temporary emigration, Markovian temporary
emigration, and temporary emigration fixed at zero for each species. Apart from temporary
27

emigration parameters, these models were otherwise identical and included constant (to ease
comparison of these parameters between model variants) but independent capture and recapture
probabilities. As in the previous model selection procedure, we included sex effects where they
were supported. This analysis allowed us to evaluate support for Markovian temporary
emigration in each species as well as examine the effects of incorporating Markovian temporary
emigration on estimates of other parameters.
RESULTS
Sixty-nine sampling days at Ellenton Bay yielded a total of 1,392 captures of 414
individual N. fasciata and 1,286 captures of 495 S. pygaea. Captures were highest in the summer
for both species (Fig. 2.1). However, N. fasciata displayed a more uniform seasonal pattern of
captures than did S. pygaea, with high capture rates from May – September and reduced capture
rates in October and March. Seminatrix pygaea displayed a more strongly unimodal pattern of
captures, with peak numbers of snakes captured in August and September and very low capture
rates in October and March. Through time, captures of new, previously uncaptured individuals
declined rapidly in both species, relative to total captures. However, despite intense sampling,
novel individuals were captured in all months and the percentage of snakes that were recaptures
plateaued at approximately 80% and 70% of total captures after the first three months of
sampling for N. fasciata and S. pygaea, respectively (Fig. 2.1).
For N. fasciata, variations of Model 1 that we used to evaluate sex effects were ranked
comparably and carried nearly equal weight with a ΔAICc of only 1.2 separating the four
models. Consequently, because there was no unequivocal support for sex differences in p, c, or γ
for N. fasciata, we did not allow parameters to vary between the sexes for this species in our
28
primary model selection procedure (Table 2.2). In contrast, for S. pygaea, model 1b (sex effects
in γ) carried the greatest support of the four variants of model 1, differing from the next best
model by a ΔAICc of 4.9. Thus, in subsequent analyses, we included a sex effect in γ for S.
pygaea (Table 2.2).
We found strong support for time-varying capture and recapture probabilities across
months for both species (Tables 3, 4). For N. fasciata, the 3 highest ranked models included
time-varying p and c and all models with constant p and c had ΔAICc’s of 100 or more greater
than the best-ranked model. For S. pygaea, all models with constant p and c were ranked last,
with AICc values at least 300 greater than the best-ranked model. Likewise, we found strong
support for behavioral responses to traps (p ≠ c) in both species, with the top two models for
each species containing a behavioral response (Tables 3, 4). Initial capture probabilities (p) for
N. fasciata were generally low (range: 0.02 – 0.05) and relatively consistent over time (Fig. 2).
This species showed a strongly positive behavioral response to traps (i.e., “trap happiness”) with
recapture probabilities (c) several times greater than p in all seasons (range: 0.06 – 0.26).
Moreover, recapture probabilities showed strong temporal variation, with high recapture
probabilities (> 0.25) in July and August. Conversely, S. pygaea exhibited strong temporal
variation in both capture and recapture probabilities, with high values of both parameters in the
summer, and near-zero values in the spring (Fig. 2.2). Maximum initial capture probability
estimates for S. pygaea were substantially greater than those for N. fasciata, approaching 0.10 in
July and August. S. pygaea exhibited a trap-happy behavioral response similar to N. fasciata,
with recapture probability always greater than initial capture probability. However, the strength
of the behavioral response varied over time in S. pygaea with a strong trap-happy response (c >>
29

p) in June and July, and nearly equal capture and recapture probabilities in August and
September.
The most strongly supported model for N. fasciata (Model 2) included time-varying
capture probability with a behavioral response and no random temporary emigration (i.e., γ fixed
at zero; Table 2.3). Thus, we conclude that there was little support for random temporary
emigration in this N. fasciata population. Conversely, we found support for random temporary
emigration in S. pygaea. The most strongly supported model for this species (Model 1) included
time-varying capture probability with a behavioral response and γ that differed between the sexes
(Table 2.4). This model was separated by a ΔAICc of at least 8.9 compared with less-supported
models. Estimates of temporary emigration parameters (γ) from this model were 0.19 ± 0.09 and
0.36 ± 0.08 for male and female S. pygaea, respectively.
We evaluated support for Markovian temporary emigration subsequent to our primary
model selection procedure by ranking models with completely random temporary emigration,
Markovian temporary emigration, or no temporary emigration (γ fixed at 0) for each species.
These analyses revealed strong support for Markovian temporary emigration in both species,
with the Markovian model ranking better by a ΔAICc of at least 80 for both species (Table 2.5).
For both species, γ” estimates were between 0.2 and 0.4, but γ’ estimates were very high (0.81 –
0.98). Incorporating Markovian temporary emigration nearly doubled initial capture probability
(p) estimates in all cases, but had little effect on recapture probabilities.
DISCUSSION
We use snakes as a case study in applying advanced mark-recapture methods to improve
accuracy and precision of population parameter estimates for notoriously difficult-to-sample
wildlife species. In both aquatic snake species we found evidence that capture and recapture
30
probabilities were not equal, suggesting that the use of standard open population models would
violate traditional modeling assumptions and yield biased estimates of population sizes and vital
rates. Specifically, we found strong support for time-varying capture and recapture probabilities
and strong trap-happy responses in both N. fasciata and S. pygaea. We also found evidence for
temporary emigration in S. pygaea and that rates of temporary emigration varied between the
sexes. Below we discuss the ecological relevance of these phenomena and the implications these
results have for estimating population parameters and vital rates of intractable or otherwise
difficult-to-study species.
Interpreting variation in detection probability parameters requires careful consideration of
factors that influence capture rates using a given sampling method. Several capture methods are
commonly used in snake population monitoring, including baited and unbaited traps, visual
searches or road censuses, and turning of natural or artificial cover objects (i.e., coverboards;
Fitch 1987, Dorcas and Willson 2009). Because each of these methods targets snakes involved in
different activities, capture rates obtained using different methods may reflect different
biological or behavioral attributes of snakes (Dorcas and Willson 2009). For example, road
censuses only detect snakes that are actively moving through habitat, presumably engaged in
activities such as foraging, mate-searching, or dispersal, whereas cover objects generally capture
snakes that are inactive or thermoregulating. Thus, seasons or environmental conditions that are
favorable for activity might produce high capture rates in road censuses but low numbers of
snakes captured under coverboards. Although our traps were not intentionally baited, they
readily accumulated aquatic prey, which were frequently consumed by snakes within traps
(Seigel et al. 1995, Winne 2005). Thus, our capture rates are primarily indicators of foraging
31

activity. This idea is supported by an experimental study conducted at Ellenton Bay that
demonstrated increased capture rates associated with presence of prey in traps (Winne 2005).
Time-varying capture probability
We found clear support for temporal variation in capture and recapture probability in
both N. fasciata and S. pygaea. This result is not unexpected; the activity patterns of many
ectotherms are strongly dependent on environmental conditions, resulting in highly seasonal
patterns of activity in temperate regions (Gibbons and Semlitsch 1987). Both N. fasciata and S.
pygaea displayed generally unimodal temporal patterns of capture and recapture probability with
rates that peaked in the summer. This pattern likely reflects foraging activity, with the highest
foraging rates occurring during months when warm air and water temperatures facilitate rapid
digestion and allow for both diurnal and nocturnal activity. Many snakes exhibit reduced
foraging during seasons that correspond with mating or gestation (Bonnet et al. 1998, Gregory et
al. 1999). We found no strong support for variation between the sexes in capture or recapture
probabilities and did not see a noticeable reduction in detectability parameters during seasons
when female snakes were pregnant. Although unexpected, this may be due in part to the fact that
females of both species feed during pregnancy (Winne et al. 2006b, J. D. Willson and C. T.
Winne unpublished data) and because the homogeneity of the aquatic habitat does not result in
spatial conflicts between foraging and thermoregulation (Winne et al. 2006b). Failure to account
for the time-varying capture probabilities we observed would result in decreased precision of
parameter estimates and apparent variation in population size among seasons.
Behavioral response to traps (trap-happiness)
Behavioral response to capture has long been appreciated as a factor that can bias
population size and vital rate estimation (Nichols et al. 1984). Trap responses have been
32

documented in a variety of animal taxa, particularly birds and small mammals (Nichols et al.
1984), but have seldom been tested for in snakes or other herpetofauna (Dorcas and Willson
2009). We found compelling evidence of behavioral responses to traps in this study; in both
species recapture probability was always greater than initial capture probability, indicating a
strong trap-happy response. This positive trap response is likely due to bait accumulation in
traps; high recapture rates presumably reflect an association of traps with feeding opportunities.
Trap happy responses are frequently associated with baited traps in other taxa (Pollock et al.
1990) and it is likely that our results apply to most situations where snakes are sampled with
baited traps. The only other study to explicitly examine trap responses in snakes noted a positive,
but ephemeral, behavioral response in brown treesnakes (Boiga irregularis) sampled using baited
arboreal funnel traps (Tyrrell et al. 2009). It is important to consider, however, that snakes
sampled using other methods may exhibit different responses. For example, it is plausible that
snakes sampled using coverboards might exhibit trap-shy responses associated with the lack of
reward (food), stress of being captured, or perhaps degradation of the microclimate under
coverboards after frequent turning. Indeed, negative trap responses have been noted in terrestrial
salamanders sampled using cover objects (Bailey et al. 2004b). In our study, N. fasciata
exhibited a stronger trap response than S. pygaea, with recapture probability up to five times
greater than initial capture probability for N. fasciata in some seasons. This disparity might
simply be due to the larger size and mobility of N. fasciata compared to S. pygaea, which could
facilitate the ability of N. fasciata to forage more widely and locate traps. Finally, capture and
recapture probabilities did not always vary synchronously in our system. For example, N.
fasciata displayed a weak behavioral response in cooler months (e.g., October, when initial
capture and recapture probabilities were comparable) but showed strong trap-happiness in the
33

summer (e.g., July and August, when recapture probability was more than five times greater than
initial capture probability). This temporal variation in trap response strongly suggests seasonal
differences in foraging rates. Because digestion is slower at lower temperatures, in cooler months
snakes may exhibit longer refractory periods between feedings, reducing their likelihood of
being captured multiple times within a sampling period.
Behavioral responses violate the equal catchability assumption of simplistic closed
population models such as the Lincoln-Peterson estimator (Lincoln 1930), resulting in
considerable bias in estimates of population size (Nichols et al. 1984, Pollock et al. 1990) or vital
rates (Hines and Nichols 2002). Specifically, failure to account for a trap-happy response leads to
underestimation of population size whereas a trap-shy response results in population size
overestimation (Nichols et al. 1984, Pollock et al. 1990). For example, the most strongly
supported model (Model 2, which included a behavioral response to traps) yielded a total N.
fasciata population estimate of 306 individuals in August. The comparable model that did not
incorporate a trap-happy response (Model 5) underestimated population size by a factor of nearly
three (111 individuals). Most studies that have used mark-recapture to estimate population size in
snakes either used open population models that cannot account for behavioral responses, or have
focused on population estimation and not reported support for, or strength of, behavioral
responses (e.g., Whiting et al. 1996, Lourdais et al. 2002). Our results demonstrate that
pronounced trap responses can exist in snakes and that these responses, if unaccounted for, can
result in strongly biased estimates of population size. We advise researchers to evaluate trap
responses in any study attempting to estimate population size for snakes or other secretive
wildlife species, especially for studies that use baited traps as a primary capture method.
Moreover, standard open population models cannot incorporate trap responses (Nichols et al.
34

1984), necessitating the use of robust design (Pollock 1982) sampling and analyses for studies
that aim to estimate population size over demographically open intervals in cases where trap
responses exist (Nichols et al. 1984).
Temporary Emigration
Temporary emigration can result from a combination of an animal’s physical location, its
behavior, and the efficacy of the capture method across habitats and behaviors. Among animal
groups, reptiles and amphibians might be particularly likely to exhibit inherent temporary
emigration due to their low energetic requirements, which allow them to undergo prolonged
periods of inactivity. Moreover, many reptile and amphibian species use habitats that are difficult
to sample (e.g., subterranean or arboreal habitats), which can lead to a large portion of the
population being unavailable for capture much of the time. Recently, several authors have
examined temporary emigration in amphibians and their results have been compelling. For
example, Bailey et al. (2004b) found high rates of temporary emigration in terrestrial
salamanders, with an average of 87% being below ground and unavailable for capture during
each primary sampling period. Temporary emigration models have also been used to evaluate
populations of amphibians that are effectively sampled only at breeding sites (e.g., Bailey et al.
2004a, Fretey et al. 2004). These models allow for estimation of the non-breeding segment of the
population that is unavailable for capture during surveys each year (Bailey et al. 2004a). Snakes,
which have low energetic demands and frequently use difficult-to-sample habitats, may also
exhibit inactivity due to digestion, pregnancy, or ecdysis. However, despite the theoretical
likelihood of temporary emigration occurring in snake populations, studies have heretofore
lacked the appropriate sampling designs (i.e., robust design) to examine this possibility.
35

We found evidence for moderate levels of temporary emigration in S. pygaea, with 19%
of males and 36% of females being unavailable for capture during a given primary sampling
period. In contrast, support for temporary emigration in N. fasciata was equivocal. This
difference between the species leads us to believe that temporary emigration in S. pygaea likely
reflects spatial distribution of the species within the wetland and reduced movement (i.e., smaller
home range) of S. pygaea in relation to N. fasciata. It is likely that limited movement of S.
pygaea due to its small body size precluded a segment of the population from encountering our
trapping array over the course of a primary sampling interval. Conversely, N. fasciata may
forage more widely, allowing all individuals to encounter traps. The difference in temporary
emigration rates between the sexes in S. pygaea could be due to more extensive movement of
males due to mate-searching behavior or to reduced movement by females during pregnancy, as
is typical of many snake species (Gibbons and Semlitsch, 1897, Gregory et al., 1987). Regardless
of its cause, more extensive movement by males would result in a smaller proportion of males
failing to encounter a trap within sampling periods. Finally, it is unlikely that behavioral
inactivity contributed strongly to temporary emigration in these species. Both N. fasciata and S.
pygaea are consistently active within the wetland during the months we sampled and regularly
enter traps and feed during ecdysis and pregnancy (Winne et al. 2006b; J. D. Willson and C. T.
Winne unpublished data). Moreover, our use of long (10-day) primary sampling periods
minimized the chance that snakes would remain inactive during the entire interval due to
digestion, at least in warmer months.
Failure to account for temporary emigration, where it exists, does not bias estimates of
overall population size in open population models (i.e., “superpopulation size” sensu Kendall et
al. 1997, Bailey et al. 2004b), but does reduce precision of vital rate estimates (Kendall et al.
36

1997, Bailey et al. 2004b). However, because closed population models assume a static
population, these models will underestimate population size when a portion of the population has
temporarily emigrated, and thus is unavailable for capture within the sampling period. Thus, our
analysis using robust design is necessary to generate precise and unbiased population size
estimates in situations where temporary emigration exists (e.g., S. pygaea). Additionally, our
post-hoc analyses revealed support for Markovian temporary emigration in both species.
Markovian temporary emigration is poorly understood, and properties of Markovian temporary
emigration models have not been thoroughly examined in the literature. Moreover, no published
methods currently exist for estimating total population (superpopulation) size in the presence of
Markovian temporary emigration. Thus, it is difficult to assess the biological phenomena that
produce Markovian temporary emigration patterns in our system, or to generalize about its
implications for population estimation. If Markovian temporary emigration proves to be a
common attribute of snake populations, snakes may provide excellent subjects for investigation
of this phenomenon. Moreover, because unaccounted Markovian temporary emigration can
deflate capture probability, accounting for it might facilitate study of snake populations by
increasing realized capture probability (Kendall et al. 1997, Bailey et al. 2004b).
Conclusion and implications
In many cases, accurately estimating population size or vital rates (e.g., survival) is a
critical step in conservation or management of wildlife populations. For example, many systems
that are used to prioritize conservation initiatives or assess species’ status, such as the U.S.
Endangered Species Act or World Conservation Union’s (IUCN) Red List, base rankings wholly
or partly on estimated population sizes and perceived population trends. Likewise, effective
management frequently demands assessing effects of experimental manipulations (e.g., habitat
37
modification or predator reduction) on survival or recruitment rates. Finally, most methods for
projecting population trends (e.g., life tables and population viability analyses) require vital rate
estimates and are highly sensitive to the precision of these values. Historically, the secretive
behavior of snakes has hindered many attempts to estimate or monitor populations, and in those
cases where mark-recapture has been executed successfully, precision is often low (Pollock and
Plummer 1987, Dorcas and Willson 2009). Thus, the status of most snake populations and
species remains unknown (Todd et al. in press). In fact, according to the 2004 IUCN Global
Species Assessment, less than 4% of the 7,833 squamate species have been evaluated, compared
with 67% of turtles, 90% of mammals, 100% of birds, and 100% of amphibians (Baillie et al.
2004), despite several authors expressing concern that reptiles are declining world-wide
(Gibbons et al. 2000, Todd et al. in press). Aquatic snakes represent a particularly imperiled
group and many of North America’s most imperiled snakes are those associated with wetland
habitats (e.g., Lake Erie watersnake, Nerodia sipedon insularum; Concho watersnake, Nerodia
harteri paucimaculata; copperbelly watersnake, Nerodia erythrogaster neglecta; Atlantic
saltmash snake, Nerodia clarkii taeniata; giant gartersnake, Thamnophis gigas; San Francisco
gartersnake, Thamnophis sirtalis teatrataenia; and eastern massassauga, Sistrurus catenatus
catenatus). Thus, developing methods that allow for accurate and precise estimation of
population size and vital rates for snakes in general, and aquatic snakes in particular, is critical.
To date, few studies have specifically addressed factors influencing capture probability of
snakes (but see Gragg et al. 2007, Tyrrell et al. 2009). This, combined with the apparently low
inherent capture probability of many species, has contributed to our general lack of knowledge
about snake population ecology (Parker and Plummer 1987, Dorcas and Willson 2009). We used
robust-design sampling to evaluate factors influencing detectability parameters of aquatic snakes
38

within an isolated population. In two snake species, we found strong evidence of several aspects
of sampling methodology and snake behavior that, if not accounted for, can result in biased or
imprecise population size or vital rate estimates. Thus, we recommend caution when analyzing
snake mark-recapture data and strongly suggest evaluating factors that influence detectability
and which may violate assumptions of some mark-recapture models. Robust design is the only
sampling method that allows for estimation of population size and vital rates over
demographically open time scales without violating assumptions about population closure or
equal capture probability. Moreover, robust design is the only mark-recapture method that allows
testing for temporary emigration. Thus, robust design sampling shows great promise for
improving the efficacy of snake mark-recapture studies. Although some snakes may be
inherently intractable, in many cases careful study design and incorporation of factors that can
artificially deflate capture and recapture probabilities can make precise monitoring of snake
populations feasible.
ACKNOWLEDGMENTS
We thank J. Whitfield Gibbons for his support and encouragement in all aspects of this
project. We appreciate Robert N. Reed and Larissa L. Bailey for providing valuable insights on
snake sampling and mark-recapture analyses. Snakes were collected under South Carolina
Department of Natural Resources Scientific Collection permits (G-05-03 and G-06-04), and
procedures used in the study were approved by the University of Georgia animal care and use
committee (A2003-10024-C2 and A2006-10069-0). This research was supported by a Graduate
Research Fellowship from the National Science Foundation to JDW and by the Environmental
Remediation Sciences Division of the Office of Biological and Environmental Research, U.S.
39

Department of Energy through Financial Assistance Award no. DE-FC09-07SR22506 to the
University of Georgia Research Foundation.
LITERATURE CITED
Akaike, H. 1973. Information theory and an extension of the maximum likelihood principle. Pages 267-281 in B. N. Petrov, andF. Cazakil, editors. Internal symposium information theory. Second edition. Akademiai Kidao,Budapest, Hungary.
Bailey, L. L., W. L. Kendall, D. R. Church, and H. M. Wilbur. 2004a. Estimating survival and
breeding probability for pond-breeding amphibians: a modified robust design. Ecology 85:2456-2466.
Bailey, L. L., T. R. Simons, and K. H. Pollock. 2004b. Estimating detection probability
parameters for plethodon salamanders using the robust capture-recapture design. Journal of Wildlife Management 68:1-13.
Bailey, L. L., T. R. Simons, and K. H. Pollock. 2004c. Comparing population size estimators for
plethodontid salamanders. Journal of Herpetology 38:370-380. Baillie J. E. M., C. Hilton-Taylor, S. N. Stuart. 2004. 2004 IUCN Red List of Threatened
Species: A Global Species Assessment. Cambridge, UK: IUCN Publications Services.
Bonnet, X., D. Bradshaw, and R. Shine. 1998. Capital versus income breeding: an ectothermic perspective. Oikos 83:333-342.
Bonnet, X., and G. Naulleau. 1996. Catchability in snakes: consequences for estimates of
breeding frequency. Canadian Journal of Zoology 74:233-239. Dorcas, M. E., and J. D. Willson. 2009. Innovative Methods for Studies of Snake Ecology and
Conservation. in S. J. Mullin, andR. A. Seigel, editors. Snakes: Applied Ecology and Conservation. Cornell University Press,Ithaca, NY. In press.
Fitch, H. S. 1975. A demographic study of the ringneck snake (Diadophis punctatus) in Kansas.
University of Kansas Museum of Natural History Miscellaneous Publications 62:1-53. Fitch, H. S. 1987. Collecting and life-history techniques. Pages 143-164 in R. A. Seigel, J. T.
Collins, andS. S. Novak, editors. Snakes: Ecology and Evolutionary Biology. McGraw-Hill, Inc.,New York.
Fretey, T., E. Cam, B. Le Garff, and J. Y. Monnat. 2004. Adult survival and temporary
emigration in the common toad. Canadian Journal of Zoology 82:859-872.
40

Gibbons, J. W., and M. E. Dorcas. 2004. North American Watersnakes: A Natural History. University of Oklahoma Press, Norman, OK.
Gibbons, J. W., D. E. Scott, T. J. Ryan, K. A. Buhlmann, T. D. Tuberville, B. S. Metts, J. L.
Greene, T. Mills, Y. Leiden, S. Poppy, and C. T. Winne. 2000. The global decline of reptiles, déjà vu amphibians. Bioscience 50:653-666.
Gibbons, J. W., and R. D. Semlitsch. 1987. Activity patterns. Pages 396-421 in R. A. Seigel, J.
T. Collins, andS. S. Novak, editors. Snakes: Ecology and Evolutionary Biology. McGraw-Hill, Inc.,New York.
Godley, J. S. 1980. Foraging ecology of the striped swamp snake, Regina alleni, in Southern
Florida. Ecological Monographs 50:411-436. Gragg, J. E., G. H. Rodda, J. A. Savidge, G. C. White, K. Dean-Bradley, and A. R. Ellingson.
2007. Response of brown treesnakes to reduction of their rodent prey. Journal of Wildlife Management 71:2311-2317.
Gregory, P. T., L. H. Crampton, and K. M. Skebo. 1999. Conflicts and interactions among
reproduction, thermoregulation and feeding in viviparous reptiles: are gravid snakes anorexic? Journal of Zoology 248:231-241.
Gregory, P. T., J. M. Macartney, and K. W. Larsen. 1987. Spatial patterns and movements. Pages
366-395 in R. A. Seigel, J. T. Collins, andS. S. Novak, editors. Snakes: Ecology and Evolutionary Biology. McGraw-Hill, Inc.,New York.
Hines, J. E., and J. D. Nichols. 2002. Investigations of potential bias in the estimation of lambda
using Pradel's (1996) model for capture-recapture data. Journal of Applied Statistics 29:573-587.
Huggins, R. M. 1989. On the statistical analysis of capture-recapture experiments. Biometrika
76:133-140. Huggins, R. M. 1991. Some practical aspects of a conditional likelihood approach to capture
experiments. Biometrics 47:725-732. Kendall, W. L., and J. D. Nichols. 1995. On the use of secondary capture-recapture samples to
estimate temporary emigration and breeding proportions. Journal of Applied Statistics 22:751-762.
Kendall, W. L., J. D. Nichols, and J. E. Hines. 1997. Estimating temporary emigration using
capture-recapture data with Pollock's robust design. Ecology 78:2248-2248. Lebreton, J. D., K. P. Burnham, J. Clobert, and D. R. Anderson. 1992. Modeling survival and
testing biological hypotheses using marked animals: a unified approach with case studies. Ecological Monographs 62:67-118.
41

Lincoln, F. C. 1930. Calculating waterfowl abundance on the basis of banding returns. U.S. Department of Agriculture Circular 118:4 pp.
Lourdais, O., X. Bonnet, D. DeNardo, and G. Naulleau. 2002. Do sex divergences in
reproductive ecophysiology translate into dimorphic demographic patterns? Population Ecology 44:241-249.
Mazerolle, M. J., L. L. Bailey, W. L. Kendall, J. A. Royle, S. J. Converse, and J. D. Nichols.
2007. Making great leaps forward: accounting for detectability in herpetological field studies. Journal of Herpetology 41:672-689.
Murray, D. L., and B. R. Patterson. 2006. Wildlife survival estimation: recent advances and
future directions. Journal of Wildlife Management 70:1499-1503. Nichols, J. D., J. E. Hines, and K. H. Pollock. 1984. Effects of permanent trap response in
capture probability on Jolly-Seber capture-recapture model estimates. Journal of Wildlife Management 48:289-294.
Norris, J. L., and K. H. Pollock. 1996. Nonparametric MLE under two closed capture recapture
models with heterogeneity. Biometrics 52:639-649. Parker, W. S., and M. V. Plummer. 1987. Population ecology. Pages 253-301 in R. A. Seigel, J.
T. Collins, andS. S. Novak, editors. Snakes: Ecology and Evolutionary Biology. McGraw-Hill, Inc.,New York.
Pledger, S. 2000. Unified maximum likelihood estimates for closed capture-recapture models
using mixtures. Biometrics 56:434-442. Pollock, K. H. 1982. A capture-recapture design robust to unequal probabilities of capture.
Journal of Wildlife Management 46:757-760. Pollock, K. H. 2002. The use of auxiliary variables in capture-recapture modelling: an overview.
Journal of Applied Statistics 29:85-102. Pollock, K. H., J. D. Nichols, C. Brownie, and J. E. Hines. 1990. Statistical inference for capture-
recapture experiments. Wildlife Monographs:1-97. Pollock, K. H., J. D. Nichols, T. R. Simons, G. L. Farnsworth, L. L. Bailey, and J. R. Sauer.
2002. Large scale wildlife monitoring studies: statistical methods for design and analysis. Environmetrics 13:105-119.
Seber, G. A. F. 1982. The estimation of animal abundance and related parameters. Second
edition. Second Edition edition. Macmillan, New York, New York, USA. Seigel, R. A., J. W. Gibbons, and T. K. Lynch. 1995. Temporal changes in reptile populations:
effects of a severe drought on aquatic snakes. Herpetologica 51:424-434.
42

Shine, R. 1987. Intraspecific variation in thermoregulation, movements and habitat use by Australian blacksnakes, Pseudechis porphyriacus (elapidae). Journal of Herpetology 21:165-177.
Sun, L. X., R. Shine, Z. Debi, and T. Zhengren. 2001. Biotic and abiotic influences on activity
patterns of insular pit-vipers (Gloydius shedaoensis, Viperidae) from north-eastern China. Biological Conservation 97:387-398.
Todd, B. D., J. D. Willson, J. W. Gibbons. in press. The global status of reptiles and causes of
their decline, In Ecotoxicology of Reptiles and Amphibians, 2nd edition. eds D.W. Sparling, G. Linder, C.A. Bishop. SETAC Press, Pensacola.
Tyrrell, C. L., M. T. Christy, G. H. Rodda, A. A. Yackel Adams, A. R. Ellingson, J. A. Savidge,
K. Dean-Bradley, and R. Bischof. 2009. Evaluation of trap capture in a geographically closed population of brown treesnakes on Guam. Journal of Applied Ecology 46:128-135.
White, G. C., and K. P. Burnham. 1999. Program MARK: survival estimation from populations
of marked animals. Bird Study 46:120-139. Whiting, M. J., J. R. Dixon, and B. D. Greene. 1996. Measuring snake activity patterns:
influence of habitat heterogeneity on catchability. Amphibia-Reptilia 17:47-54. Willson, J. D., C. T. Winne, M. E. Dorcas, and J. W. Gibbons. 2006. Post-drought responses of
semi-aquatic snakes inhabiting an isolated wetland: Insights on different strategies for persistence in a dynamic habitat. Wetlands 26:1071-1078.
Willson, J. D., C. T. Winne, and L. A. Fedewa. 2005. Unveiling escape and capture rates of
aquatic snakes and salamanders (Siren spp. and Amphiuma means) in commercial funnel traps. Journal of Freshwater Ecology 20:397-403.
Willson, J. D., C. T. Winne, and M. B. Keck. 2008. Empirical tests of biased body size
distributions in aquatic snake captures. Copeia 2008:401-408. Willson, J. D., C. T. Winne, M. A. Pilgrim, C. S. Romanek, and J. W. Gibbons. in review.
Effects of terrestrial resource pulses on trophic niche width and overlap in two sympatric aquatic snake species: a stable isotope approach. Oecologia.
Winne, C. T., J. D. Willson, K. M. Andrews, and R. N. Reed. 2006a. Efficacy of marking snakes
with disposable medical cautery units. Herpetological Review 37:52-54. Winne, C. T., J. D. Willson, and J. W. Gibbons. 2006b. Income breeding allows an aquatic snake
(Seminatrix pygaea) to reproduce normally following prolonged drought-induced aestivation. Journal of Animal Ecology 75:1352-1360.
43

Winne, C. T. 2005. Increases in capture rates of an aquatic snake (Seminatrix pygaea) using naturally baited minnow traps: evidence for aquatic funnel trapping as a measure of foraging activity. Herpetological Review 36:411-413.
Yang, H. C., and A. Chao. 2005. Modeling animals' behavioral response by Markov chain
models for capture-recapture experiments. Biometrics 61:1010-1017.
44

Table 2.1 List of a priori candidate models designed to evaluate support for temporary emigration, behavioral responses to traps, and time-varying capture probability in aquatic snakes at Ellenton Bay, South Carolina, USA. Abbreviations: γ = temporary emigration, p = initial capture probability, c = recapture probability, (.) = parameter constant, (t) = parameter varies over primary (monthly) periods.
Parameters
Temporary emigration Capture Probability
None Constant, Random
Constant time,
No trap response
Time-specific,
No trap response
Constant time,
Trap response
Time-specific,
Trap response
model γ (.) = 0 γ (.) p (.) = c (.) p (t) = c (t) p(.), c(.) p (t), c (t)
1 X† X
2 X X
3 X† X
4 X X
5 X† X
6 X X
7 X† X
8 X X
† Models 1, 3, 5, and 7 allow γ to vary between the sexes in S. pygaea. See methods for explanation.
45

Table 2.2 Variations of the most parameterized candidate model (Model 1) evaluating support for sex effects in capture probability, recapture probability, or temporary emigration in aquatic snakes at Ellenton Bay, South Carolina, USA. Parameters abbreviations: γ = temporary emigration, p = initial capture probability, c = recapture probability, (sex) = parameter different between males and females, (.) = parameter constant, (t) = parameter varies over primary (monthly) periods.
Parameters
Temporary emigration Capture Probability
Constant,
Random
Sex-
specific
Time-specific,
Trap response
Time-specific, Sex-specific,
Trap response
model γ (.) γ (sex) p (t), c (t) p (t*sex), c (t*sex)
1a X X
1b X X
1c X X
1d X X
46

Table 2.3 Model rankings for Nerodia fasciata sampled over a one year period at Ellenton Bay, South Carolina, USA. Models are listed in decreasing order of support using Akaike’s information criterion (AIC). Parameters abbreviations: γ = temporary emigration, p = initial capture probability, c = recapture probability, (.) = parameter constant, (t) = parameter varies over primary (monthly) periods.
Description
model γ p c # Parameters Δ AICc AICc Weights
2 0 (t) (t) 16 0 0.68698
1 (.) (t) (t) 17 1.5721 0.31302
5 (.) (t) (t) = p 9 106.3237 0
4 0 (.) (.) 2 115.4396 0
3 (.) (.) (.) 3 117.4484 0
7 (.) (.) (.) = p 2 265.0176 0
6 0 (t) (t) = p 8 576.3685 0
8 0 (.) (.) = p 1 782.9599 0
47
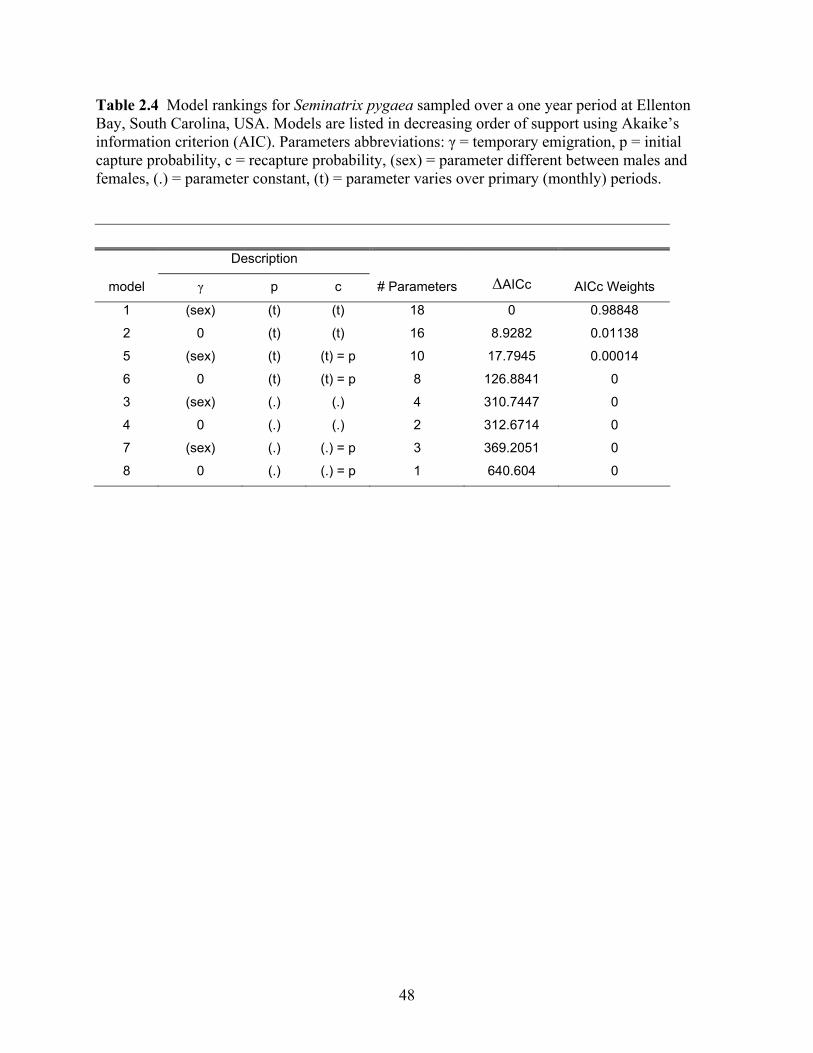
Table 2.4 Model rankings for Seminatrix pygaea sampled over a one year period at Ellenton Bay, South Carolina, USA. Models are listed in decreasing order of support using Akaike’s information criterion (AIC). Parameters abbreviations: γ = temporary emigration, p = initial capture probability, c = recapture probability, (sex) = parameter different between males and females, (.) = parameter constant, (t) = parameter varies over primary (monthly) periods.
Description
model γ p c # Parameters ΔAICc AICc Weights
1 (sex) (t) (t) 18 0 0.98848
2 0 (t) (t) 16 8.9282 0.01138
5 (sex) (t) (t) = p 10 17.7945 0.00014
6 0 (t) (t) = p 8 126.8841 0
3 (sex) (.) (.) 4 310.7447 0
4 0 (.) (.) 2 312.6714 0
7 (sex) (.) (.) = p 3 369.2051 0
8 0 (.) (.) = p 1 640.604 0
48

Table 2.5 Temporary emigration parameters (γ’’ and γ’), capture probably (p), and recapture probability (c) estimates for Nerodia fasciata and Seminatrix pygaea generated from models with no temporary emigration (TE), constant random temporary emigration, and Markovian temporary emigration. All models include constant and independent capture and recapture probabilities p(.), c(.). Sexes are allowed to differ in temporary emigration parameters for S. pygaea.
no TE random TE Markovian TE
N. fasciata Estimate SE Estimate SE Estimate SE
ΔAIC 100.66 100.66 0
γ'' 0 < 0.01 < 0.01 0.25 0.04
γ' 0.91 0.03
p 0.04 < 0.01 0.04 < 0.01 0.07 0.01
c 0.18 0.01 0.18 0.01 0.18 0.01
S. pygaea
ΔAIC 82.4 80.48 0
γ'' ♂ 0 < 0.01 < 0.01 0.22 0.04
γ' ♂ 0.98 0.04
γ'' ♀ 0 0.21 0.08 0.38 0.06
γ' ♀ 0.82 0.05
p 0.03 < 0.01 0.03 < 0.01 0.06 0.01
c 0.11 < 0.01 0.11 < 0.01 0.11 < 0.01
49

0
100
200
300
400
May June July Aug Sept Oct March April
Recent recapture
RecaptureUnmarked
0
100
200
300
400
May June July Aug Sept Oct March April
Recent recapture
RecaptureUnmarked
Seminatrix pygaea
Nerodia fasciata
Num
ber c
aptu
red
Num
ber c
aptu
red
Figure 2.1 Capture summary for N. fasciata and S. pygaea at Ellenton Bay from May 2005 to May 2006. Bars represent total numbers of snakes captured in minnow traps, broken down into naive, unmarked individuals (black bars), snakes recaptured from previous primary sampling intervals (open bars), and recent recaptures within primary sampling intervals (gray bars).
50

0.0
0.1
0.2
0.3
0.4
May June July Aug Sept Oct March April
p
c
0.0
0.1
0.2
0.3
0.4
May June July Aug Sept Oct March April
p
c
Nerodia fasciata
Seminatrix pygaea
Prob
abili
tyPr
obab
ility
Figure 2.2 Seasonal variation in capture (p) and recapture (c) probabilities for Nerodia fasciata and Seminatrix pygaea at Ellenton Bay in 2005 and 2006. Parameter estimates for each species were generated from the favored model for each species, each of which included independent, time-varying, but not sex-varying capture and recapture probabilities.
51

CHAPTER 3
EFFECTS OF TERRESTRIAL RESOURCE PULSES ON TROPHIC NICHE WIDTH AND
OVERLAP IN TWO SYMPATRIC AQUATIC SNAKE SPECIES:
A STABLE ISOTOPE APPROACH 2
2 Willson, J. D., C. T. Winne, M. A. Pilgrim, C. S. Romanek, and J. W. Gibbons. Submitted to Oikos.
52

INTRODUCTION
Historically, ecological niche theory has been one of the most pervasive and controversial
concepts in ecology. Despite its initial appeal, difficulties in defining, quantifying, and testing
niche theory caused the concept to fall into disuse in the 1980’s and 1990’s (Chase and Leibold
2003). Recently, recognition of the magnitude and diversity of effects that human activities are
having on the environment has prompted increased interest in ecosystem ecology, particularly in
understanding the role that individual species play in ecosystems (Grimm 1995, Tilman et al.
1997, Vanni et al. 2002). Quantifying the role of species within a system involves assessing both
the requirements of species from the system and the impacts of species on the system, concepts
directly related to the classical Grinnellian (Grinnell 1917) and Eltonian (Elton 1927) views of
the ecological niche, respectively (Chase and Leibold 2003). Indeed, the applicability of classical
niche theory to modern population, community, and ecosystem ecology has been recognized, and
efforts to consolidate niche theory and revise it into a theoretically sound, quantitatively useful,
and applicable theory across multiple levels of biological organization are underway (Chase and
Leibold 2003, Newsome et al. 2007).
Among the most important contributions of individual species to ecosystems is their role
in energy use, storage, and transfer within the system (e.g., Heitchmidt et al. 1996, Lyons et al.
2005). Thus, assessing the functional role of a species depends in large part on quantifying its
trophic niche width, which represents the richness and evenness of resources consumed (Bearhop
et al. 2004). Interspecific niche overlap is often interpreted in light of potential competition and
competitive exclusion or resource partitioning is often inferred from low incidence of niche
overlap (Gause 1934, Pianka 1972). Traditionally, trophic niche characteristics have been
described by either examining diet at one particular place and time or by pooling samples such
53

that niche dimensions represent an integration of dietary information over large temporal or
spatial scales (Luiselli 2006a). Such lumping or splitting of dietary information precludes the
evaluation of niche dynamics including spatial or temporal niche shifts. Although the dynamic
nature of the trophic niche has been recognized in some taxa (e.g., Nieder 1997, Roy and
Thomas 2003), the consequences of spatial and temporal variation in resource availability on
niche characteristics of sympatric species remain poorly understood, particularly in herpetofauna
(Luiselli 2006a).
Despite the apparent utility of the trophic niche as a tool for assessing community and
food web structure, assessing diet composition for many species has proven difficult (Bearhop et
al. 2004, Newsome et al. 2007). Direct dietary analyses, such as gut content or fecal analysis,
often incur bias due to difficulty in accurately measuring relative abundance of prey taxa or
failure to account for variation in digestibility and assimilation rates, potentially resulting in over
or under-representation of certain food items (Bearhop et al. 1999, Votier et al. 2003, Bearhop et
al. 2004). Recently, the examination of stable isotope composition (reported as δ13C and δ15N
values) of consumer tissues has been touted as a robust tool for quantifying trophic niche width
(Bearhop et al. 2004, Newsome et al. 2007). Indeed, Newsome et al. (2007) suggest that an
organism’s “isotopic niche,” its range of stable isotope values expressed in δ-space, is
comparable to Hutchinson’s (1957) n-dimensional hypervolume representation of the niche.
Because the isotopic composition of consumer tissues reflects assimilated diet in predictable
ways, isotopic variation within a consumer population can be used to examine niche
characteristics through space and time (Bearhop et al. 2004). For example, Inger et al. (2006)
used stable isotopes to assess seasonal shifts in diet (from marine angiosperms to terrestrial
grasses) and habitat use of wintering geese in Ireland. However, in order to use stable isotopes to
54

draw meaningful inferences about consumer trophic niche dimensions, it is necessary to quantify
spatial and temporal variation in prey availability and isotopic composition (Bearhop et al.
2004). Specifically, stable isotope composition can only be used as a measure of a consumer’s
trophic niche if prey taxa are distinct in isotope composition and show little intraspecific
variation through time and space (Bearhop et al. 2004). Consequently, despite the theoretical
advantages of using stable isotopes to assess niche dimensions, few studies have characterized
suitable study systems or employed the sampling designs necessary to implement this powerful
tool effectively.
Typically, isolated freshwater wetlands dry periodically and lack fish, yielding simplified
food webs often dominated by amphibians and reptiles (Gibbons et al. 2006). These systems
provide an ideal opportunity to use stable isotopes to evaluate consumer trophic niches. Because
amphibians receive source carbon from both terrestrial and aquatic plants, amphibian prey taxa
are likely to vary widely in their carbon isotope composition. Moreover, amphibian-dominated
systems exhibit dramatic shifts in resource availability as terrestrial adults of different species
undertake seasonal breeding migrations to wetlands. Subsequently, their larvae grow within the
wetland, and most species eventually metamorphose and emigrate into the surrounding uplands.
In this study, we examine the diets of two sympatric aquatic predators inhabiting an isolated,
fishless wetland in South Carolina; a generalist predator (the banded watersnake, Nerodia
fasciata) and a species that specializes on aquatic salamanders (the black swamp snake,
Seminatrix pygaea). We evaluate the effects of seasonal variation in amphibian prey availability
on snake trophic niche dimensions and explore the ability of stable isotopes to reveal patterns of
resource use. Specifically, we assess the isotope variance structure in our system as it relates to
variation in snake and prey isotope profiles through time, space, and ontogeny. We subsequently
55

use trophic niche width and patterns of niche overlap to infer how fluctuating resource
availability affects the potential for competitive interactions between the two species and make
recommendations about using stable isotopes as trophic niche indicators.
METHODS
Study site
Ellenton Bay is an isolated Carolina bay freshwater wetland on the Department of
Energy’s Savannah River Site in the Upper Coastal Plain of South Carolina, USA. Although
water levels are extremely variable (Willson et al. 2006, Winne et al. 2006b), the bay typically
holds water year-round and covers approximately 10 ha when full. The water is generally
shallow (< 1 m deep during 2003 - 2006) and is dominated by relatively uniform expanses of
emergent grasses (predominantly Panicum sp.) with smaller patches of water lilies (Nymphaea
odorata) and water-shields (Brasenia schreberi). Because Ellenton Bay dries periodically, it is
currently devoid of fish, crayfish, and large aquatic salamanders (Siren sp. and Amphiuma
means), making it a relatively uncomplicated aquatic ecosystem in which amphibians are the
major vertebrate prey taxa and aquatic snakes are the major vertebrate predators (Willson et al.
2006, Winne et al. 2006b).
Study species
The banded watersnake (Nerodia fasciata) and black swamp snake (Seminatrix pygaea)
are natricine watersnakes native to the southeastern United States and are the most abundant
snakes at Ellenton Bay. The black swamp snake is considered the smallest semi-aquatic snake in
North America (maximum total length 555 mm) and is highly aquatic, seldom leaving the
aquatic habitat or basking above water (Gibbons and Dorcas 2004, Winne et al. 2006b). The
56

banded watersnake is larger (maximum total length 1588 mm) and can be observed along
wetland margins or basking on emergent vegetation (Gibbons and Dorcas 2004). Both species
are viviparous and give birth in July and August in our region. Although the banded watersnake
is ubiquitous in the Southeast, occurring in virtually all aquatic habitats, the black swamp snake
is generally uncommon and patchily distributed outside of peninsular Florida. Dense populations
of black swamp snakes can occur, however, in isolated, heavily-vegetated wetlands (Gibbons
and Dorcas 2004, Winne et al. 2005). Both banded watersnakes and black swamp snakes are
known to consume a variety of aquatic prey, with a preference for fish and amphibians (Gibbons
and Dorcas 2004). Although no published study has compared the diets of these two species
where they occur in sympatry, gut content analysis suggests that both species prey predominantly
on larval and paedomorphic Ambystoma talpoideum (mole salamanders) at Ellenton Bay (Fig.
3.1). The diet of black swamp snakes, particularly, is comprised nearly exclusively of
salamanders. Banded watersnakes consume some other amphibians, including adult anurans and
tadpoles, and consume these alternative amphibian prey types most frequently in the spring (Fig.
3.1).
Snake sampling
We sampled snakes at Ellenton Bay monthly from June – October 2005 and March –
May 2006 and divided this study period into four biologically-relevant time periods (seasons) for
all analyses: Spring (March-April), Early Summer (May- June), Late Summer (July – August),
and Fall (September – October). We sampled snakes using plastic minnow traps (model 700;
N.A.S Incorporated, Marblehead, Ohio), which is the most effective way to sample secretive
semi-aquatic snakes in heavily-vegetated aquatic habitats in the Southeast (Willson et al. 2005,
2008, Winne 2005). For 5 – 10 days each month we set 465 traps approximately 2 m apart in a
57

continuous transect (~1 km long) around the periphery of the wetland. Although traps were not
intentionally baited, incidental captures of aquatic prey resulted in “natural baiting” (Winne
2005). We checked traps daily for snakes and recorded each snake’s capture location to within
20 m. At the laboratory, we recorded sex, snout-vent length (SVL, nearest mm), and body mass
(nearest 0.01 g) of each snake captured. We identified recently-ingested prey items by forced
regurgitation (Fitch, 1987) and adjusted diet proportions to account for differences in prey mass
by multiplying the number of prey items (grouped by genus or life-stage: Ambystoma
talpoideum, adult Hyla sp., adult Rana sp., Acris sp., newly-metamorphosed Rana sp., and
tadpoles) recorded in snake’s diets by the mean mass of prey within each group (generated from
a database of 530 prey collected systematically at Ellenton Bay throughout the duration of the
study). We then individually marked each snake by branding ventral scales (Winne et al. 2006a)
before releasing it at its capture location on the day of capture.
Snakes used for isotope analyses were selected to represent all size classes, both sexes, and
an even spatial distribution around the wetland. However, because of differences in catchability
among size classes (Willson at al. 2008), size distributions for black swamp snakes were not
uniform between sampling periods. During each trapping period (black swamp snake) or every
other trapping period (banded watersnake) we collected ventral scale clips from approximately
10 (black swamp snake) - 20 (banded watersnake) individuals. Scale clips consisted of one to
four ventral scales from the mid-body of the snake; however, tail clips were taken for some very
small individuals. Scale clips have been shown to reflect isotopic composition of diet in snakes
relatively soon (ca. 15 days) after a diet switch (Pilgrim 2005). Preliminary analyses have shown
that scale clips and tail clips from the same individual do not differ substantially in isotopic
composition (~ 0.20 ‰ difference; MAP, unpublished data).
58

Prey sampling
Although 24 amphibian species are known to occur at Ellenton Bay (Gibbons and
Semlitsch 1991), most either exist at such low densities or enter the aquatic habitat so
infrequently that they are likely only occasionally encountered by snakes. To conservatively
identify all potentially important prey taxa, we examined a database of 2795 diet records for
banded watersnakes and black swamp snakes at Ellenton Bay from 2003 – 2006 and recorded
any prey species that had been documented as a prey item more than once. The resulting list of
six prey species accounted for > 99% of the snake prey records: paedomorphic Ambystoma
talpoideum (mole salamander), Rana sphenocephala (southern leopard frog), R. clamitans
(bronze frog), R. catesbeiana (bullfrog), Hyla gratiosa (barking treefrog), and Acris gryllus
(southern cricket frog). Based on seasonal availability and isotopic composition (see below), we
grouped these prey taxa into six prey functional groups (aquatic salamanders, adult ranid frogs,
adult cricket frogs, adult treefrogs, recently-metamorphosed anurans, and tadpoles) for
subsequent analyses.
We assessed seasonal availability of aquatic amphibian species/life stages (aquatic
salamanders and tadpoles) while sampling for snakes. During each sampling interval, we
deployed 15 aquatic funnel traps, spaced equally around the perimeter of the wetland, as “prey
traps.” All prey captured in these traps were recorded daily and all trap contents were
subsequently removed to avoid re-counting individuals the following day. Any traps containing
snakes or large predaceous beetles (e.g., Belostomatidae or Dytiscidae) were excluded from the
analysis. We classified aquatic prey groups as “available” during a given season if capture rates
in aquatic funnel traps exceeded 0.5 animals per trap per night during that season.
59
We assessed seasonal availability of adult and newly-metamorphosed anurans (ranid
frogs, cricket frogs, treefrogs, and anuran metamorphs) using captures in a terrestrial drift fence
with pitfall and funnel traps that completely encircled Ellenton Bay from 1 Feb 2003 – 31 Jan
2004 (see Gibbons et al. 2006). To determine seasonal availability, we calculated the proportion
of captures of each anuran prey group within each season and classified groups as available
within a season if captures for a group during that season exceeded 10% of total captures for that
group across the year. Although logistical difficulties prohibited us from operating the drift fence
during years when snakes were sampled, these data represent general seasonal patterns of
amphibian breeding activity, which are highly conserved across years (Blaustein et al. 2001).
To assess stable isotope composition of prey, we collected whole-body samples bi-
monthly. In all seasons we collected prey samples one month prior to snake samples to allow for
turnover time of snake scale tissue. For each bi-monthly sample we collected a minimum of ten
salamanders and approximately five individuals from each other prey group (see results)
available within the wetland during that season. When possible, prey items were collected from
locations evenly spaced around the wetland. We fasted all prey items for 2-5 days to ensure that
gut contents were voided prior to stable isotope analyses. In addition, we recorded body length
(SVL) and mass of each captured prey item.
Stable isotope analyses
We dried snake scale clips in an oven (> 48 h at 40 - 50 oC) and prey samples in a freeze
drier until they reached a stable dry mass (5-14 days). We homogenized dried prey items using a
cryogrinder. We packaged ~1 mg of each sample (ground prey item or snake scale) into
individual 3.5 x 5 mm tin capsules. We determined carbon and nitrogen isotope ratios of samples
using a Finnigan DeltaPlus XL isotope ratio mass spectrometer at the Savannah River Ecology
60

Laboratory. We report stable carbon and nitrogen isotope compositions of samples in
conventional delta notation (Ehleringer and Osmond 1989, Ehleringer and Rundel 1989), per
mill (‰) units. We used laboratory (DORM-2, TURK) standards to calibrate samples to
international standards (PDB and atmospheric air) for carbon and nitrogen, respectively.
Statistical analyses
Because young snakes are known to display residual maternal isotope signatures (Pilgrim
2007), we excluded the bottom 18% of the body size distribution of each snake species (black
swamp snakes < 200 mm SVL, n = 7; banded watersnakes < 283 mm SVL; n = 12) from all
analyses to avoid confounding diet-derived isotope signals with maternal signals. We tested for
ontogenetic shifts in isotopic composition within each snake species and prey group using linear
regressions of isotope values on SVL. For taxa (prey or snake) that did not exhibit significant
ontogenetic shifts, we used Analyses of Variance (ANOVA) to compare isotope values among
groups (i.e., spatial location, season). For taxa that displayed significant ontogenetic shifts in
isotope ratios, we used Analysis of Covariance (ANCOVA), with SVL as the covariate. We
tested for spatial variation in isotopic composition for the three prey groups (salamanders, ranid
frogs, and cricket frogs) for which we had sufficient spatial distribution and sample size to
subdivide samples within the wetland. We systematically divided the wetland into five equal
sections and used ANOVA or ANCOVA to test for differences in isotope values among sections.
Isotopic mixing models (e.g., Phillips 2001, Harvey et al. 2002, Phillips et al. 2005,
Carleton et al. 2008) have recently gained popularity as quantitative tools for explicitly
translating consumer isotopic composition into diet. Although the mixing model approach is
well-suited for investigations seeking to quantify the proportional contributions of multiple prey
types to consumer diets, most mixing models assume that the consumers are in isotopic
61

equilibrium with their diets and model performance varies greatly depending on the trophic shift
values use to parameterize the model. Because we suspect that snake tissues in this system are
seldom in isotopic equilibrium with diet (see discussion) and data on trophic shift values for
snake tissues are limited (but see Pilgrim 2005, Pilgrim 2007, Pilgrim et al., in review) we did
not take a mixing models approach in this study. Alternatively, we adopt the approach of
Bearhop et al. (2004) and use patterns of variation in stable isotope composition to gain insight
on trophic niche characteristics for the two snake species.
We assessed overall trophic niche width of black swamp snakes and banded watersnakes
by comparing variance of isotope values for each species, pooled across all seasons, using
Levene’s Test for Homogeneity of Variances, and assessed seasonal variation by comparing
isotope values among seasons for each snake species using ANOVA or ANCOVA. We
recognized statistical significance at α = 0.05 and performed all statistical analyses using the
STATISTICA software package (StatSoft, Inc. Tulsa, OK, USA 1998). We examined all data
prior to each analysis and if statistical assumptions were not met we used appropriate
transformations or non-parametric tests.
RESULTS
Prey availability and isotope composition
Availability of prey groups varied dramatically across seasons (Fig. 3.2). Some groups
were abundant year-round (e.g., salamanders, Fig. 3.2a; ranid frogs, Fig. 3.2b), while other
groups were available during some seasons, but were virtually absent during other seasons (e.g.,
tadpoles, Fig. 3.2a; treefrogs, Fig. 3.2b). Generally, prey richness was high in the spring and
early summer (Fig. 3.2). This was primarily due to spring arrival of breeding anurans (e.g.,
62

treefrogs and cricket frogs) and the presence of their larvae (tadpoles) in the aquatic habitat. In
contrast, prey richness was low in the summer and fall, when the primary available prey was
salamanders (Fig. 3.2). Although available year-round, abundance of Ranid frogs peaked in the
fall (Fig. 3.2).
To use isotope composition of consumer tissues as a meaningful measure of trophic niche
width, prey must differ isotopically from each other and isotope signatures of prey must remain
relatively stable over time (Bearhop et al. 2004). Plots of δ15N and δ13C values for all prey
sampled (n=128) revealed that the six amphibian functional groups varied substantially in
isotopic composition (Fig. 3.3). Tadpoles were most depleted in 13C, whereas adult anurans
(ranid frogs, cricket frogs, and treefrogs) were most enriched in 13C. Adult anurans separated
along the δ15N axis, generally reflecting the degree of terrestrial habitat use; the most aquatic
taxa (ranid frogs) were enriched in δ15N relative to more terrestrial taxa (treefrogs).
The isotopic composition of prey functional groups showed little change across seasons
(Fig. 3.4). For example, ranid frogs showed relatively high isotope values in all seasons, whereas
tadpoles showed low isotope values whenever they were available. Thus, most temporal
variation in the overall isotope profile of prey at Ellenton Bay was due to seasonal changes in
prey availability rather than shifts in isotopic composition within prey taxa.
Salamanders exhibited a strong positive ontogenetic shift in nitrogen isotope composition
(r2 =0.501; p < 0.001). We did not detect any other significant ontogenetic shifts in prey isotope
values (all p > 0.05). We found no spatial variation in isotopic composition of salamanders (δ13C,
Kruskal-Wallace Test, H4,55 = 5.43, p = 0.246; δ15N, ANCOVA, F4,49 = 1.42, p = 0.242), adult
ranid frogs (δ13C, ANOVA, F4,21 = 0.27, p = 0.894; δ15N, ANOVA, F4,21 = 1.07, p = 0.394), or
adult cricket frogs (δ13C, ANCOVA, F4,18 = 0.69, p = 0.611, one outlier excluded; δ15N,
63

ANOVA, F4,19 = 1.24, p = 0.329). Thus, prey location within the wetland was not an important
source of variation in prey isotopic composition at Ellenton Bay.
Variation in snake isotope composition
Overall, mean isotope values were similar for banded watersnakes (-26.0 ‰ δ13C and 7.5
‰ δ15N) and black swamp snakes (-26.2 ‰ δ13C and 7.4 ‰ δ15N; Fig. 3.5). These values were
slightly enriched in both carbon and nitrogen compared to mean isotope values of salamanders
(Fig. 3.4). Although mean isotope values were not statistically different between banded
watersnakes and black swamp snakes (Kruskal-Wallace Test: δ15N, χ2 = 1.90, p = 0.17; δ13C, χ2
= 1.15, p < 0.28), the species displayed strong differences in isotopic variance (Levene’s Test for
Homogeneity of Variances: δ15N, F1,172 = 41.10, p < 0.01; δ13C, F1,172 = 21.53, p < 0.01).
Specifically, although the range of δ15N values exhibited by the two snake species was similar (5
to 9 ‰), banded watersnakes displayed a much broader range of δ13C values (-28.5 to -23.5 ‰)
than black swamp snakes (-27.5 to -25 ‰). Thus, overall, stable isotope composition suggests
that banded watersnakes have a broader trophic niche than black swamp snakes (Fig. 3.5).
Banded watersnakes exhibited no ontogenetic shift in carbon isotope composition (Fig.
3.6a; r2 = 0.01; p = 0.579) but displayed a slight positive ontogenetic shift in nitrogen isotope
values (Fig. 3.6b; r2 =0.45; p = 0.034). Black swamp snakes displayed highly significant
ontogenetic shifts in both carbon (Fig. 3.6c; r2 = 0.15; p < 0.001) and nitrogen (Fig. 3.6d; r2 =
0.78; p < 0.001) isotope values, with larger individuals depleted in δ13C and enriched in δ15N
relative to smaller individuals. R2 values demonstrate that for black swamp snakes, 78% of the
variation in nitrogen isotope composition was explained by body size (SVL), compared to only
45% for banded watersnakes. The ontogenetic shifts in black swamp snakes generally paralleled
64

those seen in salamanders (Fig. 3.6e, 3.6f), but were enriched slightly in both δ13C and δ15N (Fig.
3.6c-f).
Black swamp snakes exhibited no significant seasonal variation in carbon (Fig. 3.6c;
ANCOVA, F3,70 = 1.38, p = 0.256) or nitrogen (Fig. 3.6d; Scheirer-Ray-Hare test, F3,91 = 0.49, p
= 0.693) isotope values. Banded watersnakes exhibited significant seasonal variation in carbon
values (Fig. 3.6a; ANOVA, F3,94 = 15.41, p < 0.001) but not in nitrogen isotope values (Fig.
3.6b; Scheirer-Ray-Hare test, F3,94 = 0.47, p = 0.701). The strongest seasonal shift in banded
watersnake isotope values occurred between spring and early summer, when snakes showed
strong enrichment in 13C and a trend towards depletion in 15N (Fig. 3.7). This shift occurred
concomitant with availability of adult anurans, particularly treefrogs, which are enriched in 13C
and depleted in 15N relative to other prey taxa (Fig. 3.4). Following early summer, banded
watersnakes showed gradual depletion in 13C through the late summer and fall (Fig. 3.7).
Seasonal shifts in prey consumption by banded watersnake resulted in shifts in overlap of
isotope values between the two snake species (Fig. 3.4). In fall and spring the range of isotope
values exhibited by banded watersnakes nearly completely encompassed those of black swamp
snakes, whereas in summer the species exhibited reduced overlap in isotope values (Fig. 3.4).
DISCUSSION
Stable isotopes have been proposed as useful tools for examining consumer trophic
niches (Bearhop et al. 2004, Newsome et al. 2007), but their use requires relatively simplified
food webs with prey sources that differ in isotopic composition. Additionally, researchers must
account for (or exclude) variation in isotopic composition within prey taxa across time and
space. Recent studies have demonstrated that spatial variation in the isotopic composition of prey
65

taxa can occur on relatively small spatial scales (e.g., < 1 km; Pilgrim 2005), seriously
complicating the use of stable isotopes as diet indicators. Because we did not detect spatial
variation or strong temporal variation in prey isotopic composition within our small, well-
defined study site, we were able to exclude the confounding effects of spatial and temporal
heterogeneity in baseline isotope sources from our analyses. Thus, this system offered an ideal
opportunity to explore the ability of stable isotopes to reveal patterns of resource use and trophic
niche characteristics of sympatric predators in response to seasonally-fluctuating prey resources.
The black swamp snake (a dietary specialist)
Although black swamp snakes are known to feed on a variety of aquatic prey (Gibbons
and Dorcas 2004), gut content analysis suggests they feed primarily on larval and paedomorphic
mole salamanders at Ellenton Bay (Fig. 3.1). The low variance we observed in black swamp
snake isotope values supports this conclusion, suggesting that this species exhibits a more
specialized diet than the banded watersnake at Ellenton Bay. Black swamp snakes displayed
strong positive ontogenetic shifts in δ15N and δ13C values with high r2 values, indicating that
much of the isotopic variation in black swamp snakes was attributable to ontogenetic shifts in
isotope ratios. Ontogenetic shits in black swamp snakes paralleled salamander ontogenetic shifts,
but were isotopically heavier, likely representing trophic enrichment (i.e., preferential
incorporation of heavy diet isotopes into consumer tissues; Egger and Jones 2000). Thus, a
logical explanation for the presence of an ontogenetic shift in black swamp snake isotope values
is an ontogenetic shift in the size of salamanders consumed. Snakes are well-known to be gape
limited predators and ontogenetic shifts in prey size have been demonstrated in many species
(Mushinsky 1987, Arnold 1993), including some dietary specialists (e.g., Voris and Moffett
1981, Godley 1984). Due to the small body size of black swamp snakes, small individuals are
66

likely gape-limited in the size of salamanders that they can consume, with only the largest snakes
able to ingest full-grown salamanders. A specialized diet of salamanders also is consistent with
the lack of seasonal variation in black swamp snake isotope values, as salamanders are one of the
few prey taxa that are abundant at Ellenton Bay year-round.
The banded watersnake (a dietary generalist)
Banded watersnakes are well-known to consume a variety of aquatic and semi-aquatic
prey (Gibbons and Dorcas 2004) and displayed the most diverse diet of five sympatric natracine
watersnake species in Louisiana (Mushinsky and Hebrard 1977). Gut content analyses suggested
that banded watersnakes at Ellenton Bay feed primarily on aquatic salamanders but also consume
tadpoles and adult anurans (Fig. 3.1). The results of our stable isotope analyses generally support
this conclusion by demonstrating that banded watersnakes have a broader (more generalist)
trophic niche than black swamp snakes with little ontogenetic variation in isotope values.
Moreover, our isotope analyses revealed that unlike black swamp snakes, banded watersnakes
showed strong seasonal shifts in isotopic composition. The most notable shifts in watersnakes
occurred between spring and early summer. Between these seasons, banded watersnakes tissues
displayed enrichment in 13C and a trend towards depletion in 15N. This pattern is consistent with
banded watersnakes feeding on seasonally-available treefrogs and cricket frogs (which are
enriched in 13C and depleted in 15N relative to other prey) in the spring. Although gut content
analysis suggested that banded watersnakes also feed on tadpoles in the spring and early summer
(Fig. 3.1), our stable isotope analyses do not support this conclusion. Tadpoles are depleted in
both 13C and depleted in 15N relative to other prey. The only time period when watersnakes
displayed simultaneous depletion in both 13C and depleted in 15N was between late summer and
fall (Fig. 3.7), when tadpoles are rare within the wetland (Fig. 3.2). Thus, the patterns of stable
67

isotope composition suggest that our gut content analysis over-represented tadpoles and
potentially under-represented treefrogs within snake diets. This likely reflects the fact that the gut
content analysis was based on recently-ingested prey taken from snakes captured in aquatic traps.
Snakes may have consumed larger numbers of aquatic tadpoles and smaller numbers of
terrestrial/arboreal treefrogs within aquatic traps than they would at large within the wetland.
Interestingly, despite the fact that we sampled prey one month prior to snakes within
seasons, isotopic shifts still appeared to be lagged relative to prey. After exhibiting the most
enriched 13C values in the early summer, banded watersnakes exhibited gradual depletion in 13C
through the late summer and fall. This lag corroborates evidence that although snake scale tissue
can register diet isotopic composition on relatively short time scales (ca. 15 days, Pilgrim 2005,
Pilgrim et al. in review), substantially longer amounts of time may be necessary for scale tissue
to equilibrate with diet (e.g., 1.5 – 5.5 months, Pilgrim 2005, Pilgrim et al. in review). The
lagged, short-term shifts we observed in snake isotope values suggest that isotopic mixing
models (Phillips 2001, Phillips et al. 2005), which assume consumer tissue is in isotopic
equilibrium with diet, should be used with caution, especially when attempting to use isotopes to
assess diet over short time-scales.
Seasonal shifts in diet have been observed in other snake species and may allow
generalist species to capitalize on seasonally abundant or particularly energy rich prey types
during periods of high energetic demand. For example, during spring, female viperine snakes
(Natrix maura) switch diets from fish to frogs, which are more abundant and are higher in energy
content than other prey types (Santos et al. 2000). Because the timing of this dietary shift
coincides with vitellogenesis, prey switching is presumably a strategy that offsets costs of
reproduction in viperine snakes (Santos et al. 2000). Although our results suggest that the timing
68

of diet shifts in banded watersnakes largely reflected seasonal prey availability, the inclusion of
large adult anurans during the spring months may be important for fueling reproduction as this
corresponds with the timing of vitellogenesis for this species (JDW and CTW, unpublished data).
Effects of resource pulses on niche overlap
The role of interspecific competition in structuring snake communities remains
unresolved (Reichenbach and Dalrymple 1980), but limited interspecific dietary overlap in many
snake communities has prompted some researchers to conclude that snakes, particularly
temperate aquatic species, partition prey resources (Mushinsky 1987, Luiselli 2006b). However,
few studies have examined diet overlap between sympatric snake species within ecosystems with
strong temporal variation in prey availability. Our results suggest that seasonal prey availability
may be extremely important in shaping food webs. At Ellenton Bay, pulsed, seasonal movements
of amphibian prey caused shifts in the trophic niche of the banded watersnake, leading to
seasonal shifts in niche overlap that ranged from complete overlap between the species to only
partial overlap. Thus, in situations where resources are limiting for much of the year, brief
seasonal resource pulses could alter the potential for competitive interactions by reducing niche
overlap between potential competitors. This, in turn, may promote community complexity by
relaxing competitive exclusion during some seasons (Hutchinson 1959). Seasonal relaxation of
competition pressure may be particularly advantageous for ectotherms, which can survive long
periods when food is scarce (or competition is high) because of their exceptionally low metabolic
costs, relative to endotherms (Pough 1980). For such species, short periods of relaxed
competition due to seasonal prey abundance or seasonal availability of alternative prey taxa may
allow individuals and/or species to persist within the community.
69

Implications for niche assessment
Evaluation of an organism’s trophic niche can provide valuable insight into a species’
role within its community and ecosystem (Chase and Leibold 2003). Unfortunately, because diet
is generally examined either at one specific location and time or samples are pooled across wide
geographic and temporal scales, niche dimensions often represent either instantaneous snapshots
or averages over space and time, respectively (Luiselli 2006a). Stable isotopes have been
proposed as useful niche indicators because isotopic composition represents an integration of diet
over time and isotope analyses do not suffer from biases inherent in traditional gut or fecal
content analyses (Bearhop et al. 2004). The characteristics of our study site and species allowed
us to use a combination of traditional gut content analysis and stable isotope techniques to
examine the trophic niches of banded watersnakes and black swamp snakes over differing spatial
and temporal scales. In general, the two methods yielded similar conclusions (i.e., that both
species feed largely on salamanders, but banded watersnakes consume some seasonally-available
adult anurans in during the spring). However, our isotope analyses suggested that the gut content
analysis may have over-represented tadpoles as diet items in branded watersnakes, likely due to
consumption of tadpoles by snakes within aquatic traps. Thus, a combination of the two methods
was necessary to produce a comprehensive understanding of diet in these snake species.
Additionally, our conclusions about niche dimensions, position, and overlap between species
were dependent on the scale at which data were assessed. When samples were pooled, banded
watersnakes displayed broader niche width than black swamp snakes and the niches of the two
species overlapped nearly completely. However, when samples were assessed within seasons, we
found that niche overlap during some seasons was minimal. Thus, when assessing niche
70

dimensions, and especially in interspecific comparisons, careful delineation of the temporal and
spatial scale across which the niche is being assessed can be critical.
ACKNOWLEDGEMENTS
Assistance in collecting and processing snakes was provided by Sarah E. DuRant, Brian D.
Todd, and especially Andrew M. Durso and Evan A. Eskew. Sarah E. DuRant provided
insightful advice on data analysis and writing. Heather Brant aided in stable isotope analyses. All
snakes and amphibians were collected under South Carolina Department of Natural Resources
Scientific Collection permits (G-05-03 and G-06-04). This material is based upon work
supported by the Department of Energy under Award Number DE-FC09-07SR22506 to the
University of Georgia Research Foundation. Support for JDW was provided by a Graduate
Research Fellowship from the National Science Foundation.
LITERATURE CITED
Arnold, S. J. 1993. Foraging theory and prey-size-predator-size relations in snakes. – In: Seigel, R. A. et al. (eds.), Snakes: ecology and behavior. McGraw-Hill, Inc., pp. 87-115.
Bearhop, S. et al. 2004. Determining trophic niche width: a novel approach using stable isotope
analysis. – J. Anim. Ecol. 73: 1007-1012 Bearhop, S. et al. 1999. Stable isotopes indicate the extent of freshwater feeding by cormorants
Phalacrocorax carbo shot at inland fisheries in England. – J. Appl. Ecol. 41: 675-688. Blaustein, A. R. et al. 2001. Amphibian breeding and climate change. – Conserv. Biol. 15: 1804-
1809. Carleton, S. A. et al. 2008. Should we use one-, or multi-compartment models to describe C-13
incorporation into animal tissues? – Rapid Commun. Mass. Sp. 22: 3008-3014. Chase, J. M. and Leibold, M. A. 2003. Ecological niches: linking classical and contemporary
approaches. – Univ. of Chicago Press.
71

Eggers, T. and Jones, T. H. 2000. You are what you eat…or are you? – Trends in Ecol. Evol. 15: 265-266.
Ehleringer, J. R. and Osmond, C. B. 1989. Stable isotopes. – In: Pearcy, R. W. et al. (eds.), Plant physiological ecology: field methods and instrumentation. Chapman and Hall, pp. 281-300.
Ehleringer, J. R. and Rundel, P. W. 1989. – In: Rundel, P. W. et al. (eds.), Stable isotopes in
ecological research. Springer-Verlag, pp. 1-16. Elton, C. 1927. Animal ecology. – Sidgwick and Jackson. Fitch, H. S. 1987. Collecting and life-history techniques. – In: Seigel, R. A. et al. (eds.), Snakes:
ecology and evolutionary biology. Blackburn Press, pp. 143-164. Gause, G. F. 1934. The struggle for existence. – Williams Wilkins, reprinted by Hafner
Publishing Company, 1969. Gibbons, J. W. and Dorcas, M. E. 2004. North American watersnakes: a natural history. – Univ.
of Oklahoma Press. Gibbons, J. W. and Semlitsch, R. D. 1991. Guide to the reptiles and amphibians of the Savannah
River Site. – Univ. of Georgia Press. Gibbons, J. W. et al. 2006. Remarkable amphibian biomass and abundance in an isolated
wetland: implications for wetland conservation. – Conserv. Biol. 20: 1457-1465. Godley, J. S. et al. 1984. Estimating prey size and number in crayfish-eating snakes, genus
Regina. – Herpetologica 40: 82-88. Grimm, N. B. 1995. Why link species and ecosystems? A perspective from ecosystem ecology. –
In: Jones, C. G. and Lawton, J. H. (eds.), Linking species and ecosystems. Chapman & Hall, pp. 5-15.
Grinnell, J. 1917. The niche-relationships of the California thrasher. – Auk 34: 427-433. Harvey, C. J. et al. 2002. Using bioenergetic models to predict stable isotope ratios in fishes. –
Can. J. Fish. and Aquat. Sci. 59: 115-124. Heitschmidt, R. K. et al. 1996. Ecosystems, sustainability, and animal agriculture. – J. Anim. Sci.
74: 1395-1405. Hutchinson, G. E. 1957. Concluding remarks. – Cold Spring Harbor Symposium for Quantitative
Biology 22: 415-27.
72

Hutchinson, G. E. 1959. Homage to Santa Rosalia or why are there so many kinds of animals. – Am. Nat. 93: 145-159.
Inger, R. et al. 2006. Temporal and intrapopulation variation in prey choice of wintering geese
determined by stable isotope analysis. – J. Anim. Ecol. 75: 1190-1200. Luiselli, L. 2006a. Food niche overlap between sympatric potential competitors increases with
habitat alteration at different trophic levels in rain-forest reptiles (omnivorous tortoises and carnivorous vipers). – J. Trop. Ecol. 22: 695-704.
Luiselli, L. 2006b. Resource partitioning and interspecific competition in snakes: the search for
general geographical and guild patterns. – Oikos 114: 193-211. Lyons, K. G. et al. 2005. Rare species and ecosystem functioning. – Conserv. Biol. 19: 1019-
1024. Mushinsky, H. R. 1987. Foraging ecology. – In: Seigel, R. A. et al. (eds.), Snakes: ecology and
evolutionary biology. – Blackburn Press, pp. 302-321. Mushinsky, H. R. and Hebrard, J. J. 1977. Food partitioning by five species of water snakes in
Louisiana. – Herpetologica 33: 162-166. Newsome, S. D. et al. 2007. A niche for isotopic ecology. – Front. Ecol. Environ. 5: 429-435. Nieder, J. 1997. Seasonal variation in feeding patterns and food niche overlap in the
Mediterranean blennies Scartella cristata, Parablennius pilicornis and Lipophrys trigloides (Pisces: Blenniidae). – Mar. Ecol. 18: 227-237.
Phillips, D. L. 2001. Mixing models in analyses of diet using multiple stable isotopes: a critique.
– Oecologia 127: 166-170. Phillips, D. L. et al. 2005. Combining sources in stable isotope mixing models: alternative
methods. – Oecologia 144: 520-527. Pianka, E. R. 1972. r and K selection or b and d selection. – Am. Nat. 106: 581-588. Pilgrim, M. A. 2005. Linking microgeographic variation in pigmy rattlesnake (Sistrurus
miliarius) life history and demography with diet composition: a stable isotope approach. – Ph.D. dissertation, Univ. of Arkansas.
Pilgrim, M. A. 2007. Expression of maternal isotopes in offspring: implications for interpreting
ontogenetic shifts in isotopic composition of consumer tissues. – Isot. Environ. Healt. S. 43: 155-163.
Pilgrim, M. A. et al. In review. Stable isotopes as diet indicators: effect of diet isotopic
composition on scale tissue isotopic composition in two reptile species. – Copeia.
73
Pough, F. H. 1980. Advantages of ectothermy for tetrapods. – Am. Nat. 115: 92-112. Reichenbach, N. G. and Dalrymple, G. H. 1980. On the criteria and evidence for interspecific
competition in snakes. – J. Herpetol. 14: 409-412. Roy, D. B. and Thomas, J. A. 2003. Seasonal variation in the niche, habitat availability and
population fluctuations of a bivoltine thermophilous insect near its range margin. – Oecologia 134: 439-444.
Santos, X. et al. 2000. Variation in the diet of the viperine snake Natrix maura in relation to prey
availability. – Ecography 23: 185-192. Tilman, D. et al. 1997. The influence of functional diversity and composition on ecosystem
processes. – Science 277: 1300-1302. Vanni, M. J. et al. 2002. Stoichiometry of nutrient recycling by vertebrates in a tropical stream:
linking species identity and ecosystem processes. – Ecol. Lett. 5: 285-293. Voris, H. K. and Moffett, M. W. 1981. Size and proportion relationships between the beaked sea
snake and its prey. – Biotropica 13: 15-19. Votier, S. C. et al. 2003. Assessing the diet of great skuas, Cathatacta skua, using five different
techniques. – Polar Biol. 26: 20-26. Willson, J. D. et al. 2006. Post-drought responses of semi-aquatic snakes inhabiting an isolated
wetland: insights on different strategies for persistence in a dynamic habitat. – Wetlands 26: 1071-1078.
Willson, J. D. et al. 2005. Unveiling escape and capture rates of aquatic snakes and salamanders
(Siren spp. and Amphiuma means) in commercial funnel traps. – J. Freshwater Ecol. 20: 397-403.
Willson, J. D. et al. 2008. Empirical tests of biased body size distributions in aquatic snake
captures. – Copeia 2008: 401-408. Winne, C. T. 2005. Increases in capture rates of an aquatic snake (Seminatrix pygaea) using
naturally baited minnow traps: evidence for aquatic funnel trapping as a measure of foraging activity. – Herpetol. Rev. 36: 411-413.
Winne, C. T. et al. 2005. Population structure, body size, and seasonal activity of black swamp
snakes (Seminatrix pygaea). – Southeast Nat. 4: 1-14. Winne, C. T. et al. 2006a. Efficacy of marking snakes with disposable medical cautery units. –
Herpetol. Rev. 37: 52-54.
74

Winne, C. T. et al. 2006b. Income breeding allows an aquatic snake (Seminatrix pygaea) to reproduce normally following prolonged drought-induced aestivation. – J. Anim. Ecol. 75: 1352-1360.
75

0.0
0.2
0.4
0.6
0.8
1.0
1.2
0.0
0.2
0.4
0.6
0.8
1.0
Prop
ortio
n of
die
t
b)
a)
Ambystoma talpoideum
Tadpoles Adult anurans
Banded watersnakeBlack swamp snake
SalamandersTadpoles
Anurans
Spring Early Summer
Late Summer
Fall
Figure 3.1 Diet composition of banded watersnakes and black swamp snakes at Ellenton Bay from May 2005 to April 2006 based on gut-content analysis. Overall diet composition for banded watersnakes and black swamp snakes (a) was derived from a total of 1,504 and 518 diet items, respectively, adjusted to account for differences in prey mass (see methods). Seasonal diet composition for banded watersnakes (b) demonstrates seasonal diet shifts in this species.
Prop
ortio
n of
die
t
76

0
1
2
3
4
5
March - April May - June July - August Sept - Oct
Salamanders
Tadpoles
0.0
0.3
0.5
0.8
1.0
March - April May - June July - August Sept - Oct
Treefrogs
Cricket frogs
Ranid frogs
Anuran metamorphs
Mea
n #
per t
rap
nigh
tPr
opor
tion
of c
aptu
res
a) Aquatic trap captures
b) Drift fence captures
Spring Early Summer Late Summer Fall
Figure 3.2 Seasonal availability of amphibian prey at Ellenton Bay including (a) fully aquatic groups (salamanders and tadpoles) and (b) migratory adult and metamorphic anurans. Bars in (b) represent the proportion of individuals within each prey taxon that were captured in a given season. Dashed lines represent thresholds above which prey were judged as available during a given season.
77

2
3
4
5
6
7
-32 -30 -28 -26 -24
δ13C
δ15 N
Tadpoles (n=10)
Salamanders (n=55)
Anuran metamorphs (n=3)
Ranid frogs (n=26)
Cricket frogs (n=24)
Treefrogs (n=10)
Figure 3.3 Average δ13C and δ15N values (± 1 SE) of amphibian prey captured at Ellenton Bay in 2005 and 2006. Prey were grouped into six functional groups based on similarity of isotopic composition and seasonal availability.
78

Figure 3.4 Seasonal shifts in isotopic composition of amphibian prey (shaded bubbles) and snakes (○ black swamp snakes, ● banded watersnakes) at Ellenton Bay. Shaded bubbles represent mean (± 1 SE) prey isotope values. Note that isotope values of prey groups are similar across seasons, thus shifts in overall seasonal isotope profiles are a result of shifts in availability, not shifts in isotope values within prey groups.
79

5
6
7
8
9
10
-29 -28 -27 -26 -25 -24 -23
5
6
7
8
9
10
-29 -28 -27 -26 -25 -24 -23
a) Banded watersnake
b) Black swamp snake
δ13C
δ15 N
δ15 N
Figure 3.5 Overall trophic niche breadth of (a) banded watersnakes and (b) black swamp snakes at Ellenton Bay as indicated by carbon and nitrogen isotope composition.
80

-31
-29
-27
-25
-23
0 20 40 604
5
6
7
8
9
10
0 20 40 60
5
6
7
8
9
10
0 100 200 300 400 500-29
-28
-27
-26
-25
-24
-23
0 100 200 300 400 500
-29
-28
-27
-26
-25
-24
-23
0 200 400 600 8005
6
7
8
9
10
0 200 400 600 800
c) Black swamp snake
a) Banded watersnake
d) Black swamp snake
b) Banded watersnake
δ13 C
δ15 N
Overall r2 = 0.010 p = 0.579
Season (ANOVA) p < 0.001
Overall r2 = 0.453 p = 0.034
Season (NP ANCOVA) p = 0.701
δ13 C
δ15 N
Overall r2 = 0.154 p < 0.001
Season (ANCOVA) p = 0.256
Overall r2 = 0.781 p < 0.001
Season (NP ANCOVA) p = 0.693
SVL SVL
δ13 C
δ15 N
f) Salamanderse) Salamanders
Overall r2 = 0.517 p < 0.001
Overall r2 = 0.034 p < 0.096
Figure 3.6 Ontogenetic and seasonal shifts in δ13C and δ15N values for banded watersnakes (a and b) and black swamp snakes (c and d). Symbols in a-d denote seasons: (X) spring, (●) early summer, (○) late summer, (▲) fall. Ontogenetic shifts in aquatic salamanders (e and f) are provided for comparison with black swamp snakes. Seasonal shifts in δ13C and δ15N values were evaluated using ANOVA, ANCOVA, or non-parametric ANCOVA (Scheirer-Ray-Hare test).
81

6.5
7.0
7.5
8.0
-27.0 -26.5 -26.0 -25.5 -25.0 -24.5
δ13C
δ15 N
Early Summer
Late Summer
Spring
Fall
Figure 3.7 Seasonal shifts (arrows) in mean carbon and nitrogen isotope values (±1 SE) for banded watersnakes at Ellenton Bay.
82

CHAPTER 4
THE PREDATORY ROLE OF AQUATIC SNAKES WITHIN AN ISOLATED WETLAND
ECOSYSTEM: A CASE STUDY IN EVALUATING FUNCTIONAL ROLES OF
CLANDESTINE SPECIES3
3 Willson, J. D. and C. T. Winne. To be submitted to Biological Conservation.
83

INTRODUCTION
Recent recognition of the magnitude and diversity of effects that human activities are
having on the environment has prompted increased interest in ecosystem ecology and
particularly in understanding the role of species or functional groups within ecosystems (Grimm,
1995; Lyons and Schwartz, 2001; Vanni et al., 2002). Among functional groups of organisms,
particular attention has been paid to predators, and their contributions to ecosystem function have
been demonstrated in a variety of terrestrial and aquatic systems (e.g., Paine, 1966, 1969; Estes
and Palmisano, 1974; Soulé et al., 1988; McLaren and Peterson, 1994). In many cases, predators
have an important direct role in regulating prey populations (Erlinge et al., 1984; Hanski et al.,
2001; Korpimaki et al., 2004; Sundell, 2006), and predators can indirectly influence abundance
of lower trophic levels through trophic cascades (Pace et al., 1999; Polis et al., 2000; Schmitz et
al., 2000). So-called “keystone” predators can play roles disproportionate to their abundance by
maintaining biodiversity through preferential predation on competitively-superior prey taxa
(Paine, 1966, 1969; Fauth, 1999). Although major groups of predatory vertebrates include
mammals, birds, fish, amphibians, and reptiles, the roles of herpetofauna as predators remain
largely unaddressed. Particularly, although all snakes are strictly carnivorous and many species
are top predators within food webs (Greene, 1997), our knowledge of the roles of snakes within
ecosystems is extremely limited.
Often, a necessary first step in evaluating the functional roles of species within
ecosystems is to determine the abundance of each species or functional group. Thus, we have
gleaned much of our knowledge of the effects of community structure on ecosystem processes
from studies of species groups that are relatively easy to survey, such as grassland plants (e.g.,
Tilman et al., 1997) or sessile invertebrates (e.g., Paine, 1966, 1969; Pringle et al., 1999).
84
Conversely, the functional roles of secretive species remain largely unknown and in many cases
infrequent observation prompts a perception of rarity and unimportance. Reptiles and amphibians
are well-known for their cryptic habits (Gibbons et al., 2000; Mazerolle et al., 2007), leading
some to refer to herpetofauna as “hidden biodiversity” (Gibbons, 1997). In recent years,
however, field and analytical techniques have been developed that allow researchers to
accurately estimate population density of species with low recapture probability (Dorcas and
Willson, 2009; Willson et al., in review-b). For example, removal sampling has demonstrated
that terrestrial reptiles and amphibians can occur at extraordinarily high densities (e.g., 52,800
lizards per ha, Rodda et al., 2001; 18,000 salamanders per ha, Petranka and Murray, 2001).
Likewise, Kendall et al. (1997) developed statistical techniques for estimating rates of temporary
emigration (individuals becoming unavailable for capture during some sampling intervals) based
on data collected using Pollock’s robust design (Pollock, 1982; Pollock et al., 1990). Bailey et al.
(2004) used Kendall’s methods to determine that during any given sampling interval 58 - 87% of
terrestrial salamanders were unavailable for capture due to temporary use of subterranean
habitats. Application of these techniques to amphibians has prompted a dramatic increase in the
number of studies examining the role of amphibians as ecosystems components (e.g., Burton and
Likens, 1975a; Davic and Welsh, 2004; Gibbons et al., 2006; Regester et al., 2006).
Among the terrestrial vertebrates, snakes are perhaps the most difficult large taxonomic
group to study due to their cryptic behavior and low or sporadic activity patterns (Parker and
Plummer, 1987, Dorcas and Willson, 2009). Although they are seldom conspicuous, snakes can
exist at high densities compared to other terrestrial vertebrate predators (Pough, 1980). For
example, aquatic snakes (e.g., striped crayfish snake, Regina alleni, and black swamp snake,
Seminatrix pygaea) reach densities of > 1200 ha-1 in aquatic habitats in Florida (Godley, 1980),
85

and ringneck snakes (Diadophis punctatus) reach densities of > 1000 ha-1 in Kansas (Fitch,
1975). Even large-bodied terrestrial snakes can reach high densities in suitable habitat (e.g., 274
ha-1; Gloydius shedaoensis – Shedao pit-viper; Sun et al., 2001). At such high densities, snakes
may be among the most important predators in many ecosystems. However, our overall
knowledge of the effects of snake predation on prey populations is minimal, at best (Nowak et
al., 2008).
In this study we use aquatic snakes within an isolated, fishless wetland as a case study for
examining the functional role of secretive predators within ecosystems. We use high-intensity
sampling and advanced capture-recapture methodology to estimate population density of two
species of aquatic snakes within Ellenton Bay, an isolated 5.4-ha wetland located in South
Carolina, USA. We assess snake diets using direct examination of gut contents and stable isotope
analyses. We then couple field growth rate measurements obtained from mark-recapture with
data on mass conversion efficiency obtained in the laboratory to estimate prey consumption by
snakes at Ellenton Bay over a one year period. Our results shed light on the important predatory
role of snakes within this ecosystem and underscore the need to consider snakes in initiatives
aimed at preserving overall ecosystem integrity.
METHODS
Study site
Ellenton Bay is an isolated Carolina bay freshwater wetland located on the Department of
Energy’s Savannah River Site (SRS) in the Upper Coastal Plain of South Carolina, USA.
Ellenton Bay is characterized by shallow water (generally < 1 m deep) and relatively
homogeneous expanses of emergent vegetation, including grasses (predominantly Panicum sp.),
86

water lilies (Nymphaea odorata), and water-shields (Brasenia schreberi). Although water levels
are variable across years (Willson et al., 2006; Winne et al., 2006b), the bay typically holds
water year-round and water levels remained relatively constant during the sampling period for
this study (May 2005 – May 2006). The aquatic surface area of Ellenton Bay, measured in June
2006, was 5.37 ha. Due to periodic drying of the wetland during extreme droughts, Ellenton Bay
is devoid of fish, crayfish, and large, permanently aquatic salamanders (Siren spp. and
Amphiuma means), providing a relatively simple food web dominated by amphibians and
reptiles. Importantly, Ellenton Bay is isolated from other wetlands by an extensive matrix of
forested upland habitats, and represents a well-defined population of aquatic snakes (Willson et
al., in review-a).
Study species
Although seven species of semiaquatic snakes are present at Ellenton Bay, two species
dominate the community (94% of snake captures in 2005 and 2006): the banded watersnake
(Nerodia fasciata) and black swamp snake (Seminatrix pygaea). Nerodia fasciata is larger
(maximum total length 1588 mm; Gibbons and Dorcas, 2004) and is abundant and ubiquitous in
the southeastern US, occurring in virtually all aquatic habitats. Seminatrix pygaea is considered
the smallest semi-aquatic snake in North America (maximum total length 555 mm; Gibbons and
Dorcas, 2004) and is endemic to the southeastern Coastal Plain from North Carolina to southern
Alabama. Because S. pygaea is highly aquatic, seldom leaving aquatic habitats or basking above
water (Gibbons and Dorcas, 2004; Winne et al., 2006b), it is seldom seen and its abundance and
status across much of its range is largely unknown. Both S. pygaea and N. fasciata feed primarily
on amphibians at Ellenton Bay, with S. pygaea specializing on paedomorphic mole salamanders,
Ambystoma talpoideum (Willson et al., in review-a). Both species are viviparous and give birth
87

in July and August in the region. Moreover, when the wetland holds water, virtually all mature
females of both species are reproductive (Winne et al., 2006b; unpublished data), negating the
need to separate adult females into reproductive and non-reproductive groups.
Snake sampling
We captured snakes at Ellenton Bay over one year from May 2005 to May 2006. Within
this period, we designed a temporal pattern of sampling to fit Pollock’s (1982) robust design
(Pollock et al., 1990). Robust design analysis requires widely-spaced primary sampling intervals,
each consisting of a series of short secondary samples, across which population closure is
assumed. To conform to this framework, we sampled snakes monthly (primary samples) from
May–September 2005 for 10 consecutive days (secondary samples), and for 6 consecutive days
in the additional primary periods of October 2005, March 2006, and April 2006.
We captured snakes using plastic aquatic funnel traps (i.e., minnow traps; model 700;
N.A.S Incorporated, Marblehead, Ohio), which is the most effective method for capturing these
species (Willson et al., 2005, 2008). During each sampling period, we set 465 traps, spaced
approximately 2 m apart in a continuous transect around the aquatic periphery of the wetland.
Although traps were not intentionally baited, incidental captures of aquatic prey resulted in
‘natural baiting’ of traps (Seigel et al., 1995; Winne, 2005). We checked traps daily in the early
morning and recorded each snake’s capture location to within 10 m.
Following capture, we recorded sex (by inspection of tail morphology and/or cloacal
probing), snout-vent length (SVL to the nearest mm), tail length, and body mass (to the nearest
0.01 g using an electronic balance) for each snake captured. We identified recently-ingested prey
items by forced regurgitation (Fitch, 1987) up to once per year per individual snake. We
excluded from all analyses the mass for any snake with palpable prey that was not regurgitated
88

(i.e., snake body masses that were inflated due to prey). We then marked each snake with a
unique code by branding ventral scales (Winne et al., 2006a) before releasing it at its capture
location on the day of capture.
Estimating the predatory role of snakes
We estimated the functional role of snakes at Ellenton Bay in terms of prey consumption
using data on snake density, diet, growth rate, and mass conversion efficiency. Because male and
female snakes differed in body sizes, growth rates, and capture probability parameters, we
divided snakes into three demographic groups per species for all analyses: males, females, and
juveniles. Nerodia fasciata grow rapidly at this site, often reaching mature size in their second
summer (Winne, 2008), therefore, the juvenile group for N. fasciata included only young born
during the study (2005 young-of-year). Seminatrix pygaea are too small at birth to capture in
aquatic traps (Willson et al., 2008) and are likely too small to contribute appreciably to overall
vertebrate prey consumption. Thus, the juvenile group for S. pygaea included individuals from
the size at which they become catchable in traps (ca. 200 mm SVL, 5 g; Willson et al., 2008) to
the minimum size recorded for a reproductive female in this population (259 mm SVL). We
assessed snake population sizes, diets, and growth rates on a seasonal basis, by subdividing the
year into four biologically-relevant periods – late spring (May – June), summer (July – August),
fall / winter (September – February), and early spring (March – April).
Snake density
We used the robust design format in Program MARK (White and Burnham, 1999) to
construct and evaluate mark-recapture models. Robust design uses a combination of open and
closed population models to estimate population size and other parameters with minimal
violation of model assumptions (Pollock et al., 1990; Bailey et al., 2004). In a previous study, we
89

systematically evaluated factors influencing snake capture probability parameters using this
dataset (Willson et al., in review-b). Here, we based our population estimation procedure on
models that garnered the most support in that study. For both species, capture and recapture
probabilities were independent (allowing for a behavioral response to traps) and were allowed to
vary over time across primary samples. Based on the results of Willson et al. (in review–b),
capture and recapture probabilities were set equal for male and female N. fasciata and for all
demographic groups of S. pygaea. However, because unpublished models showed strong support
for low capture and recapture probabilities in juvenile N. fasciata, we allowed these parameters
to vary from adult parameters in this study. We held survivorship constant over time but allowed
it to vary between demographic groups. As there was little support for random temporary
emigration in N. fasciata (Willson et al., in review-b), we fixed the temporary emigration
parameter at zero. For S. pygaea, however, we allowed constant random temporary emigration
that differed between groups. To avoid nonsensical population estimates from months with few
recaptures, we estimated population size for both species across each of the four seasons
examined in this study (i.e., we held population size constant across months within seasons).
Additionally, because neonate N. fasciata had particularly low recapture rates, we estimated their
population size over only one interval, fall – spring. Because S. pygaea exhibited temporary
emigration, we estimated the total population size (superpopulation size, sensu Kendall et al.,
1997; Bailey et al., 2004) for each demographic group of S. pygaea at Ellenton Bay during each
season (Nsuper, season) by correcting our population estimate (sampled population, Nsampled,season) for
temporary emigration (TEseason) using the formula:
Nsuper,season = ( )season
seasonsampled,
TE -1N
90
Snake diet
We evaluated diet composition of N. fasciata and S. pygaea at Ellenton Bay in 2005 –
2006 directly using gut contents manually regurgitated from snakes. We corrected diet
proportions for prey mass by multiplying the number of prey items (grouped by genus or life-
stage: Ambystoma, adult Hyla, adult Rana, Acris, newly-metamorphosed Rana, and tadpoles)
recorded in snake’s diets by the mean mass of prey within each group (generated from a database
of 530 prey collected systematically at Ellenton Bay throughout the duration of the study).
Subsequently, prey genera were lumped into functional groups (A. talpoideum, post-
metamorphic anurans, and tadpoles) to ease visualization in figures. Our assessment of diet is
supported by published studies that used stable isotope analyses to assess diet in this population
(Willson et al., in review-a).
Snake growth and mass conversion efficiency
We calculated seasonal, group-specific growth rates for N. fasciata and S. pygaea at
Ellenton Bay in 2005 – 2006 from individual mark-recapture data. We calculated growth (mass)
for each individual snake for which we had an accurate mass (i.e., a mass without recently
ingested prey) for at least two primary periods (months) within a season. We calculated growth
rate by subtracting the latter mass from the earlier mass and dividing the result by the number of
days elapsed between captures. Because captures of S. pygaea were very low in March we
assessed growth in this species over only three intervals (late spring, summer, and fall – early
spring). Due to females giving birth or snakes losing some mass over winter, snake demographic
groups occasionally exhibited negative seasonal growth rates. In such cases, we set growth rate
at zero for the season, rather than using a negative prey consumption value.
91

We determined mass conversion effeciency of N. fasciata feeding on amphibians in the
laboratory. We used 21 captive-born N. fasciata (from mothers collected from uncontaminated
sites on the SRS), representing a variety of ages (up to 2.5 yrs. old) and sizes (8.03 – 68.26 g) fed
a diet of frozen A. talpoideum collected from Ellenton Bay. Snakes were maintained communally
in 75.7 L aquaria, lined with paper towels, and provided with large water bowls, hide boxes, and
basking lamps (12L:12D photoperiod) to provide thermal gradients within cages. Every 6 d
snakes were offered 35% of their body mass in A. talpoideum. After 48 d, snakes were fasted to
ensure post-absorptivity (6 d) and massed. Mass conversion effeciency was determined by
dividing the mass gained over the course of the experiment by the cumulative wet mass of prey
consumed. We tested for potential confounding effects of body size (starting mass) or feeding
frequency (# of meals consumed and total mass consumed) on mass conversion efficiency using
linear regressions and effects of sex on mass conversion efficiency using analysis of covariance
(ANCOVA; independent variable = sex, dependent variable = mass gained, covariate = mass
consumed, one individual excluded because sex was not recorded). Data were log transformed
when statistical assumptions were not met and we recognized statistical significance at P ≤ 0.05.
We performed all statistical analyses using STATISTICA for Windows software package
(StatSoft, Inc. Tulsa, OK, USA 1998). Because S. pygaea often refused to eat previously frozen
prey, we did not determine mass conversion for this species. Instead, we assumed that mass
conversion efficiencies were the same for both species. Likewise, as A. talpoideum comprised
the vast majority of the diet of both species (see results) we used mass conversion effeciency
values for A. talpoideum to assess consumption of other amphibian prey types (anurans and
tadpoles). If invalid, these assumptions had minimal effect our results, given the dominance of A.
92

talpoideum in snakes’ diets, the close taxonomic affinity of all prey types, and relatively minor
contribution of S. pygaea to overall prey consumption.
Prey consumption by snakes
We calculated prey consumption for each snake demographic group within each season
using the formula:
Prey consumed (g group-1 season-1) = ××
MCENG grouptgroupt ,, days in season
where:
Nt,group = population size during each season
Gt,group = mean seasonal growth rate (g snake-1 day-1)
MCE = mass conversion efficiency (g gained g consumed-1)
We then summed prey consumption across seasons and demographic groups to calculate
total mass of prey consumed by snakes at Ellenton Bay during the one-year study period. We
converted prey mass into energetic equivalents using published values of energy content for A.
talpoideum (4.06 kJ/g wet mass; Willson and Hopkins, in review). We subdivided prey
consumption among prey taxa by multiplying the total prey mass consumed within each season
by the proportion of diet (by mass) represented by each prey taxon within that season. We then
divided the total mass of each prey taxon consumed by the mean mass of prey within that group
to estimate the number of individual prey consumed.
RESULTS
Snake sampling
Sixty-eight days of sampling yielded 1,571 captures of 528 individual N. fasciata and
1,286 captures of 495 individual S. pygaea (Fig. 4.1). Both species exhibited seasonal shifts in
93

activity with the highest rate of captures in August and September and relatively few captures in
October and March. Recapture rates increased rapidly in N. fasciata over the first three months
of study, reaching 87% in July. However, recapture rates dropped again in the late summer, due
to birth of neonates in August. Captures of S. pygaea were more strongly seasonal than those of
N. fasciata, with very few captures in October, March and April. Although recapture rates also
increased through 2005 in S. pygaea, reaching a maximum of 75% in September, a similar
number of novel individuals were captured in each period from June to September. This pattern
likely reflects a relatively constant influx of juvenile recruits as they grow large enough to
become catchable in aquatic traps (Willson et al., 2008).
Snake density
Despite strong seasonal variation in numbers of snakes captured (Fig. 4.2), estimated
population sizes for adult N. fasciata and S. pygaea were strikingly constant over time (Fig. 4.3).
Population size estimates of adult N. fasciata ranged from 220 – 270 individuals across seasons,
whereas those for adult S. pygaea ranged from 214 – 322 individuals. Total estimated population
size of N. fasciata nearly doubled in the fall, when females gave birth and an estimated 222
neonates were added to the local population. Population size of juvenile S. pygaea was also more
variable than that of adults, with a peak of 109 individuals in summer. Peak total population sizes
of both species occurred in the fall, at which time an estimated 919 snakes inhabited Ellenton
Bay, corresponding to a population density of 171 snakes ha-1 of wetland habitat. The mean
standing biomass of snakes at Ellenton Bay in 2005 – 2006 was 7.77 kg ha-1.
Snake diet
Our sampling yielded a total of 1,504 and 518 diet items for N. fasciata and S. pygaea,
respectively. The diet of both species was dominated by larval and paedomorphic A. talpoideum
94

(Fig. 4.4a). Seminatrix pygaea, particularly, specialized on A. talpoideum, with only 7 diet
records representing other taxa (Acris and newly-metamorphosed Rana and Hyla). Nerodia
fasciata, conversely, included tadpoles and post-metamorphic anurans in their diet in somewhat
higher numbers (91 and 47 records, respectively). The inclusion of these alternative prey taxa in
the diet of N. fasciata was seasonal, with most anurans and tadpoles taken in the spring (Fig.
4.4b). Our assessment of snake diet is supported by comparisons of stable isotope composition of
snakes and prey at Ellenton Bay (Willson et al., in review-a). Stable isotope profiles suggested
that both N. fasciata and S. pygaea feed largely on A. talpoideum but that N. fasciata show
seasonal diet shifts, feeding on seasonally-available adult anurans and tadpoles in the spring.
Snake growth and mass conversion efficiency
Nerodia fasciata showed strong seasonal variation in growth but adult females grew
faster than adult males and juveniles in all seasons except fall/winter (Fig. 4.5a). Growth rates
were highest (approaching 1 g mass gain per day in females) in late spring and were also high for
females in early spring. Growth over the winter (Sept – March) was low in all groups. Due to
their smaller body size, S. pygaea exhibited much lower absolute growth rates than N. fasciata
(Fig. 4.5b). Female S. pygaea grew rapidly from fall through late spring, but lost mass in
summer, due to parturition. Juvenile and adult male S. pygaea exhibited slow growth in spring
and summer and negligible growth over the winter.
On average, N. fasciata gained 0.16 ± 0.01 g of body mass per g (wet mass) of A.
talpoideum consumed in the laboratory. We detected no confounding effects of body size (Linear
Regression; R2 = 0.03, P = 0.21), sex (ANCOVA; F1,17 = 1.02, P = 0.33), number of meals
consumed (Linear Regression; R2 = 0.02, P = 0.58), or total mass consumed (Linear Regression;
95

R2 = 0.09, P = 0.13) on mass conversion efficiency. Thus, we used 0.16 as our mass conversion
efficiency value for all snakes in the study.
Prey consumption by snakes
We estimated that snakes consumed 213.35 kg of amphibian prey at Ellenton Bay from
May 2005 – April 2006 (Table 4.1). Prey consumption was highest in the late spring, primarily
as a result of high consumption rates by female N. fasciata during this season. Generally, N.
fasciata contributed much more substantially to total prey consumption than S. pygaea, and
females consumed more prey biomass than males in both species. When translated into energetic
equivalents, we estimated that snakes consumed a total of 866,186 kJ of amphibian prey at
Ellenton Bay over one year. This represents 161,301 kJ ha-1 of energy flow from amphibians into
aquatic snakes within the Ellenton Bay food web.
When examined taxonomically, larval and paedomorphic A. talpoideum accounted for the
majority (90%) of individual prey consumed, and we estimated that together N. fasciata and S.
pygaea consumed a total of over 53,000 individual A. talpoideum over the course of the year
(Table 4.2). Although they represented a relatively minor component of the diet of both snake
species, tadpoles and adult anurans were also consumed in large numbers: 3,493 and 1,777
individuals, respectively.
DISCUSSION
Because snakes are often encountered with a frequency that belies their true abundance
they have historically been undervalued as ecosystem components. For example, in the 1953
edition of the Golden Guide to Reptiles and Amphibians, Zim and Smith (1953) stated: “as a
group they [reptiles] are neither ‘good’ nor ‘bad,’ but are interesting and unusual, although of
96

minor importance. If they should all disappear, it would not make much difference one way or
the other.” Nearly all snakes are incredibly secretive, which not only leads to the perception that
they are rare, and perhaps of minor importance, but also impedes attempts to quantify snake
density, a necessary first step in examining their functional roles. In many situations, snake
captures are extremely low, sometimes prompting researches to resort to unstandardized or
haphazard sampling methods (Dorcas and Willson, 2009). Even when sampling is standardized,
counts, capture rates, or other indices of relative abundance are often poor indicators of snake
density. For example, research on brown treesnakes (Boiga irregularis) has found no correlation
between visual counts and population density estimated by mark-recapture (Rodda et al., 2005)
and has demonstrated that snake surveys may suffer from observer bias (Rodda, 1993). Further,
snakes have been shown to exhibit time and group (e.g., sex or age) varying capture and
recapture probabilities, behavioral responses to traps (i.e., “trap-happiness” or “trap-shyness”),
and temporary emigration (Tyrrell et al., in press; Willson et al., in review-b), all of which can
bias estimates of population size. Due in part to the difficulties associated with accurately
measuring snake density, the role that snakes play as predators in most ecosystems remains
unknown.
Perhaps the most dramatic evidence of the potential impacts of snake predation arises
from situations where non-native snakes have been introduced into naive ecosystems. For
example, the accidental introduction of B. irregularis into the island nation of Guam has had
catastrophic effects on native birds, bats, and lizards, driving several species to extinction and
leaving large portions of the island devoid of native vertebrate fauna, save a few small lizard
species (Fritts and Rodda, 1998; Rodda and Savage, 2007). Many cases where native snake
abundance or prey consumption has been quantified are difficult to interpret because the area
97

occupied by foraging snakes is unknown. For example, although many snakes are easily captured
as they enter and exit communal hibernacula (e.g., Gregory, 1984; Diller and Wallace, 2002;
Weatherhead et al., 2002; Shine and Mason, 2004), it is difficult to translate den-based
population estimates into snake densities across the surrounding landscape. In an analogous
example, Ineich et al. (2007) estimated that approximately 1,400 sea kraits (Laticauda
laticaudata and L. saintgironsi) which congregated at on 6-ha islet in the South Pacific
consumed over 36,000 eels (972 kg) from surrounding reefs annually. Although their results
clearly show that snakes are important predators in coral reef ecosystems, this predation pressure
may have been spread over as much as 130 ha of surrounding coral reef habitat (Ineich et al.,
2007). Conversely, in his classic study of the foraging ecology of the striped swamp snake
(Regina alleni), Godley (1980) used systematic sampling to estimate snake density and prey
consumption over a quantified area within an unusually uniform habitat: mats of exotic water
hyacinth (Eichhorina crassipes) in Florida. Godley (1980) employed a dredging method to
systematically sample R. alleni and their primary prey, crayfish and odonate naiads. Godley
(1980) calculated that the mean standing crop of R. alleni was 30.79 kg ha-1 (1289 snakes ha-1)
and using data on diet, foraging rate, and prey density, estimated that snakes consumed 9.6% and
90.7% of the standing biomass of crayfish and odonate naiads, respectively, during the fall, when
snake feeding rates were highest.
Using intensive, systematic sampling and advanced mark-recapture analyses, we
estimated that, at peak density, 171 snakes ha-1 inhabited Ellenton Bay, corresponding to a mean
standing biomass of 7.77 kg ha-1. Further, we calculated that snakes at Ellenton Bay consumed
over 200 kg of amphibians annually, translating into > 150,000 kJ ha-1 of energy flow from
secondary to tertiary consumers within the food web. Ellenton Bay has been protected from
98

major anthropogenic disturbances for over five decades (Gibbons et al., 2006) and arguably
ranks among the most pristine native wetlands where long-term herpetological research has been
conducted. Thus, our data extend Godley’s (1980) findings from highly-altered aquatic systems
(exotic water hyacinth communities) by demonstrating that snakes also exist at high densities
and are important predators in native aquatic ecosystems in the southeastern United States. An
estimated 10,000 – 20,000 Carolina bay wetlands exist in the southeastern United States (Sharitz,
2003) and snakes likely serve similarly important roles in these and many other aquatic habitats
throughout temperate and tropical regions of the world.
The high snakes densities we observed, and their important contributions to biomass and
energy flow, may be due in part to characteristics of the amphibian prey community at Ellenton
Bay. As ectotherms, amphibians are efficient at transfer of biomass and energy through food
webs and occur at high densities in many ecosystems (Davic and Welsh, 2004). In an often cited
example, Burton and Likens (1975a, 1975b) demonstrated that the average biomass of five
species of salamanders was 1.77 kg ha-1 (2950 individuals ha-1) in a New Hampshire forest. This
biomass was more than twice that of birds during the breeding season and comparable to the
biomass of small mammals. Fishless, often seasonal wetlands have received much attention as
hotspots of amphibian biodiversity and productivity (Semlitch and Bodie, 1998; Gibbons et al.,
2006). Further, aquatic salamanders may represent ideal prey for aquatic snakes because their
elongate morphology allows snakes to consume large meals with minor impediments to post-
prandial crawling speed (Willson & Hopkins, in review). Thus, it is likely that high abundances
of amphibians, particularly A. talpoideum, are important in fueling high snake biomass within
Ellenton Bay and other fishless wetlands.
99

Despite the fact that snakes at Ellenton Bay preyed primarily on A. talpoideum, we
estimated that snakes also consumed nearly 1,800 anurans over the course of the year. Many of
these anurans are primarily terrestrial as adults and are consumed by aquatic snakes only when
they return to wetlands for short periods to breed (Todd and Winne, 2006; Willson et al., in
review-a). Thus, we estimate that snakes are responsible for the transfer of over 15 kg of
biomass, or 61,000 kJ of energy per year from surrounding uplands to Ellenton Bay. Because
many amphibians are semi-aquatic and exhibit complex life histories they have been proposed to
serve important roles in energy and nutrient flow between aquatic and terrestrial systems (Davic
and Welsh, 2004; Gibbons et al., 2006; Regester et al., 2006). Our results demonstrate that
snakes may also play a key role in linking terrestrial and aquatic habitats by sequestering
biomass of migratory adult amphibians within wetlands.
The catastrophic global decline of amphibians has received much recent attention and
studies have highlighted the important effects that loss of amphibians may inflict on ecosystems
(Gibbons et al., 2006; Whiles et al., 2006). In fact, one hypothesized result of amphibian declines
are subsequent declines of tertiary predators, including snakes (Jennings et al., 1992; Matthews
et al., 2002; Whiles et al., 2006; Todd et al., in press). Although they have garnered less public
attention, reptiles are also declining world-wide (Gibbons et al., 2000; Whitfield et al., 2007;
Todd et al., in press). Our study demonstrates the important predatory role that snakes can play
in some ecosystems and stresses the importance of questioning the assumption that infrequently
encountered species are rare and of minor ecological importance.
ACKNOWLEDGEMENTS
We thank Sarah E. DuRant, J. Whitfield Gibbons, Brian Todd, and especially Melissa
Pilgrim for assistance in collecting and processing snakes and Andrew Durso, Evan Eskew, and
100

Melissa Pilgrim for assistance in the laboratory feeding experiment. We appreciate J. W.
Gibbons for providing comments on the manuscript. Snakes were collected under South Carolina
Department of Natural Resources Scientific Collection permits (G-05-03 and G-06-04), and
procedures used in the study were approved by the University of Georgia animal care and use
committee (A2003-10024-C2, A2006-10069-0, and A2005-10102-c2). This research was
supported by a Graduate Research Fellowship from the National Science Foundation to JDW and
by the Environmental Remediation Sciences Division of the Office of Biological and
Environmental Research, U.S. Department of Energy through Financial Assistance Award no.
DE-FC09-07SR22506 to the University of Georgia Research Foundation.
LITERATURE CITED
Bailey, L. L., T. R. Simons, and K. H. Pollock. 2004. Estimating detection probability parameters for plethodon salamanders using the robust capture-recapture design. Journal of Wildlife Management 68:1-13.
Bouskila, A., 1995. Interactions between predation risk and competition: a field study of
kangaroo rats and snakes. Ecology 76, 165-178. Burton, T. M., Likens, G. E., 1975a. Energy flow and nutrient cycling in salamander populations
in Hubbard Brook Experimental Forest, New Hampshire. Ecology 56, 1068-1080. Burton, T. M. and G. E. Likens. 1975b. Salamander populations and biomass in the Hubbard
Brook Experimental Forest, New Hampshire. Copeia 1975:541-546. Davic, R. D., and H. H. Welsh. 2004. On the ecological roles of salamanders. Annual Review of
Ecology Evolution and Systematics 35:405-434. Diller, L.V., Wallace, R.L., 2002. Growth, reproduction, and survival in a population of Crotalus
viridis oreganus in north central Idaho. Herpetological Monographs, 26-45. Dorcas, M. E., and J. D. Willson. 2009. Innovative Methods for Studies of Snake Ecology and
Conservation. In: Snakes: Ecology and Conservation, S. J. Mullin and R. A. Seigel (Eds.). Cornell University Press, Ithaca, NY. in press.
101

Erlinge, S., Goransson, Hogstedt, Jansson, O. Liberg, J. Loman, I. N. Nilsson, T. Vonshantz, and M. Sylven. 1984. Can vertebrate predators regulate their prey? American Naturalist 123:125-133.
Estes, J. A., and J. F. Palmisano. 1974. Sea otters: their role in structuring nearshore
communities. Science 185:1058-1060. Fauth, J. E. 1999. Identifying potential keystone species from field data: an example from
temporary ponds. Ecology Letters 2:36-43. Fitch, H. S. 1975. A demographic study of the ringneck snake (Diadophis punctatus) in Kansas.
University of Kansas Museum of Natural History Miscellaneous Publications 62:1-53. Fitch, H. S. 1987. Collecting and life-history techniques. In: Snakes: Ecology and Evolutionary
Biology, R. A. Seigel, J. T. Collins and S. S. Novak (Eds.). McGraw-Hill, Inc., New York. pp. 143-164.
Fritts, T.H., Rodda, G.H., 1998. The role of introduced species in the degradation of island
ecosystems: a case history of Guam. Annual Review of Ecology and Systematics 29, 113-140.
Gibbons, J. W. 1997. Discovering hidden biodiversity: lessons from five decades of
herpetological research. In, A. F. Scott et al. (eds.), Proceedings of the Seventh Symposium on the Natural History of the Lower Tennessee and Cumberland River Valleys. The Center for Field Biology, Austin Peay State University, Clarksville, TN. Pages 1-7.
Gibbons, J. W., and M. E. Dorcas. 2004. North American Watersnakes: A Natural History.
University of Oklahoma Press, Norman, OK. Gibbons, J. W., D. E. Scott, T. J. Ryan, K. A. Buhlmann, T. D. Tuberville, B. S. Metts, J. L.
Greene, T. Mills, Y. A. Leiden, S. Poppy, and C. T. Winne. 2000. The global decline of reptiles, déjà vu amphibians. Bioscience 50:653-666.
Gibbons, J.W., Winne, C.T., Scott, D.E., Willson, J.D., Glaudas, X., Andrews, K.M., Todd,
B.D., Fedewa, L.A., Wilkinson, L., Tsaliagos, R.N., Harper, S.J., Greene, J.L., Tuberville, T.D., Metts, B.S., Dorcas, M.E., Nestor, J.P., Young, C.A., Akre, T., Reed, R.N., Buhlmann, K.A., Norman, J., Croshaw, D.A., Hagen, C., Rothermel, B.B., 2006. Remarkable amphibian biomass and abundance in an isolated wetland: Implications for wetland conservation. Conservation Biology 20, 1457-1465.
Godley, J. S. 1980. Foraging ecology of the striped swamp snake, Regina alleni, in Southern
Florida. Ecological Monographs 50:411-436. Greene, H. W. 1997. Snakes: the Evolution of Mystery in Nature. University of California Press,
Los Angeles, CA.
102

Grimm, N. B. 1995. Why link species and ecosystems? A perspective from ecosystem ecology. In C. G. Jones and J. H. Lawton (eds.), Linking Species and Ecosystems, pp. 5-15. Chapman & Hall, New York.
Gregory, P.T., 1984. Communal denning in snakes, In Vertebrate Ecology and Systematics - A
Tribute to Henry S. Fitch. eds R.A. Seigel, L.E. Hunt, J.L. Knight, L. Malaret, N.L. Zuschlag, pp. 57-75. University of Kansas Museum of Natural History Special Publication, Lawrence, KS.
Hanski, I., H. Henttonen, E. Korpimaki, L. Oksanen, and P. Turchin. 2001. Small-rodent
dynamics and predation. Ecology 82:1505-1520. Ineich, I., Bonnet, X., Brischoux, F., Kulbicki, M., Seret, B., Shine, R., 2007. Anguilliform
fishes and sea kraits: neglected predators in coral-reef ecosystems. Marine Biology 151, 793-802.
Jennings, W.B., Bradford, D.F., Johnson, D.F., 1992. Dependence of the garter snake
Thamnophis elegans on amphibians in the Sierra Nevada of California. Journal of Herpetology 26, 503-505.
Kendall, W. L., J. D. Nichols, and J. E. Hines. 1997. Estimating temporary emigration using
capture-recapture data with Pollock's robust design. Ecology 78:2248-2248. Korpimaki, E., P. R. Brown, J. Jacob, and R. P. Pech. 2004. The puzzles of population cycles
and outbreaks of small mammals solved? Bioscience 54:1071-1079. Lyons, K. G., and M. W. Schwartz. 2001. Rare species loss alters ecosystem function: invasion
resistance. Ecology Letters 4:358-365. Matthews, K.R., Knapp, R.A., Pope, K.L., 2002. Garter snake distributions in high-elevation
aquatic ecosystems: is there a link with declining amphibian populations and nonnative trout introductions? Journal of Herpetology 36, 16-22.
Mazerolle, M.J., Bailey, L.L., Kendall, W.L., Royle, J.A., Converse, S.J., Nichols, J.D., 2007.
Making great leaps forward: Accounting for detectability in herpetological field studies. Journal of Herpetology 41, 672-689.
McLaren, B. E., and R. O. Peterson. 1994. Wolves, moose, and tree rings on Isle Royale. Science
266:1555-1558. Nowak, E.M., Theimer, T.C., Schuett, G.W., 2008. Functional and numerical responses of
predators: where do vipers fit in the traditional paradigms? Biological Reviews 83:601-620.
Pace, M. L., J. J. Cole, S. R. Carpenter, and J. F. Kitchell. 1999. Trophic cascades revealed in
diverse ecosystems. Trends in Ecology & Evolution 14:483-488.
103

Paine, R. T. 1966. Food web complexity and species diversity. American Naturalist 100:65-75. Paine, R. T. 1969. A note on trophic complexity and community stability. American Naturalist
103:91-93. Parker, W. S. and M. V. Plummer. 1987. Population Ecology, p. 253-301. In: R. A. Seigel, J. T.
Collins and S. S. Novak, (eds.), Snakes: Ecology and Evolutionary Biology. McGraw-Hill, Inc., NY.
Petranka, J. W. and S. S. Murray. 2001. Effectiveness of removal sampling for determining
salamander density and biomass: A case study in an Appalachian streamside community. Journal of Herpetology 35:36-44.
Polis, G. A., A. L. W. Sears, G. R. Huxel, D. R. Strong, and J. Maron. 2000. When is a trophic cascade a trophic cascade? Trends in Ecology & Evolution 15:473-475.
Pollock, K.H., 1982. A capture-recapture design robust to unequal probabilities of capture.
Journal of Wildlife Management 46, 757-760. Pollock, K. H., J. D. Nichols, C. Brownie, and J. E. Hines. 1990. Statistical inference for capture-
recapture experiments. Wildlife Monographs 1-97. Pough, F. H. 1980. The Advantages of ectothermy for tetrapods. American Naturalist 115:92-
111. Pringle, C. M., N. Hemphill, W. H. McDowell, A. Bednarek, and J. G. March. 1999. Linking
species and ecosystems: different biotic assemblages cause interstream differences in organic matter. Ecology 80:1860-1872.
Regester, K. J., K. R. Lips, and M. R. Whiles. 2006. Energy flow and subsidies associated with
the complex life cycle of ambystomatid salamanders in ponds and adjacent forest in southern Illinois. Oecologia 147:303-314.
Rodda, G.H., 1993. Where's Waldo (and the snakes)? Herpetological Review 24, 44-45. Rodda, G.H., Campbell, E.W.I., Fritts, T.H., Clark, C.S., 2005. The predictive power of visual
searching. Herpetological Review 36, 259-264. Rodda, G. H., G. Perry, R. J. Rondeau, and J. Lazell. 2001. The densest terrestrial vertebrate.
Journal of Tropical Ecology 17:331-338. Rodda, G.H., Savidge, J.A., 2007. Biology and impacts of pacific island invasive species. 2.
Boiga irregularis, the Brown Tree Snake (Reptilia: Colubridae). Pacific Science 61, 307-324.
104

Schmitz, O. J., P. A. Hamback, and A. P. Beckerman. 2000. Trophic cascades in terrestrial systems: a review of the effects of carnivore removals on plants. American Naturalist 155:141-153.
Seigel, R. A., J. W. Gibbons, and T. K. Lynch. 1995. Temporal changes in reptile populations:
effects of a severe drought on aquatic snakes. Herpetologica 51:424-434.
Semlitsch, R.D., Bodie, J.R., 1998. Are small, isolated wetlands expendable? Conservation Biology 12, 1129-1133.
Sharitz, R.R., 2003. Carolina bay wetlands: unique habitats of the southeastern United States.
Wetlands 23, 550-562. Shine, R., Mason, R.T., 2004. Patterns of mortality in a cold-climate population of garter snakes
(Thamnophis sirtalis parietalis). Biological Conservation 120, 201-210. Soulé, M. E., D. T. Bolger, A. C. Alberts, J. Wright, M. Sorice, and S. Hill. 1988. Reconstructed
dynamics of rapid extinctions of chaparral-requiring birds in urban habitat islands. Conservation Biology 2:75-91.
Sun, L., R. Shine, Z. Debi, and T. Zhengren. 2001. Biotic and abiotic influences on activity
patterns of insular pit-vipers (Gloydius shedaoensis, Viperidae) from north-eastern China. Biological Conservation 97:387-389.
Sundell, J. 2006. Experimental tests of the role of predation in the population dynamics of voles
and lemmings. Mammal Review 36:107-141. Tilman, D., J. Knops, D. Wedin, P. Reich, M. Ritchie and E. Siemann. 1997. The influence of
functional diversity and composition on ecosystem processes. Science 277:1300-1302. Todd, B.D., Willson, J.D. & Gibbons J.W. (in press) The global status of reptiles and causes of
their decline. Ecotoxicology of Reptiles and Amphibians, 2nd edition (eds D.W. Sparling, G. Linder & C.A. Bishop. SETAC Press, Pensacola.
Todd, B.D., Winne, C.T., 2006. Ontogenetic and interspecific variation in timing of movement
and responses to climatic factors during migrations by pond-breeding amphibians. Canadian Journal of Zoology-Revue Canadienne De Zoologie 84, 715-722.
Tyrrell, C.L., Christy, M.T., Rodda, G.H., Yackel Adams, A.A., Ellingson, A.R., Savidge, J.A.,
Dean-Bradley, K., Bischof, R., in press. Evaluation of trap capture in a geographically closed population of brown treesnakes on Guam. Journal of Animal Ecology.
Vanni, M. J., A. S. Flecker, J. M. Hood and J. L. Headworth. 2002. Stoichiometry of nutrient
recycling by vertebrates in a tropical stream: linking species identity and ecosystem processes. Ecology Letters 5:285-293.
105

Weatherhead, P.J., Blouin-Demers, G., Prior, K.A., 2002. Synchronous variation and long-term trends in two populations of black rat snakes. Conservation Biology 16, 1602-1608.
Willson, J. D. and W. A. Hopkins. In review. prey morphology constrains feeding ecology of an
aquatic generalist predator: implications for wetland conservation. Willson, J. D., C. T. Winne, M. E. Dorcas, and J. W. Gibbons. 2006. Post-drought responses of
semi-aquatic snakes inhabiting an isolated wetland: Insights on different strategies for persistence in a dynamic habitat. Wetlands 26:1071-1078.
Willson, J. D., C. T. Winne, and L. A. Fedewa. 2005. Unveiling escape and capture rates of
aquatic snakes and salamanders (Siren spp. and Amphiuma means) in commercial funnel traps. Journal of Freshwater Ecology 20:397-403.
Willson, J. D., C. T. Winne, M. A. Pilgrim, C. S. Romanek, and J. W. Gibbons. In review-a.
Effects of terrestrial resource pulses on trophic niche width and overlap in two sympatric aquatic snake species: a stable isotope approach. Oecologia.
Willson, J. D., C. T. Winne, and B. D. Todd. In review-b. Ecological and methodological factors
affecting detectability in “uncatchable” species. Willson, J. D., C. T. Winne, and M. B. Keck. 2008. Empirical tests of biased body size
distributions in aquatic snake captures. Copeia 2008:401-408. Winne, C.T., 2005. Increases in capture rates of an aquatic snake (Seminatrix pygaea) using
naturally baited minnow traps: evidence for aquatic funnel trapping as a measure of foraging activity. Herpetological Review 36, 411-413.
Winne. C. T. 2008. Seminatrix pygaea, a Model of Ecological Resilience to Dynamic Habitats.
Ph.D. dissertation, University of Georgia. Winne, C. T., J. D. Willson, K. M. Andrews, and R. N. Reed. 2006a. Efficacy of marking snakes
with disposable medical cautery units. Herpetological Review 37:52-54. Winne, C. T., J. D. Willson, and J. W. Gibbons. 2006b. Income breeding allows an aquatic snake
(Seminatrix pygaea) to reproduce normally following prolonged drought-induced aestivation. Journal of Animal Ecology 75:1352-1360.
Whiles, M.R., Lips, K.R., Pringle, C.M., Kilham, S.S., Bixby, R.J., Brenes, R., Connelly, S.,
Colon-Gaud, J.C., Hunte-Brown, M., Huryn, A.D., Montgomery, C., Peterson, S., 2006. The effects of amphibian population declines on the structure and function of Neotropical stream ecosystems. Frontiers in Ecology and the Environment 4, 27-34.
White, G. C., and K. P. Burnham. 1999. Program MARK: survival estimation from populations of marked animals. Bird Study 46:120-139.
106

Whitfield, S.M., Bell, K.E., Philippi, T., Sasa, M., Bolanos, F., Chaves, G., Savage, J.M., Donnelly, M.A., 2007. Amphibian and reptile declines over 35 years at La Selva, Costa Rica. Proceedings of the National Academy of Sciences of the United States of America 104, 8352-8356.
Zim, H. S., and H. M. Smith. 1953. Reptiles and Amphibians: A Guide to Familiar American
Species. Golden Press, New York.
107

Table 4.1 Estimated consumption of amphibian prey by snakes at Ellenton Bay between May 2005 and May 2006. Prey consumption was calculated using mean seasonal growth rates for each snake demographic group, mass conversion efficiency, and population size estimates. Prey mass was converted into energetic equivalents using published values for energetic content of Ambystoma talpoideum.
Prey consumption (kg)
N. fasciata Late Spring Summer Fall / Winter Early Spring Total (kg) Total (kJ)
♂ 29.89 13.72 9.69 8.19 61.49 249,655
♀ 42.58 13.76 0.00 26.18 82.52 335,023
Juv 0.00 0.00 30.87 15.89 46.76 189,851
Total 72.47 27.48 40.56 50.26 190.77 774,529
S. pygaea
♂ 0.98 0.94 0.24 0.07 2.23 9,038
♀ 4.91 0.00 9.22 3.35 17.48 70,966
Juv 1.10 1.77 0.00 0.00 2.87 11,652
Total 6.99 2.71 9.46 3.41 22.58 91,656
Grand Total 79.46 30.19 50.02 53.68 213.35 866,186
108

Table 4.2 Estimated distribution of prey consumption by snakes across prey taxonomic groups. Prey consumption (# of individuals) was calculated by multiplying total prey mass consumed within each season (see Table 4.1) by the proportion of diet (by mass) represented by each prey taxon within that season (see Fig. 4.4) and dividing the result by the mean mass of prey within each group.
Prey consumption (individuals)
N. fasciata Ambystoma Tadpoles Anurans
Late Spring 18,979 668 487
Summer 7,171 0 284
Fall / Winter 11,383 24 107
Early Spring 9,859 2,801 766
Total 47,392 3,493 1,645
S. pygaea
Late Spring 1,991 0 54
Summer 781 0 0
Fall / Winter 2,723 0 7
Early Spring 952 0 71
Total 6,446 0 132
Grand Total 53,838 3,493 1,777
109

Figure 4.1 Aquatic snakes are abundant at Ellenton Bay, though they are seldom seen during visual searches. Black Swamp Snakes (Seminatrix pygaea; pictured) are especially secretive and are virtually never seen by the casual observer. Photo by John D. Willson.
110

0
100
200
300
400
500
RecapturesNew captures
Num
ber o
f cap
ture
s
(b)
(a)
0
100
200
300
400
500
May June July Aug Sept Oct Mar April
RecapturesNew captures
Num
ber o
f cap
ture
s
Figure 4.2 Seasonal distribution of captures of (a) Nerodia fasciata and (b) Seminatrix pygaea at Ellenton Bay from May 2005 to April 2006. During each season snakes were captured using 465 aquatic funnel traps (i.e., minnow traps) set in a continuous transect around the periphery of the wetland. Bars represent total captures over 10 consecutive days of trapping from May – September 2005 and 6 consecutive days of trapping in October 2005, April, and May 2006.
111

0
200
400
600
JuvenileFemaleMale
0
200
400
600
JuvenileFemaleMale
(b)
(a)Po
pula
tion
Size
Late Spring
Summer Fall Winter
Early Spring
Popu
latio
n Si
ze
Figure 4.3 Population estimates (± 1 SE) of (a) Nerodia fasciata and (b) Seminatrix pygaea at Ellenton Bay from May 2005 to April 2006. Population sizes were estimated using robust design analysis in program MARK. Models included time-varying and independent (i.e., allowing for a behavioral response to traps) capture and recapture probabilities for both species and group-specific constant random temporary emigration for S. pygaea. Thus, population estimates for S. pygaea represent superpopulationsize (i.e., population size corrected for temporary emigration).
112

0.0
0.2
0.4
0.6
0.8
1.0
0.0
0.2
0.4
0.6
0.8
1.0
Prop
ortio
n of
die
t (m
ass)
(b)
(a)
Ambystoma talpoideum
Tadpoles Adult anurans
N. fasciataS. pygaea
AmbystomaTadpolesAnurans
Late Spring
Summer Fall Winter
Early Spring
Prop
ortio
n of
die
t (m
ass)
Figure 4.4 Diet composition of Nerodia fasciata and Seminatrix pygaea at Ellenton Bay from May 2005 to April 2006. Overall mass-corrected diet composition for N. fasciata and S. pygaea (a) was derived from a total of 1,504 and 518 diet items, respectively. Mass-corrected seasonal diet composition for N. fasciata (b) demonstrates seasonal diet shifts in this species.
113

0.0
0.2
0.4
0.6
0.8
1.0
1.2Male
Female
Juvenile
Gro
wth
rate
(g /
day)
(b)
(a)
Late Spring
Summer Fall -Early Spring
0.0
0.1
0.2
0.3
0.4
0.5Male
Female
Juvenile
Gro
wth
rate
(g /
day)
Figure 4.5 Mean (± 1 SE) seasonal growth rates of (a) Nerodia fasciata and (b) Seminatrix pygaea at Ellenton Bay from May 2005 to April 2006. In cases where snakes lost mass between capture intervals (due to females giving birth or snakes losing some mass over winter), growth rate was set at zero. Thus, if mass change was negative, we conservatively assumed no prey consumption rather than negative prey consumption.
114

CHAPTER 5
PREY MORPHOLOGY CONSTRAINS FEEDING ECOLOGY OF AN AQUATIC
GENERALIST PREDATOR: IMPLICATIONS FOR WETLAND CONSERVATION 4
4 Willson, J. D. and W. A. Hopkins. To be submitted to Ecological Monographs.
115

INTRODUCTION
Classically, ecology seeks to understand factors that determine the distribution and
abundance of organisms. Among the biotic and abiotic factors that can contribute to an
organism’s abundance, perhaps none is more obvious than the availability of suitable food
resources (White 2008). In the extreme case of a dietary specialist, for example, a predator may
be unable to persist outside of the geographic range of its specific prey. The simplest aspect of
resource availability is prey abundance and many studies that use resource availability as an
index of habitat quality focus exclusively on abundance (expressed numerically or in terms of
biomass or volume) of potential prey taxa (e.g., Diaz and Carrascal 1991, Reaney and Whiting
2003, McCauley et al. 2006, Starr and Leung 2006). However, even for specialist species, a
simple measurement of prey abundance can provide an inadequate assessment of true resource
availability. For example, habitat structure or complexity can influence prey encounter or capture
rates such that foraging success may vary among habitats with similar numerical prey
abundances (Crowder and Cooper 1982, Mullin and Mushinsky 1997, Mullin and Cooper 2000).
Assessing resource availability is further complicated for generalist species because prey taxa
may differ in various aspects of quality, including nutritional composition and morphology.
Nutritional composition of prey is easily measured and can have direct effects on a variety of
fitness-related traits (Mayntz et al. 2003, Wilder and Rypstra 2008). For example, young
Kittiwakes (Rissa brevirostris) fed low-lipid diets exhibit reduced growth and impaired learning
abilities compared to those reared on high-lipid diets (Kitaysky et al. 2006). The consequences of
variation in prey morphology, conversely, are generally poorly understood (Vincent et al. 2006).
Snakes provide an excellent model for studying the effects of prey morphology on
feeding ecology. Historically, snakes have been underrepresented in the ecological literature, but
116

have recently gained appreciation, both as important ecosystem components (e.g., Godley 1980,
Ineich et al. 2007) and as excellent subjects for investigating a broad range of ecological
questions (Shine and Bonnet 2000, Dorcas and Willson 2009). All snakes are strict carnivores
and are generally gape-limited in the size of prey that they can consume (Mushinsky 1987,
Arnold 1993). Therefore, prey size and morphology ultimately determine both the maximum size
of prey that can be consumed and the time and effort required for ingestion (Arnold 1993,
Vincent et al. 2006). Moreover, snakes typically cannot adjust the size of potential prey by
mastication and are forced to consume all components of each prey item, regardless of
nutritional quality or digestibility. Because snakes lack limbs, they rely solely on their jaws and
body musculature for both prey handling and locomotion (Cundall 1987). Therefore, the added
burden of a large meal can hinder snake locomotor performance (Garland and Arnold 1983, Ford
and Shuttlesworth 1986, Shine and Shetty 2001). For example, Mehta (2006) found that
hatchling trinket snakes (Elaphe helena) fed large prey (> 50% of snake body mass) exhibited
severely reduced maximum sprint speeds and exhausted quickly. Additionally, large meal sizes
were associated with a switch from active to passive or cryptic defensive behaviors, presumably
to compensate for locomotor impairment (Mehta 2006). Thus, snakes provide an excellent
opportunity to evaluate the effects of prey morphology on various aspects of feeding ecology,
physiology, and post-prandial locomotor performance.
The banded watersnake (Nerodia fasciata Linnaeus) is virtually ubiquitous in the
southeastern United States, occurring in most aquatic habitats from temporary ditches to large
lakes and rivers (Gibbons and Dorcas 2004). Nerodia fasciata is generally characterized as an
opportunistic feeder and is known to consume a variety of aquatic vertebrate prey, with a
particular preference for fish and amphibians (Mushinsky and Hebrard 1977, Gibbons and
117

Dorcas 2004). Paradoxically, in South Carolina N. fasciata are most abundant in wetlands that
dry periodically, and consequently lack fish (JDW unpublished data), despite the fact that they
experience precipitous declines in these habitats during periodic extreme droughts (Seigel,
Gibbons and Lynch 1995, Willson et al. 2006). However, following drought-induced population
declines, N. fasciata populations rebound rapidly, driven by high fecundity of surviving females
and subsequent rapid growth to maturity of juveniles (Winne 2008). Presumably, this rapid
recovery is fueled by characteristics of amphibian prey within fishless wetlands. The remarkable
amphibian productivity of these habitats has been recognized, particularly following prolonged
droughts (Gibbons et al. 2006). However, it is unknown whether other characteristics of
amphibian prey, such as nutritional composition or morphology, may facilitate rapid growth of
juvenile watersnakes and subsequent population recovery within ephemeral wetland habitats
following drought.
In this study we investigated how morphological characteristics of dominant prey may
constrain the feeding ecology of a generalist predator and therefore influence overall habitat
quality for this species. We assessed prey available to juvenile N. fasciata in permanent and
isolated, periodically-dry wetlands and compared quality of the dominant prey taxa from each
wetland type, paedomorphic salamanders (Ambystoma talpoideum) and sunfish (Lepomis
marginatus), respectively. Specifically, we compared nutritional composition and morphology of
each prey taxon and used a series of repeated-measures experiments to examine prey handling
(number of prey consumed, maximum prey size, and handling time), digestive metabolism
(specific dynamic action, SDA), and post-prandial locomotor performance (maximum crawling
speed) of snakes fed Ambystoma and Lepomis. We predicted that differences in prey morphology
would constrain watersnakes’ feeding and locomotor performance. Because Ambystoma are
118

more elongate and contain fewer impediments to handling and digestion (e.g., scales and spiny
fin rays), we predicted that snakes would be able to consume larger Ambystoma than Lepomis
and ingest Ambystoma more rapidly. Further, we expected that the large amounts of bony
material present in Lepomis would result in a higher cost of digestion (SDA response) for
Lepomis than Ambystoma. Finally, we expected that ingestion of Lepomis would induce greater
body distension than ingestion of Ambystoma, resulting in increased post-prandial locomotor
impairment (reduced maximum crawling speed) in snakes that consumed Lepomis compared to
those that consumed Ambystoma.
METHODS
Experimental subjects
The banded watersnake (Nerodia fasciata) is a common, moderately large (maximum
total length 1588 mm, Gibbons and Dorcas 2004) semi-aquatic snake that is found in a variety of
aquatic habitats throughout its range in the southeastern United States (Gibbons and Dorcas
2004). Among snakes, this species is one of the most heavily–studied, including studies of diet
(Mushinsky and Hebrard 1977, Kofron 1978, Mushinsky, Hebrard and Vodopich 1982), feeding
morphology (Vincent et al. 2006, 2007), locomotor performance (Hopkins and Winne 2006),
ecotoxicology (Hopkins et al. 1999, Hopkins et al. 2002, Hopkins and Winne 2006), and
digestive physiology (Hopkins et al. 2004). To obtain experimental subjects, pregnant female N.
fasciata were captured in aquatic funnel traps (i.e., minnow traps; Keck 1994, Willson et al.
2008) at various uncontaminated aquatic habitats on the U.S. Department of Energy’s Savannah
River Site (SRS), in South Carolina, USA in June and July 2005 and maintained in the laboratory
until parturition (see Hopkins et al. 2005 and Hopkins and Winne 2006 for general housing
119

details). Following parturition, neonates were individually marked by ventral branding (Winne et
al. 2006) and were maintained communally in 75.7 L aquaria between experiments. Cages were
lined with paper towels and were equipped with large water bowls, hide boxes, and basking
lamps (12L:12D photoperiod) to provide thermal gradients within cages. Snakes were offered ad
libitum food [fish (Gambusia holbrooki and Lepomis spp.) or amphibian larvae (Rana spp.
tadpoles and Ambystoma talpoideum larvae)] approximately once per week between
experiments. To minimize the effects of prior feeding experience on our results we ensured that
all snakes had previously consumed both prey types used in our experiments.
Prey availability and snake abundance
Between 30 May and 20 July, 2006, 16 wetlands on the SRS were sampled to
characterize prey communities in permanent and isolated, periodically dry wetlands. Wetlands
were selected to meet the following criteria: 1) were non-forested, 2) typically held water year-
round, 3) had abundant emergent and sub-surface vegetation, and 4) were known to harbor
populations of N. fasciata. Half (8) of the wetlands selected either had not dried within 20 yrs
(based on long-term hydrologic surveys) or were occasionally connected to permanent water
bodies. The remaining wetlands (n = 8) dried during severe droughts and were isolated from
other water bodies. The functional consequence of these differences in hydrology was that
permanent wetlands contained fish, whereas isolated, periodically dry wetlands contained only
amphibians and invertebrates.
Each wetland was trapped for one night with 30 – 150 (depending on wetland area)
cylindrical plastic minnow traps (model 700, N.A.S. Incorporated, Marblehead, Ohio) to assess
prey availability. Traps were set in shallow water with the funnels submerged and were not
baited. After 24 h, traps were checked and all fish and amphibians were identified to species and
120

counted. As our goal was to assess prey available to juvenile watersnakes, exceptionally large
prey were excluded from analyses. For most prey types (fish and anurans) the small diameter of
trap entrances (2.5 cm) excluded individuals too large to be considered potential prey. However,
because the small maximum body diameter of giant, permanently aquatic salamanders (Siren and
Amphiuma) allowed very large individuals to be captured (up to 236 g), we excluded these taxa
from our comparisons. We grouped prey into functional groups including centrarchid fish
(genera Acantharchus, Centrarchus, Enneacanthus, Lepomis, and Micropterus), Gambusia and
Fundulus, “other fish” (genera Ameiurus, Amia, Aphredoderus, Erimyzon, Esox, and Umbra),
larval and paedomorphic Ambystoma talpoideum, anuran tadpoles, and adult anurans (genera
Acris, Bufo, Hyla, and Rana). We compared prey profiles between wetland types based on
numerical abundance (mean number captured per trap night) and based on biomass. Prey
biomass was calculated by multiplying the relative abundance of each prey functional group by
the mean mass of prey within that group (derived from a database of 374 prey captured from a
subset of the sampled wetlands).
Subsequent to prey sampling, traps were monitored for an additional 4 trap nights to
assess differences in N. fasciata abundance among wetland types. Snakes were marked by
clipping ventral scales to avoid recounting individual snakes and snake relative abundance at
each wetland was calculated as the number of individual N. fasciata captured per 100 trap-nights
of sampling.
Prey collection, morphology, and nutritional composition
Based on wetland prey community composition (see results) we selected representative
taxa from the two most dominant (by biomass) prey groups from isolated and permanent
wetlands: paedomorphic mole salamanders (Ambystoma talpoideum), and dollar sunfish
121

(Lepomis marginatus), respectively. Prey representing a variety of sizes were collected from
uncontaminated aquatic habitats on the SRS using aquatic funnel traps. Prey were blotted dry,
weighed to the nearest 0.01 g on an electronic balance, and individually frozen for use in
subsequent experiments. Morphology of prey types was assessed by measuring maximum height
and maximum width (to the nearest 0.01 mm using digital calipers) for 30 individuals of each
prey type and testing for differences in maximum dimensions using ANCOVA, with prey mass
as a covariate. Whole body prey samples (n = 4 per prey type, spanning the mass range used in
the digestive metabolism experiment) were dried to constant mass in a freeze drier and analyzed
for nutritional composition (protein, lipid, and energy content) at the University of Arkansas’s
Poultry Science Center. Lipid and protein content were determined using petroleum ether
extraction and the Kjeldahl combustion technique, respectively, and energy content was
determined using bomb calorimetry. Although dietary values are reported on a wet mass basis,
differences in nutritional content between prey types were examined using analysis of covariance
(ANCOVA) with absolute protein and lipid content, dry mass, and energy content (kJ) as
dependent variables and prey wet mass as the covariate. In all experiments, prey rations were
determined based upon the wet mass of the prey item.
To determine whether prey type influenced post-feeding morphology of snakes, we
randomly assigned 16 similarly-sized snakes (mean mass = 18.9 ± 0.47 g) into the two prey-type
treatments and fed each snake a prey item weighing 25.0 ± 0.4 % of its body mass. Maximum
snake body width (occurring at the location of the prey item within the snake) was measured 1 h
post-feeding and subsequently at 24 h intervals until body distension due to prey was no longer
evident (120 h post-ingestion). Effect of prey type on body distension was evaluated over time
using repeated-measures MANOVA (Profile Analysis). For all statistical analyses in this study,
122

if raw data failed to meet assumptions of parametric models, we used appropriate
transformations. We recognized statistical significance at P ≤ 0.05 and performed all statistical
analyses using SAS (version 9; SAS Institute 2000) or the STATISTICA for Windows software
package (StatSoft, Inc. Tulsa, OK, USA 1998).
Experiment I - prey handling
A set of two experiments was used to examine differences in prey handling (swallowing)
between the two prey types. The first experiment used a repeated-measures design to determine
if the number of prey consumed differed between prey types across a range of prey sizes (20 –
65% of snake body mass). Because this experiment demonstrated that snakes were able to
swallow much larger salamanders than fish, a second experiment was designed, wherein snakes
were offered only salamanders, to determine the maximum size of salamander that snakes could
consume. Finally, data from all successful swallowing events were used to test for differences in
handling time between the prey types and prey sizes.
In the first prey handling experiment juvenile N. fasciata (n=10/treatment; mass = 9.5 ±
0.61 g) were randomly assigned to a prey-size treatment (20, 35, 50, or 65% of the snake’s body
mass) and each snake was offered A. talpoideum and L. marginatus of the assigned size on
separate occasions (prey type order determined randomly). Snakes were offered prey in excess (2
– 5 prey items per trial, depending on size treatment) and no snake consumed all prey offered in
any trial. Number of prey consumed was compared between prey types using a Wilcoxon’s
matched pairs test separately for each prey size category. In the second experiment, juvenile N.
fasciata (n=8-10/treatment; mass = 4.9 ± 0.26 g) were randomly assigned to a prey size treatment
(75, 90, 105, or 120% of the snake’s body mass) and each snake was offered two A. talpoideum
123

of the assigned size. Visual inspection of data allowed determination of the maximum prey size
capable of being ingested by snakes.
All feeding trails were conducted between 0900 and 1800 h within a walk-in
environmental chamber set at 30 °C. Snakes were fasted for 10 d prior to each trial. On the day
of each feeding trial snakes were weighed and allowed to acclimate in feeding chambers within
the environmental chamber for 1 h. Feeding chambers consisted of 739 ml clear plastic
containers (GLAD sandwich boxes) to which we added c. 10 ml of room-temperature water to
provide a suitable feeding environment for the watersnakes. Up to three snakes were run
simultaneously during each trial in separate feeding chambers. Following acclimation, dead,
defrosted prey were added to feeding chambers and a weighted plexiglass sheet was placed over
the top of each feeding chamber, allowing detailed observation of feeding behavior. The
observer then moved behind a blind and observed feeding snakes for the next 1 h, at which point
the trial was terminated. During the trial, the observer recorded the time (nearest second) at
which the snake positioned the prey into swallowing position (prey position aligned with the
jaws and commencement of “jaw walking”) and the time at first tongue flick after swallowing.
Handling time was defined as the time elapsed between these two events (Krause and Burghardt
2001). If, at the terminus of the experiment, any snake was still in the process of swallowing a
prey item, that individual was not disturbed and was allowed to continue until it either
successfully swallowed the meal or regurgitated and discontinued contact with the prey item.
Data from successful ingestion events across both experiments were combined to
compare prey handling times between prey types and sizes. Because differences existed between
prey types in the maximum size of prey item that could be swallowed, handling times were not
available for both prey types within all prey size categories. Thus, effects of prey type and prey
124

size on handling time were determined using a 2-factor analysis of variance (ANOVA) on log-
transformed handling times within prey size treatments where both prey types were represented
by more than one successful swallowing event (20% and 35% of snake body mass). In cases
where individual snakes consumed more than one prey item of a given prey type within a size
category, the mean handling time across all successful swallowing events was used to avoid
pseudoreplication.
Experiment II –digestive metabolism
A repeated-measures experiment was used to compare metabolic responses of snakes fed
salamanders and fish. For each of 11 juvenile N. fasciata, methods modified from Hopkins et al.
(2004) were used to measure 1) standard metabolic rate (SMR; the metabolic rate of a resting,
post-absorptive ectotherm at a specified temperature during the inactive phase of its circadian
cycle; Bennett and Dawson 1976), 2) specific dynamic action (SDA; the increased energy
expenditure associated with digestion, assimilation and biosynthesis; Kleiber 1975, Secor and
Diamond 2000) after the snake had eaten a L. marginatus of 25% of the snake’s body mass, and
3) SDA after it had eaten an A. talpoideum of 25% of the snake’s body mass. Juvenile N. fasciata
(n = 11) spanning a small range of body masses (15.92 – 22.71 g) were used in this experiment
to minimize the confounding effects of allometric relationships between mass and metabolic rate
on our results. Prior to respirometry trials, snakes were fasted for 10 days to ensure post-
absorptivity. Snakes were then weighed and placed in individual chambers (1 L Erlenmeyer
flask) within an environmental chamber (25 oC, constant dark), within which all metabolic
measurements were taken. A 20 ml plastic sample bottle was affixed to the bottom of the flask
with Velcro to provide water to snakes throughout the experiment. A single 25.4 x 9.52 cm paper
125

towel was folded lengthwise and placed loosely around the water dish to provide shelter and
absorb excreta. The exterior of each chamber was wrapped with paper to reduce external stimuli.
We determined metabolic rate indirectly as O2 consumption (adjusted for standard
temperature and pressure) by connecting each chamber to a computer-controlled, closed-system
respirometer (Micro Oxymax, Columbus Instruments, Columbus Ohio). Respirometry
measurements commenced at 10:00–11:00 h and the first 48 h were used to calculate SMR.
During this period, up to six snakes were run simultaneously and O2 consumption was measured
every 48 min. After every fourth sample, chambers were refreshed with ambient air equaling
four times the headspace of each chamber. Thus, additional time (113 mins) was required
following each fourth interval to allow for complete refreshment of air in the chambers. A total
of 35 - 41 O2 measurements was collected for each snake. Following SMR measurements, snakes
were removed from the environmental chamber and fed one A. talpoideum or L. marginatus
(order determined randomly) equal to approximately 25% (24.94 ± 0.14%) of the snake’s body
mass. Snakes were then returned to the environmental chamber and respirometry measurements
were resumed for the following 6 d (144 h) to calculate SDA parameters. Up to four snakes (in
individual chambers) were run simultaneously during each SDA trial and both prey types were
represented within each trial. During SDA trials, O2 consumption was measured every 36 min
with longer intervals (120 min) every third sample to accommodate refreshing of chambers with
ambient air. At the midpoint of the SDA trial (72 h post-feeding), snakes were removed,
chambers cleaned, and instrumentation re-calibrated. Thus, we obtained a total of 130 O2
measurements for each snake during each SDA trial. Following termination of each snake’s first
SDA trial, the snake was returned to its standard housing where it was fed again, fasted for 10 d,
and then started on its second SMR and SDA trial, during which it was fed the second prey type.
126

Snake SMR was estimated by taking the mean of the lowest quartile of the O2
measurements obtained for each snake during the 48 h SMR trial (Hopkins et al. 2004). Visual
inspection of data plots confirmed that this technique removed all outliers from SMR
measurements. To estimate SDA from post-prandial respiration measurements, a two-part
smoothing technique was used to remove the effects of spontaneous activity from SDA curves.
The smoothing technique used a moving central minimum of three values, followed by a moving
central median of 11 measurements (Hopkins et al. 2004). Energy allocated to SMR during
digestion was estimated by extrapolating SMR measured before feeding over the digestive
period. The integrated VO2 allocated to SMR was then subtracted from the integrated area under
each smoothed post-prandial curve to calculate the oxygen consumed to support SDA.
Additionally, peak post-prandial O2 consumption, digestive scope (peak O2/SMR), time to peak
O2, time to 50% decrease from peak, and time to 75% decrease from peak were calculated for
each snake. SDA was converted to energetic equivalents using a conversion factor of 19.8 J/mL
O2 (Secor and Diamond 2000) and the cost of digestion (SDA coefficient) was calculated as a
percentage of total ingested energy allocated to the SDA response. Because individual snakes
received both prey type treatments, individual was used as a blocking factor in a multivariate
analysis of variance (MANOVA) to test for effects of prey type on SDA response, peak rate of
O2 consumption, digestive scope, time to peak, time to 50% decrease from peak, time to 75%
decrease from peak, and SDA coefficient. SDA expressed as total kJ expended was excluded
from the statistical analysis because this parameter is completely autocorrelated with SDA
expressed as ml O2 consumed. Although we controlled for mass by using a small range of snake
sizes and blocking by individual, we initially tested for mass effects by including body mass as a
127

covariate. However, as no overall mass effect was detected (F8,2 = 1.04, P = 0.576), mass was
subsequently removed from the statistical model.
Experiment III – post-feeding locomotor impairment
A repeated-measures design was used to compare post-feeding locomotor impairment of
snakes fed salamanders and fish. Maximum crawling speed was selected as our measure of
locomotor performance because watersnakes frequent terrestrial wetland edges while basking to
aid digestion and are most abundant in heavily-vegetated habitats (Gibbons and Dorcas 2004,
JDW unpublished data), where locomotion is more akin to crawling than swimming. Moreover, a
previous study examining the relative effects of reproductive burden on swimming and crawling
in a semi-aquatic snake found that burden affected crawling speed more strongly than it affected
swimming speed (Winne and Hopkins 2006).
Sixteen juvenile N. fasciata (mean mass = 18.9 ± 0.47 g; mean SVL = 281 ± 3.7 mm)
were randomly divided between fish and salamander treatments, and their maximum crawling
speed was measured before feeding, immediately post-feeding, and subsequently at several time
points during digestion using methods similar to those of Winne and Hopkins (2006).
Throughout the experiment, snakes were housed at 28 oC within an environmental chamber but
locomotor trials were conducted within a temperature-controlled laboratory (temperature range
across all trials: 21.0 - 22.8 oC).�
Maximum crawling velocity for each snake was determined using a 2.3 m linear sprint
track lined with pairs of photocells projecting infrared beams at 10 cm intervals interfaced with a
laptop computer (Columbus Instruments, Columbus, Ohio, USA; described in detail in Holem et
al. 2006 and DuRant et al. 2007). The racetrack was lined with a strip of stiff plastic carpet
(“astroturf”) to maximize crawling performance (Winne and Hopkins 2006). Prior to the
128

experiment, snakes were fasted for 10 d and conditioned to the track by racing them twice in
succession 48 h prior to the start of the experiment. Subsequently, snakes were raced twice in
succession at six time intervals: 18 h before feeding and 1 h, 24 h, 48 h, 72 h, 96 h, and 120 h
after consuming a L. marginatus or A. talpoideum equal to 25.0 ± 0.4% of the snake’s body
mass.
Prior to beginning each trial, individual snakes were placed in a box attached to the
starting point of the track and left undisturbed for approximately one minute. A gate separating
the start box from the sprint track was then lifted, and the snake was chased by hand down the
track by lightly touching the snake’s tail at approximately one second intervals to prompt a flight
response (Huey et al. 1989, Winne and Hopkins 2006). Further motivation was provided by
attaching a darkened shelter to the opposite end of the track (Bennett 1980). The time it took for
each individual to crawl 60 cm was calculated for each 60 cm segment of the track and the single
fastest velocity (expressed as cm/s; Shine et al. 2003) for each individual was used as an estimate
of maximum locomotor performance in statistical comparisons. Effects of prey type on post-
feeding maximum sprint velocity was evaluated using repeated-measures MANOVA (Profile
Analysis). Although we attempted to minimize confounding effects of body size on crawling
speed by using a small range of snake sizes, we include SVL as a covariate in our statistical
model. However, as no effect of SVL was detected (F1,13 = 0.19, P = 0.674), SVL was
subsequently removed from the model.
129

RESULTS
Prey availability and snake abundance
Permanent wetlands, or those with periodic connections to permanent water bodies,
showed markedly different prey communities than wetlands that dried periodically and were
isolated from other aquatic habitats (Fig. 5.1). Generally, prey communities within isolated
wetlands were comprised exclusively of amphibians and were dominated by larval and
paedomorphic Ambystoma talpoideum. Although permanent wetlands hosted small numbers of
tadpoles and adult anurans, the prey communities of these wetlands were dominated by various
fish species. Numerically, fish communities of permanent wetlands were dominated by
Gambusia holbrooki and Fundulus sp. However, because these fish are small (0.65 ± 0.08 g),
when prey mass was considered, centrarchid fish were the dominant prey type in permanent
wetlands. Likewise, when prey mass was considered, other large prey taxa, such as adult anurans
and “other fish,” gained importance, whereas the importance of small but numerous prey taxa
(e.g., tadpoles) declined. The patterns of abundance we documented agree well with other
qualitative and quantitative assessments of wetland fish and amphibian assemblages in the region
(e.g., Gibbons and Semlitsch 1999, Snodgrass et al. 1996). Continued trapping using aquatic
funnel traps yielded a total of 132 individual N. fasciata. Isolated wetlands exhibited
substantially greater N. fasciata abundance compared to permanent wetlands (Fig. 5.2).
Prey morphology and nutritional composition
Substantial differences in morphology were evident between salamanders and fish.
Although A. talpoideum had a larger maximum body width than L. marginatus at a given mass
(Fig. 5.3a; F1,57 = 293.7, P < 0.001), L. marginatus had substantially greater maximum height
than A. talpoideum at all body sizes (Fig. 5.3b; F1,57 = 1,224.9, P < 0.001). In addition to
130

differences in maximum dimensions, other anatomical differences between the prey types were
obvious. Ambystoma talpoideum possess well-developed legs and slimy skin, whereas L.
marginatus have scales and fins, including dorsal and anal fins equipped with sharp spines (Fig.
5.3c). Following consumption of a large meal, snakes eating L. marginatus exhibited much
greater body distension (maximum body width) than those consuming an equivalently-sized A.
talpoideum (Fig. 5.3d). The difference in body distension between prey types declined over time
(time-by-prey type interaction, F5,70 = 8.35, P = 0.003). By approximately 60 h post-ingestion,
differences in maximum body width were no longer evident between snakes fed the two prey
types (Fig. 5.3d).
Overall, nutritional composition was similar between the two prey types (Table 5.1).
Among body composition variables, the greatest difference between the prey types was in water
content, with A. talpoideum having 6% greater water content than L. marginatus. Likely due to
differences in water content, L. marginatus had slightly higher protein content (expressed per
unit wet mass) than A. talpoideum, but lipid and energy content were similar between the prey
types (Table 5.1).
Prey handling
Snakes showed substantial differences in their ability to consume the two prey types.
Although the maximum size of L. marginatus consumed by a juvenile N. fasciata was 50% of
the snakes body mass (Fig. 5.4a), three snakes of 10 snakes were able to consume A. talpoideum
equal to 105% of the snake’s body mass (Fig. 5.4b). Within the smallest prey size category (20%
of snake body mass), snakes consumed an average of 1.5 prey item, regardless of prey type
(Wilcoxon’s matched pairs test; Z = 1.60, P = 0.109). However, snakes consumed significantly
more A. talpoideum than L. marginatus within all larger prey size categories tested: 35% of
131

snake body mass (Z = 2.20, P = 0.028), 50% of snake body mass (Z = 2.80, P = 0.005), 65% of
snake body mass (Z = 2.67, P = 0.007).
Within prey size categories where both prey types could be consumed (20% and 35% of
snake body mass), prey type had a significant effect on handling time (F1,30 = 120.60, P < 0.001;
Fig. 5.5). At 35% of snake body mass, mean ingestion time for L. marginatus (20.6 min) was
nearly 15 times higher than that of A. talpoideum (1.5 min). Even handling time of A. talpoideum
of 105% of snake body mass (9.0 min) was only half as long, on average, than handling time of
L. marginatus of 35% of snake body mass (20.6 min). Prey size also had a significant effect on
handling time (F1,30 = 18.2, P < 0.001) with larger prey taking longer to ingest in both prey types
(Fig. 5.5). However, no prey-type by prey-size interaction was detected (F1,30 = 0.69, P = 0.411).
Digestive metabolism
Juvenile N. fasciata weighing 18.47 ± 0.29 g (treatments combined) had standard resting
metabolic rates (SMR) of 0.66 ± 0.04 ml O2/h and SMR did not differ between treatments (Table
5.2). After consuming meals of 25% of their body mass, snakes exhibited classic SDA response
curves (Fig. 5.6) characterized by rapid increases in energy consumption for the first 24 h, a
plateau at peak O2 consumption from 24 – 48 h post-feeding, and a gradual decrease in energy
consumption thereafter. Snakes returned to relatively steady levels of O2 consumption by
approximately 120 h post-feeding, but post-feeding minimum O2 consumption was slightly
higher than pre-feeding SMR, likely due to a slight increase in body mass.
Overall, SDA curves were remarkably similar between the two prey types, with only
subtle differences in the shapes of the curves (Fig. 5.6). Indeed, we detected only a marginally-
significant effect of treatment (prey type) on SDA response (F8,3 = 7.49, P = 0.063). Individual
comparisons revealed no effect of treatment on total VO2 consumed, peak O2, digestive scope,
132

SDA coefficient (proportion of ingested energy allocated to SDA), and time to peak O2
consumption (Table 5.2). However, treatment did significantly affect time to 50% and 75%
decrease from peak O2 consumption (Table 5.2), with snakes fed A. talpoideum declining more
steeply towards baseline O2 consumption rate than snakes fed L. marginatus (Fig. 5.6).
Post-feeding locomotor impairment
Prior to feeding, snakes in both treatment groups exhibited maximum crawling speeds of
approximately 25 cm/s (Fig. 5.7). Following consumption of prey items equal to 25% of the
snake’s body mass, snakes in both treatment groups exhibited significant reductions in maximum
sprint speed (time, F6,84 = 16.71, P < 0.001). This reduction, however, was much more
pronounced in snakes fed L. marginatus than in snakes fed A. talpoideum (time-by-prey type
interaction, F6,84 = 2.67, P = 0.020). When tested 1 h post-feeding, snakes fed L. marginatus
displayed an average maximum sprint velocity of 13 cm/s, a reduction of nearly 45% from pre-
feeding speed, while snakes fed A. talpoideum displayed a maximum sprint velocity of 21 cm/s,
a reduction of only 23% from pre-feeding speed. Snakes gradually increased in mean sprint
velocity during digestion. However, snakes that had consumed L. marginatus did not attain pre-
prandial crawling velocities until approximately 100 h after feeding (Fig. 5.7).
DISCUSSION
Our results suggest that aquatic salamanders (e.g., A. talpoideum), which are
characteristic of fishless wetlands in the South Carolina Coastal Plain, represent a higher quality
prey for juvenile watersnakes than centrarchid fish (e.g., L. marginatus), which are characteristic
of permanent wetlands. Juvenile N. fasciata were able to consume larger A. talpoideum than L.
marginatus and consumed more A. talpoideum at sizes where both prey types could be
133

consumed. L. marginatus induced greater post-prandial body distension in snakes than did A.
talpoideum, resulting in severely-impaired locomotor performance. Cost of digestion (SDA
response) was similar between the prey types, likely reflecting their similar nutritional
composition. However, snakes fed A. talpoideum displayed significantly shorter times to 50%
and 75% O2 consumption rate, suggesting that digestion of A. talpoideum is slightly more rapid
than L. marginatus. The differences in quality of dominant prey among fishless and permanent
wetlands may contribute to the higher N. fasciata abundances we observed in fishless, compared
to permanent wetland habitats.
Prey handling
Snakes are well-known for their ability to consume massive meals relative to their body
size. In an extreme example, a juvenile lancehead (Bothrops atrox) consumed a lizard totaling
156% of the snake’s body mass (Greene 1983). In many cases, however, evaluations of “prey
size” consider only prey mass relative to snake body size (e.g., Mushinsky, Hebrard and
Vodopich 1982, Shine 1991, Shine et al. 1998) and our understanding of how prey shape
contributes to mechanics of feeding is limited (but see Kley and Brainerd 2002, Vincent et al.
2006). We found that prey morphology was extremely important in determining the maximum
size of prey that could be ingested by snakes. Indeed, due to differences in prey morphology, the
maximum size of A. talpoideum that snakes could consume (105 % of snake mass) was over
twice the maximum size of L. marginatus (50% of snake mass). This result corroborates the
findings of Vincent et al. (2006) who concluded that prey with great maximum dimensions were
more difficult for snakes to consume than more elongate prey. Interestingly, the upper size of A.
talpoideum that snakes were able to consume was apparently not dictated by gape limitation. In
fact, two snakes attempting to swallow A. talpoideum of 105% of their body mass, and one
134

attempting 120%, all managed to get well past the widest point of the prey item (head) and
swallow at least 2/3 of the prey’s length before regurgitating. This observation suggests that
snakes may be limited by the volume of their stomach, rather than their gape, when consuming
A. talpoideum. Alternatively, these large prey may have filled the snake’s body cavity so
completely that cardiovascular or respiratory function would have been impaired had the snake
not regurgitated. Other authors have noted that elongate, but massive prey represent the ideal
prey morphology for snakes and it has been suggested that a switch to elongate prey was a
precursor to the success, and subsequent diversification, of ancestral snakes (Greene 1983). Our
results support this conclusion by demonstrating that, for snakes, feeding on large, elongate prey
alleviates the phenomenon of gape limitation.
In addition to influencing the maximum ingested prey size, prey morphology also
dictated the number of small prey ingested by snakes. Snakes consumed more A. talpoideum
than L. marginatus when prey were small. Our small prey size treatments were well below the
gape limitation threshold for both prey types. Thus, the fact that snakes consumed more A.
talpoideum per feeding event presumably represented a choice by snakes, rather than
morphological limitation. Previous studies have shown that given a choice, northern watersnakes
(Nerodia sipedon) select smaller meal sizes than they are physically capable of ingesting
(Andreadis and Burghardt 2005). Our results suggest that this decision may be influenced by
prey type. It is plausible that the awkward shape of L. marginatus (narrow, but tall) make large
meals of this prey type less desirable, perhaps due in part to the increased handling time and
impaired locomotor performance incurred by snakes consuming large meals of this type.
In addition to differences in maximum meal size and number of prey consumed, we also
observed striking differences in handling time between the two prey types. Handling time was
135

always longer for L. marginatus, and even A. talpoideum of over 100% of snake body mass took
less than half as long to swallow as L. marginatus weighing 35% of snake’s body mass. These
results confirm the findings of Vincent et al. (2006) that prey morphology, independent of prey
mass, can be an important determinant of snake feeding performance. They found that frogs,
which have larger maximum dimensions, took N. fasciata longer and required more jaw
protractions to swallow than fish (Fundulus grandis). Vincent et al. (2006) suggested that wide
or bulky prey may interfere with a snake’s ability to use anterior vertebral bending to transport
prey past the jaws. Although we did not examine feeding mechanics in this study, it is likely that
the narrow, tall morphology of L. marginatus contributed to the longer handling times we
observed by limiting snake’s abilities to use vertebral bending during ingestion. Although other
studies have suggested that Nerodia rely primarily on jaw protractions to swallow fish (Kley and
Brainerd 2002), it is likely that the elongate morphology of A. talpoideum facilitated the use of
vertebral bending during ingestion (Kley and Brainerd 2002), resulting in rapid ingestion times,
even for very large prey. Although the energetic cost of prey handling in snakes is likely trivial
(Feder and Arnold 1982, Cruz-Neto et al. 2001), differences in handling time may be
biologically relevant. For example, following optimal foraging theory, time spent consuming
prey represents time lost from other important activities such as thermoregulation, reproduction,
or pursuing subsequent prey (Arnold 1993). Perhaps more importantly, increased handling time
may increase predation risk, especially in juvenile snakes (Arnold 1993, Vincent et al. 2006).
Thus, pursuing prey that require longer handling times not only decreases energy acquisition per
unit time, but may also incur a fitness cost. Snakes have recently been documented to make
foraging-versus-risk decisions (Aubret et al. 2007) and thus, may avoid prey that are risky to
capture. Alternatively, snakes inhabiting habitats where only “risky” prey are available (e.g.,
136

permanent wetlands) may be subject to elevated levels of predation, consequently reducing
population growth rates.
Cost of digestion
Previous studies suggest that nutritional composition, particularly protein content, is the
primary driver of the SDA response in ectotherms (Andrade et al. 2005, McCue et al. 2005). This
conclusion is based primarily on observations that SDA response correlates strongly with protein
content of meals (Hailey 1998). Moreover, inhibition of protein synthesis has been shown to
disable the SDA response in both fish (Brown and Cameron 1991a,1991b) and snakes (McCue et
al. 2005). However, little is known about the effects of prey shape or structure on digestive
physiology. In fact, most studies of SDA in ectotherms fed natural prey compare prey types that
differ substantially in a variety of ways, including nutritional composition, taxonomy, structure,
and amount of indigestible material (e.g., Secor and Phillips 1997, Hailey 1998, Secor and
Faulkner 2002, Grayson et al. 2005, McCue et al. 2005, Secor and Boehm 2006). In such
experiments, it is difficult to disentangle the effects of nutritional composition from other factors.
Few studies have compared SDA responses of ectotherms fed prey types that are similar
in nutritional composition, but different in morphology. An intriguing result of one study was
that Burmese pythons (Python molurus) fed pureed mice exhibited higher SDA responses than
those fed intact mice (McCue et al. 2005). This counterintuitive result suggests that meal
structure may make an important contribution to the magnitude and character of the SDA
response in snakes. Studies of SDA in amphibians support the notion that there is more that
contributes to the SDA response than simple nutritional composition. Grayson et al. (2005)
found no differences in SDA responses of horned frogs (Ceratophrys cranwelli) fed prey types
that differed in protein content by 46% (earthworms and newborn mice). In marine toads (Bufo
137

marinus), SDA also did not differ between earthworm and newborn mouse diets, but was
elevated for prey types that possess chitinous exoskeletons (crickets and superworms; Secor and
Faulkner 2002).
We compared SDA responses of snakes fed prey types that were similar in nutritional
composition but substantially different in morphology. We hypothesized that A. talpoideum
would be less costly to digest than L. marginatus because A. talpoideum lack scales, spiny fin
rays, or other presumably difficult to digest materials. Surprisingly, we found that SDA profiles
were similar for snakes digesting the two prey types. This result supports the general conclusion
that nutritional composition of prey is the strongest determinant of SDA in snakes. However, we
did detect slight differences between the prey types in the shapes of the SDA curves, (time to
50% and 75% decrease from peak O2 consumption), suggesting that these prey morphologies
may have subtle effects on digestive metabolism. Although the biological relevance of these
differences is unknown, it is possible that the slightly faster processing speed of A. talpoideum,
combined with the lack of post-feeding locomotor impairment, could allow for a greater turnover
rate of prey items, and consequently faster growth of snakes.
Post-feeding locomotor performance
Because they lack limbs, trunk morphology is tied more intimately to locomotion in
snakes than in other tetrapods. Indeed, snakes with slim, elongate morphology generally exhibit
faster maximum crawling speeds than those with stouter (heavier relative to length) body forms
(Ruben 1977, Shine and Shetty 2001, Shine et al. 2003). It follows that changes in snake body
morphology have direct effects on locomotor performance. For example, female snakes suffer
reduced locomotor performance during pregnancy, due in part to the added burden of offspring
(Seigel et al. 1987, Winne and Hopkins 2006). Despite the fact that snakes are generally unable
138

to reduce prey size by mastication, the flexible head morphology of most snakes allows them to
consume large meals relative to their body size. However, as with reproductive burden, the mass
of a large meal comes at a cost to locomotor performance, both on land (Garland and Arnold
1983, Mehta 2006) and in the water (Shine and Shetty 2001). For example, Ford and
Shuttlesworth (1986) found that checkered garter snakes (Thamnophis marcianus) fed large
meals (10 - 50% of snake body mass) exhibited reduced maximum sprint speed, average
crawling speed, and endurance duration. However, our study is the first to report differences in
locomotor performance associated with differences in prey morphology, independent of mass.
We found that although snakes fed both meal types experienced some post-prandial locomotor
impairment, snakes fed L. marginatus exhibited much more severely reduced crawling speeds
(45% reduction from pre-feeding) than those fed A. talpoideum. Moreover, those impediments
persisted longer in L. marginatus than A. talpoideum, with snakes fed L. marginatus continuing
to exhibit impaired crawling abilities for at least four days post-feeding. Our results are not
unexpected given that L. marginatus induced a much greater distortion of normal body form than
did A. talpoideum.
Presumably, reduction in sprint speed is associated with increased exposure to predators
and subsequent reduction in survivorship (Shine 1980, Husak 2006a, 2006b). At least one study
has reported a negative relationship between sprint speed and survivorship in juvenile garter
snakes (Thamnophis sirtalis; Jayne and Bennett 1990). Thus, all else being equal, juvenile N.
fasciata feeding on centrarchid fish could experience reduced survivorship compared to those
feeding on aquatic salamanders. Additionally, impaired locomotor ability may reduce snake’s
abilities to procure future prey items, ultimately reducing individual growth rates, slowing time
to maturity, and retarding population growth.
139

Implications for wetland conservation
Our results suggest that using resource availability as an index of habitat quality for
generalist predators is complex, requiring consideration of more than simple prey abundance or
even nutritional composition. For example, a cursory assessment of habitat quality, based solely
on prey abundance, might conclude that both the permanent and the fishless (isolated,
periodically dry) wetlands sampled in this study (Fig. 5.1a) represent suitable habitats for
juvenile watersnakes, because both harbor high abundances of potential prey. However, we have
shown that differences in prey morphology lead to substantial differences in overall quality of
dominant prey between the two habitat types. Whereas isolated wetlands contain abundant high-
quality prey (A. talpoideum), the most abundant (by biomass) prey type available in permanent
wetlands (centrarchid fish) are of inferior quality. Consuming centrarchid fish imposes
constraints on maximum prey size and feeding frequency and induces lengthened handling times
and impaired crawling speeds that presumably increase a snake’s risk of predation. Thus, in
permanent habitats, juvenile snakes would be forced to either persist on a lower quality diet or
resort to alternative prey types. Alternative prey could include those that are abundant but so
small that they must be captured in large quantities to meet energetic demands (e.g., Gambusia
and Fundulus) or those that are large but less abundant (e.g., adult anurans). Although they did
not measure relative abundance of prey, one case provides insight into how N. fasciata may deal
with this complex decision. In permanent cypress swamp habitats in Louisiana, juvenile N.
fasciata fed predominantly on Gambusia and other small fish, while adults fed predominantly on
frogs (Mushinsky et al. 1982), with neither demographic preying extensively on centrarchid fish,
despite their availability (Mushinsky and Hebrard 1977, Kofron 1978).
140

The ecological value of fishless wetlands has received much recent attention (Whigham
1999, Semlitsch and Bodie 1998), particularly in light of recent weakening of federal protection
for wetlands that are isolated from navigable waterways (Zedler et al. 2001, Downing et al.
2003). Isolated, often fishless, wetlands have received particular recognition as hotspots for
amphibian biodiversity and productivity (Semlitsch and Bodie 1998, Gibbons et al. 2006). We
demonstrate that aquatic salamanders (e.g., A. talpoideum), which are often the dominant
amphibian in fishless wetlands in the southeastern United States, represent an optimal prey for
juvenile aquatic snakes. The ability of snakes to consume very large salamanders with relatively
minor impediments to locomotor performance, may facilitate the high abundances and rapid
individual and population growth of N. fasciata we observed in fishless wetland habitats (Winne
2008), despite snake population declines during extreme droughts (Seigel, Gibbons and Lynch
1995, Willson et al. 2006). In fact, as N. fasciata disperse from these habitats during droughts
(Seigel et al. 1995), and have subsequently been recorded moving to other wetlands at least 3 km
away (J. D. Willson, Christopher Winne and Thomas Luhring, unpublished data), fishless
wetlands may act as source populations for aquatic snakes across the landscape. Wetland loss has
been cited as a major contributor to the imperilment of snake species (Todd et al. in press). For
example, copperbelly watersnakes (N. erythrogaster neglecta) prefer ephemeral wetland habitats
and move extensively between wetlands to capitalize on seasonally-abundant amphibian prey
resources (Roe et al. 2004). Thus, loss or fragmentation of isolated, fishless wetlands has been
proposed as the major threat to federally-threatened northern N. e. neglecta populations (Roe et
al. 2003, 2004, 2006). Our results demonstrate that the morphological characteristics of
amphibians make them ideal prey for aquatic snakes, underscoring the importance of fishless
wetlands in snake conservation.
141

ACKNOWLEDGEMENTS
We thank J. Whitfield Gibbons for his support and encouragement. Additionally, we
thank Andrew Durso and Evan Eskew for collecting data on prey availability and Sarah DuRant,
Brian Todd, and Christopher Winne for advice on design and statistical analyses. Michael
Dorcas, Sarah DuRant, J. Whitfield Gibbons, and Jerry Husak provided insightful comments on
the manuscript. Snakes were collected under South Carolina Department of Natural Resources
scientific collection permits (G-05-03), and procedures used in the study were approved by the
University of Georgia animal care and use committee (AUP A2005-10102-c2). This research
was supported by the National Science Foundation (Graduate Research Fellowship to JDW and
I0B-0615361 to WAH), a Grant-in-aid of Research to JDW from the Society for Integrative and
Comparative Biology, and by the Department of Energy under Award Number DE-FC09-
07SR22506 to the University of Georgia Research Foundation.
LITERATURE CITED
Andrade, D. V., A. P. Cruz-Neto, A. S. Abe, and T. Wang. 2005. Specific dynamic action in ectothermic vertebrates: a review of determinants of postprandial metabolic responses in fishes, amphibians, and reptiles. Pages 142-174 in J. M. Starck and T. Wang, editors. Physiological and Ecological Adaptations to Feeding in Vertebrates. Science Publishers, Enfield, NH, USA.
Andreadis, P. T. and G. M. Burghardt. 2005. Unlearned appetite controls: watersnakes (Nerodia)
take smaller meals when they have the choice. Journal of Comparative Psychology 119:304-310.
Arnold, S. J. 1993. Foraging theory and prey-size-predator-size relations in snakes. Pages 87-115
in R. A. Seigel and J. T. Collins, editors. Snakes: ecology and behavior. McGraw-Hill, Inc., New York, New York, USA.
Aubret, F., X. Bonnet, and D. Bradshaw. 2007. Food versus risk: foraging decision in young
Tiger snakes, Notechis scutatus. Amphibia-Reptilia 28:304-308.
142

Bennett, A. F. 1980. The thermal dependence of lizard behavior. Animal Behaviour 28:752-762. Bennett, A. F., and W. R. 1976. Metabolism. in C. Gans, editor. Biology of the Reptilia, vol. 5.
Physiology A. Academic Press, New York. Brown, C. R. and J. N. Cameron. 1991a. The induction of specific dynamic action in the channel
catfish by infusion of essential amino acids. Physiological Zoology 64:276-297. Brown, C. R. and J. N. Cameron. 1991b. The relationship between specific dynamic action
(SDA) and protein synthesis rates in the channel catfish. Physiological Zoology 64:298-309.
Crowder, L. B. and W. E. Cooper. 1982. Habitat structural complexity and the interaction
between bluegills and their prey. Ecology 63:1802-1813. Cruz-Neto, A. P., D. V. Andrade, and A. S. Abe. 2001. Energetic and physiological correlates of
prey handling and ingestion in lizards and snakes. Comparative Biochemistry and Physiology a-Molecular and Integrative Physiology 128:515-533.
Cundall, D. 1987. Functional Ecology. Pages 253-301 in R. A. Seigel, J. T. Collins, and S. S.
Novak, editors. Snakes: ecology and evolutionary biology. The Blackburn Press, Caldwell, New Jersey, USA.
Diaz, J. A. and L. M. Carrascal. 1991. Regional distribution of a Mediterranean lizard: influence
of habitat cues and prey abundance. Journal of Biogeography 18:291-297. Dorcas, M. E. and J. D. Willson. 2009. Innovative methods for studies of snake ecology and
conservation. in S. J. Mullin and R. A. Seigel, editors. Snakes: applied ecology and conservation. Cornell University Press, Ithaca, New York, USA. In press.
Downing, D. M., C. Winer, and L. D. Wood. 2003. Navigating through Clean Water Act
jurisdiction: a legal review. Wetlands 23:475-493. DuRant, S. E., W. A. Hopkins, and L. G. Talent. 2007. Impaired terrestrial and arboreal
locomotor performance in the western fence lizard (Sceloporus occidentalis) after exposure to an AChE-inhibiting pesticide. Environmental Pollution 149:18-24.
Feder, M. E. and S. J. Arnold. 1982. Anaerobic metabolism and behavior during predatory
encounters between snakes (Thamnophis elegans) and salamanders (Plethodon jordani). Oecologia 53:93-97.
Ford, N. B. and G. A. Shuttlesworth. 1986. Effects of variation in food intake on locomotory
performance of juvenile garter snakes. Copeia 1986:999-1001. Garland, T. and S. J. Arnold. 1983. Effects of a full stomach on locomotory performance of
juvenile garter snakes (Thamnophis elegans). Copeia 1983:1092-1096.
143

Gibbons, J. W. and M. E. Dorcas. 2004. North American watersnakes: a natural history. University of Oklahoma Press, Norman, Oklahoma, USA.
Gibbons, J. W. and R. D. Semlitsch. 1991. Guide to the reptiles and amphibians of the Savannah
River Site. University of Georgia Press, Athens, Georgia, USA. Gibbons, J. W., C. T. Winne, D. E. Scott, J. D. Willson, X. Glaudas, K. M. Andrews, B. D.
Todd, L. A. Fedewa, L. Wilkinson, R. N. Tsaliagos, S. J. Harper, J. L. Greene, T. D. Tuberville, B. S. Metts, M. E. Dorcas, J. P. Nestor, C. A. Young, T. Akre, R. N. Reed, K. A. Buhlmann, J. Norman, D. A. Croshaw, C. Hagen, and B. B. Rothermel. 2006. Remarkable amphibian biomass and abundance in an isolated wetland: Implications for wetland conservation. Conservation Biology 20:1457-1465.
Godley, J. S. 1980. Foraging ecology of the striped swamp snake, Regina alleni, in Southern
Florida. Ecological Monographs 50:411-436. Grayson, K. L., L. W. Cook, M. J. Todd, D. Pierce, W. A. Hopkins, R. E. Gatten, and M. E.
Dorcas. 2005. Effects of prey type on specific dynamic action, growth, and mass conversion efficiencies in the horned frog, Ceratophrys cranwelli. Comparative Biochemistry and Physiology 141:298-304.
Greene, H. W. 1983. Dietary correlates of the origin and radiation of snakes. American Zoologist
23:431-441. Hailey, A. 1998. The specific dynamic action of the omnivorous tortoise Kinixys spekii in
relation to diet, feeding pattern, and gut passage. Physiological Zoology 71:57-66. Holem, R. R., W. A. Hopkins, and L. G. Talent. 2006. Effect of acute exposure to malathion and
lead on sprint performance of the western fence lizard (Sceloporus occidentalis). Archives of Environmental Contamination and Toxicology 51:111-116.
Hopkins, W. A., J. H. Roe, T. Philippi, and J. D. Congdon. 2004. Standard and digestive
metabolism in the banded water snake, Nerodia fasciata fasciata. Comparative Biochemistry and Physiology 137:141-149.
Hopkins, W. A., J. H. Roe, J. W. Snodgrass, B. P. Staub, B. P. Jackson, and J. D. Congdon.
2002. Effects of chronic dietary exposure to trace elements on banded water snakes (Nerodia fasciata). Environmental Toxicology and Chemistry 21:906-913.
Hopkins, W. A., C. L. Rowe, and J. D. Congdon. 1999. Elevated trace element concentrations
and standard metabolic rate in banded water snakes (Nerodia fasciata) exposed to coal combustion wastes. Environmental Toxicology and Chemistry 18:1258-1263.
Hopkins, W. A. and C. T. Winne. 2006. Influence of body size on swimming performance of
four species of neonatal natricine snakes acutely exposed to a cholinesterase-inhibiting pesticide. Environmental Toxicology and Chemistry 25:1208-1213.
144

Hopkins, W. A., C. T. Winne, and S. E. DuRant. 2005. Differential swimming performance of two natricine snakes exposed to a cholinesterase-inhibiting pesticide. Environmental Pollution 133:531-540.
Huey, R. B., P. H. Niewiarowski, J. Kaufmann, and J. C. Herron. 1989. Thermal biology of
nocturnal ectotherms: is sprint speed of geckos maximal at low body temperatures? Physiological Zoology 62:488-504.
Husak, J. F. 2006a. Does speed help you survive? A test with collared lizards of different ages.
Functional Ecology 20:174-179. Husak, J. F. 2006b. Does survival depend on how fast you can run or how fast you do run?
Functional Ecology 20:1080-1086. Ineich, I., X. Bonnet, F. Brischoux, M. Kulbicki, B. Seret, and R. Shine. 2007. Anguilliform
fishes and sea kraits: neglected predators in coral-reef ecosystems. Marine Biology 151:793-802.
Jayne, B. C. and A. F. Bennett. 1990. Selection on locomotor performance in a natural
population of garter snakes. Evolution 44:1204-1229. Keck, M. B. 1994. A new technique for sampling semi-aquatic snake populations.
Herpetological Natural History 2:101-103. Kitaysky, A. S., E. V. Kitaiskaia, J. F. Piatt, and J. C. Wingfield. 2006. A mechanistic link
between chick diet and decline in seabirds? Proceedings of the Royal Society B-Biological Sciences 273:445-450.
Kleiber, M. 1975. The fire of life: an introduction to animal energetics. Krieger, Huntington,
New York, USA. Kley, N. J. and E. L. Brainerd. 2002. Post-cranial prey transport mechanisms in the black
pinesnake, Pituophis melanoleucus lodingi: an x-ray videographic study. Zoology 105:153-164.
Kofron, C. P. 1978. Foods and habitats of aquatic snakes (Reptilia, Serpentes) in a Louisiana
swamp. Journal of Herpetology 12:543-554. Krause, M. A. and G. M. Burghardt. 2001. Neonatal plasticity and adult foraging behavior in
garter snakes (Thamnophis sirtalis) from two nearby, but ecologically dissimilar, habitats. Herpetological Monographs:100-123.
Mayntz, D., S. Toft, and F. Vollrath. 2003. Effects of prey quality and availability on the life
history of a trap-building predator. Oikos 101:631-638.
145

McCauley, D. J., F. Keesing, T. P. Young, B. F. Allan, and R. M. Pringle. 2006. Indirect effects of large herbivores on snakes in an African savanna. Ecology 87:2657-2663.
McCue, M. D., A. F. Bennett, and J. W. Hicks. 2005. The effect of meal composition on specific
dynamic action in Burmese pythons (Python molurus). Physiological and Biochemical Zoology 78:182-192.
Mehta, R. S. 2006. Meal size effects on antipredator behavior of hatchling trinket snakes, Elaphe
helena. Ethology 112:649-656. Mullin, S. J. and R. J. Cooper. 2000. The foraging ecology of the gray rat snake (Elaphe obsoleta
spiloides). II. Influence of habitat structural complexity when searching for arboreal avian prey. Amphibia-Reptilia 21:211-222.
Mullin, S. J. and H. R. Mushinsky. 1997. Use of experimental enclosures to examine foraging
success in water snakes: A case study. Journal of Herpetology 31:565-569. Mushinsky, H. R. 1987. Foraging ecology. Pages 302-321 in R. A. Seigel, J. T. Collins, and S. S.
Novak, editors. Snakes: ecology and evolutionary biology. The Blackburn Press, Caldwell, New Jersey, USA.
Mushinsky, H. R. and J. J. Hebrard. 1977. Food partitioning by five species of water snakes in
Louisiana. Herpetologica 33:162-166. Mushinsky, H. R., J. J. Hebrard, and D. S. Vodopich. 1982. Ontogeny of water snake foraging
ecology. Ecology 63:1624-1629. Reaney, L. T. and M. J. Whiting. 2003. Are female tree agamas (Acanthocercus atricollis
atricollis) turned on by males or resources? Ethology Ecology and Evolution 15:19-30. Roe, J. H., J. Gibson, and B. A. Kingsbury. 2006. Beyond the wetland border: estimating the
impact of roads for two species of water snakes. Biological Conservation 130:161-168. Roe, J. H., B. A. Kingsbury, and N. R. Herbert. 2003. Wetland and upland use patterns in semi-
aquatic snakes: Implications for wetland conservation. Wetlands 23:1003-1014. Roe, J. H., B. A. Kingsbury, and N. R. Herbert. 2004. Comparative water snake ecology:
conservation of mobile animals that use temporally dynamic resources. Biological Conservation 118:79-89.
Ruben, J. A. 1977. Morphological correlates of predatory modes in the coachwhip (Masticophis
flagellum) and rosy boa (Lichanura roseofusca). Herpetologica 33:1-6. Secor, S. M. and M. Boehm. 2006. Specific dynamic action of ambystomatid salamanders and
the effects of meal size, meal type, and body temperature. Physiological and Biochemical Zoology 79:720-735.
146

Secor, S. M. and J. M. Diamond. 2000. Evolution of regulatory responses to feeding in snakes. Physiological and Biochemical Zoology 73:123-141.
Secor, S. M. and A. C. Faulkner. 2002. Effects of meal size, meal type, body temperature, and
body size on the specific dynamic action of the marine toad, Bufo marinus. Physiological and Biochemical Zoology 75:557-571.
Secor, S. M. and J. A. Phillips. 1997. Specific dynamic action of a large carnivorous lizard,
Varanus albigularis. Comparative Biochemistry and Physiology a-Physiology 117:515-522.
Seigel, R. A., J. W. Gibbons, and T. K. Lynch. 1995. Temporal changes in reptile populations:
effects of a severe drought on aquatic snakes. Herpetologica 51:424-434. Seigel, R. A., M. M. Huggins, and N. B. Ford. 1987. Reduction in locomotor ability as a cost of
reproduction in gravid snakes. Oecologia 73:481-485. Semlitsch, R. D. and J. R. Bodie. 1998. Are small, isolated wetlands expendable? Conservation
Biology 12:1129-1133. Shine, R. 1980. Costs of reproduction in reptiles. Oecologia 46:92-100. Shine, R. 1991. Why do larger snakes eat larger prey items? Functional Ecology 5:493-502. Shine, R. and X. Bonnet. 2000. Snakes: a new 'model organism' in ecological research? Trends
in Ecology and Evolution 15:221-222. Shine, R., H. G. Cogger, R. R. Reed, S. Shetty, and X. Bonnet. 2003. Aquatic and terrestrial
locomotor speeds of amphibious sea-snakes (Serpentes, Laticaudidae). Journal of Zoology 259:261-268.
Shine, R., P. S. Harlow, J. S. Keogh, and Boeadi. 1998. The influence of sex and body size on
food habits of a giant tropical snake, Python reticulatus. Functional Ecology 12:248-258. Shine, R. and S. Shetty. 2001. Moving in two worlds: aquatic and terrestrial locomotion in sea
snakes (Laticauda colubrina, Laticaudidae). Journal of Evolutionary Biology 14:338-346.
Snodgrass, J. W., A. L. Bryan, R. F. Lide, and G. M. Smith. 1996. Factors affecting the
occurrence and structure of fish assemblages in isolated wetlands of the upper coastal plain, USA. Canadian Journal of Fisheries and Aquatic Sciences 53:443-454.
Starr, C. R. and L. K. P. Leung. 2006. Habitat use by the Darling Downs population of the
grassland earless dragon: Implications for conservation. Journal of Wildlife Management 70:897-903.
147

Todd, B.D., J. D. Willson, and J. W. Gibbons. In press. The global status of reptiles and causes of their decline. in D. W. Sparlin, G. Linder, and C. A. Bishop, editors. Ecotoxicology of reptiles and amphibians, 2nd edition. SETAC Press, Pensacola, Florida, USA.
Vincent, S. E., B. R. Moon, A. Herre, and N. J. Key. 2007. Are ontogenetic shifts in diet linked
to shifts in feeding mechanics? Scaling of the feeding apparatus in the banded watersnake Nerodia fasciata. Journal of Experimental Biology 210:2057-2069.
Vincent, S. E., B. R. Moon, R. Shine, and A. Herrel. 2006. The functional meaning of "prey
size" in water snakes (Nerodia fasciata, Colubridae). Oecologia 147:204-211. Whigham, D. F. 1999. Ecological issues related to wetland preservation, restoration, creation and
assessment. Science of the Total Environment 240:31-40. White, T. C. R. 2008. The role of food, weather and climate in limiting the abundance of
animals. Biological Reviews 83:227-248. Wilder, S. M. and A. L. Rypstra. 2008. Diet quality affects mating behaviour and egg production
in a wolf spider. Animal Behaviour 76:439-445. Willson, J. D., C. T. Winne, M. E. Dorcas, and J. W. Gibbons. 2006. Post-drought responses of
semi-aquatic snakes inhabiting an isolated wetland: Insights on different strategies for persistence in a dynamic habitat. Wetlands 26:1071-1078.
Willson, J. D., C. T. Winne, and M. B. Keck. 2008. Empirical tests of biased body size
distributions in aquatic snake captures. Copeia 2008:401-408. Winne. C.T. 2008. Seminatrix pygaea, a model of ecological resilience to dynamic habitats.
Ph.D. dissertation, University of Georgia, Athens, Georgia, USA. Winne, C. T. and W. A. Hopkins. 2006. Influence of sex and reproductive condition on terrestrial
and aquatic locomotor performance in the semi-aquatic snake Seminatrix pygaea. Functional Ecology 20:1054-1061.
Winne, C. T., J. D. Willson, K. M. Andrews, and R. N. Reed. 2006. Efficacy of marking snakes
with disposable medical cautery units. Herpetological Review 37:52-54. Zedler, J., L. Shabman, V. Alvarez, R. O. Evans, R. C. Gardner, J. W. Gibbons, J. W. Gilliam, C.
A. Johnston, W. J. Mitsch, K. Prestegaard, A. M. Redmond, C. Simenstad, and R. E. Turner. 2001. Compensating for Wetland Losses under the Clean Water Act. National Academy Press, Washington, D.C., USA.
148

Table 5.1 Nutritional composition of Ambystoma talpoideum and Lepomis marginatus. Values
are reported as means ± 1 SE relative to the wet mass of the prey item. Significant differences
between prey types (ANCOVA; dependent variables: dry mass (g), protein (g), lipid (g), kJ;
covariate: wet mass) are indicated in bold.
Ambystoma Lepomis F1,5 p
% H2O 81.33 ± 0.32 75.93 ± 0.42 59.59 < 0.001
% Protein 12.22 ± 0.35 14.62 ± 0.37 15.17 0.011
% Lipid 2.23 ± 0.18 2.37 ± 0.25 0.11 0.749
kJ / g 4.06 ± 0.12 4.63 ± 0.14 3.59 0.117
149

Table 5.2 Metabolic parameters (mean ± 1 SE) of Nerodia fasciata fed prey items (Ambystoma
talpoideum and Lepomis marginatus) equal to 25% of snake body mass and held at 25 °C.
Significant differences between prey types (MANOVA; individual as blocking factor) are
indicated in bold. Differences between prey types in SDA expressed as total kJ expended were
not tested statistically because this parameter is completely autocorrelated with SDA expressed
as ml O2 consumed.
Parameter measured (units) Ambystoma Lepomis F1,10 P
N 11 11
Mass (g) 18.63 ± 0.49 18.31 ± 0.34
SMR (ml O2/h) 0.65 ± 0.06 0.67 ± 0.06 0.59 0.46
Peak O2 rate (ml O2/h) 4.00 ± 0.14 4.02 ± 0.09 0.00 0.98
Digestive scope (peak O2/SMR) 6.53 ± 0.40 6.54 ± 0.65 3.23 0.10
Time to peak O2 (h) 31.75 ± 2.91 24.91 ± 2.00 2.22 0.17
Time to 50% decrease from peak (h) 68.27 ± 1.53 74.33 ± 2.19 5.77 0.04
Time to 75% decrease from peak (h) 81.21 ± 1.72 95.94 ± 5.95 5.66 0.04
SDA
Total ml O2 consumed 229.54 ± 7.01 242.67 ± 8.88 0.49 0.50
Total kJ expended 4.54 ± 0.18 4.80 ± 0.18
SDA coefficient (% ingested E utilized) 23.83 ± 0.47 22.98 ± 0.66 0.03 0.87
150

0
1
2
3
4
5
6
7
1 2 3 4 5 6
0.0
0.5
1.0
1.5
2.0
1 2 3 4 5 6
Permanent (n = 8)
Isolated, periodically dry (n = 8)
Centra
rchid
fish
Gambu
sia
and Fun
dulus
Other f
ish
Ambysto
ma
talpo
ideum
Tadpo
lesAdu
lt Anu
rans
Cap
ture
s pe
r tra
p ni
ght
Mas
s pe
r tra
p ni
ght (
g)(a)
(b)
Figure 5.1 Prey profiles of permanent (n = 8) and isolated, periodically dry (n = 8) wetlands located on the Savannah River Site, South Carolina, USA, based on prey numerical abundance (a) and biomass (b). “Permanent” wetlands either had not dried within 20 yrs or were occasionally connected to permanent water bodies. “Isolated, periodically dry” wetlands dried during severe droughts and were isolated from other water bodies. Relative abundance of prey was measured as captures per trap-night in aquatic funnel traps (minnow traps). Prey are lumped into functional groups including centrarchid fish (genera Acantharchus, Centrarchus, Enneacanthus, Lepomis, and Micropterus), Gambusia and Fundulus, other fish (genera Ameiurus, Amia, Aphredoderus, Erimyzon, Esox, and Umbra), larval and paedomorphic Ambystoma talpoideum, anuran tadpoles, and adult anurans (genera Acris,Bufo, Hyla, and Rana).
151

N. f
asci
ata
abun
danc
e (In
divi
dual
s pe
r 100
trap
nig
hts)
0
1
2
3
4
5
6
Permanent Isolated,periodically dry
Figure 5.2 Mean (± 1 SE) abundance of Nerodia fasciata within permanent (n = 8) and isolated, periodically dry (n = 8) wetlands located on the Savannah River Site, South Carolina, USA. Snake relative abundance was assessed by calculating the number of individual snakes captured at each wetland per 100 trap nights of sampling with aquatic funnel traps (minnow traps). In total, 132 N. fasciata were captured in the 16 wetlands.
152

Figure 5.3 Morphological differences between paedomorphic Ambystoma talpoideum and Lepomis marginatus, including (a) maximum width and (b) maximum height of prey. Anatomical differences are evident in a photograph (c) of individuals of the two prey types of equal mass (6.6 g). Post-ingestion differences between the prey types are evident in a time-series of body distension (maximum body width) in snakes fed L. marginatus or A. talpoideum weighing 25% of snake body mass (d).
153

Figure 5.4 Number of prey consumed (mean ± 1 SE) by juvenile Nerodia fasciata fed Ambystoma talpoideum or Lepomis marginatus of different sizes (% of snake body mass). (a) Reports results of an experiment comparing number of prey consumed between prey types at relatively small meal sizes. In (a) snakes (n = 10 per size and prey type treatment) were offered A. talpoideum or L. marginatus of four size classes (20%, 35%, 50%, and 65% of snake body mass) in excess. (b) Reports results of an experiment determining the maximum size of A. talpoideum that can be consumed by juvenile N. fasciata. In (b) snakes (n = 8 – 10 per size treatment) were offered only A. talpoideum of four larger size classes in excess.
154

Figure 5.5 Handling times (mean ± 1 SE) of juvenile Nerodia fasciata fed Ambystoma talpoideum or Lepomis marginatus of different sizes (% of snake body mass). Handling time was defined as the time elapsed from the time the snake oriented the prey item into swallowing position until the first tongue flick following swallowing of the prey item.
155

Figure 5.6 Mean (± 1 SE) oxygen consumption by juvenile Nerodia fasciata(n = 11 per treatment) fed an Ambystoma talpoideum (●) or Lepomis marginatus (○) equal to 25% of the snake’s body mass at 25 °C. Dashed lines represent the mean SMR of snakes in each treatment group based on the lower quartile values of fasted snakes measured for 48 h prior to feeding.
156

Figure 5.7 Post-feeding locomotor impairment of juvenile Nerodia fasciata (n = 8 per treatment) fed Ambystoma talpoideum (●) and Lepomis marginatus (○). Plots represent mean (± 1 SE) maximum crawling speeds over a 60 cm interval 18 h prior to feeding and 1 h, 24 h, 48 h, 72 h, 96 h, and 120 h after consuming a L. marginatus or A. talpoideum equal to 25% of the snake’s body mass.
157

CHAPTER 6
THE ROLE OF ECTOTHERMY IN VERTEBRATE PREDATOR-PREY DYNAMICS: DOES
INCREASING METABOLIC EFFICIENCY ALTER THE STABILITY OF
PREDATOR-PREY INTERACTIONS?5
5 Willson, J. D. and P. Rohani. To be submitted to Proceedings of the Royal Society B.
158

INTRODUCTION
Predator-prey interactions have long fascinated ecologists, prompting extensive
theoretical and empirical investigation. Although the relative importance of bottom-up (resource-
based), top-down (predation-based), and extrinsic (climate-based) forces in regulating animal
populations remains hotly debated, the study of predator-prey interactions has shed considerable
light on numerous ecological processes. Among the most fruitful in unraveling the impacts of
predation on prey populations have been investigations of the characteristically cyclic dynamics
of high latitude rodents, particularly microtine voles and lemmings (reviewed in Hanski et al.
2001; Korpimaki et al. 2004). A major conclusion of this vast body of literature has been that
life-history differences between predator functional groups can result in profound differences in
how predators and prey interact. For example, geographic differences in rodent-predator
dynamics can result from differences in the relative abundance of specialist and generalist
predators within ecosystems. The ability of generalist predators to switch prey types allows them
to maintain high population densities and respond rapidly to increases in prey abundance,
stabilizing population dynamics (Andersson & Erlinge 1977; Hanski, Hansson & Henttonen
1991).
Snakes have historically been underrepresented in the ecological literature (Shine &
Bonnet 2000). Although snakes have recently gained popularity as study animals, snake
population biology and particularly how snakes interact with prey populations remains poorly
understood (Gragg et al. 2007; Dorcas & Willson 2009). For example, in a recent review Nowak,
Theimer & Schuett (2008) found that of 301 studies of predator-prey dynamics, none focused on
terrestrial ectothermic predators. Snakes are strictly carnivorous and many species prey partially
or exclusively on small mammals (Mushinsky 1987). Thus, many snakes fall into the category of
159
specialist predators – species whose survival, growth, and reproduction are tied strongly to
abundance of one prey species, or group of related species, though they may occasionally feed
on other prey types – as the term is used in the predator-prey literature (Andresson & Erlinge
1977). Although secretive habits make snakes notoriously difficult to sample (Dorcas & Willson
2009), systematic studies have revealed that snakes can exist at incredibly high densities in some
ecosystems (e.g. 1200 per ha, Godley 1980; 274 per ha, Sun et al. 2001). Moreover, snakes
display a suite of physiological and life-history attributes that make them fundamentally different
from mammalian and avian predators and snakes are thought to epitomize the ‘low energy’
lifestyle characteristic of ectothermic vertebrates (Bonnet, Bradshaw & Shine 1998). For
example, snakes have extremely high assimilation efficiencies compared to endothermic
predators [e.g., Vipera berus (adder) 49% vs. Mustela nivalis (least weasel) 2.3%; Pough 1980].
Requiring little energy to maintain their metabolism, snakes may allocate additional food
ingested directly to storage, growth (juveniles), or reproduction (adults). However, the
population dynamic consequences of these physiological and life-history differences on predator-
prey interactions remains largely unexplored (but see Nowak, Theimer & Schuett 2008).
Although at least two field studies have considered snakes as potential rodent predators, or have
included snakes in predator censuses (Lin & Batzli 1995; Norrdahl & Korpimaki 2002), to our
knowledge no studies have explicitly incorporated snake population dynamics into predator-prey
models.
Predator numerical responses describe the relationship between the number of predators
and prey abundance (Andersson & Erlinge 1977). Considerable attention has been paid to how
predators differ in their numerical response curves. Migratory or mobile predators can show
rapid numerical responses by congregating or migrating to areas of high prey density (Andersson
160

& Erlinge 1977; Hanski, Hansson & Henttonen 1991). Alternatively, among non-migratory
(resident) specialist predators, the numerical response is primarily due to birth and death,
resulting in a time-lagged response to changes in prey density (Andersson & Erlinge 1977;
Hanski, Hansson & Henttonen 1991). Snakes are generally non-migratory and have small home
ranges compared to comparable endothermic predators. Thus, specialist snake species
undoubtedly display lagged numerical responses, perhaps even more strongly-lagged than those
of endothermic specialists (Nowak, Theimer & Schuett 2008). However, the low energetic needs
of ectotherms, combined with the ability to efficiently translate captured prey into reproduction
or storage, make the shapes of vital rate curves (defined as the relationships between
reproductive output, growth, or survival and prey abundance) profoundly different from those of
endotherms (Nowak, Theimer & Schuett 2008). Although the dynamic consequences of lagged
versus immediate numerical responses have been studied extensively, the sensitivity of vital rates
to changes in prey density and the consequences of shifts in the slopes of vital rate curves remain
largely unknown. Herein we compare numerical response and vital rate curves of endothermic
and ectothermic vertebrate predators. We then develop a generalized predator-prey model to
examine how shifting the shape (= slope) of vital rate curves within a resident specialist
predator-prey systems affects predator-prey dynamics. We find that incorporating vital rate
curves characteristic of ectothermic predators (specifically temperate snakes) is generally
stabilizing to predator-dynamics, suggesting that these predators may exhibit relatively stable
relationships with their prey in some cases.
Vital rates and the ectotherm numerical response
A conceptual representation of prey (= energy) allocation illustrates differences in
allocation strategies between endothermic and ectothermic vertebrate predators (Fig. 6.1). Due to
161

endotherms’ capabilities for high activity levels and rapid digestion, the upper limit of prey
capture (μmax, determined by handling/processing time) is much higher for endotherms than
ectotherms (Nowak, Theimer & Schuett 2008). Likewise, a large proportion of the energy
accrued by endotherms is allocated to maintenance or is lost as ‘surplus killing’ or ‘waste’ and is
not translated into increased growth, reproduction, or survival. Thus, because only a relatively
small portion of an endothermic predator’s energy budget is allocated to reproduction, a direct
relationship between overall prey capture rate and vital rates (reproductive output, growth, or
survival) would not be expected. More likely, endotherms exhibit steeply-sloped correlations
between vital rates and prey consumption above a threshold consumption rate necessary to meet
metabolic demands (μcrit). Indeed, authors have noted the inappropriateness of assuming linear
relationships between vital rates (e.g., reproduction) and prey abundance in models of
endothermic vertebrate predator-prey interactions (Hanski & Korpimaki 1995; Hanski et al.
2001).
Field data corroborate the presence of steep, approaching threshold, numerical responses
in endothermic resident specialist predators. Both stoats (Mustela erminea) in Greenland and
lynx (Lynx canadensis) the Yukon, showed steep lagged numerical responses to shifts in rodent
density with apparent thresholds above which predator abundance increased exponentially in
relation to prey abundance (Fig. 6.2a; O’Donogue et al. 1997; Gilg, Hanski & Sittler 2003; Gilg
et al. 2006). Such responses are likely driven by extremely low reproductive output and/or low
survivorship below threshold prey densities and rapid increase to maximum reproductive rate
above thresholds. Few direct estimates of survivorship are available for specialist mammalian
predators, but rapid rates of population decline following rodent population crashes (e.g., Hanski
& Korpimaki 1995; King 1983) suggest that survivorship must be low in these cases. Likewise,
162

several authors have noted frequent cases of complete reproductive failure during years with low
prey abundance across several mammalian specialist predator taxa including least weasels
(Tapper 1979; Hanski & Korpimaki 1995) and lynx (O’Donogue et al. 1997).
Ectotherms, conversely, are characterized by low metabolic demands (Pough 1980) that
may be altered by reducing activity or physiological state. Although increased handling and
processing time reduces the maximum rate of energy acquisition in ectotherms (Nowak, Theimer
& Schuett 2008), only a small portion of the energy budget must be allocated to maintenance
(Fig. 6.1). Ectotherms have not been documented to engage in surplus killing (with the exception
of occasional reports of snakes killing prey too large for them to swallow) and process captured
prey very efficiently (Pough 1980), thus, the majority of acquired energy above μcrit can be
allocated directly into reproductive output, growth or storage. Moreover, low metabolic demands
facilitate use of stored energy to buffer against resource shortages, which weakens the
relationship between prey availability and survivorship. As a result, we expect vital rate curves
of ectothermic predators to relate more linearly to prey abundance and have shallower slopes
than those of endotherms.
Field data support these expected relationships. Whereas endotherms displayed steep,
threshold-like numerical responses to rodent density (Fig. 6.2a), Australian water pythons (Liasis
fuscus) displayed a much weaker and more linear lagged numerical response (Fig. 6.2b; Madsen
et al. 2006). Indeed, variation in python numbers was only ca. two-fold, despite order-of-
magnitude variations in prey density. In addition, snakes displayed relatively minor shifts in
survivorship and reproduction in response to high variation in prey density (Fig. 6.2c, 2d). Even
in years of minimal prey abundance, annual survivorship never dropped much below 50%. As
opposed to endothermic predators that frequently experience complete reproductive failure
163

(Hanski & Korpimaki 1995; O’Donogue et al. 1997), some female pythons were reproductive in
all years. Snakes’ resilience to periods of low prey availability likely relates to their high
capacity for energy storage and their ability to reduce metabolic demands through behavior.
Indeed, female adders (Vipera aspis) can rely on stored energy and reproduce successfully even
in years when they do not capture a single prey item (Lourdais et al. 2003).
It is clear that endothermic specialist predators are characterized by steep vital rate curves
that do not relate linearly to overall prey consumption rate. Ecologists have accounted for this in
predator-prey models by either 1) representing the relationship between vital rates and prey
availability as a step function with a critical prey density, below which vital rates are zero and
above which vital rates rapidly increase to their maximum (e.g., Hanski & Korpimaki 1995;
Hanski et al. 2001; Korpimaki et al. 2002) or 2) representing the relationship as a smooth curve
with steep slope (e.g., Hanski & Korpimaki 1995). Ectotherms, rather than displaying thresholds,
are expected to show more linear relationships between vital rates and per capita prey
consumption, allowing them to translate increases in prey consumption into increased vital rates
up to the level where prey capture is limited by handling time. Below we formulate a
mathematical predator-prey model to explore the dynamic consequences of altering the slope of
vital rate curves and make predictions about the stability interactions between snakes and their
prey.
MODEL
General predator-prey model
Here we describe a general model of a temperate terrestrial vertebrate predator-prey
system, based largely on models of microtine rodents and their mammalian predators (e.g., May
164

1973; Hanski, Hansson & Henttonen 1991; Hanski & Korpimaki 1995; Turchin & Hanski 1997;
Hanski et al. 2001; Korpimaki et al. 2002). Consider a seasonally-reproducing non-migratory
specialist predator-prey system in which Rt and Pt are the total population sizes of the prey and
predator, respectively. Predators are divided into two age classes, juveniles (Jt) and adults (At).
The predators and prey interact in discrete time (1 yr time step) following a ratio-dependent
predation process (Korpimaki et al. 2002). If μmax is the maximum possible number of prey eaten
per predator per time-step (year) and β is the prey density at which predators consume half their
maximum number (half-satiation constant), the predator search area (ht; Maynard Smith &
Slatkin 1973) can be described by:
ht = )R (
max
t+βμ
and the proportion of prey surviving predation by:
)exp(),( ttttt PhPR −=ω
This function yields a type II functional response curve characteristic of resident specialist
predators, whose upper asymptote and slope are determined by μmax and β, respectively.
Additionally, the discrete-time framework induces an implicit time-lag also characteristic of non-
nomadic specialist predators.
We recognize that an ongoing debate exists regarding the choice between prey-dependent
and ratio-dependent functional responses (Abrams & Ginzburg 2000). Despite the fact that
snakes are non-territorial, we use a ratio-dependent predation process because: 1) Abrams &
Ginzburg (2000) suggest that purely prey-dependent functional responses are rare and list several
non-intuitive processes that may produce ratio-dependent functional responses and 2) ratio-
165

dependent responses in snakes are supported by field studies demonstrating that when adders
(Vipera berus) occur at high densities, they exhibit reduced growth rates due to exploitative
competition (Lindell & Forsman 1996).
In addition to predation, the prey population is mediated by its own intrinsic density-
dependent rate of population change (ψt):
⎟⎠
⎞⎜⎝
⎛ −
= KR
r
ttt
tt
eRω
ωψ1
),(
Where K is the prey carrying capacity and r is the maximum rate of population change.
We assume a specific sequence of demographic and predation events, with predation occurring
prior to intrinsic density-dependence. Biologically, this sequence is equivalent to most predation
occurring in the summer (a necessary caveat for temperate ectotherms) and prey density
dependence occurring in winter. Altering the sequence of these events has little qualitative effect
on our results. The iterative equation for the prey population can be written as:
tttttt RPRR ωψ=+ ),(1
In the general model, the predator population is regulated solely through effects of prey
density on predator survivorship. Given the proportion of the prey population surviving
predation (ωt), it follows that the proportion of prey consumed is (1- ωt) and the number of prey
consumed per predator is μt = Rt (1- ωt) / Pt. Thus, a function relating predator survivorship (θt)
to per capita prey consumption (μt) can be written as follows:
166

)exp(11),(
tcritttt PR
μμθ
−+= (Equation 1a)
where μcrit is the per capita prey consumption at 50% survivorship. Equation 1a produces a
sigmoid curve with a relatively steep slope, analogous to a threshold prey consumption rate
(μcrit), above which survivorship of predators is high and below which survivorship declines
rapidly to zero. Predators are allowed to kill additional prey beyond μcrit, up to μmax, although this
additional killing does not translate into increases in any predator vital rates (survivorship, birth
rate, or recruitment rate). Thus, for endotherms, the distance between μcrit and μmax is analogous
to the potential for surplus killing.
In the general model, all surviving juveniles at the end of a time step are recruited into the
adult stage and all surviving adults reproduce at their maximum litter size (BP). Likewise,
because predators are non-migratory, additions to the adult population are due solely to
recruitment of juveniles (i.e., no immigration or emigration occurs). Thus, the iterative equations
for the predator-prey system can be expressed in matrix form as:
ttt
tP
tt
tAJR
BAJR
⎥⎥⎥
⎦
⎤
⎢⎢⎢
⎣
⎡×⎥⎥⎥
⎦
⎤
⎢⎢⎢
⎣
⎡=
⎥⎥⎥
⎦
⎤
⎢⎢⎢
⎣
⎡
+θθθ
ωψ
000
00
1
(Equation 2a)
Modeling ectothermic predation
In Eq. 1a we define a survivorship vital rate function that is a sigmoid curve with a steep
slope. As noted above, because ectotherms have much lower energetic demands, their vital rates
are tied less tightly to current prey availability. We can simulate the effects of such resilience by
167

introducing a variable to Eq 1a that alters the slope of the survivorship curve (λ – the ‘degree of
ectothermy’). We can now define a general vital rate function ( tφ ) that has a variable slope:
λμμφ −−+
= 1)exp(11),(
tcritttt PR (Equation 1b)
Varying λ from 0 to 1 shifts the slope of the vital rate curve away from a steep, threshold-type
curve towards a linear relationship between per capita prey consumption (μt) and vital rates ( tφ ;
Fig. 6.3).
Prey-dependent survivorship model
The general model includes a survivorship function (θt) that can be considered an
extreme characterization of an endothermic predator with high and static metabolic demands. If
these demands are not met (μt < μcrit), survivorship declines rapidly to zero and surplus killing
above μcrit does not translate into higher vital rates. Because ectotherms have much lower
energetic demands, their survivorship is tied less tightly to current prey availability and they are
less prone to starvation during short-term prey shortages. We can simulate this difference by
replacing θt (general predator survivorship) with tφ (ectothermy-mediated survivorship). Now,
high values of λ produce a relatively linear relationship between survivorship and prey
consumption and ‘surplus killing’ (predation that does not translate into increased vital rates)
does not occur.
Prey-dependent birth model
Thus far, litter size has been considered a static parameter and all surviving predators
have been allowed to reproduce at their maximum litter size (BP). Again, this could be
168

considered an extreme characterization of an endothermic predator that has a fairly small
potential litter size and generally makes a ‘decision’ to reproduce at maximal rate or not
reproduce at all based on current prey availability. Comparatively, most large ectothermic
predators have relatively large maximum litter sizes and are able to adjust their litter size based
on prey availability. Alternatively, many species alter reproductive output by adjusting frequency
of reproduction, such that the birth function could also represent the proportion of females
reproducing, rather than litter size per female. We can model the influence of ectothermy on the
birth process by adjusting the maximum predator birth rate (BP) by tφ :
ttt
tPt
tt
tJAR
BAJR
⎥⎥⎥
⎦
⎤
⎢⎢⎢
⎣
⎡×
⎥⎥⎥
⎦
⎤
⎢⎢⎢
⎣
⎡=
⎥⎥⎥
⎦
⎤
⎢⎢⎢
⎣
⎡
+θθθφ
ωψ
000
00
1
(Equation 2b)
In Eq. 2b, when λ = 0, the model approximates a threshold response; below μcrit predator
reproduction declines rapidly to zero and above μcrit predator reproduction rapidly rises to its
maximum (BP). As λ increases, the relationship between number of offspring produced and prey
consumption becomes increasingly linear, such that instead to engaging in surplus killing, prey
consumption above μcrit is converted into additional offspring.
Prey-dependent recruitment model
Thus far, recruitment has been solely a function of time and survivorship. This is
analogous to the recruitment process of most endotherms, which display fairly static juvenile
periods, provided they survive to recruit. In most ectotherms, however, maturity is a function of
accumulated growth, rather than time, and many ectotherms exhibit highly plastic juvenile
periods that are tightly linked to resource availability. As in the previous models, we can
169

simulate the effects of ectothermy on growth and subsequent recruitment of juveniles by
introducing tφ to the recruitment function within the predator-prey matrix:
tttt
tPtt
tt
tAJR
BAJR
⎥⎥⎥
⎦
⎤
⎢⎢⎢
⎣
⎡×
⎥⎥⎥
⎦
⎤
⎢⎢⎢
⎣
⎡
−=⎥⎥⎥
⎦
⎤
⎢⎢⎢
⎣
⎡
+θθφθθφ
ωψ
0)1(0
00
1
(Equation 2c)
In Eq. 2c, recruitment rate is modified by per capita prey consumption and increasing values of λ
produce a more linear relationship between prey consumption and the proportion of juveniles
recruited into the adult stage. The transition from juvenile to adult is now a product of
recruitment ( tφ ) and survivorship (θt), while the quantity ( ) tt θφ−1 represents the number of
surviving juveniles that remain in the juvenile stage.
PARAMETER ESTIMATION
Although our model represents a generalized predator-prey system, it is based on models
of microtine rodents and mammalian predators (e.g., May 1973; Hanski, Hansson & Henttonen
1991; Hanski & Korpimaki 1995; Turchin & Hanski 1997; Hanski et al. 2001; Korpimaki et al.
2002). These studies have relied heavily on field data (their own and sources cited therein) to
parameterize their models, providing substantial information on northern European microtine
rodents and their predators. In northern Europe, the primary resident specialist predator of
microtine rodents is the least weasel (Mustela nivalis). This species is particularly interesting
from the perspective of this study because its basal metabolism is 2-3 times higher than would be
expected for a mammal of its size, presumably due to its elongate body form (Erlinge 1974), and
it readily engages in surplus killing (Oksanen, Oksanen & Fretwell 1985). Thus, the M. nivalis
170

represents and extreme characterization of an endothermic predator. Fortuitously, northern
Europe is also home to a common snake, the adder (Vipera berus), that also specializes on
microtine rodent prey (> 90% of snake diet, Lindell & Forsman 1996). Vipera berus is one of the
most heavily-studied snake species, providing data on population biology, diet, physiology, and
especially its responses to prey availability (Parker & Plummer 1987). Thus, the physiological
and life history attributes of least weasels and adders, coupled with the availability of data make
these species ideal model endothermic and ectothermic predators upon which to parameterize our
model. Estimated parameter values for weasels and adders are provided in Table 6.1, along with
parameter values used in model simulations. Of particular note, no previous studies have
calculated μcrit for V. berus directly. Thus, we estimated μcrit for V. berus by calculating the
number of voles necessary to meet the resting metabolic needs of an average-sized V. berus (125
g), using data provided in Lindell & Forsman (1996). We divided the mean resting metabolic
rate of V. berus (358 kJ/yr) by V. berus assimilation efficiency (0.836) to ascertain that each
adder must consume 428.23 kJ per year to survive. We then divided this value by the mean
energy content of a vole (61.04 kJ) to obtain the number of voles that must be consumed per
year. Finally, we divide this number by two since only female voles are considered in the model
to arrive at a μcrit value of 3.51 for V. berus (Table 6.1).
RESULTS
We simulated the general model across varying levels of ‘surplus killing’ (SK) and
predator birth rate (BP; Fig. 6.4). As the general model includes steep vital rate curves, broadly
representing an endothermic predator, the potential for SK in the general model is analogous to
the distance between μcrit and μmax. Thus, we simulated increasing levels of SK by holding μcrit
171

constant and varying μmax. Our results demonstrate that in the general model, increasing SK is
profoundly destabilizing to predator-prey dynamics (Fig. 6.4). In fact, except at very low BP,
only levels of SK below 25% produce stable annual cycles. Increasing SK above 25%, predator-
prey dynamics pass through small regions of stable multi-annual cycles but quickly move into
chaotic dynamics. Although higher levels of SK produce stable dynamics at very low BP (< 1),
only chaos or predator extinction occur when SK is increased above 120%. Increasing BP also
destabilizes predator-prey dynamics, with the most stable dynamics seen at very low rates of
predator reproduction (BP < 1). Due to the destabilizing effects of increasing SK and BP we
varied these parameters in further simulations to determine whether increasing the ‘degree of
ectothermy’ by varying the slopes of vital rate curves influences the stability of predator-prey
dynamics.
When the three model variants (survivorship, birth, and recruitment) were simulated
across varying levels of λ (‘degree of ectothermy’), SK, and BP, it was clear that increasing λ had
a generally stabilizing effect on predator-prey dynamics (Fig. 6.5). This trend was particularly
pronounced for the survivorship model (Fig. 6.5a, 6.5d), suggesting that an approximately linear
relationship between prey consumption and survivorship has a particularly strong stabilizing
effect on predator-prey interactions. At low values of λ, only very low values of SK and BP
produced stable dynamics. However, increasing λ resulted in much larger regions of stability. In
fact, increasing λ above 0.5 resulted in stable dynamics across large ranges of both SK and BP.
At values of λ between 0.5 and 0.9, stable dynamics were produced at levels of SK up to 150%
(Fig. 6.5a). Likewise, at levels of λ between 0.6 and 0.9, stability became insensitive to
maximum reproductive rate, with stable dynamics produced even at BP > 30 (Fig. 6.5d). In the
survivorship model, stable multiannual dynamics were only prevalent at relatively low values of
172
λ (λ < 0.6; Fig. 6.5a, 6.5d), suggesting that multiannual dynamics are more likely to occur in
endothermic predator-prey interactions.
The prey-dependent birth model also showed increasing regions of stability with
increasing λ (Fig. 6.5b, 6.5e). However, the effect was much less pronounced than that observed
in the survivorship model; with levels of SK above 5% or BP > 4 resulting in chaotic dynamics,
even at high levels of λ. Modifying the model to make recruitment proportional to prey
consumption had a slight negative effect on the relationship between SK and stability of
predator-prey interactions (Fig. 6.5c). However, varying λ in the recruitment model did influence
the stability of increases in BP (Fig. 6.5f). Increasing λ above 0.2 in this model produced large
regions of stable multiannual cycles.
DISCUSSION
Our results demonstrate that increased potential for surplus killing (predation that does
not translate into increased vital rates) by specialist endothermic predators is destabilizing to
predator-prey dynamics. This result is not unexpected; endothermic predators have high
energetic requirements but can only make limited use of surplus food killed and the cost of
handling prey soon outweighs the energetic gain of killing another food item (Oksanen, Oksanen
& Fretwell 1985). The result is a lagged response to prey abundance, leading to
overcompensation and instability of predator-prey dynamics. Likewise, increasing predator
reproductive rate destabilizes dynamics by amplifying the predators’ potential to ‘overshoot’
prey populations, leading to complex dynamics and chaos (May 1974; Hassell, Lawton & May
1976).
173

For an ectothermic predator, however, little food is necessary for maintenance and
surplus prey can be allocated directly to reproductive output, growth (analogous to recruitment in
ectotherms), and storage (Andrews 1982; Pough 1980). Concordantly, adjusting the slopes of
vital rate curves, allowing a more linear relationship between prey capture rate and vital rates,
generally stabilized increases in both μmax relative to μcrit (surplus killing) and maximum predator
reproductive rate. Although specialist snake species respond with a lagged numerical response,
the ability to compensate for prey density through adjusted survival (during prey declines), birth
rate, and recruitment (during increases in prey density) may minimize overshooting that leads to
unstable dynamics in lagged systems. Yodzis & Innes (1992) support this conclusion in their
analysis of the impacts of body size and metabolic category on consumer-resource dynamics.
Using simple models they demonstrate that high maximal ingestion to metabolic respiration rate
ratios are stabilizing and conclude that ectotherms should exhibit more stable dynamics and
persist on lower resource levels than endotherms. Our results further suggest that of the three
vital rates, survivorship may be most influential in stabilizing predator-prey dynamics. This
result is not unexpected, as the survivorship function affects all predators, whereas birth and
recruitment functions act only on single life stages. Allowing more direct relationships between
prey abundance and reproductive and recruitment rates generally stabilized increases in
maximum birth rate but did little to improve stability of increases in SK. Finally, a partial
mechanism underlying our findings may be our selection of a ratio-dependent functional
response (which is translated into the numerical response through μ). The ratio-dependent
relationship between prey density, predator density, and vital rates allows some degree of density
dependence in snake vital rates which is generally stabilizing to population dynamics (Neubert &
Caswell 2000).
174

Although our results suggest that ectothermic specialist predators are more likely than
endotherms to exhibit stable interactions with their prey, the question of how important snakes
are as predators within ecosystems remains unresolved (Nowak, Theimer & Schuett 2008). At
least two studies have demonstrated that snakes can be important predators in some systems.
Godley (1980) estimated that during some seasons juvenile striped swamp snakes (Regina
alleni), specialist predators upon aquatic odonate larvae, consumed 90.7% of odonates within a
Florida water hyacinth ecosystem. Likewise, Ineich et al. (2007) estimated that sea snakes
(Laticauda sp.) consume 36,000 eels annually from the waters surrounding a small (6 ha) islet in
the South Pacific Ocean. Is it possible that adders play a role in the dynamics of northern
European microtine rodents, despite the fact that they are infrequently encountered during
predator surveys (Norrdahl & Korpimaki 2002)? Snakes are notoriously secretive and studies
have shown that visual counts are poor indicators of snake abundance (Rodda et al. 2005; Dorcas
& Willson 2009). Adder densities have been estimated using mark-recapture at 4 – 14
individuals per ha (Table 6.1; Parker & Plummer 1987). This corresponds to 20 – 70 times the
maximum densities reported for least weasels during high phases of rodent cycles (Hanski,
Hansson & Henttonen 1991; Hanski et al. 2001). At such densities, it is probable that adders
exert significant predation pressure on vole populations, as predicted for vipers in general by
Nowak, Theimer & Schuett (2008). Indeed, Lindell & Forsman (1996) estimated that adders
consumed up to 9.4 – 66.1 voles per ha per year on six Swedish islands and noted that islands
with more adders hosted lower vole densities. Moreover, experimentally increasing adder density
resulted in vole declines, although these trends were not statistically significant (Lindell &
Forsman 1996).
175

We have used vipers and microtine rodents as a model for investigating how one aspect
of ectothermic predation (the slopes of vital rate curves) differs from that of endotherms.
However, numerous other differences exist between ectothermic and endothermic vertebrate
predators that may influence predator-prey interactions. For example, although no snake
functional responses have been derived from field data, Nowak, Theimer & Schuett (2008)
recently hypothesized that vipers will exhibit lower functional responses than similarly-sized
endothermic predators. They also predicted that snakes, especially species that typically rely on
capital breeding (e.g., temperate vipers) will display strongly-lagged numerical responses due to
the need to accumulate sufficient energetic stores (capital) to fuel reproduction (Nowak, Theimer
& Schuett (2008). Investigations of the population dynamic consequences of these and other
differences in the mechanics of predation between ectotherms and endotherms, in conjunction
with field and laboratory experiments of snakes and their prey, will continue to shed light on the
importance of these often-overlooked predators.
ACKNOWLEDGMENTS
We thank S. E. DuRant, J. W. Gibbons, M. A. Pilgrim, T. M. Farrell, B. D. Todd, and C.
T. Winne for participating in insightful discussions that helped guide the conceptual framework
of this study. E. M. Nowak and M. A. Pilgrim provided meaningful feedback on earlier versions
of the manuscript. We especially thank M. O’Donoghue, A. Forsman, O. Gilg, C. J. Krebs, T.
Madsen, B. Sittler, and R. Shine for graciously providing raw data for figures. Support for this
research was supplied by a Graduate Research Fellowship from the National Science Foundation
to JDW and by the Environmental Remediation Sciences Division of the Office of Biological
176

and Environmental Research, U.S. Department of Energy through Financial Assistance Award
no. DE-FC09-07SR22506 to the University of Georgia Research Foundation.
LITERATURE CITED
Abrams, P. A. & Ginzburg, L. R. 2000 The nature of predation: prey dependent, ratio dependent or neither? Trends Ecol. Evol. 15, 337-341.
Andersson, M. & Erlinge, S. 1977 Influence of predation on rodent populations. Oikos 29, 591-
597. Andren, C. & Nilson, G. 1983 Reproductive tactics in an island population of adders, Vipera
berus (L.), with a fluctuating food resource. Amphibia-Reptilia 4, 63-79. Andrews, R. M. 1982 Patterns of growth in reptiles. In Biology of the Reptilia, Vol.13 (eds C.
Gans & F. H. Pough), pp. 273-320. New York, NY: Academic Press. Bonnet, X., Bradshaw, D. & Shine, R. 1998 Capital versus income breeding: an ectothermic
perspective. Oikos 83, 333-342. Dorcas, M. E. & Willson, J. D. 2009 Innovative Methods for Studies of Snake Ecology and
Conservation. In Snakes: Applied Ecology and Conservation (eds S. J. Mullin & R. A. Seigel). Ithaca, NY: Cornell University Press. In press.
Erlinge, S. 1974 Distribution, territoriality and numbers of weasel Mustela nivalis in relation to
prey abundance. Oikos 25, 308-314. Forsman, A. & Lindell, L. E. 1997 Responses of a predator to variation in prey abundance:
survival and emigration of adders in relation to vole density. Can. J. Zool. 75, 1099-1108. Gilg, O., Hanski, I. & Sittler, B. 2003 Cyclic dynamics in a simple vertebrate predator-prey
community. Science 302, 866-868. Gilg, O., Sittler, B., Sabard, B., Hurstel, A., Sane, R., Delattre, P. & Hanski, L. 2006 Functional
and numerical responses of four lemming predators in high arctic Greenland. Oikos 113, 193-216.
Godley, J. S. 1980 Foraging ecology of the striped swamp snake, Regina alleni, in Southern
Florida. Ecol. Monogr. 50, 411-436. Gragg, J. E., Rodda, G. H., Savidge, J. A., White, G. C., Dean-Bradley, K. & Ellingson, A. R.
2007 Response of brown treesnakes to reduction of their rodent prey. J. Wildl. Manage. 71, 2311-2317.
177

Hanski, I., Hansson, L. & Henttonen, H. 1991 Specialist predators, generalist predators, and the microtine rodent cycle. J. Anim. Ecol. 60, 353-367.
Hanski, I., Henttonen, H., Korpimaki, E., Oksanen, L. & Turchin, P. 2001 Small-rodent
dynamics and predation. Ecology 82, 1505-1520. Hanski, I. & Korpimaki, E. 1995 Microtine rodent dynamics in northern Europe: parameterized
models for the predator-prey interaction. Ecology 76, 840-850. Hassell, M. P., Lawton, J. H. & May, R. M. 1976 Patterns of dynamical behavior in single-
species populations. J. Anim. Ecol. 45, 471-486. Ineich, I., Bonnet, X., Brischoux, F., Kulbicki, M., Seret, B. & Shine, R. 2007 Anguilliform
fishes and sea kraits: neglected predators in coral-reef ecosystems. Mar. Biol. 151, 793-802.
King, C. M. 1983 The relationship between beech (Nothofagus sp.) seedfall and populations of
mice (Mus musculus), and the demographic and dietary responses of stoats (Mustela erminea), in three New Zealand forests. J. Anim. Ecol. 52, 141-166.
Korpimaki, E., Norrdahl, K., Klemola, T., Pettersen, T. & Stenseth, N. C. 2002 Dynamic effects
of predators on cyclic voles: field experimentation and model extrapolation. Proc. R. Soc. B 269, 991-997.
Korpimaki, E., Brown, P. R., Jacob, J. & Pech, R. P. 2004 The puzzles of population cycles and
outbreaks of small mammals solved? Bioscience 54, 1071-1079. Lin, Y. K. & Batzli, G. O. 1995 Predation on voles: an experimental approach. J. Mammal. 76,
1003-1012. Lindell, L. E. & Forsman, A. 1996 Density effects and snake predation: prey limitation and
reduced growth rate of adders at high density of conspecifics. Can. J. Zoo. 74, 1000-1007.
Lourdais, O., Bonnet, X., Shine, R. & Taylor, E. N. 2003 When does a reproducing female viper
(Vipera aspis) 'decide' on her litter size? J. Zool. 259, 123-129. Madsen, T., Ujvari, B., Shine, R. & Olsson, M. 2006 Rain, rats and pythons: climate-driven
population dynamics of predators and prey in tropical Australia. Austral Ecol. 31, 30-37. May, P. G. 1973 Stability and complexity in model ecosystems. Princeton, NJ: Princeton
University Press. May, R. M. 1974 Biological populations with nonoverlapping generations: stable points, stable
cycles, and chaos. Science 186, 645-647.
178

Maynard Smith, J. & Slatkin, M. 1973 Stability of predator-prey systems. Ecology 54, 384-391. Mushinsky, H. R. 1987 Foraging Ecology. In Snakes: Ecology and Evolutionary Biology (eds R.
A. Seigel, J. T. Collins & S. S. Novak), pp. 302-321. New York, NY: McGraw-Hill. Neubert, M. G. & Caswell, H. 2000 Density-dependent vital rates and their population dynamic
consequences. J. Math. Biol. 41, 103-121. Norrdahl, K. & Korpimaki, E. 2002 Seasonal changes in the numerical responses of predators to
cyclic vole populations. Ecography 25, 428-438. Nowak, E. M., T. C. Theimer, and G. W. Schuett. 2008 Functional and numerical responses of
predators: where do vipers fit in the traditional paradigms? Biol. Rev. 83:601-620. O'Donoghue, M., Boutin, S., Krebs, C. J. & Hofer, E. J. 1997 Numerical responses of coyotes
and lynx to the snowshoe hare cycle. Oikos 80, 150-162. Oksanen, T., Oksanen, L. & Fretwell, S. D. 1985 Surplus killing in the hunting strategy of small
predators. Am. Nat. 126, 328-346. Parker, W. S. & Plummer, M. V. 1987 Population Ecology. In Snakes: Ecology and
Evolutionary Biology (eds R. A. Seigel, J. T. Collins & S. S. Novak), pp. 253-301. New York, NY: McGraw-Hill.
Pough, F. H. 1980 Advantages of ectothermy for tetrapods. American Naturalist 115, 92-112. Rodda, G. H., Campbell, E. W. I., Fritts, T. H. & Clark, C. S. 2005 The predictive power of
visual searching. Herpetol. Rev. 36, 259-264. Shine, R. & Bonnet, X. 2000 Snakes: a new 'model organism' in ecological research? Trends
Ecol. Evol. 15, 221-222. Sun, L. X., Shine, R., Debi, Z. & Zhengren, T. 2001 Biotic and abiotic influences on activity
patterns of insular pit-vipers (Gloydius shedaoensis, Viperidae) from north-eastern China. Biol. Conserv. 97, 387-398.
Tapper, S. 1979 Effect of fluctuating vole numbers (Microtus agrestis) on a population of
weasels (Mustela nivalis) on farmland. J. Anim. Ecol. 48, 603-617. Turchin, P. & Hanski, I. 1997 An empirically based model for latitudinal gradient in vole
population dynamics. Am. Nat. 149, 842-874. Yodzis, P. & Innes, S. 1992 Body size and consumer-resource dynamics. Am. Nat. 139, 1151-
1175.
179

Table 6.1 Model parameter estimates for stereotypical specialist endothermic and ectothermic predators, the least weasel (Mustela nivalis) and the adder (Vipera berus), and parameter values used in simulations. All values are listed per time step (year). Densities are given per km2 and all values except population density consider only the female segment of the population. Parameters that are varied in simulations are noted (var). Population density is not a parameter used in simulations but is provided for comparison. Sources: (1) Hanski & Korpimaki 1995, (2) Korpimaki et al. 2002, (3) Lindell & Forsman 1996, (4) Andren & Nilson 1983, (5) Hanski et al. 2001, (6) Parker & Plummer 1987. Parameter Mustela nivalis Vipera berus used Source r Prey intrinsic rate of increase - - 1.5† K Prey carrying capacity - - 10,000 1 β Predator half-satiation constant (prey density) 250 – 1,000 unknown 500 1 μmax Maximum predator kill rate 420-600 unknown var 1, 2
μcrit Consumption at 50% vital rate (= survival threshold) 360 3.51 30 2, 3††
Bp Maximum predator litter size 3 7 var 2,4
λ ‘Degree of ectothermy’ (= slope of vital rate curve) low high var
Population density (males and females) 1-20 400-1,400 - 5, 6
† Field data demonstrate that microtine rodents can exhibit very high maximum rates of increase (r > 5; Hanski & Korpimaki 1995). As high growth rates generally destabilize predator-prey interactions, we selected a substantially lower value of r when parameterizing our model. †† μcrit for V. berus was estimated by calculating the number of voles that must necessarily be consumed for an average-sized V. berus (125 g) to meet its resting metabolic needs, using data provided in Lindell & Forsman (1996). See text for details.
180

Figure 6.1 Conceptualized representation of prey (= energy) allocation in endothermic and ectothermic vertebrate predators. Predators are limited in the maximum number of prey they can capture (μmax) by handling time, with μmax much higher for endotherms than ectotherms. Predators allocate energy (= captured prey) to maintenance up to the minimum energy required to meet metabolic demands (μcrit). Above μcrit, energy may be allocated to reproduction or storage, with ectotherms having relatively higher capabilities for such conversions than endotherms. At high levels of prey availability, endothermic predators are allowed substantial harvest of prey that does not translate into increased reproduction or storage, ‘surplus killing.’
181
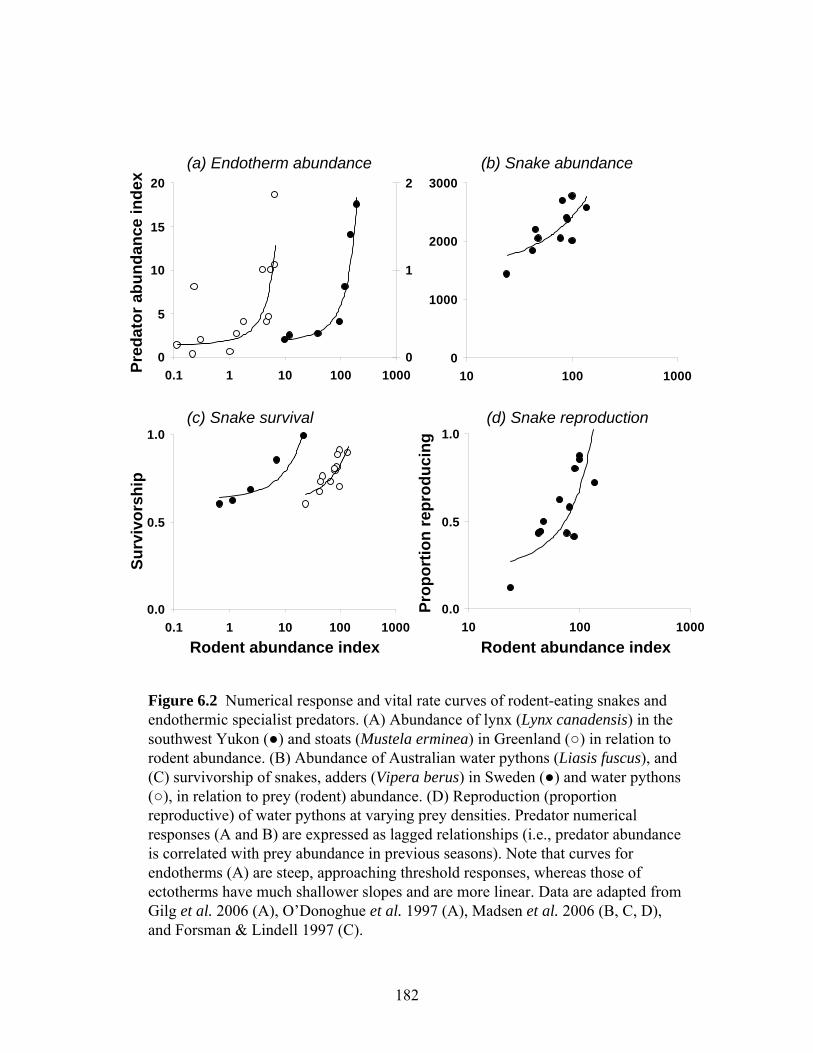
0.0
0.5
1.0
0.1 1 10 100 1000
0
1000
2000
3000
10 100 10000
5
10
15
20
0.1 1 10 100 10000
1
2
0.0
0.5
1.0
10 100 1000
(a) Endotherm abundance (b) Snake abundance
(c) Snake survival (d) Snake reproduction
Pred
ator
abu
ndan
ce in
dex
Surv
ivor
ship
Prop
ortio
n re
prod
ucin
g
Rodent abundance index Rodent abundance index
Figure 6.2 Numerical response and vital rate curves of rodent-eating snakes and endothermic specialist predators. (A) Abundance of lynx (Lynx canadensis) in the southwest Yukon (●) and stoats (Mustela erminea) in Greenland (○) in relation to rodent abundance. (B) Abundance of Australian water pythons (Liasis fuscus), and (C) survivorship of snakes, adders (Vipera berus) in Sweden (●) and water pythons (○), in relation to prey (rodent) abundance. (D) Reproduction (proportion reproductive) of water pythons at varying prey densities. Predator numerical responses (A and B) are expressed as lagged relationships (i.e., predator abundance is correlated with prey abundance in previous seasons). Note that curves for endotherms (A) are steep, approaching threshold responses, whereas those of ectotherms have much shallower slopes and are more linear. Data are adapted from Gilg et al. 2006 (A), O’Donoghue et al. 1997 (A), Madsen et al. 2006 (B, C, D), and Forsman & Lindell 1997 (C).
182
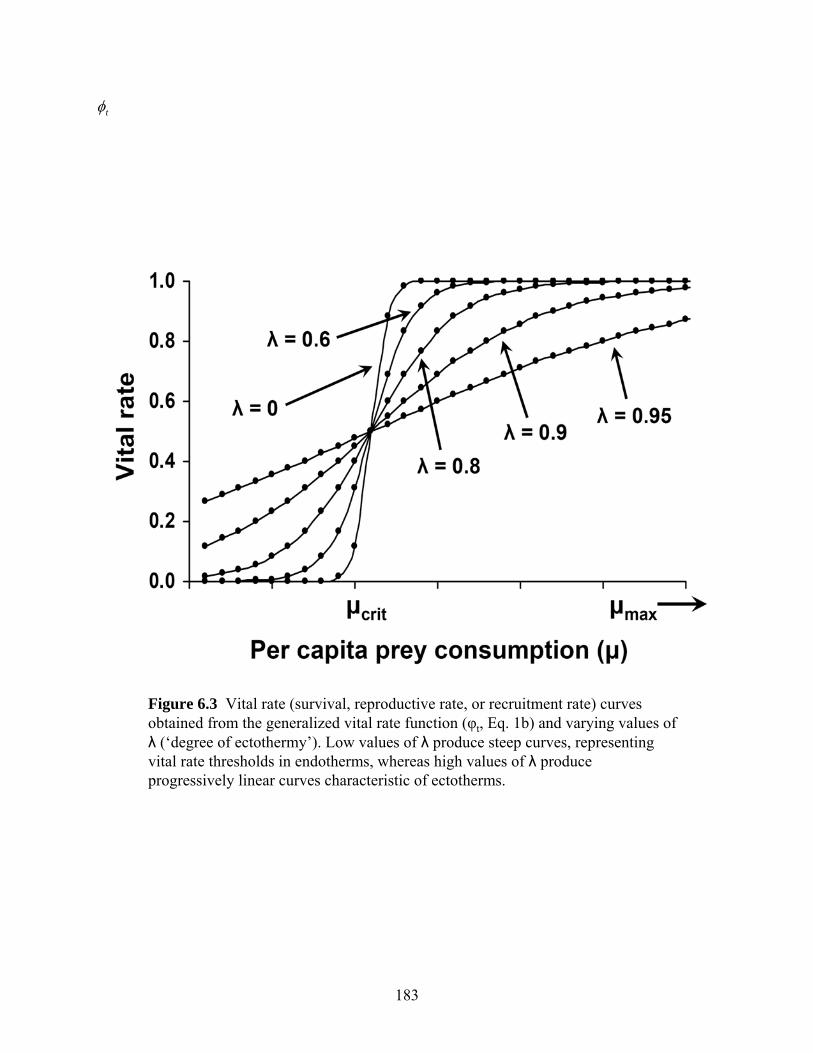
Figure 6.3 Vital rate (survival, reproductive rate, or recruitment rate) curves obtained from the generalized vital rate function (φt, Eq. 1b) and varying values of λ (‘degree of ectothermy’). Low values of λ produce steep curves, representing vital rate thresholds in endotherms, whereas high values of λ produce progressively linear curves characteristic of ectotherms.
tφ
183

010
0%20
0%
‘Sur
plus
kill
ing’
Predator extinctionChaos
Predator birth rate (BP)
1 2 3 4 85 6 10 12 20
Stable dynamics (cycle period)
0 2 4 6
Figure 6.4 Operating diagram of the general predator-prey model, illustrating the destabilizing effects of surplus killing and increased predator birth rate on predator-prey dynamics. ‘Surplus killing’ is the potential for killing above the minimum needed to meet metabolic requirements (μcrit), expressed relative to μcrit: ‘surplus killing’ = 100% x (μmax - μcrit) / μcrit. Parameter combinations that produce stable predator-prey dynamics are indicated by colors (annual cycles in red, multiannual cycles in other colors) whereas those that produce unstable dynamics are indicated by gray (chaos) or black (predator extinction).
184

Figure 6.5 Operating diagrams illustrating the stability of predator-prey interactions in which slopes of vital rate curves (survivorship, predator birth rate, recruitment rate) are altered to represent increasing ‘degree of ectothermy’ (λ) at increasing levels of ‘surplus killing’ (A-C) and maximum predator reproductive rate (D-F). Low values of λ represent steeper curves characteristic of endotherms. ‘Surplus killing’ is the potential for killing above the minimum needed to meet metabolic requirements (μcrit), expressed relative to μcrit: ‘surplus killing’ = 100% x (μmax - μcrit) / μcrit. In (A-C) predator birth rate is held constant at BP = 2. In (D- F) ‘surplus killing’ is held constant at 25%. Parameter combinations that produce stable predator-prey dynamics are indicated by colors (annual cycles in red, multiannual cycles in other colors) whereas those that produce unstable dynamics are indicated by gray (chaos), black (predator extinction), or yellow (prey extinction).
185

CHAPTER 7
CONCLUSION
Understanding the functional roles of species and their contributions to ecosystem
function is critical to making informed decisions about the prioritization of limited conservation
resources. Unfortunately, most of our knowledge of species’ roles is derived from study of
common and widespread species, whereas those that are infrequently encountered are often
assumed to be rare and of minor functional significance. Snakes are among the most secretive
vertebrate taxa and consequently, we know little about snake population ecology, predator-prey
relationships, or the roles that snakes play in communities or ecosystems. Prompted by this lack
of knowledge, my dissertation sought to use novel and integrative methods to investigate the
roles of this inconspicuous and notoriously difficult-to-sample animal group. Specifically, I
aimed to 1) use advanced mark-recapture methods, stable isotope analyses, and laboratory
experiments to estimate the predatory role of aquatic snakes within an isolated fishless wetland,
2) investigate ways in which prey communities may mediate the roles of aquatic snakes across
wetland types, and 3) theoretically evaluate ways in which snakes, as ectotherms, may differ
from comparable endothermic predators (e.g., mammals) in their interactions with prey
populations.
In Chapter 2, I used aquatic snakes as a case study in applying advanced capture-
recapture methods to improve accuracy and precision of population parameter estimates for
secretive species. For both Nerodia fasciata and Seminatrix pygaea, I found evidence that
186

capture and recapture probabilities were not equal, suggesting that use of standard open
population models would violate traditional modeling assumptions and yield biased population
size and vital rate estimates. Specifically, I found strong support for time-varying capture and
recapture probabilities and strong trap-happy responses in both snake species. I also found
evidence for temporary emigration in S. pygaea and that rates of temporary emigration varied
between the sexes in this species. These results set the stage for generating accurate and precise
population estimates for aquatic snakes at Ellenton Bay. Moreover, my study is among the first
comprehensive assessments of factors affecting detectability in snakes, providing a framework
for studies aimed at monitoring populations of these secretive and often underappreciated
species.
In Chapter 3, I used stable isotope techniques to evaluate diets of aquatic snakes at
Ellenton Bay, where amphibian breeding migrations cause dramatic seasonal shifts in prey
abundance. Although stable isotopes have been proposed as an unbiased tool for quantifying
diet, their use requires careful consideration of spatial and temporal variation in prey availability
and isotopic composition. I determined that amphibian prey at Ellenton Bay clustered into
functional groups based on similarity of isotopic composition and seasonal availability, and that
these functional groups varied little in isotopic composition over time. Thus, Ellenton Bay meets
provides an ideal opportunity to use stable isotopes as diet indicators. Isotope variance structure
indicated that the trophic niche width of N. fasciata was broader (more generalist) than that of S.
pygaea. Moreover, N. fasciata exhibited seasonal variation in isotope composition, suggesting
seasonal inclusion of adult anurans within snake diets in the spring. Conversely, S. pygaea
exhibited no seasonal variation but displayed strong ontogenetic shifts in carbon and nitrogen
isotope composition that closely paralleled ontogenetic shifts in their primary prey,
187

paedomorphic mole salamanders (Ambystoma talpoideum). These results support my direct
assessments of snake diet obtained by conventional gut content analysis. Moreover, although
niche dimensions are often treated as static, my results demonstrate that seasonal shifts in niche
dimensions can lead to changes in niche overlap between sympatric species. Such short-term
fluctuations in niche overlap have implications for our understanding of competitive interactions
and consequently the structuring of communities and ecosystems.
In Chapter 4, I assessed the functional role that aquatic snakes play as predators by
estimating the biomass of amphibians consumed by snakes at Ellenton Bay over a one year
period. Specifically, I synthesized data from Chapters 2 and 3 to estimate snake density and
standing biomass at Ellenton Bay, biomass of prey consumed by snakes over the year, and
distribution of predation across amphibian prey taxa. Using intensive, systematic sampling and
advanced mark-recapture analyses, I estimated that, at peak density, 171 snakes ha-1 inhabited
Ellenton Bay, corresponding to a mean standing biomass of 7.77 kg ha-1. Further, I calculated
that snakes at Ellenton Bay consumed over 200 kg of amphibians annually, translating into >
150,000 kJ ha-1 of energy flow from secondary to tertiary consumers within the food web. This
total represented nearly 50,000 individual amphibians, the majority of which were A. talpoideum.
Thus, my data demonstrate that snakes can exist at high densities and play important predatory
roles in native aquatic ecosystems in the southeastern United States. Moreover, snakes may play
a key role in linking terrestrial and aquatic habitats by sequestering biomass of migratory adult
amphibians within wetlands. My results highlight the important predatory role that snakes can
play in some ecosystems and stress the importance of questioning the assumption that
infrequently encountered species are rare and of minor ecological importance.
188

Having determined that snakes can be important predators within fishless wetlands, in
Chapter 5 I evaluated ways in prey communities may mediate snakes’ roles among wetland
types. My results suggested that aquatic salamanders (Ambystoma), which are characteristic of
fishless wetlands, represent a higher quality prey for juvenile watersnakes than sunfish
(Lepomis), which are characteristic of permanent wetlands. Juvenile N. fasciata were able to
consume larger Ambystoma than Lepomis and consumed more Ambystoma at sizes where both
prey types could be consumed. Lepomis induced greater post-prandial body distension in snakes
than did Ambystoma, resulting in severely-impaired locomotor performance. Cost of digestion
(SDA response) was similar between the prey types, likely reflecting their similar nutritional
composition. However, snakes fed Ambystoma displayed significantly shorter times to 50% and
75% O2 consumption rate, suggesting that digestion of Ambystoma is slightly more rapid than
Lepomis. My results document ways in which prey morphology can constrain feeding ecology in
gape limited predators, potentially leading to variation in snakes' functional importance among
aquatic ecosystems. Specifically, my results suggest that amphibian prey may be particularly
important in fueling high densities and rapid individual and population growth of aquatic snakes.
Thus, preservation of fishless wetlands may be critical for conservation of aquatic snake species,
many of which are imperiled.
In Chapter 6, I broadened the scope of my findings to evaluate how snakes interact with
prey populations over long time scales and how snakes may differ in their predatory interactions
with prey from comparable endothermic predators (e.g., mammals). I argue that due to high
energetic demands, endothermic specialist predators expire rapidly when prey become scarce and
have limited abilities to translate abundant prey into reproductive output. Functionally, this
creates steep, approaching threshold, curves relating vital rates to prey abundance. Ectotherms,
189

conversely, have superior capabilities for energy storage and higher reproductive potential,
allowing vital rates (birth rate, survival, and recruitment) to respond more linearly to increasing
prey abundance. Using a predator-prey model, I explored the population dynamic consequences
of these differences and found that shifting vital rate curves from those characteristic of
endotherms to more linear curves characteristic of ectotherms was generally stabilizing to
predator-prey dynamics. This result suggests that ectothermic vertebrate predators may exhibit
relatively stable relationships with their prey and provides an important step in understanding
fundamental differences between endothermic and ectothermic predator-prey interactions.
190