integrity analysis of an upper guide structure flange - core · integrity analysis of an upper...
TRANSCRIPT

ww.sciencedirect.com
Nu c l E n g T e c h n o l 4 7 ( 2 0 1 5 ) 7 6 6e7 7 5
Available online at w
ScienceDirect
journal homepage: ht tp: / /www.journals .e lsevier .com/nuclear-engineer ing-and-technology/
Original Article
INTEGRITY ANALYSIS OF AN UPPER GUIDE STRUCTUREFLANGE
KI-HYOUNG LEE*, SUNG-SIK KANG, and MYUNG JO JHUNG
Korea Institute of Nuclear Safety, 62 Gwahak-ro, Yuseong-gu, Daejeon 305-338, Republic of Korea
a r t i c l e i n f o
Article history:
Received 1 April 2015
Received in revised form
12 June 2015
Accepted 15 June 2015
Available online 12 August 2015
Keywords:
Design Acceptance Criteria
Elastic Analysis
Reactor Vessel Internals
Seismic Analysis
Structural Analysis
* Corresponding author.E-mail address: [email protected] (K.-H.
This is an Open Access article distributecreativecommons.org/licenses/by-nc/3.0) whdium, provided the original work is properlyhttp://dx.doi.org/10.1016/j.net.2015.06.0121738-5733/Copyright © 2015, Published by El
a b s t r a c t
The integrity assessment of reactor vessel internals should be conducted in the design
process to secure the safety of nuclear power plants. Various loads such as self-weight,
seismic load, flow-induced load, and preload are applied to the internals. Therefore, the
American Society of Mechanical Engineers (ASME) Code, Section III, defines the stress limit
for reactor vessel internals. The present study focused on structural response analyses of
the upper guide structure upper flange. The distributions of the stress intensity in the
flange body were analyzed under various design load cases during normal operation. The
allowable stress intensities along the expected sections of stress concentration were
derived from the results of the finite element analysis for evaluating the structural integrity
of the flange design. Furthermore, seismic analyses of the upper flange were performed to
identify dynamic behavior with respect to the seismic and impact input. The mode su-
perposition and full transient methods were used to perform timeehistory analyses, and
the displacement at the lower end of the flange was obtained. The effect of the damping
ratio on the response of the flange was also evaluated, and the acceleration was obtained.
The results of elastic and seismic analyses in this study will be used as basic information to
judge whether a flange design meets the acceptance criteria.
Copyright © 2015, Published by Elsevier Korea LLC on behalf of Korean Nuclear Society.
1. Introduction
Reactor vessel internal (RVI) assemblies are part of the reactor
coolant system and are located inside the reactor pressure
vessel. The RVIs are long-lived passive structural components.
The intended functions of RVIs are to support core cooling,
enable control rod insertion, and maintain the integrity of the
fuel [1]. The RVI components are largely classified into three
categories: (1) the core support barrel (CSB), (2) the lower
Lee).
d under the terms of theich permits unrestrictedcited.
sevier Korea LLC on beha
support structure (LSS) and core shroud (CS), and (3) the upper
guide structure (UGS) [2]. The UGS assembly is located above
the reactor core within the CSB. The functions of UGS as-
sembly are to provide alignment and support of the fuel as-
semblies, to maintain the control element assembly (CEA)
shroud spacing, to prevent the movement of the fuel assem-
blies in the event of a severe accident condition, and to protect
the control rods from a cross-flow effect [1]. The UGS flange
has a key functional role in the UGS assembly supporter.
Creative Commons Attribution Non-Commercial License (http://non-commercial use, distribution, and reproduction in any me-
lf of Korean Nuclear Society.

Fig. 1 e Dimensions of the upper guide structure upper
flange.
Nu c l E n g T e c h n o l 4 7 ( 2 0 1 5 ) 7 6 6e7 7 5 767
During the operation of the reactor, the upper part and lower
part of UGS flange are in contact with the closure head of the
reactor vessel and the hold-down ring, respectively.
After the Fukushima accident, more attention has been
focused on the safety and availability of important compo-
nents and the system of nuclear power plants under internal
accidents and extreme disasters [3]. In particular, the integrity
of RVIs is critical to the safe operation of a nuclear power plant.
Therefore, the American Society of Mechanical Engineers
(ASME) Code classifies RVIs as independent components [i.e.,
the core support structure (CSS)] and requires certified detail
stress reports to prove safe operation during the design life [4].
The ASME Boiler and Pressure Vessel Code, Section III, Sub-
section NG, defines the stress limits on the membrane and
bending stresses for the CSS components [5]. The membrane
and bending stresses along some selected sections are calcu-
lated fromanumericalmodel and compared to the ASMECode
requirements [4]. Allowable stress intensities of RVIs should
not exceed the design limits specified in theASMECode, which
are expressed by the design stress intensity values (i.e., Sm) [5].
To compare the allowable stress intensities and the design
criteria, the elastic analysis for internal structures are needed
in the design process. Furthermore, a response analysis un-
dergoing dynamic behaviors with respect to the seismic or
impact inputs should be conducted during the design process
to secure the safety of the RVIs [6]. In general, lumped mass
stick models are used to perform seismic analysis. However,
the full three-dimensional (3D) finite element (FE) model was
used in this study. The stress intensity distributions under
impact and seismic excitation can assess the structural
integrity of the RVIs. Based on the results, the RVIs could be
manufactured from a design specification that reflects the
elastic analysis results with the appropriate design loads.
In this study, the elastic and seismic analysis results of the
UGS upper flange for Korean pressurized water reactor (PWR)
nuclear power plants are presented for integrity verification,
based on the presence of various internal and external loads.
The distribution of stress intensities of the flange FE model
was analyzed under eight types of design load combinations,
which increase in the steady state. Furthermore, the seismic
and impact analysis were performed with different damping
types and ratios. The analysis results were applied to assess
the structural integrity of the UGS upper flange during normal
operation, impact, and seismic excitation.
2. Elastic analysis
2.1. Upper guide structure upper flange geometry andanalysis model
The method applied in the elastic analysis included a calcu-
lation of the structural response using a two-dimensional (2D)
FE model. Fig. 1 presents the detailed geometry of the UGS
upper flange. The dimensions are based on the design speci-
fication of the UGS upper flange in commercial Korean stan-
dard nuclear power plants. The meshes of the geometric
modes were generated using the structural analysis program,
ANSYS version 14.5 (ANSYS Inc., Canonsburg, PA, USA). PLANE
25 element was used to calculate the distribution of the stress
intensities. Fig. 2 presents the 2D FE model. There were 1,409
nodes in the generated analysismode. This study assumes that
the UGS upper flange is fabricated of Type 304L stainless steel.
The corresponding material properties are shown in Table 1.
2.2. Boundary condition and applied load cases
When evaluating the accurate structural response, con-
straints are important factors because they limit the strain on
structures and affect their stiffness [7]. The lower surface of
the UGS upper flange is arrested in the hold-down ring and the
upper flange of the CSB assembly. The upper end of the flange
is in contact with the closure head of the reactor vessel. As a
result, the degrees of freedom (DOF) in the vertical and
circumferential direction at the UGS assembly are fixed [7].
The rules and guidelines of ASME Boiler and Pressure
Vessel Code, Section III, Subsection NG, can be used in the
elastic analysis of the RVI components. An important feature
of this method is the combination of all possible loads to
which the RVI components are subjected. For example, the
design loadings that are used when determining the compo-
nent stress analysis are the following: (1) the differential
pressure resulting from coolant flow; (2) the weight of the
structure; (3) the superimposed loads from other components;
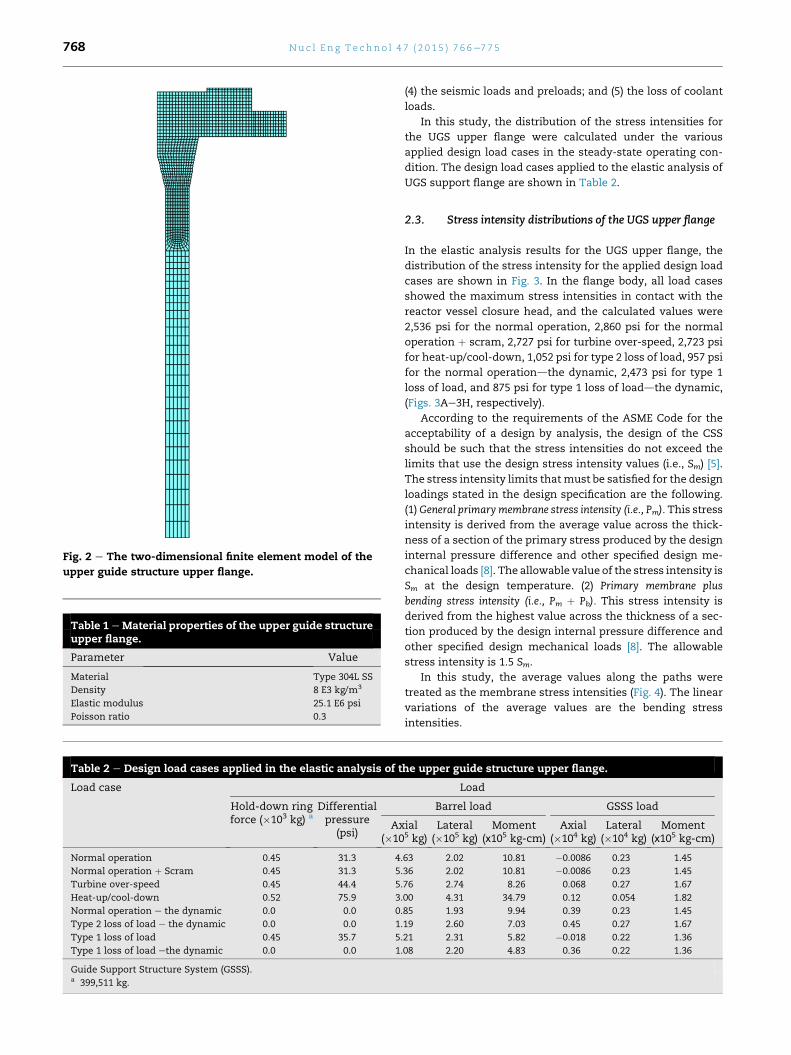
Table 1 eMaterial properties of the upper guide structureupper flange.
Parameter Value
Material Type 304L SS
Density 8 E3 kg/m3
Elastic modulus 25.1 E6 psi
Poisson ratio 0.3
Fig. 2 e The two-dimensional finite element model of the
upper guide structure upper flange.
Table 2 e Design load cases applied in the elastic analysis of t
Load case
Hold-down ringforce (�103 kg) a
Differentialpressure
(psi)Ax
(�10
Normal operation 0.45 31.3 4
Normal operation þ Scram 0.45 31.3 5
Turbine over-speed 0.45 44.4 5
Heat-up/cool-down 0.52 75.9 3
Normal operation e the dynamic 0.0 0.0 0
Type 2 loss of load e the dynamic 0.0 0.0 1
Type 1 loss of load 0.45 35.7 5
Type 1 loss of load ethe dynamic 0.0 0.0 1
Guide Support Structure System (GSSS).a 399,511 kg.
Nu c l E n g T e c h n o l 4 7 ( 2 0 1 5 ) 7 6 6e7 7 5768
(4) the seismic loads and preloads; and (5) the loss of coolant
loads.
In this study, the distribution of the stress intensities for
the UGS upper flange were calculated under the various
applied design load cases in the steady-state operating con-
dition. The design load cases applied to the elastic analysis of
UGS support flange are shown in Table 2.
2.3. Stress intensity distributions of the UGS upper flange
In the elastic analysis results for the UGS upper flange, the
distribution of the stress intensity for the applied design load
cases are shown in Fig. 3. In the flange body, all load cases
showed the maximum stress intensities in contact with the
reactor vessel closure head, and the calculated values were
2,536 psi for the normal operation, 2,860 psi for the normal
operation þ scram, 2,727 psi for turbine over-speed, 2,723 psi
for heat-up/cool-down, 1,052 psi for type 2 loss of load, 957 psi
for the normal operationdthe dynamic, 2,473 psi for type 1
loss of load, and 875 psi for type 1 loss of loaddthe dynamic,
(Figs. 3Ae3H, respectively).
According to the requirements of the ASME Code for the
acceptability of a design by analysis, the design of the CSS
should be such that the stress intensities do not exceed the
limits that use the design stress intensity values (i.e., Sm) [5].
The stress intensity limits thatmust be satisfied for the design
loadings stated in the design specification are the following.
(1)General primarymembrane stress intensity (i.e., Pm). This stress
intensity is derived from the average value across the thick-
ness of a section of the primary stress produced by the design
internal pressure difference and other specified design me-
chanical loads [8]. The allowable value of the stress intensity is
Sm at the design temperature. (2) Primary membrane plus
bending stress intensity (i.e., Pm þ Pb). This stress intensity is
derived from the highest value across the thickness of a sec-
tion produced by the design internal pressure difference and
other specified design mechanical loads [8]. The allowable
stress intensity is 1.5 Sm.
In this study, the average values along the paths were
treated as the membrane stress intensities (Fig. 4). The linear
variations of the average values are the bending stress
intensities.
he upper guide structure upper flange.
Load
Barrel load GSSS load
ial5 kg)
Lateral(�105 kg)
Moment(ⅹ105 kg-cm)
Axial(�104 kg)
Lateral(�104 kg)
Moment(ⅹ105 kg-cm)
.63 2.02 10.81 �0.0086 0.23 1.45
.36 2.02 10.81 �0.0086 0.23 1.45
.76 2.74 8.26 0.068 0.27 1.67
.00 4.31 34.79 0.12 0.054 1.82
.85 1.93 9.94 0.39 0.23 1.45
.19 2.60 7.03 0.45 0.27 1.67
.21 2.31 5.82 �0.018 0.22 1.36
.08 2.20 4.83 0.36 0.22 1.36

Fig. 3 e Stress intensity distributions. (A) Normal operation, (B) normal operation þ scram, (C) turbine over-speed, (D) heat-
up/cool-down, (E) normal operation e the dynamic, (F) type 2 loss of load, (G) type 1 loss of load, and (H) type 1 loss of load e
the dynamic.
Nu c l E n g T e c h n o l 4 7 ( 2 0 1 5 ) 7 6 6e7 7 5 769

Fig. 4 e Selected paths for the stress intensity analysis.
Nu c l E n g T e c h n o l 4 7 ( 2 0 1 5 ) 7 6 6e7 7 5770
For the FE model of the UGS upper flange, the stress in-
tensities were calculated along four different paths. Fig. 4
shows the locations of these paths. The analyzed Pm and
Pm þ Pb values at each path are summarized in Table 3. The
heat-up/cool-down case has the largest stress concentrations,
regardless of the path. Path 1, which is located near the con-
tact between the UGS upper flange and reactor vessel closure
head, generally shows the highest Pm values for all load cases,
except for dynamic load cases. There were significant local
and bending effects on a specific pathwhen comparing Pm and
Pm þ Pb. The contacts with the hold-down ring (i.e., path 2 and
path 3) show that the Pm values of path 2 are slightly above
those of path 3, but the Pm þ Pb values of path 3 are much
higher than those of path 2. Path 3 has structurally larger local
and bending loads than those in path 2. For path 4, the Pm þ Pbvalues are not greatly different from those of path 3, but a
significantly high Pm occurs during the heat-up/cool-down
condition. In the most conservative point of view, the com-
bination of all maximum stress intensities under the design
loads should be lower than the stress intensity limit. In the
ASME Code, the allowable membrane stress intensity, Sm, is
16,700 psi for 304 L stainless steel at the operating tempera-
ture [5]. The sum of the membrane stress intensities in all
Table 3 e The membrane stress intensities and membrane pluupper guide structure upper flange.
Load case
Path 1
Pm Pm þ Pb Pm
Normal operation 313.7 666.4 191.7
Normal operation þ scram 343.5 743.3 210.6
Turbine over-speed 388.3 771.8 229.3
Heat-up/cool-down 521.5 853.5 281.1
Normal operation e the dynamic 120.3 251.7 77.47
Type 2 loss of load e the dynamic 137.1 260.8 90.48
Type 1 loss of load 327.6 671.9 197.3
Type 1 loss of load e the dynamic 113.8 213.6 75.34
design load cases of this study satisfied the stress intensity
requirement, and showed a significantly large integrity
margin.
3. Impact and seismic analysis
3.1. The modeling and boundary condition
Based on the 2D FEmodel used for the elastic analysis, a 3D FE
model was developed to represent the UGS upper flange. The
generated 3D FE model in Fig. 5 shows the locations that are
fixed by the surrounding structures and loaded by impact and
seismic acceleration. The SOLID185 element was used to
simulate the 3D structure. The employedmesh shown in Fig. 6
consists of 24,505 elements and 28,608 nodes. The material
properties are presented in Table 1. The boundary condition is
the same as in the elastic analysis.
3.2. Modal analysis
A modal analysis provided explanations about the dynamic
characteristics of the structure for the response analysis [2].
The Block Lanczos was set as the solve type for the modal
analysis to obtain the natural frequencies andmode shapes of
the UGS upper flange. The x-direction was selected to
compare the displacement results from the different applied
dynamic analysis methods. The important natural fre-
quencies from the viewpoint of the x-direction and their ratios
of effective mass to total mass are listed in Table 4. The mode
shapes of the 10th and 16th modes were selected from among
all modes because they had the maximum effective mass to
total mass for the x-direction (Fig. 6). Therefore, they have the
biggest influence on the displacement of the x-direction for
the upper flange FE model. Their natural frequencies are
216.798 Hz (10th mode) and 351.492 Hz (16th mode), respec-
tively. The results were used to predict the response and
behavior of the UGS upper flange under the loads.
3.3. Impact analysis
Transient dynamic analysis is a technique used to determine
the dynamic response of a structure under any time-
dependent loads [9] in which damping is a critical factor for
properly characterizing the dynamic responses of a structure
s bending stress intensities for four different paths in the
Stress intensity (psi)
Path 2 Path 3 Path 4
Pm þ Pb Pm Pm þ Pb Pm Pm þ Pb
648.7 230.7 818.3 256.7 854.0
690.5 254.1 883.8 274.8 958.5
812.5 273.0 1,007 358.7 963.7
1,119 324.5 1,314 688.4 1,138
131.6 91.92 205.8 153.6 299.1
139.0 104.5 214.5 176.7 309.7
687.4 236.4 856.0 286.0 850.0
114.2 86.71 175.8 146.9 253.8

Fig. 5 e Three-dimensional finite element model of the
upper guide structure upper flange. USG, upper guide
structure.
Fig. 6 e Mode shapes of the upper guide structure upper flange
upper guide structure.
Nu c l E n g T e c h n o l 4 7 ( 2 0 1 5 ) 7 6 6e7 7 5 771
[10]. Representative methods to analyze transient dynamic
response were the full transient methods and the mode su-
perposition methods. The full transient method uses full
system matrices to calculate the transient response, and it
allows all types of nonlinearities. For many problems, the
mode superposition method is faster and more effective than
the full method because it sums the factored mode shapes
from a modal analysis. However, the only one nonlinearity
(i.e., simple node-to-node contact) is allowed and the time
step must remain constant throughout the transient [11]. The
mode superposition method uses modal damping, which is
constant for all frequencies. By contrast, the full transient
method uses Rayleigh damping, which varies with frequency
[12]. In this study, impact analyses performed by the two
methods were used to evaluate the influence of the applied
analysis method on the dynamic response of the upper flange
model.
To conduct full transient analysis under arbitrary impact
excitation in Fig. 7, first the Rayleigh damping constants, a and
b, which are consistent with a given modal damping, were
determined. The 4% modal damping was chosen as an input,
based on the United States Nuclear Regulatory Commission
Regulatory Guide 1.20 for safe-shutdown earthquake [13]. If it
is assumed that the damping ratio is constant for each natural
frequency, the Rayleigh damping follows the equation:
. (A) The 10th mode shape. (B) The 16th mode shape. USG,
Table 4 e The natural frequencies and ratios of effectivemass to total mass for the x-direction.
Mode Frequency(Hz)
Ratio of effective mass tototal mass for the x-direction
1 124.670 1.01E-21
3 136.620 1.01E-24
5 151.868 2.89E-22
7 177.571 3.07E-22
10 216.798 1.44E-01
16 351.492 3.39E-01
30 480.224 2.33E-02
47 717.657 1.07E-01

Fig. 7 e Timeehistory of impact excitation.
Nu c l E n g T e c h n o l 4 7 ( 2 0 1 5 ) 7 6 6e7 7 5772
x ¼ a
2� u1þ b� u1
2¼ a
2� u2þ b� u2
2(1)
in which ı is the damping ratio, u is the natural frequency, and�a and a are the Rayleigh damping coefficients. This equation
expresses a curve that can be modified to match a modal
damping ratio at two natural frequencies. If the structure has
two very dominant frequencies, Rayleigh damping can closely
approximate the behavior of a prescribed modal damping [9].
Fig. 8 presents the curve of the damping ratio with the natural
frequency. The 10th and 16th natural frequencies determined
from themodal analysis were substituted to u1 and u2, and the
modal damping ratio of 0.04 is applied to ı, as shown in Fig. 8.
As a result, �a and awere calculated as 67.40165 and 2.24048E-5,
respectively. The full transient analysis was conducted by
using the �a and a values. The results are shown in Fig. 9, along
with the result from the mode superposition analysis with 4%
modal damping. The sampling point is the lower end of the
UGS assembly, as shown in Fig. 5. The variation in the
displacement of the x-direction at the sampling point from
the full transient method was nearly the same as the result of
themode superpositionmethodwith 4%modal damping. This
Fig. 8 e Damping ratioenatural frequency curve. a
indicates that the determined Rayleigh damping coefficients
and the selected natural frequencies were acceptable.
To identify the effect of the damping ratio, full transient
analyses for impact excitation were performed with the
Rayleigh damping coefficients that corresponded with 4%,
7%, and 10% damping, as defined by the United States
Nuclear Regulatory Commission Regulatory Guide 1.20 for
safe-shutdown earthquake. The results are shown in
Fig. 10.
The displacement of the x-direction at the sampling point
was not affected by the damping value immediately after the
application of impact excitation. However, the displacement
generated by impact was reduced more rapidly for the larger
damping ratio over time.
3.4. Seismic analysis
To evaluate the effect of damping on the dynamic response for
seismic excitation, the full transient analysis was applied to
the 3D FE model of the UGS upper flange. The input seismic
excitation was based on the El Centro (EW) seismic
and b are the Rayleigh damping coefficients.

Fig. 9 e Displacements of the x-direction with time, as analyzed by the mode superposition and full transient methods.
Fig. 10 e Full transient analysis results for impact with 4%, 7%, and 10% damping.
Nu c l E n g T e c h n o l 4 7 ( 2 0 1 5 ) 7 6 6e7 7 5 773
acceleration data, which is the most general method used to
evaluate the seismic response of structures in the nuclear
power plants [14e16]. Fig. 11 shows the east-west component
of the El Centro seismic acceleration used in this study. The
seismic acceleration is applied to the contact between upper
side of the flange and the reactor pressure vessel closure head
on which the maximum stress intensity concentrates in the
elastic analysis. For the full transient analyses, the Rayleigh
Fig. 11 e The El Centro (EW) se
damping coefficients that are consistent with 0%, 4%, and 7%
damping were determined by Eq. (1). The values correspond-
ing to the 4% and 7% damping ratio were a ¼ 67.4 and
b ¼ 2.24E-5 and a ¼ 118 and b ¼ 3.92E-5, respectively.
Fig. 12 is the acceleration obtained by the full transient
analyses without damping with 4% and 7% damping ratio.
Based on the results from the sampling point in Fig. 5, the
acceleration was comparatively large when it was not
ismic acceleration [11e13].

Fig. 12 e Timeehistory of acceleration with no damping, with the 4% damping ratio, and with the 7% damping ratio for
seismic excitation.
Nu c l E n g T e c h n o l 4 7 ( 2 0 1 5 ) 7 6 6e7 7 5774
dampened, but the damping ratio generally had no particular
influence on the response of the flange model, compared to
the results for the impact excitation. Fig. 13 shows the
response spectra for various damping values generated from
the acceleration time history of El Centro (EW) [17]. The ac-
celeration showed a large difference for the damping value in
the low frequency range, but was virtually the same at all the
damping values in frequencies higher than ~40 Hz. The nat-
ural frequencies used in this analysis are 216.798 Hz and
351.492 Hz for the 10th and 16th mode, respectively. The first
mode had a natural frequency of 124.670 Hz, which wasmuch
higher than 40 Hz. Therefore, the effect of the damping ratio
on the response of the flange model was not significant
because of its dynamic characteristic of a high natural
frequency.
1,000
Fig. 13 e Response spectra generated from the El Centro
(EW) acceleration timeehistory for various damping values
[17].
4. Conclusion
The FE model of the UGS upper flange of Korean standard
nuclear power plants was constructed, and the stress in-
tensity distribution and the dynamic response were obtained
through elastic analysis and time-history analysis. The anal-
ysis results showed the following points.
(1) The elastic analysis results under the various design
load cases showed that the maximum stress intensities
were concentrated at the contact with the reactor vessel
closure head in all load cases. The maximum mem-
brane stress intensities were also observed near the
contact, except for the heat-up/cool-down case. The
edge connecting the upper flange body and UGS barrel
structurally showed large local and bending stress in-
tensities. Based on the conservatism, the combination
of all maximum stress intensities should be lower than
the allowable stress intensity specified in the ASME
Code. The results of the elastic analysis for the UGS
upper flange FEmodel sufficientlymet the requirement.
(2) The full transient analysis was performed under the
impact excitation with the various damping ratio. The
Rayleigh coefficients corresponding to the applied
damping ratio were obtained by using the result of
modal analysis. The timeehistory response of UGS
upper flange was thereafter evaluated with 4%, 7%, and
10% damping ratios, which come from the United States
Nuclear Regulatory Commission Regulatory Guide 1.20
for safe-shutdown earthquake. Immediately after
applying the impact excitation, the displacement of the
x-direction at the lower end of FE model was not
affected by the damping ratio. However, the effect of the
damping ratio increased as time progressed.
(3) The full transient analysis of the UGS upper flange
model was conducted under El Centro (EW) seismic
acceleration. The seismic excitation was applied to the
contact with reactor vessel closure head, which showed
the maximum stress intensity from a conservative
point of view. The accelerations obtained by the full

Nu c l E n g T e c h n o l 4 7 ( 2 0 1 5 ) 7 6 6e7 7 5 775
transient analyses with 0%, 4%, and 7% damping ratios
showed that the damping ratio does not significantly
affect the response of the flange in contrast to the case
of impact excitation. This finding may be because the
input acceleration was virtually the same, regardless of
the damping ratio in the natural frequency range ob-
tained from the modal analysis of the flange model.
In this study, the design integrity of the UGS upper flange of
Korean standard nuclear power plants was verified through
the elastic analyses under the design load cases in steady
states. The analyses under arbitrary impact excitation and
typical seismic acceleration predicted the dynamic response
of the UGS upper flange, andminimized additional analysis to
generate design loads in unsteady states.
Conflicts of interest
The authors declare no conflict of interest.
Acknowledgment
This work was supported by the Nuclear Safety Research
Program through the Korea Radiation Safety Foundation
(KORSAFE), which is granted financial resources from the
Nuclear Safety and Security Commission (NSSC) (Grant
number: 1305003-0214-SB110) in Seoul, Republic of Korea.
r e f e r e n c e s
[1] H.T. Tang. Materials Reliability Program: Screening,Categorization, and Ranking of Reactor InternalsComponents for Westinghouse and Combustion EngineeringPWR Design (MRP-191), Electric Power Research Institute,Palo Alto (CA), 2006.
[2] D.Y. Ko, J.G. Lee, Development of a remote measurementsystem for the gap between RV and CSB for RVI-modularization, Nucl. Eng. Des. 240 (2010) 2907e2913.
[3] L.L. Tong, R. Duan, X.W. Cao, Seismic analysis of RCS withfinite element model for advanced PWR, Prog. Nucl. Energ. 79(2015) 142e149.
[4] M.H. Lu, J.S. Yu, J.J. Chen, The effect of analysis model on thestress intensity calculation for the nozzle attached to
pressure vessel under internal pressure loading, Int. J. Pres.Ves. Pip. 117e118 (2014) 9e16.
[5] American Society of Mechanical Engineers, ASME Boiler andPressure Vessel Code, Section IIIdNuclear Power PlantComponents, Division 1dSubsection NG, Core SupportStructure, ASME, New York (NY), 2007.
[6] Y.C. Choi, K.S. Park, N.C. Park, Y.P. Park, K.H. Jeong, Seismicanalysis model construction of the integrated reactorinternals, Procedia. Eng. 79 (2014) 362e368.
[7] D.Y. Ko, K.H. Kim, Vibration and stress analysis of a UGSassembly for the APR1400 RVI CVAP, Nucl. Eng. Des. 44 (2012)817e824.
[8] KEPIC MNG, Allowable Stress, Korea Electronics Association,Seoul, South Korea, 2010.
[9] ANSYS Online Manuals Release 5.5, Chap 5. TransientDynamic Analysis [Internet]. ANSYS, Canonsburg (PA) [cited2015 Aug 12]. Available from: http://mostreal.sk/html.
[10] J. Nie, X. Wei, On the Use of Material-dependent Damping inANSYS for Mode Superposition Transient Analysis,Proceedings of the American Society of MechanicalEngineers PVP2011, American Society of MechanicalEngineers, New York (NY), 2011, pp. 1e6.
[11] J. Rubacek, Time Effective Transient Analysis Using ANSYSMechanical and Matlab Simulink [Internet]. Philips OralHealthcare, Stamford (CT), 2004 [cited 2015 Aug 12]. Availablefrom: http://www.ansys.com/staticassets/ANSYS/staticassets/resourcelibrary/confpaper/2004-Int-ANSYS-Conf-113.PDF.
[12] R.E. Spears, S.R. Jensen, Approach for Selection of RayleighDamping Parameters Used for Time History Analysis,Proceedings of the American Society of MechanicalEngineers PVP2009, American Society of MechanicalEngineers, New York (NY), 2009, pp. 1e8.
[13] US Nuclear Regulatory Commission, ComprehensiveVibration Assessment Program for Reactor Internals duringPreoperational and Initial Startup Testing, 2007. NRCRegulatory Guide 1.20, Revision 3, Washington (DC).
[14] D.M. Boore, J.J. Bommer, Processing of strong-motionaccelerograms: needs, options and consequences, Soil Dyn.Earth. Eng. 25 (2005) 93e115.
[15] L.C. Seekins, A.G. Brady, C. Carpenter, N. Brown, DigitizedStrong-motion Accelerograms of North and CentralAmerican Earthquakes 1933e1986, US Geological SurveyDigital Data Series, Denver (CO), 1992. DDS-7.
[16] Tom Irvine. Vibrationdata El Centro Earthquake WelcomePage [Internet]. Tom Irvine, Madison (AL) [cited 2015 Aug 12].Available from: http://www.vibrationdata.com/elcentro.htm.
[17] Korea Institute of Nuclear Safety, KINS/RR-685,Seismic Analysis of Mechanical Components by ANSYS,Korea Institute of Nuclear Safety, Daejeon, South Korea,2009.