intel® parallel inspector xe an introduction
TRANSCRIPT
Intel® Inspector XE 2013 An Introduction
Holly Wilper
March 1, 2013

Copyright© 2013, Intel Corporation. All rights reserved. *Other brands and names are the property of their respective owners.
2
2/28/2013
Agenda
1. Intro to Intel® Inspector XE
2. The Inspector XE workflow and walk thru
3. Dynamic Memory and Threading Analysis
4. Static Analysis
5. Readying your sources and builds
6. Managing analysis results
7. Team collaboration
8. Advanced features

Copyright© 2013, Intel Corporation. All rights reserved. *Other brands and names are the property of their respective owners.
3
2/28/2013
Intel® Inspector XE
Is a debugging tool for software. “Correctness Analyzer”
Has an intuitive GUI. Provides powerful results management, navigation, and filtering.
Easy to use one-click help for diagnostics (Possible causes and solution suggestions)
Finds threading bugs in OpenMP*, CilkTM Plus, Intel® Threading Building Blocks, Win32* and Posix Threads threaded software
Locates bugs quickly that can take days to find using traditional methods and tools
– Isolates problems, not the symptoms
– Bug does not have to occur to find it!
The Inspector XE has a comprehensive portfolio of analyses and
an easy to use GUI for effective and efficient results management.

Copyright© 2013, Intel Corporation. All rights reserved. *Other brands and names are the property of their respective owners.
Motivation for Inspector XE
4
2/28/2013
Where are my application’s…
Memory Errors Threading Errors Security Errors
• Invalid Accesses • Memory Leaks • Uninitialized Memory
Accesses
• Races • Deadlocks • Cross Stack References
• Buffer overflows and underflows
• Incorrect pointer usage • Over 250 error types…
• Developing threaded applications can be complex and expensive
• New class of correctness problems are caused by the interaction between concurrent threads
Multi-threading problems are hard to reproduce, difficult to debug
and expensive to fix!

Copyright© 2013, Intel Corporation. All rights reserved. *Other brands and names are the property of their respective owners.
5
2/28/2013
Key Features at a glance
Feature Details
Analyses • Dynamic Memory and Threading Analysis
• Static Analysis (with Intel® Compiler)
GUI • Microsoft Visual Studio IDE integration (2008, 2010, or 2012)
• Stand alone GUI on both Windows and Linux
Compilers supported
• Microsoft* Visual* C++ .NET*
• Intel® Parallel Composer and Intel® Composer XE
• Gcc
OS • Windows XP, Vista, 7, 8
• Linux (various distros)
Languages • C/C++
• C#
• Fortran

Copyright© 2013, Intel Corporation. All rights reserved. *Other brands and names are the property of their respective owners.
6
2/28/2013
Standalone GUI for Windows* and Linux*

Copyright© 2013, Intel Corporation. All rights reserved. *Other brands and names are the property of their respective owners.
7
2/28/2013
Visual Studio* Integration on Windows*

Copyright© 2013, Intel Corporation. All rights reserved. *Other brands and names are the property of their respective owners.
8
2/28/2013
Agenda
1. Intro to Intel® Inspector XE
2. The Inspector XE workflow and walk thru
3. Dynamic Memory and Threading Analysis
4. Static Analysis
5. Readying your sources and builds
6. Managing analysis results
7. Team collaboration
8. Advanced features

Copyright© 2013, Intel Corporation. All rights reserved. *Other brands and names are the property of their respective owners.
9
2/28/2013
Workflow

Copyright© 2013, Intel Corporation. All rights reserved. *Other brands and names are the property of their respective owners.
10
2/28/2013
Workflow: Setup Project
Specify Application, arguments, and working
directory

Copyright© 2013, Intel Corporation. All rights reserved. *Other brands and names are the property of their respective owners.
11
2/28/2013
Workflow: Select Analysis and Start
1. Select Analysis Type
2. Click Start

Copyright© 2013, Intel Corporation. All rights reserved. *Other brands and names are the property of their respective owners.
12
2/28/2013
Workflow: Manage Results and Filter
Powerful filtration feature!
Code locations grouped into Problems to simplify
results management
Double click on Problem to navigate to source (next slide)

Copyright© 2013, Intel Corporation. All rights reserved. *Other brands and names are the property of their respective owners.
13
2/28/2013
Workflow: Navigate to sources
Call stacks
Source code panes annotated for ease of use

Copyright© 2013, Intel Corporation. All rights reserved. *Other brands and names are the property of their respective owners.
14
2/28/2013
Workflow: Timeline view
Individual Code Locations are seen in Timeline view in the
context of their respective threads
Hover gives details

Copyright© 2013, Intel Corporation. All rights reserved. *Other brands and names are the property of their respective owners.
15
2/28/2013
Agenda
1. Intro to Intel® Inspector XE
2. The Inspector XE workflow and walk thru
3. Dynamic Memory and Threading Analysis
4. Static Analysis
5. Readying your sources and builds
6. Managing analysis results
7. Team collaboration
8. Advanced features

Copyright© 2013, Intel Corporation. All rights reserved. *Other brands and names are the property of their respective owners.
16
2/28/2013
Memory Analysis
Analyzed as software runs
– Data (workload) -driven execution
– Program can be single or multi-threaded
– Diagnostics reported incrementally as they occur
Includes monitoring of:
– Memory allocation and allocating functions
– Memory deallocation and deallocating functions
– Memory leak reporting
– Inconsistent memory API usage.
Code path must be executed to be analyzed

Copyright© 2013, Intel Corporation. All rights reserved. *Other brands and names are the property of their respective owners.
Threading Analysis
Dynamic as software runs
– Data (workload) -driven execution
– Program needs to be multi-threaded
– Diagnostics reported incrementally as they occur
Includes monitoring of:
– Thread and Sync APIs used
– Thread execution order
– Scheduler impacts results
– Memory accesses between threads
17
2/28/2013
Code path must be executed to be analyzed

Copyright© 2013, Intel Corporation. All rights reserved. *Other brands and names are the property of their respective owners.
18
2/28/2013
Threading Analysis (.NET)
.NET support is only for Windows C#.
Only Threading Analysis is supported for managed code or mixed mode code
Memory Checking works only on the native portion of a mixed-mode application (does not track any memory in managed heap)
Analysis can be performed using the Inspector XE integrated within Visual Studio* or using Windows Standalone Inspector GUI.
Supported .NET versions are from 2.0 to 3.5.
Limited support for .NET 4.0
Only Threading Analysis is supported for .NET
Copyright© 2013, Intel Corporation. All rights reserved. *Other brands and names are the property of their respective owners.
19
2/28/2013
Agenda
1. Intro to Intel® Inspector XE
2. The Inspector XE workflow and walk thru
3. Dynamic Memory and Threading Analysis
4. Static Analysis
5. Readying your sources and builds
6. Managing analysis results
7. Team collaboration
8. Advanced features

Copyright© 2013, Intel Corporation. All rights reserved. *Other brands and names are the property of their respective owners.
20
2/28/2013
Static Analysis (SA)
• SA invokes Intel® Compiler to run in a special mode to perform link time static analysis.
• No benchmark is needed as source code is examined statically across source file boundaries and so is more powerful than intra-file static analysis
• SA examines all possible execution paths and variable values, not just those that are provoked during testing
• Program can be single-threaded or multi-threaded
• SA feature is in Intel® Parallel Studio XE only and needs both the Intel® Compiler as well as Inspector XE
SA feature is in Studio XE only.

Copyright© 2013, Intel Corporation. All rights reserved. *Other brands and names are the property of their respective owners.
21
2/28/2013
Running Static Analysis
• Run SA only after sources build cleanly
• SA can work on partial program or library but full build is recommended.
– Results are triaged and fixed in the Inspector XE GUI. You can use regular compiler to generate production binaries.
Includes monitoring of:
– Thread and Sync APIs used
– Memory declaration, allocation, use and liveliness
SA is simple to setup and run.

Copyright© 2013, Intel Corporation. All rights reserved. *Other brands and names are the property of their respective owners.
Run static analysis in few clicks
You don’t need to explicitly change existing build objects or configuration to get SA result on Windows

Copyright© 2013, Intel Corporation. All rights reserved. *Other brands and names are the property of their respective owners.
23
2/28/2013
Cyclomatic Complexity metrics
Reduce complexity to make code more maintainable

Copyright© 2013, Intel Corporation. All rights reserved. *Other brands and names are the property of their respective owners.
24
2/28/2013
Static Analysis vs. Inspector XE Comparison
Comparison attribute Inspector XE SA
Analysis type Dynamic Static
When is code analyzed Runtime Compile/Link time
What code is analyzed Executed code All code
What memory is analyzed Active and allocated memory only
All declared memory
Runtime Tests Tests Needed No tests needed
Products needed Inspector XE Parallel Studio XE
Time dilation Can be invasive Relatively moderate
Static and Dynamic Analyses complement each other!

Copyright© 2013, Intel Corporation. All rights reserved. *Other brands and names are the property of their respective owners.
25
2/28/2013
Agenda
1. Intro to Intel® Inspector XE
2. The Inspector XE workflow and walk thru
3. Dynamic Memory and Threading Analysis
4. Static Analysis
5. Readying your sources and builds
6. Managing analysis results
7. Team collaboration
8. Advanced features

Copyright© 2013, Intel Corporation. All rights reserved. *Other brands and names are the property of their respective owners.
Correctness analyses dilate time & memory Adds calls to library to record information
using PIN based Just in time instrumentation.
– Thread and Sync APIs
– Memory accesses
• Increases execution time and memory consumed (potentially significantly)
Use small data sets (workloads)
– Execution time and space is expanded
– Multiple runs over different paths yield best results
26
2/28/2013
The Inspector XE dilates both time and memory consumed
significantly.

Copyright© 2013, Intel Corporation. All rights reserved. *Other brands and names are the property of their respective owners.
Workload Guidelines
Execute problem code once per thread to be identified
Use smallest possible working data set
• Minimize data set size
– E.g. smaller image sizes
• Minimize loop iterations or time steps
– E.g. simulate minutes rather than days
• Minimize update rates
– E.g. lower frames per second
27
2/28/2013
Scale down workload to speed up analysis!

Copyright© 2013, Intel Corporation. All rights reserved. *Other brands and names are the property of their respective owners.
Prepare your build for analysis
Compile
• Use dynamically linked thread-safe runtime libraries
/MDd on Windows
Don’t use –static on Linux
• Generate symbolic information
/ZI on Windows
-g on Linux
• Disable optimization
/Od on Windows
-O0 on Linux
Link
• Preserve symbolic information
/DEBUG on Windows
• Specify relocatable code sections
/FIXED:NO on Windows
28
2/28/2013
Prior to using Inspector XE, sources should compile & link cleanly

Copyright© 2013, Intel Corporation. All rights reserved. *Other brands and names are the property of their respective owners.
29
2/28/2013
Recommended Analysis Sequence
Run Static Analysis
Run Memory Analysis
Run Threading Analysis
Fix Problems
Fix Problems
Fix Problems Cleaner code!
Use both Static and Dynamic analyses for cleaner code!

Copyright© 2013, Intel Corporation. All rights reserved. *Other brands and names are the property of their respective owners.
30
2/28/2013
Agenda
1. Intro to Intel® Inspector XE
2. The Inspector XE workflow and walk thru
3. Dynamic Memory and Threading Analysis
4. Static Analysis
5. Readying your sources and builds
6. Managing analysis results
7. Team collaboration
8. Advanced features

Copyright© 2013, Intel Corporation. All rights reserved. *Other brands and names are the property of their respective owners.
Filtering
31
Before – All Errors After – Only errors from one source file
1. Filter – Show only one source file 2. Error count drops
Copyright© 2013, Intel Corporation. All rights reserved. *Other brands and names are the property of their respective owners.
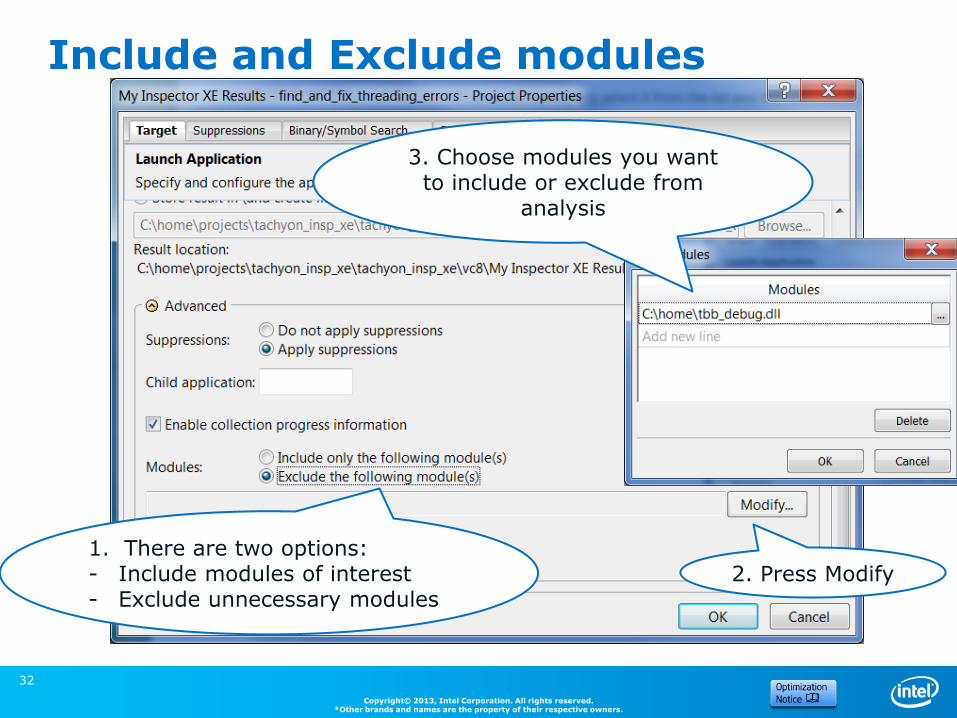
Include and Exclude modules
32
1. There are two options: - Include modules of interest - Exclude unnecessary modules
2. Press Modify
3. Choose modules you want to include or exclude from
analysis

Copyright© 2013, Intel Corporation. All rights reserved. *Other brands and names are the property of their respective owners.
Problem State Lifecycle Makes problems easier to manage
33
State Description
New Detected by this run
Not Fixed Previously seen error detected by this run
Not a Problem Set by user – tool will not change
Confirmed Set by user – tool will not change
Fixed Set by user
Regression Error detected with previous state of “Fixed”
Deferred Set by user

Copyright© 2013, Intel Corporation. All rights reserved. *Other brands and names are the property of their respective owners.
Suppressions: manage false errors
Suppressions are saved in one or more files
Tool suppresses all files from specified folder(s)
34
Suppressions are marked (shown) or hidden entirely
Team sharing of suppression files reduces false error count
Be specific or select group of similar problems
Choose stack matching rule

Copyright© 2013, Intel Corporation. All rights reserved. *Other brands and names are the property of their respective owners.
35
2/28/2013
Agenda
1. Intro to Intel® Inspector XE
2. The Inspector XE workflow and walk thru
3. Dynamic Memory and Threading Analysis
4. Static Analysis
5. Readying your sources and builds
6. Managing analysis results
7. Team collaboration
8. Advanced features

Copyright© 2013, Intel Corporation. All rights reserved. *Other brands and names are the property of their respective owners.
Team collaboration
Share comments with the team
• Provides a way to export meaningful and sufficient problem description as plain text
Share public suppression rules with the team
Prevent simultaneous result/project opening by two or more users

Copyright© 2013, Intel Corporation. All rights reserved. *Other brands and names are the property of their respective owners.
Merge arbitrary results Merge states from another result to current one
Incorporate states from other users
37

Copyright© 2013, Intel Corporation. All rights reserved. *Other brands and names are the property of their respective owners.
38
2/28/2013
Agenda
1. Intro to Intel® Inspector XE
2. The Inspector XE workflow and walk thru
3. Dynamic Memory and Threading Analysis
4. Static Analysis
5. Readying your sources and builds
6. Managing analysis results
7. Team collaboration
8. Advanced features

Copyright© 2013, Intel Corporation. All rights reserved. *Other brands and names are the property of their respective owners.
Integrated Debugger Support
Break into debugger
• Analysis can stop when it detects a problem
• User is put into a standard debugging session
Windows*
• Microsoft* Visual Studio Debugger
Linux*
• gdb
• Intel® Debugger

Copyright© 2013, Intel Corporation. All rights reserved. *Other brands and names are the property of their respective owners.
Analyze Application Memory Growth
40
Set Start Point
Set End Point
Memory Growth Problem Set
Code location for each block of memory that was allocated but not de-allocated during
the time period
During Analysis:
Analysis Results:
Copyright© 2013, Intel Corporation. All rights reserved. *Other brands and names are the property of their respective owners.
41
2/28/2013
Child Program Analysis
Running a top level script is the norm for some Linux apps. For such cases, a different Child Program can be analyzed (not necessarily the app launched by Inspector XE).
Limitations:
– Only the first instance of Child Program will be analyzed by Inspector XE analysis.
– Child Program name is the one shown in Windows Task Manager or the name shown in “ps –aef” on Linux.
– Multi-process analysis is not supported for .NET applications.
Child Program Analysis is very useful in multi-process scenarios

Copyright© 2013, Intel Corporation. All rights reserved. *Other brands and names are the property of their respective owners.
inspxe-cl is the command line: – Windows: C:\Program Files\Intel\Inspector XE
\bin[32|64]\inspxe-cl.exe
– Linux: /opt/intel/inspector_xe/bin[32|64]/inspxe-cl
Help: inspxe-cl –help
Set up command line with GUI
Command examples: 1. inspxe-cl -collect-list
2. inspxe-cl –collect ti2 -- MyApp.exe
3. inspxe-cl –report problems
42
Great for regression analysis – send results file to developer Command line results can also be opened in the GUI
Command Line Interface

Copyright© 2013, Intel Corporation. All rights reserved. *Other brands and names are the property of their respective owners.
43
2/28/2013
Reporting
To generate a report: inspex-cl –R=<report-type> <results directory name>
Sample commands: inspex-cl –report-list
inspex-cl -report=summary
inspex-cl -report=problems
Example: cd /home/user/testProgram/r000mi
cd ..
inspex-cl -R=observations r000mi
Report generation is very convenient to use from command line.

Copyright© 2013, Intel Corporation. All rights reserved. *Other brands and names are the property of their respective owners.
44
Using the Intel® Inspector XE with Hybrid MPI + Threads
Compile the inspector_example.c code with the
MPI scripts
Use the command-line tool under the MPI run scripts to gather report data
mpirun -n 4 inspxe-cl –-result-dir insp_results
-collect mi1 -- ./insp_example.exe
Output is: a results directory for each MPI rank in the job
ls | grep inspector_results on Linux
Launch the GUI and view the results for each particular rank
inspxe-gui insp_results.<rank#> on Linux

Copyright© 2013, Intel Corporation. All rights reserved. *Other brands and names are the property of their respective owners.
Optimization Notice
45
Optimization Notice
Intel’s compilers may or may not optimize to the same degree for non-Intel microprocessors for optimizations
that are not unique to Intel microprocessors. These optimizations include SSE2®, SSE3, and SSSE3
instruction sets and other optimizations. Intel does not guarantee the availability, functionality, or
effectiveness of any optimization on microprocessors not manufactured by Intel. Microprocessor-dependent
optimizations in this product are intended for use with Intel microprocessors. Certain optimizations not specific
to Intel microarchitecture are reserved for Intel microprocessors. Please refer to the applicable product User
and Reference Guides for more information regarding the specific instruction sets covered by this notice.
Notice revision #20110804

Copyright© 2013, Intel Corporation. All rights reserved. *Other brands and names are the property of their respective owners.
Legal Disclaimer
46
INFORMATION IN THIS DOCUMENT IS PROVIDED “AS IS”. NO LICENSE, EXPRESS OR IMPLIED, BY ESTOPPEL OR OTHERWISE, TO ANY INTELLECTUAL PROPERTY RIGHTS IS GRANTED BY THIS DOCUMENT. INTEL ASSUMES NO LIABILITY WHATSOEVER AND INTEL DISCLAIMS ANY EXPRESS OR IMPLIED WARRANTY, RELATING TO THIS INFORMATION INCLUDING LIABILITY OR WARRANTIES RELATING TO FITNESS FOR A PARTICULAR PURPOSE, MERCHANTABILITY, OR INFRINGEMENT OF ANY PATENT, COPYRIGHT OR OTHER INTELLECTUAL PROPERTY RIGHT.
Performance tests and ratings are measured using specific computer systems and/or components and reflect the approximate performance of Intel products as measured by those tests. Any difference in system hardware or software design or configuration may affect actual performance. Buyers should consult other sources of information to evaluate the performance of systems or components they are considering purchasing. For more information on performance tests and on the performance of Intel products, reference www.intel.com/software/products.
BunnyPeople, Celeron, Celeron Inside, Centrino, Centrino Atom, Centrino Atom Inside, Centrino Inside, Centrino logo, Cilk, Core Inside, FlashFile, i960, InstantIP, Intel, the Intel logo, Intel386, Intel486, IntelDX2, IntelDX4, IntelSX2, Intel Atom, Intel Atom Inside, Intel Core, Intel Inside, Intel Inside logo, Intel. Leap ahead., Intel. Leap ahead. logo, Intel NetBurst, Intel NetMerge, Intel NetStructure, Intel SingleDriver, Intel SpeedStep, Intel StrataFlash, Intel Viiv, Intel vPro, Intel XScale, Itanium, Itanium Inside, MCS, MMX, Oplus, OverDrive, PDCharm, Pentium, Pentium Inside, skoool, Sound Mark, The Journey Inside, Viiv Inside, vPro Inside, VTune, Xeon, and Xeon Inside are trademarks of Intel Corporation in the U.S. and other countries.
*Other names and brands may be claimed as the property of others.
Copyright © 2012. Intel Corporation.
Intel Confidential
http://intel.com/software/products

Copyright© 2013, Intel Corporation. All rights reserved. *Other brands and names are the property of their respective owners.