intellectual capital of taiwan - chaire européenne de l ... · 3.2.4 e-learning prevalence at ......
TRANSCRIPT

Intellectual Capital in Taiwan
Dean & Professor Se-Hwa WuAssistant Professor Mu-Yen Hsu
College of CommerceNational Chengchi University
June 20, 2005
Intellectual Capital for Communities in the Knowledge Economy
University of Marne-La-Vall’ee & World Bank
2
Topics• I. Previous Research
– Knowledge Economy Index
• II. Current Research– TICRC Project
• III. Future Research– Intellectual Capital for Communities

I. Previous Research
Knowledge Economy Index (KEI)

4
The Introduction of Knowledge Economy Index in Taiwan
• Taiwan government declared 2001 as the first year of Knowledge Economy (KE) and has put a series of plans into action since then.
• The Knowledge Economy Promotion Committee comprised by 23 opinion leaders such as Morris Chang (TSMC) and Stan Shih (Acer), was established to promote the concept of Knowledge Economy.
• A two-year research project supported by the Knowledge Economy Promotion Committee and the Council for Economic Planning and Development was launched in 2001 to develop a knowledge assessment framework for Knowledge Economy.

5
Knowledge CapitalIntellectual property Human capital Intellectual machinery and equipmentHuman-machine complex system of the society
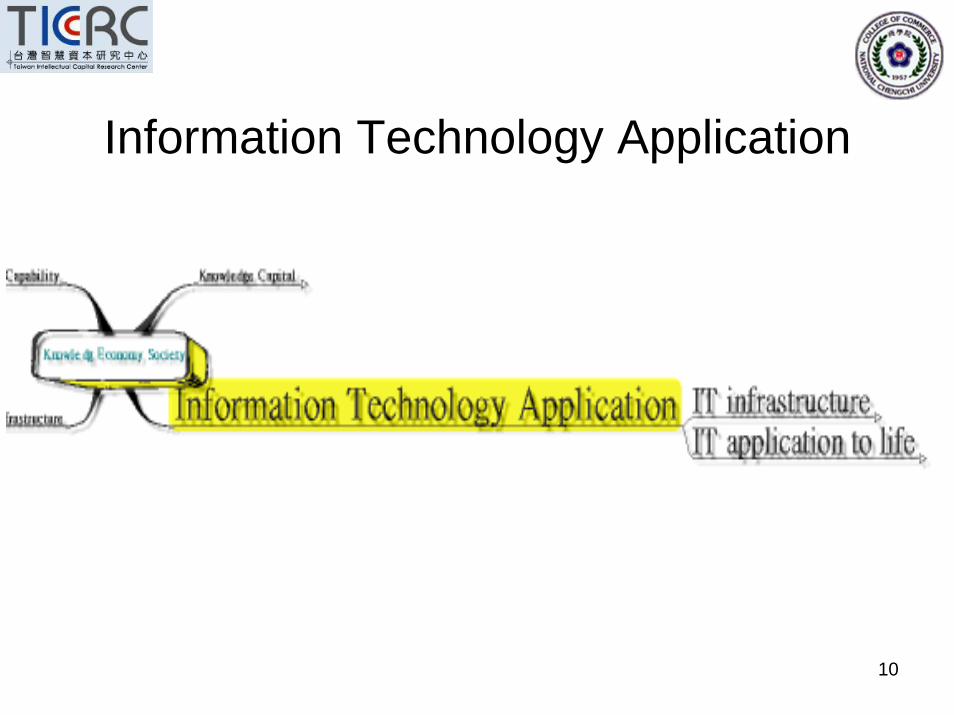
Information Technology Application
IT infrastructureIT application to life
Innovation Capability• Individual creativity• Innovation mechanism• Execution of ideas
Knowledge Economy InfrastructureBusiness ethics InternationalizationAdministration and legal systems Social securityEducation and culture Value of sustainable
development
Conceptual Framework of KE

6
Knowledge Capital

7
1.1 Intellectual Property
1.1.1 Quality and quantity of invention and design patents
1.1.2 Number of original literature and art publications and performances, and sales ensued
1.1.3 Novelty and originality of commercial designs1.1.4 Global awareness of corporate brands1.1.5 Net value and balance of technology trading
1.2 Human Capital 1.2.1 Quantity and quality of human resources1.2.2 Technology and humanities accomplishments of
the people1.2.3 On-the-job training and development
1.3 Intellectual Machinery and Equipment
1.3.1 Production and utilization of machinery and equipment with embedded knowledge
1.4 Human-machine Complex System of the Society
1.4.1 The speed of commodity, capital, and manpower flow within and across borders
Knowledge Capital

8
Innovation Capability

9
2.1 Individual Creativity
2.1.1 Creativity demonstrated by the general public in various fields
2.1.2 Quality and quantity of research institutions
2.2 Innovation Mechanism
2.2.1 Incubation mechanism and industry clusters2.2.2 Incentives for entrepreneurship and innovative
activities2.2.3 Knowledge exchanges among industrial,
academic, and research circles2.2.4 International collaboration of innovative
research and development4.2.5 The comprehensiveness of the intellectual
property promotion and transaction mechanisms2.3 Execution
of Ideas2.3.1 The speed and success rate of new product
introduction2.3.2 Demonstration of entrepreneurship
Innovation Capability
10
Information Technology Application

11
3.1 IT infrastructure
3.1.1 Penetration rate of broadband 3.1.2 Penetration rate of wireless
communication3.1.3 Internet prevalence
3.2 IT application to life
3.2.1 Level of e-business3.2.2 Level of government e-service3.2.3 E-commerce prevalence3.2.4 E-learning prevalence at
home/school/others3.2.5 Richness of digital contents3.2.6 Quality of information network
Information Technology Application

12
Knowledge Economy Infrastructure

13
4.1 Business ethics 4.1.1 Transparency and impartiality of corporate governance
4.2 Administration and legal systems
4.2.1 Transparency and efficiency of government administration
4.2.2 The comprehensiveness and enforcement of regulatory systems related to intellectual property and technology
4.3 Education and culture 4.3.1 Dynamics of creative teaching and educational innovations
4.3.2 Comprehensiveness of lifetime learning environment4.3.3 Press freedom and justice
4.4 Internationalization 4.4.1 Internationalization level of the society
4.5 Social security 4.5.1 Disparity in the distribution of wealth4.5.2 Digital discrepancy and network security4.5.3 Security and support for the unemployed and job
changers
4.6 Value of sustainable development
4.6.1 Ecosystem, environmental protection, and the utilization efficiency of natural resources
Knowledge Economy Infrastructure

14
Statistics informationIndicator Variable 1999 2000 2001
• Knowledge Capital
1.1.1 Quality and quantity of invention and design patents
1.Number of invention and design patents granted by the US(USPTO)
2.Number of scientific publications(NSC)3.Number of patent applications CII(TIER)
4526(4)8944(19)
1.02
5802(4)9203(19)
1.19
6539(4)9525(19)
1.14
1.1.2 Number of original literature and art publications and performances, and sales ensued
1.Number of art performances and exhibitions(social indicator)
2.Number of publications(social indicator)3.Sales of local music works (IFPI)
16350
3087121886.99
17709
34533-
18375
365468913.12
1.2 Human Capital
1.Number of researchers per 10,000 people(NSC)2.Number of researchers per 10,000 workers (NSC)3.Percentage of the population with higher education
(IMD)4.Number of R&D (FTE) workers per 1,000 people
(IMD)
39.7
90.4
33.5(8)4.721(13)
39.3
88.5
-4.673(15)
-
-
--
Note: ( ) refers to the source of the data

15
Knowledge Economy Satisfaction Survey – Findings
IndicatorOpinionLeaders* Intellectuals** Discrepancy
Knowledge Capital 5.40*** 5.27 0.13
Innovation Capability 5.13 5.11 0.02 Information Technology Application 5.71 5.89 -0.18
Knowledge Economy Infrastructure 4.47 3.95 0.52
* Opinion leaders refer to the 23 members of Knowledge Economy Promotion Committee.** Intellectuals refer to the selective senior managers aged over 40.*** Score from 1 to 10.

II. Current Research
TICRC Project

17
Research in the Theory of Intellectual C
apital Policy and Practices—
Four Years Project
Environmental Construction &
Concept Popularization
Creation of IC
Measurement and Valuation of IC
Report and Disclosure of IC
Management and Application of IC
International Collaborative
Research
Value Chain of IC
IC Valuation & Risk Assessment
Accounting Principle Modification & IC Report
Creation, Control, Accumulation & Management of IC
IC Application Strategy & Political Environment
Implementation of IC Database
Environmental Construction & Concept Popularization
International Collaborative Research
Introduction of TICRC

18
Creation, Control, Accumulation & Management of ICThe Creation and Accumulation of IC in Organizations
Collect qualitative and longitudinal data in supplement to otherquantitative projectsExplore the interactions among various components of intellectual capitalInvestigate the change of intellectual capital over the four yearsCompare and contrast qualitative vs. quantitative research results
The Integration between Balanced Scorecard and Intellectual CaiptalThe Linkage between process perspective and process & innovation capitalThe Linkage between learning perspective and IT & organizaion capitallead the formation of IC & Strengthen the management of IC
Accounting Principle Modification & IC ReportObjective: to propose accounting standards and disclosure requirements for reporting firms’intellectual capital.
Three layers of IC information:Financial statements—conform with GAAP.Pro forma IC statements—those IC expensed (e.g., R&D expenditures) or not recognized (e.g., employee compensation contracts) in financial statements may be re-capitalized in pro forma IC statements, provided some criteria are met.
Disclosures—provide a common set of IC metric disclosures, relating firms’ strategy to important IC components.

19
IC Valuation & Risk AssessmentThe IC Valuation Models & Risk AssessmentAs no sufficient secondary data is available for relevant IC markets, there is a need to develop
consistent and empirically testable models for the measurement and valuation of IC.
The Integration of Human Resource and IC:Fitness survey: Human Capita Indicators (10 suitable and 10 unsuitable)
Process Capital:Operation management, Customer management, Innovation management, Knowledge
management
IC valuation approach
IC measurement indicesIC valuation models
1. Technology Broker
2. Citation-Weighted Patents
3. Skandia Navigator™4. IC-Index™5. Intangible Assets Monitor6. Balanced Scorecard
1. Tobin’s Q2. Market-to-book ratio, M/B ratio3. Economic Value Added, EVA™4. Calculated Intangible Value, CIV5. Knowledge Capital Earnings, KCE6. Value Added Intellectual Coefficient, VAIC™7. Financial Method of Intangible Assets Measuring, FiMIAM
1. Discount cash flow method, DCF 2. P/E multiple3. Real Option
Improvement

20
IC Valuation & Risk AssessmentThe Integration of Customer Capital and IC: Construct Customer Capital through
Relation ManagementHow to create and increase customer capital? How to correctly measure customer capital and using it as a guideline to develop business and management strategies?How to effectively integrate customer capital and other aspects of intellectual capital in order to create a synergy to upgrade organizational competence?Case studies on what is the best management mechanism practice for a market-oriented
company in order to develop research hypotheses.Studying empirically the relationships among management mechanism, customer knowledge
competence, and performance by means of survey.IC Deploying Strategy & Policy Environment
DiscoveriesConsolidating the human capital of employee is the most important thing for firms to manage IC.There are dynamic interaction between human capital and organizational capital .Firms will lock in employee by building up specific organizational capital which is complementary to the human capital of employee .Employee will utilized the organizational capital by their own way to address their benefits.Utilizing Capability of ICWith the same IC stock, different utilizing strategies will lead to different performance.firms may have different Utilizing Capability to carry out the strategy. Utilizing Capability is the key to Utilize IC

21
TICRC Activities
Activities for Business(1) Workshops of IC Theory and IC
Practice for Business(2)Cross-industry IC survey(3)Cross-industry IC Case Studies(4)Interaction with Taiwanese Industries(5) NCCU EMBA Popularizing Courses(6)Book:IC of Taiwan(7) Brochure:IC Concept
Popularization
Meeting(1)Knowledge
Sharing Meeting (monthly)
Research Reports(1)Research Reports(quarterly) (2)PowerPoint of Knowledge
Sharing Meeting(3)Academic Papers(4)Records of Activities(5)Executive Reports
Digital information(1)English & Chinese Website
(http://www. ticrc.nccu.edu.tw )(2)English & Chinese Epaper(3)Literatures & Industrial
Database
International Activities(1)IC Researchers’ Visit(2) 2004 International
Conference on Intellectual Capital in Taiwan
(3) 26th Annual McMaster World Congress
(4) Intellectual capital for cmoomunities & JIC(Vol.6, No.2)-Tiger Brainpower
III. Future Research
Intellectual Capital for Communities

23
Taiwan Economy
• Formally in WTO, Customs Territory of Taiwan,Penghu, Kinmen and Matsu.
• Population=22,715,030 (2005/5)
• GDP >200 billion Dollars (after 1990)
• Growth rate= 3.63% (2005)
• Unemployed rate= 4.04%(2005)
• After 1960, Manufacturing sector leads the growth.• After 1990, Service sector (with knowledge
intensive industries) dominates the economy.
24
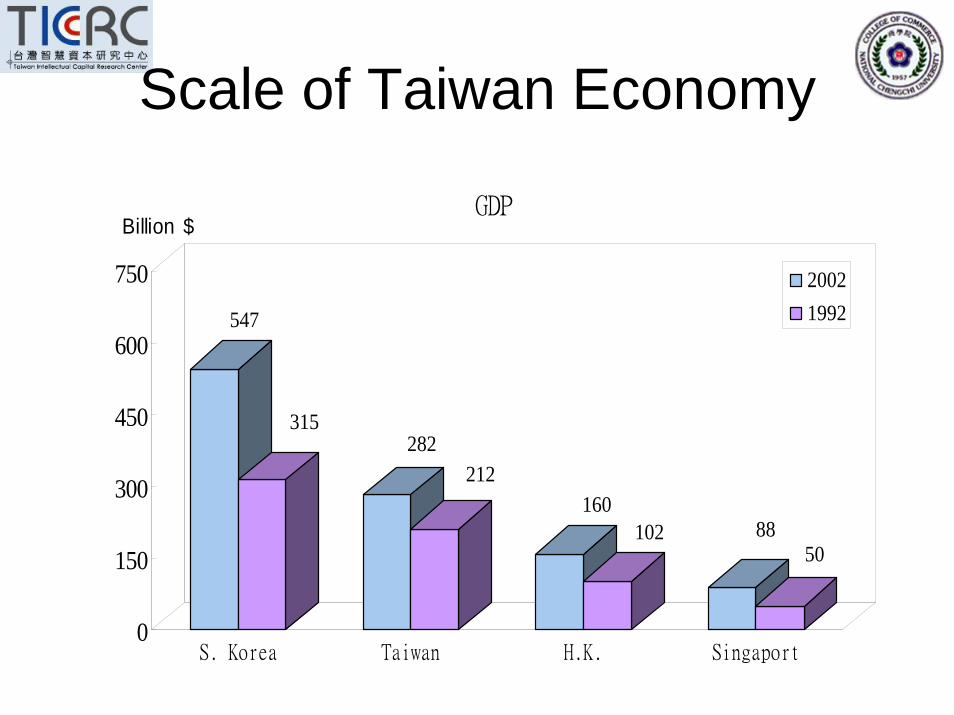
Scale of Taiwan Economy
547
315282
212160
102 8850
0
150
300
450
600
750
S. Korea Taiwan H.K. Singaport
GDP
20021992
Billion $

25
The Shifting of Industrial Structure in Taiwan
Source:Statistics Dep. Of MOEA
GNP(USM$) 1,614(1952) 48,600(1982) 314,400(2000) 295,600(2003)GNP/Capita(US$) 196(1952) 2,654(1982) 14,216(2000) 13,139(2003)
30.4%
67.8%
1950 1960 1970 1980 1990
Agriculture Manufacture
Service
20%
40%
60%
Labor Intensive Capital Intensive Knowledge Intensive
1.8%
2003
26
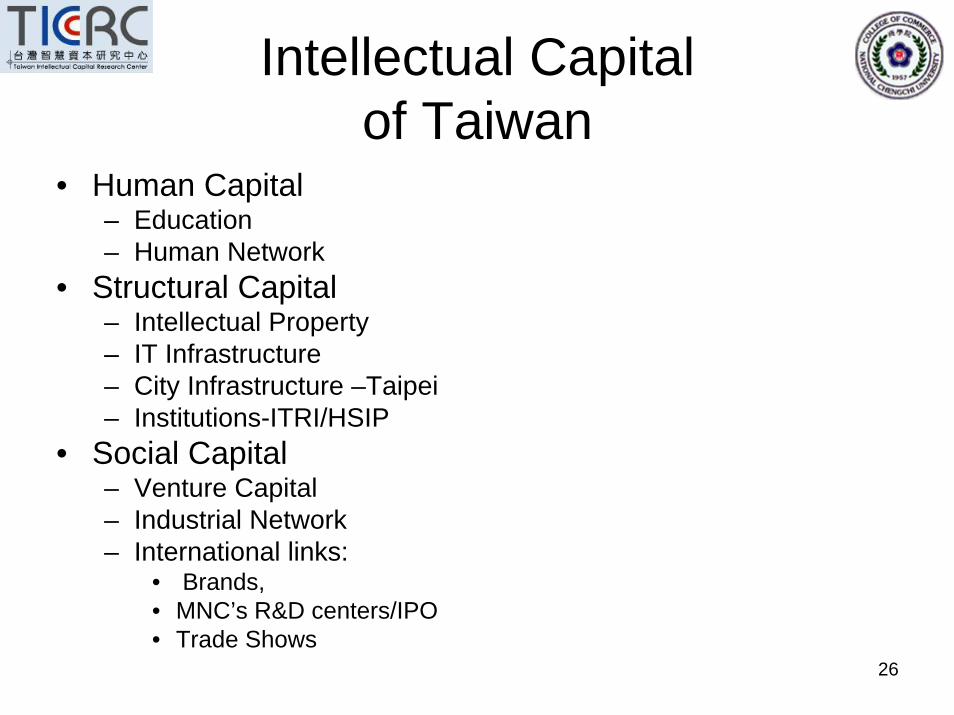
Intellectual Capitalof Taiwan
• Human Capital– Education– Human Network
• Structural Capital– Intellectual Property– IT Infrastructure– City Infrastructure –Taipei– Institutions-ITRI/HSIP
• Social Capital– Venture Capital– Industrial Network – International links:
• Brands,• MNC’s R&D centers/IPO• Trade Shows
27
Human Capital-Education
• Higher educations continue to grow• High Quality Human Capital focus on
Science and Technology• Chinese culture of industriousness:
– Working hour=2280hr/year– 24-hours working factory– 24-hours convenient store (not just 7-11)

28
Sufficient Human Input
0
10
20
30
40
50
60
70
80
90
100
0
50000
100000
150000
200000
250000
300000
350000
public universities 13 14 15 28 37 46 50 50 50
private universities 12 13 13 22 30 59 77 85 89
total graduated 64057 75128 99838 144354 196384 247890 266561 296884 -
1976 1981 1986 1991 1996 1999 2000 2001 2002
0
20
40
60
80
100
120
140
160
Humanality 18 20 26 36 50 41 28 29 27 32 26 32 37
Total 115 94 103 111 148 125 108 89 97 85 59 103 94
Socal Science 37 24 35 27 34 36 35 26 34 22 19 36 33
Science & Technology 60 50 42 48 64 48 45 34 36 31 14 35 24
1989 1990 1991 1992 1993 1994 1995 1996 1997 1998 1999 2000 2001
Statistics of students study abroad within government support
Statistics of student amount in public and private universities

29
120,796 136,676 152,518 169,230 183,214
290,324 318,767356,088
394,724 416,603
504,801538,840
583,496623,271
640,475
0
200,000
400,000
600,000
800,000
1,000,000
1,200,000
1,400,000
1998 1999 2000 2001 2002
Science &Techno
logy
0
100,000
200,000
300,000
400,000
500,000
600,000
700,000
800,000
900,000
Ph.D students 363 800 2,143 5,481 9,365 12,253 13,822 15,962 18,705
Master students 4,138 6,555 11,294 21,306 35,508 54,980 70,039 87,251 103,425
College students 140,857 158,181 184,729 253,462 337,837 470,030 564,059 677,171 770,915
1976 1981 1986 1991 1996 1999 2000 2001 2002
Profile of Academy Domain Percentage of Student profile
High Quality Human Capital focus on Science and Technology

30
Human Capital-Human Network
• Intelligence flows within and between Knowledge Capital Clusters of Taiwan, U.S., Japan and Mainland China.
• Taiwanese students were eager to study abroad and returned to work after learning the international working experiences.
How to develop intelligence flows within and between knowledge capital clusters

31
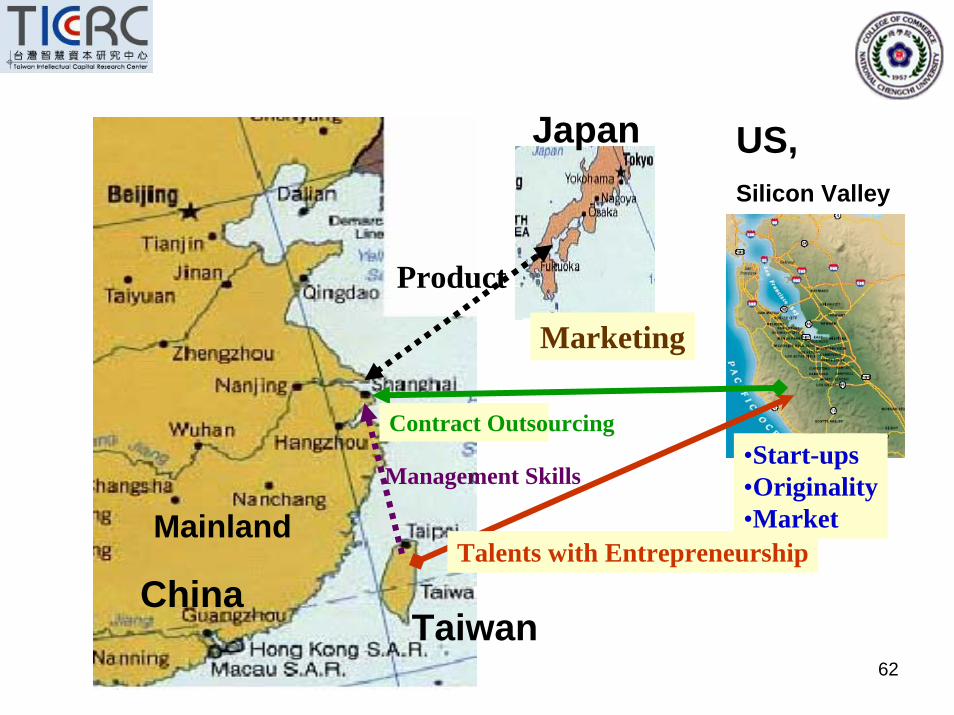
Talents with Entrepreneurship
•Start-ups•Originality•Market
Contract Outsourcing
Product
Marketing
Management Skills
Japan
Mainland
ChinaTaiwan
US,Silicon Valley
32
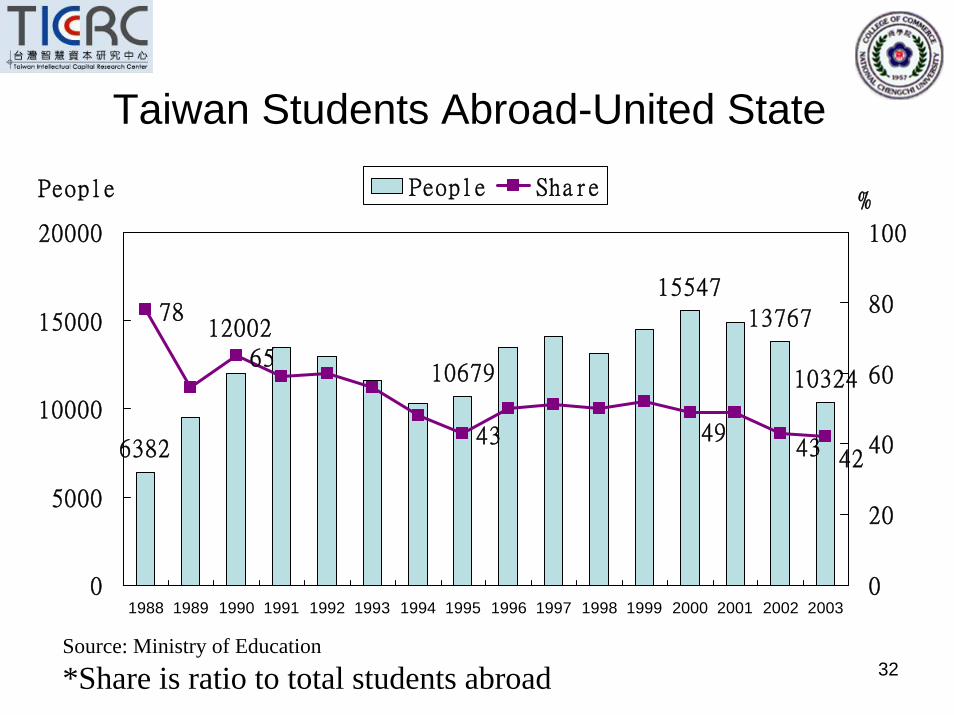
Taiwan Students Abroad-United State
6382
10679
15547
13767
10324
1200278
65
434243
49
0
5000
10000
15000
20000
1988 1989 1990 1991 1992 1993 1994 1995 1996 1997 1998 1999 2000 2001 2002 2003
People
0
20
40
60
80
100
%People Share
Source: Ministry of Education
*Share is ratio to total students abroad

33
Taiwan Students Abroad-Japan
14301645
1753 1745
1337
2145
2990
17
14
1213
10
8
67
56 6 6
56
5 5
0
1000
2000
3000
1988 1989 1990 1991 1992 1993 1994 1995 1996 1997 1998 1999 2000 2001 2002 2003
People
0
5
10
15
20
%People Share
Source: Ministry of Education*Share is ratio to total students abroad

34
92 137 422 622851 1004
1362
2080
25632859
30573265
41084292
0.75% 0.83%
1.89%
2.67%
3.38% 3.53%
4.06%
4.92%4.68%
4.18% 4.21%3.94%
4.25% 4.46%
0
500
1000
1500
2000
2500
3000
3500
4000
4500
5000
1987 1988 1990 1991 1992 1993 1994 1995 1996 1997 1998 1999 2000 2001年
Peop
le
0.00%
1.00%
2.00%
3.00%
4.00%
5.00%
6.00%
海外華人歸國至竹科創業人數 海外學人佔竹科員工總人數之比例
The Number and percentage of EmployeeComing back from Oversea to HSIP
Source: Administration Bureau of HSIP

35
Structural Capital-R&D, IP
• R&D Investments are steadily increasing.• R&D/GDP ratio is around 2%• R&D output grows dramatically
– Number of US patents (2001) Rank 4th.– Patent per million people (2001) rank 2nd.– Papers in SCI (2001) : Ranking No.17– Papers in EI (2001) : Ranking No.10

360
50
100
150
200
250
0
0.5
1.0
1.5
2.0
2.5
1986 1990 1995 2000Year
1.01%
R&D/GDP1990=1.66%
2.05%
Total R&D
28.7
197.6
11.5
123.5Public R&D
71.6
R&D/GDP
Private R&D38.8
%NT: Billions
R&D Investment of Taiwan
37
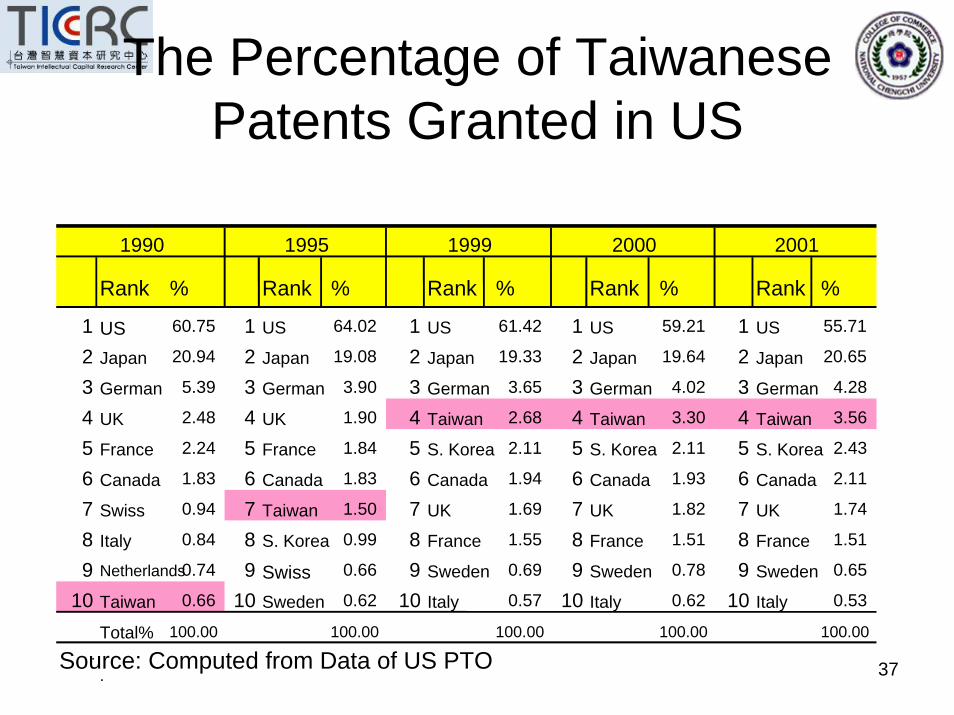
The Percentage of Taiwanese Patents Granted in US
Rank % Rank % Rank % Rank % Rank %
1 US 60.75 1 US 64.02 1 US 61.42 1 US 59.21 1 US 55.71
2 Japan 20.94 2 Japan 19.08 2 Japan 19.33 2 Japan 19.64 2 Japan 20.65
3 German 5.39 3 German 3.90 3 German 3.65 3 German 4.02 3 German 4.28
4 UK 2.48 4 UK 1.90 4 Taiwan 2.68 4 Taiwan 3.30 4 Taiwan 3.56
5 France 2.24 5 France 1.84 5 S. Korea 2.11 5 S. Korea 2.11 5 S. Korea 2.43
6 Canada 1.83 6 Canada 1.83 6 Canada 1.94 6 Canada 1.93 6 Canada 2.11
7 Swiss 0.94 7 Taiwan 1.50 7 UK 1.69 7 UK 1.82 7 UK 1.74
8 Italy 0.84 8 S. Korea 0.99 8 France 1.55 8 France 1.51 8 France 1.51
9 Netherlands0.74 9 Swiss 0.66 9 Sweden 0.69 9 Sweden 0.78 9 Sweden 0.65
10 Taiwan 0.66 10 Sweden 0.62 10 Italy 0.57 10 Italy 0.62 10 Italy 0.53
Total% 100.00 100.00 100.00 100.00 100.00
Source: Computed from Data of US PTO..
1990 1995 1999 2000 2001

38
Structural Capital-Infrastructure
• S & T Infrastructure of Taiwan– Taiwan: Worldwide top 5
• Well-equipped ICT infrastructure– Taiwan: Worldwide top 5, Asia top 3
• E-Government – Taiwan: Worldwide top 2

39
S & T Infrastructure of Taiwan
•According to IMD (2003) Science Infrastructure : Ranking No. 5Technology Infrastructure : Ranking No. 6
• According to WEF (2002/2003) • S&T Index: Ranking No. 2
Innovation Index: Ranking No. 2

40
Taiwan: Worldwide top 5
Asia top 3
Taiwan: Worldwide top 5
Asia top 3
Well-equipped ICT infrastructure2002 Digital Access Index (DAI)
2002Rank
1998Rank Country 2002
Rank1998Rank Country 2002
Rank1998Rank Country
1 Sweden 6 Dutch 11 5 U.S.2 7 Demark 7 13 H.K. 12 U.K.3 Iceland 8 Finland 13 Swiss4 24 Korea 9 22 Taiwan 14 20 Singapore5 Norway 10 Canada 15 Japan
Source:ITU, 2003/11 Items Taiwan H.K.Infrastructure 0.98 0.93
0.9980.83
0.68
0.51
Consuming ability 0.99Education 0.95
ICT service quality 0.56
Internet usage 0.45

41
Wideband density: worldwide top 6No. Country Units (thousand) 01~02Growh% Density% Penetration %
1 Korea 10,405 33% 21.9% 96%
2 H.K. 989 38% 14.6% 42%
3 Canada 3,500 23% 11.1% 50%
4 Iceland 25 140% 8.7% 21%
5 Belgium 870 90% 8.4% 51%
6 Taiwan 1,825 62% 8.1% 27%
7 Sweden 700 96% 7.8% 23%
8 Demark 360 61% 6.7% 11%
9 Australia 540 123% 6.5% 22%
10 Dutch 1,060 127% 6.5% 10%
11 U.S. 18,000 41% 6.2% 18%
12 Japan 7,806 104% 6.1% 27%
Source:ITU

42
ITU Digital Access Index(DAI)World’s First Global ICT Ranking
註:http://www.itu.int/ITU-D/ict/dai/index.html
source:ITU Digital Access Index: World’s First Global ICT Ranking, (2003)
43
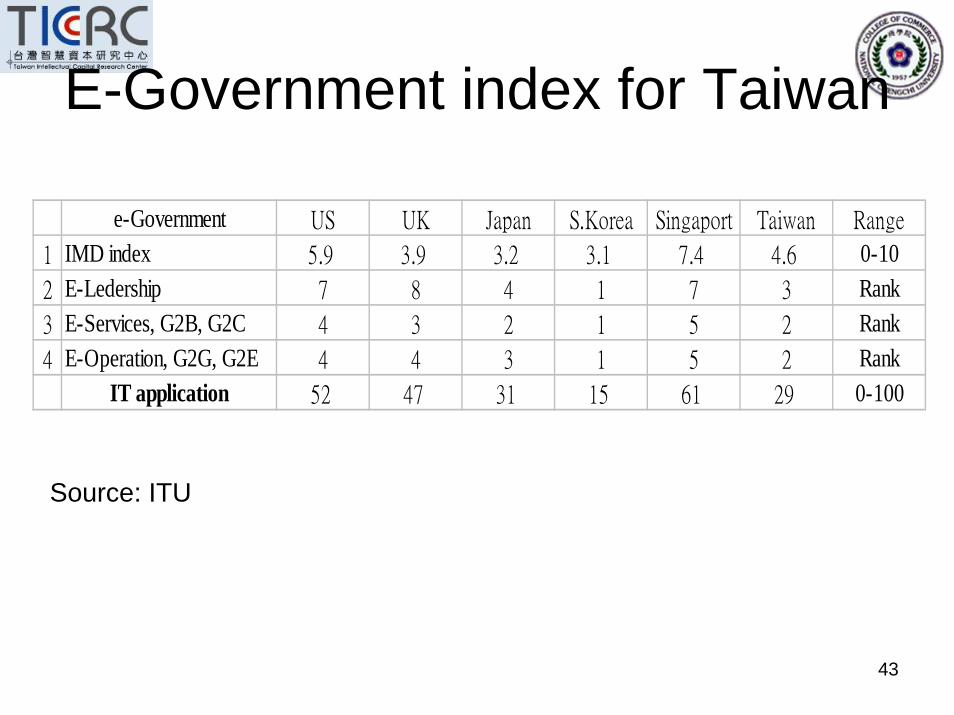
E-Government index for Taiwan
e-Government US UK Japan S.Korea Singaport Taiwan Range
1 IMD index 5.9 3.9 3.2 3.1 7.4 4.6 0-102 E-Ledership 7 8 4 1 7 3 Rank3 E-Services, G2B, G2C 4 3 2 1 5 2 Rank4 E-Operation, G2G, G2E 4 4 3 1 5 2 Rank
IT application 52 47 31 15 61 29 0-100
Source: ITU

44
Structure Capital-City Infrastructure
Intellectual Capital: Taipei City
• Creative Taipei– Culture innovation– Software Park
• Wireless Taipei – the world’s first mobile city
How to make cities “intelligent”

45
Creative Taipei Infrastructure for Culture Innovation• Huashan
Creative Culture Center
• Renovated from old winery into modern theatres for artists to perform various kinds of arts.

46
Creative TaipeiInfrastructure for Software Creation
• NanKang Software Park• One stop for all services related to idea creation

47
Wireless Taipei• Currently 86.2% of the
city’s households are equipped with personal computers, among which 89.4% have Internet access and 69% broadband usage rate .
• The Main hot point with “100% WLAN Coverage,”“Anytime, Anywhere, Any-device Access” will create new value-added applications and business opportunities.

48
Structure CapitalInstitutions
• For example:R&D Cluster :ITRI/HSP– ITRI=Industrial Technology Research Institute
• http://www.itri.org.tw/eng/index.jsp– HSP=Hsinchu Science Park
• http://eweb.sipa.gov.tw/en/visitor/about/
How to capitalize on knowledge capital, by new innovative social systems, in terms of the collective wealth of nations How to cultivate efficiency and renewal of the knowledge capital of regions
49
ITRI as a Hub of R&D Cluster• Roles
– Establish ITRI as the go-between for itself and the private sector
– ITRI play important role as “bridge” and “partner”• Lead in National R&D projects • Facilitate technological diffusion & spillovers• Human capital flow
• Ways of Technology Sharing– Spin-off company – Incubation center– Open Lab for technology R&D sharing– Bridging foreign technology and partners

50
ITRI’s Contribution to Taiwan IT Industry
• UMC: spin-off company from ERSO/ ITRI1st 4” Wafer Fab in TWN, 1979 (1,843M US$, 2001)
• TSMC: spin-off company from ERSO/ ITRI1st 6” Wafer Fab in TWN, 1987 (3,597M US$, 2001)
• VISC: spin-off company from ERSO/ ITRI1st 8” Wafer Fab in TWN, 1994 (260M US$, 2001)
• TMC: spin-off company from ERSO/ ITRI1st Mask Fab in TWN, 1988(76M US$, 2001)
•IC process and design technology was transferred from RCA, 1976
1980 1985 1990 1995 2000 2005
Maj
or Im
pact
• TTLA1st TFT LCD Alliance in TWN, 2001
51
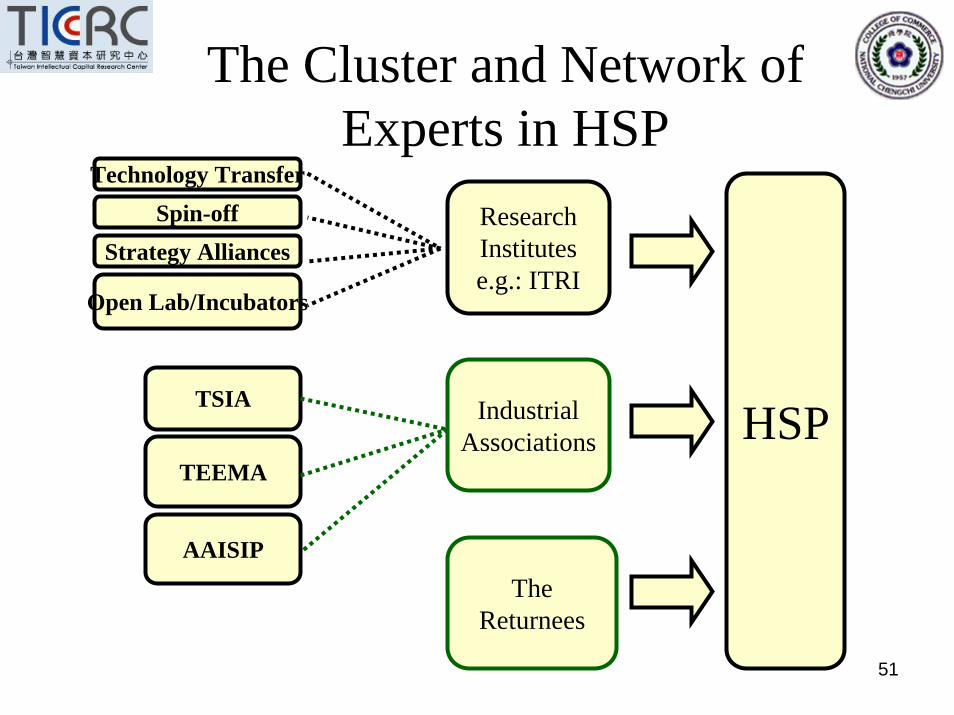
The Cluster and Network of Experts in HSP
HSP
ResearchInstitutese.g.: ITRI
Technology TransferSpin-off
Strategy Alliances
Open Lab/Incubators
IndustrialAssociations
TSIA
TEEMA
AAISIP
TheReturnees
52
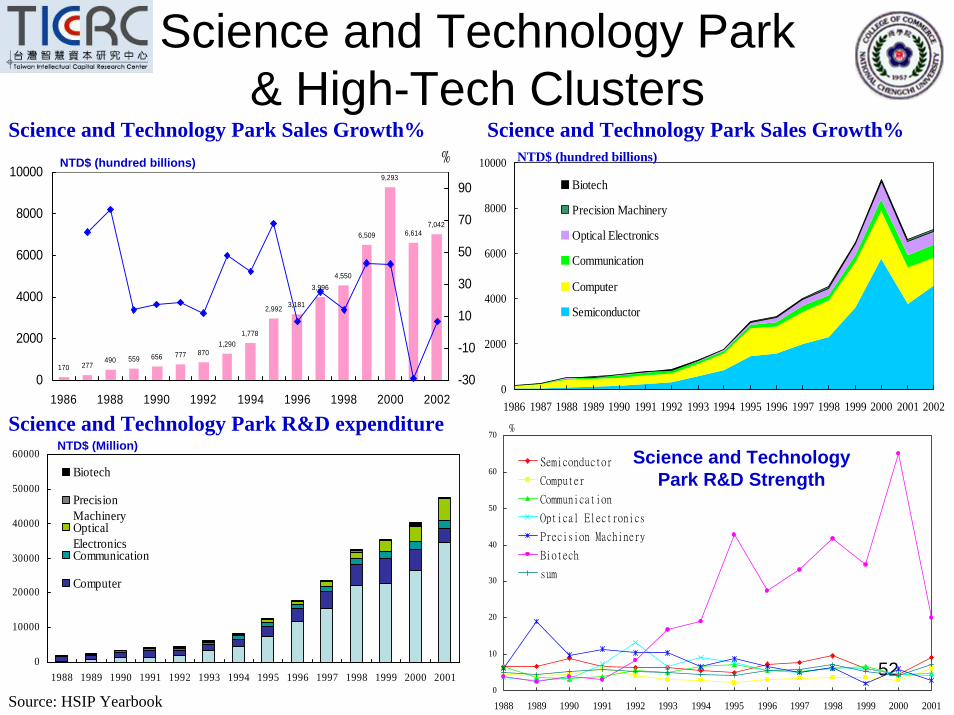
Science and Technology Park& High-Tech Clusters
0
2000
4000
6000
8000
10000
1986 1987 1988 1989 1990 1991 1992 1993 1994 1995 1996 1997 1998 1999 2000 2001 2002
Biotech
Precision Machinery
Optical Electronics
Communication
Computer
Semiconductor
Science and Technology Park Sales Growth%
Source: HSIP Yearbook
170 277490 559 656 777 870
1,2901,778
2,992 3,181
3,9964,550
6,509
9,293
6,6147,042
0
2000
4000
6000
8000
10000
1986 1988 1990 1992 1994 1996 1998 2000 2002-30
-10
10
30
50
70
90
Science and Technology Park Sales Growth%NTD$ (hundred billions) % NTD$ (hundred billions)
0
10000
20000
30000
40000
50000
60000
1988 1989 1990 1991 1992 1993 1994 1995 1996 1997 1998 1999 2000 2001
Biotech
PrecisionMachinery OpticalElectronicsCommunication
Computer
Science and Technology Park R&D expenditureNTD$ (Million)
0
10
20
30
40
50
60
70
1988 1989 1990 1991 1992 1993 1994 1995 1996 1997 1998 1999 2000 2001
Semiconductor
Computer
Communication
Optical Electronics
Precision Machinery
Biotech
sum
Science and Technology Park R&D Strength
%

53
Social Capital
• Venture Capital• Industrial Network • International links:
– Brands of Taiwan– MNC’s R&D centers/IPO– Trade shows

54
The Rise and Fall of SME in Taiwan
37,239 35,367 34,404 29,921
44,552 40,837
33,33038,59634,569
39,347
22,68120,34711,909
0
25000
50000
1990 1995 1999 2000 2001 2002 2003
Firm New Buiness Closed Business
Source: MOEA (Mar. 2004)
Prosperous entrepreneur environment

55
Social Capital-Venture Capital
• 2004 IMD Index for Venture Capital1. US 7.952. Hong Kong 7.063. Finland 6.84. Taiwan 6.76
Average 4.72
• 241 Venture Funds, 8719 investment cases with 4 Billion Euro Investment (Up to 2003).
• 92% fund from domestic relationship• 56.34% of funds come from industries• Focus on IT and semiconductor-related industries.• Leverage the relationships among Taiwan, US and
Mainland China

56
Capital Formation of Venture Funds
6 6 25 19 47 60113
50 38 56 39
125
210
538
968 953
697
134
499
4441
4050
3950
3253
2300
1332
794584
455
0
200
400
600
800
1000
1200
84' 85' 86' 87' 88' 89' 90' 91' 92' 93' 94' 95' 96' 97' 98' 99' 00' 01' 02'0
500
1000
1500
2000
2500
3000
3500
4000
4500
5000(1984-2002)

57
Shareholder Structure of VC Funds
• 92% of fund come from domestic relationships• Room for growth for foreign investors: 39% of funds of Asian VC funds
come from outside of Asia, versus 7.3% for Taiwan.
DomesticInstitution
71.01%
Others0.90%
DomesticIndividual20.78%
ForeignInstitution
7.25%Foreign
Individual0.06%

58Source: TVCA 2001 , CDIB
Individual20.84%
Institutions
79.16%
Industries
Insurance Co. and Bank
Foreign Investors
Government Agencies
56.34%
13.84%
7.25%
1.73%
Strong Industry ConnectionsStrong Industry Connections
• 56.34% of funds come from industries.

59
Grow with IT and Semiconductor Industries
• Focus on IT and semiconductor-related industries.• Telecom and opto-electronics will see most growth in near future.
1996 1997 1998 1999 2000 2001
Semiconductor 27.84% 15.77% 18.67% 20.52% 18.40% 22.30%
Information 30.52% 21.57% 15.13% 18.25% 17.60% 2.80%
Telecom 8.75% 4.64% 15.44% 12.18% 12.30% 16.30%
O pto-Electronics 6.22% 12.23% 10.34% 10.33% 9.80% 23.60%
Software 2.86% 5.01% 9.06% 5.78% 6.20% 4.20%
Biotech 0.34% 2.64% 3.23% 2.18% 2.90% 5.20%
O thers 23.47% 38.14% 28.13% 30.76% 32.90% 25.60%
Source: tvca 2001

60
9.0936.19
99.13
150.28 151.63
194.09
318.24
0
50
100
150
200
250
300
350
1994 1995 1996 1997 1998 1999 2000
• Taiwan VCs are actively pursuing global diversification
• Capital and technology flow toward the best opportunities wherever they are
Future Trend: GlobalizationFuture Trend: Globalization
Accumulated Overseas Investment
( US$M )
Source: TVCA 2001
61
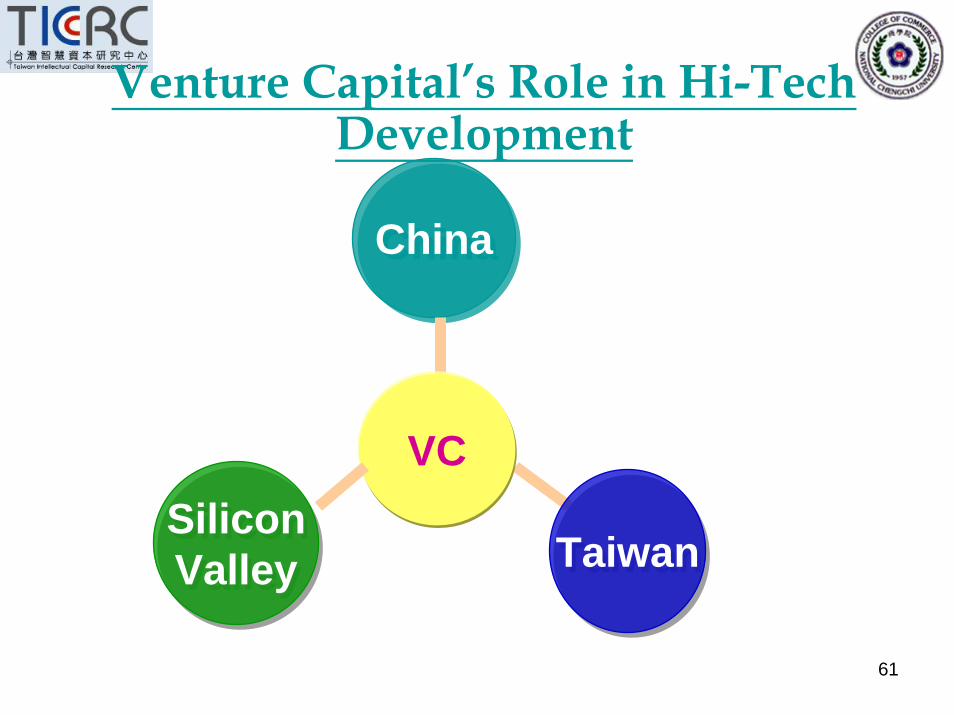
Venture Capital’s Role in Hi-Tech Development
ChinaChina
SiliconValley
SiliconValley
VC
TaiwanTaiwan
62
Talents with Entrepreneurship
•Start-ups•Originality•Market
Contract Outsourcing
Product
Marketing
Management Skills
Japan
Mainland
ChinaTaiwan
US,Silicon Valley
63
Leverage by Region for Future Cooperation in Hi-Tech Industry
• Taiwan– Experience – Product Commercialization– Market & Sales
• China– Resources– Local Market Opportunity
• Silicon Valley– Innovation – Technology

64
Taiwanese Investmentsin Mainland China
9.5%
63.6%53.7%53.4%
38.8%36.2%
0
2000
4000
6000
1991 1996 2001 2002 2003 2004.01~09
US$ Million
0%
20%
40%
60%
80%
Approved Investment Amount Share of Total Outward Investment
Source: Directorate General of Budget and Accounting(Nov. 2004)

65
Social Capital-Industrial Network
• Semiconductor– Spin-off from ITRI planted the seeds of key
companies, like UMC and TSMC.– Specialized foundry of Taiwan initiated the
vertical disintegration of IC industry• R&D Alliance of PC
– Technology Transfer from ITRI fostered the R&D Alliance of PC
– Above 60% of PC and Notebook are made in Taiwan.
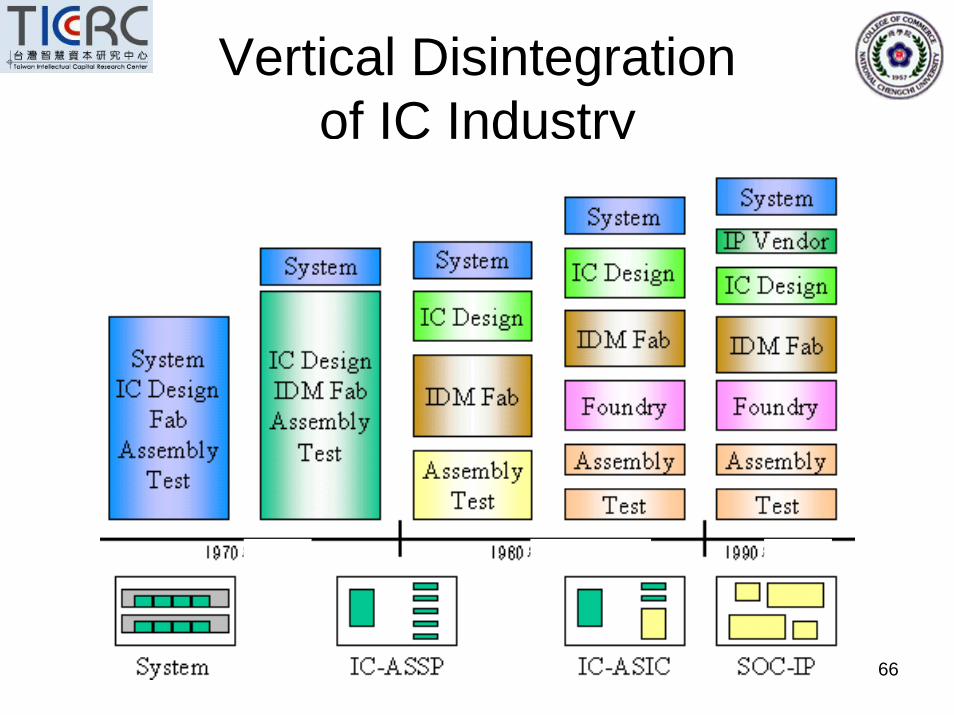
66
Vertical Disintegration of IC Industry

67
The Growth of Semi-conductorIndustry in Taiwan
Source:2003 Yearbook of Taiwan IC Industry
Sales
509 628 8821,327
2,1432,307 2,479
2,834
4,235
7,144
5,269
6,529
8,188
11,269
0
200
400
600
800
1000
1200
1991 1992 1993 1994 1995 1996 1997 1998 1999 2000 2001 2002 2003 2004
Test Fab. Design18.3%
59.1%
22.6%
Billions N
T
68
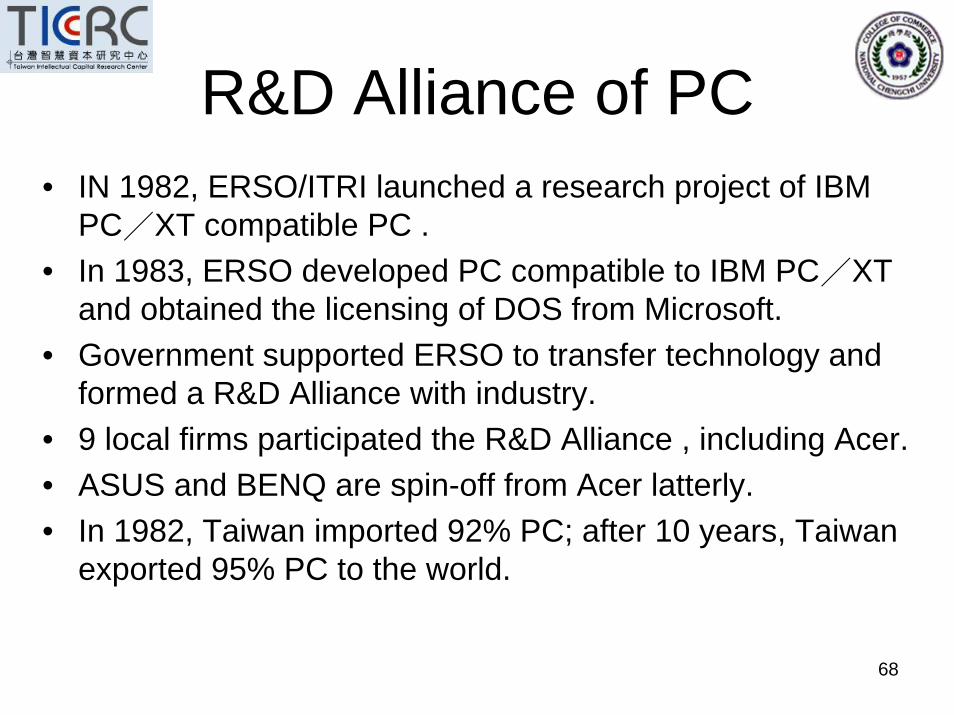
R&D Alliance of PC• IN 1982, ERSO/ITRI launched a research project of IBM
PC/XT compatible PC .• In 1983, ERSO developed PC compatible to IBM PC/XT
and obtained the licensing of DOS from Microsoft. • Government supported ERSO to transfer technology and
formed a R&D Alliance with industry.• 9 local firms participated the R&D Alliance , including Acer.• ASUS and BENQ are spin-off from Acer latterly.• In 1982, Taiwan imported 92% PC; after 10 years, Taiwan
exported 95% PC to the world.

69
Social Capital-International Link
• Customer Capital– International Brands– Reputation to International Purchasing Offices
• Market share around the world• R&D centers established by MNC’s• Trade shows

70
High-Tech Brands of Taiwan
71
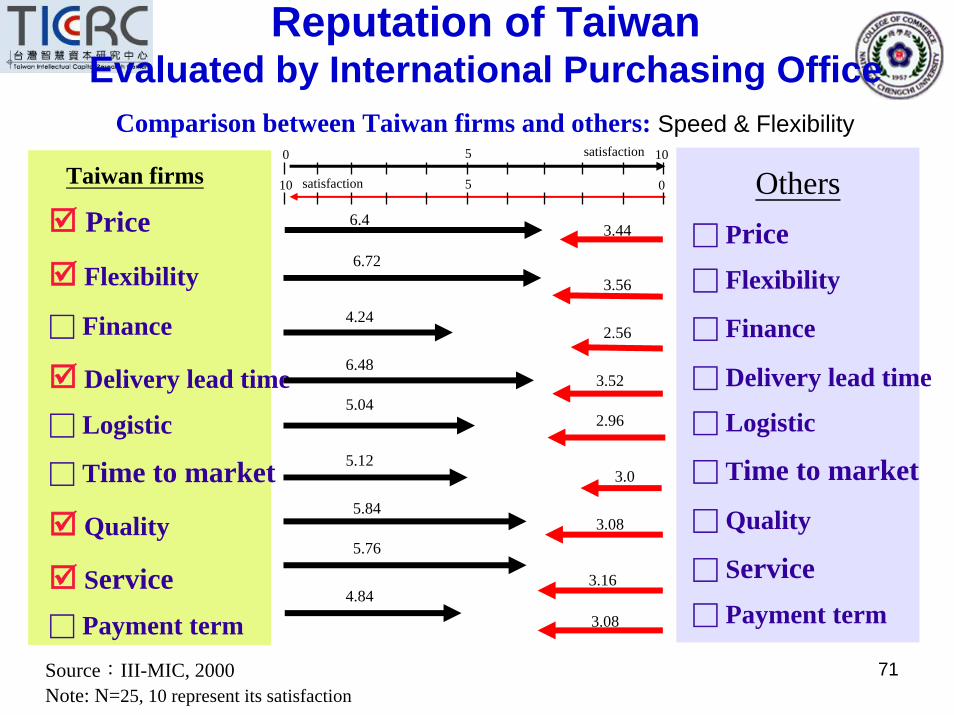
Comparison between Taiwan firms and others: Speed & Flexibility
Reputation of Taiwan Evaluated by International Purchasing Office
Price
Flexibility
□ Finance
Delivery lead time
□ Logistic
□ Time to market
Quality
Service□ Payment term
Taiwan firms Others
Source:III-MIC, 2000Note: N=25, 10 represent its satisfaction
0 105 satisfaction
□ Price□ Flexibility
□ Finance
□ Delivery lead time
□ Logistic
□ Time to market
□ Quality
□ Service□ Payment term
6.43.44
3.56
3.0
3.08
3.16
3.08
6.72
4.24
6.48
5.04
5.12
5.84
5.76
4.84
2.56
3.52
2.96
10 05satisfaction
72
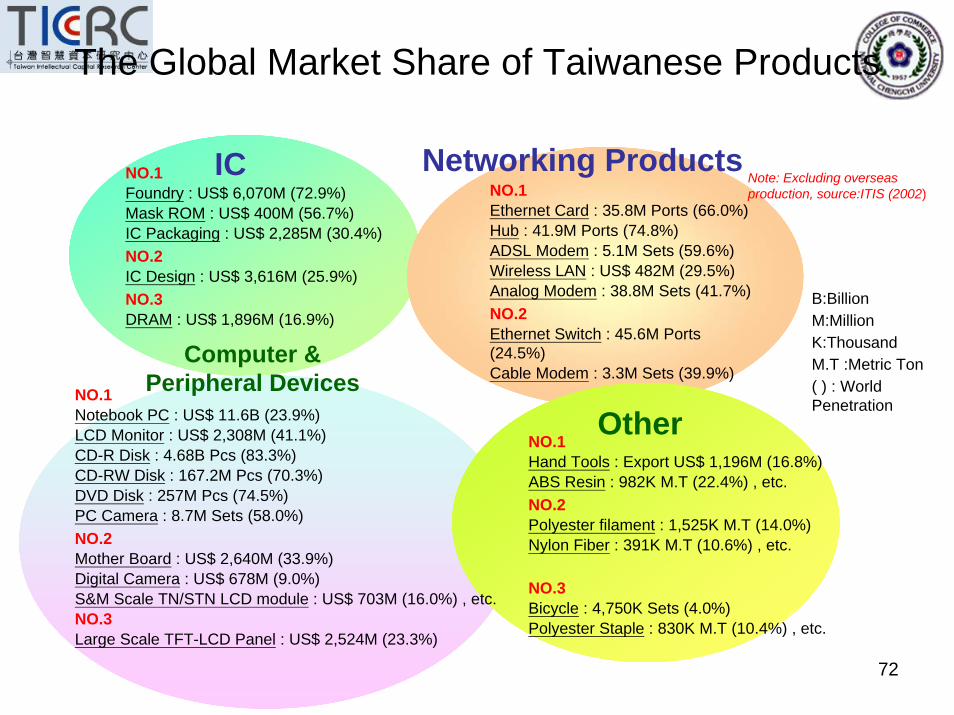
NO.1Foundry : US$ 6,070M (72.9%)Mask ROM : US$ 400M (56.7%)IC Packaging : US$ 2,285M (30.4%)NO.2IC Design : US$ 3,616M (25.9%)NO.3DRAM : US$ 1,896M (16.9%)
NO.1Notebook PC : US$ 11.6B (23.9%)LCD Monitor : US$ 2,308M (41.1%)CD-R Disk : 4.68B Pcs (83.3%)CD-RW Disk : 167.2M Pcs (70.3%)DVD Disk : 257M Pcs (74.5%)PC Camera : 8.7M Sets (58.0%)NO.2Mother Board : US$ 2,640M (33.9%)Digital Camera : US$ 678M (9.0%)S&M Scale TN/STN LCD module : US$ 703M (16.0%) , etc.NO.3Large Scale TFT-LCD Panel : US$ 2,524M (23.3%)
NO.1Ethernet Card : 35.8M Ports (66.0%)Hub : 41.9M Ports (74.8%)ADSL Modem : 5.1M Sets (59.6%)Wireless LAN : US$ 482M (29.5%)Analog Modem : 38.8M Sets (41.7%)NO.2Ethernet Switch : 45.6M Ports (24.5%)Cable Modem : 3.3M Sets (39.9%)
NO.1Hand Tools : Export US$ 1,196M (16.8%)ABS Resin : 982K M.T (22.4%) , etc.NO.2Polyester filament : 1,525K M.T (14.0%)Nylon Fiber : 391K M.T (10.6%) , etc.
NO.3Bicycle : 4,750K Sets (4.0%)Polyester Staple : 830K M.T (10.4%) , etc.
IC
Computer & Peripheral Devices
Networking Products
Other
B:BillionM:MillionK:ThousandM.T :Metric Ton ( ) : World Penetration
Note: Excluding overseas production, source:ITIS (2002)
The Global Market Share of Taiwanese Products

73
IBMIBM
AIXTRONAIXTRON
hphpMicrosoftMicrosoftDELLDELL SONYSONY
BECKERBECKERAvionic Systems
PERICOMPERICOMSemiconductor CorporationSemiconductor Corporation
intelintel
MNC that established R&D centers in Taiwan.
Ten more foreign enterprises are currently looking into or are engaged in negotiations to establish R&D centers.

74
Trade Shows• For Example:
The 25th anniversary of COMPUTEX TAIPEI, now the world's second most important IT show and the largest in Asia. – http://www.computextaipei.com.tw/index.htm

75
Conclusion
• From the experiences of Taiwan, we provide the primitive answers to the four questions of this conference

76
How to develop intelligence flows within and between knowledge capital clusters?
• Encourage students to study abroad and facilitate the environment for returnee.
• Attract the foreign student from oversea.• Improve the living environment and the
convenience for foreign experts to live.– May start from specific community, like HSP.
• Promote various kinds of trade show.

77
How to make cities “intelligent”?• Software
– Creative Culture• City life with security but without limits.• Easy to work and relax (live)24 hrs a day,7 day a week.
– Creative Education• Creative Education Projects in Taiwan, 2000-2004
• Hardware—wireless wideband– Convenient transportation for people to move.– Bookstore and Coffee stop for people to meet.– Easy to surf on the web anywhere and anytime.

78
How to capitalize on knowledge capital, by new innovative social systems, in terms of the
collective wealth of nations ?
• Encourage the venture capital industry by tax incentives or co-funding the innovative projects by pubic funds to share the risk.
• Facilitate the mutual investment among vertically related firms to increase the possibility of cooperation and successful commercialization.

79
How to cultivate efficiency and renewal of the knowledge capital of regions?
• Provide higher education– Sustainable supply of high-quality human capital
• Establish R&D center- Knowledge Capital of firm– Encourage firms, especially MNCs, to establish R&D center
or training center here.
• Create the R&D hub, like ITRI– To facilitate the flow of human capital and accommodate its
temporary shock/stock.– By R&D alliance, spin-off, technology transfer and seminar.

80
Reference• Chintay Shih(2005), Experiences of leading University,
and Research Institution in US,Taiwan, and Mainland China, College of Technology Management, NTHU,Special Advisor, ITRI, Jan.25,2005, tvca, Taipei
• Teresa Yang(2005), Venture Capital in Taiwan , Secretary-General of tvca, Nov 5, 2003
The data and help from MIC of III are highly appreciated.

81
Academic Papers
Conference 27
Journal 10
A Balanced Scorecard-based Framework for the Management and Reporting of Intellectual Capital in Not-for-profit Research Organizations:A Case Study of ITRI
A Process View of the Impact of Information Technology on the Management of Intellectual Capital in the Banking Industry
An Empirical Investigation of the Relation between Intellectual Capital and Firms' Market Value and Financial Performance
An Exploratory Set of Indicators between Information Technology And Process Capital & Innovation Capital--Based on A Simple Case Study
Building customer capital throguh relationship marketingBuilding Customer Capital through Relationship Marketing Activities-the Case of Taiwanese Multilevel
Marketing CompaniesComputer-integrated manufacturing and human capital-enhancing human resource managementDo Capital Markets Value Intellectual Capital。How Corporate Government Structure Affects the Performance of Insurance CompaniesIC dynamic lapabilities, and organizational innovation performanceIntegrating Human Resource Management and Performance Measurement:Effects on Organizational
PerformanceIntellectual capital and Performance in Causal Models :Evidence from the Information Technology Industry in
TaiwanIntertemporal Stable Pension FundingMobilizing Factors of Intellectual CapitalNoise Trading and Market QualityOn the relation of Systematic Risk and Accounting VariablesProgression Of IC:EEEC ModelRe-examining the Association between IT Investments and Firm Porfitability:A Componet --Based Approach。
Successful organizational transformation:The perspective of bifurcation and self-organization The Achieving Factors Model of Intellectual Capital ManagementThe Effects of Green Intellectual Capital upon Competitive Advantage of EnterprisesThe Role of Social in the Relationship between Human Capital and Career Mobility:Moderator or MediatorTop Management Team Social Capital in Taiwan: Impact on Firm Value in an Emerging Economy
……
82
Mr. Leif Edvinsson
Mr. Nick Bontis&
Giovanni Schiuma

83

84
Author (s) TitleMing-Chin Chen
Shu-Ju ChengYuhchang Hwang
Chaur-Shiuh Young Top management team social capital in Taiwan: Impact on firm value in an emerging economy
Shu-Chi LinYin-Mei Huang
The role of social capital in the relationship of human capital and career mobility: Moderator or mediator?
Wen-Ying WangChingfu Chang
Intellectual capital and performance in causal models: Evidence from the information technology industry in Taiwan
Aihwa ChangChiung-Ni Tseng
Building customer capital through relationship marketing activities in Taiwanese multilevel marketing companies
Anne Wu The integration between balanced scorecard and intellectual capital
Victor W. N. TsanChao-Ching Chang Intellectual capital system interaction in Taiwan
An empirical investigation of intellectual capital, market value and financial performance
85

86
