intellectual property protection and patterns of … property...intellectual property protection and...
TRANSCRIPT
Intellectual Property Protection and Patterns of Trade(Job Market Paper)
Jade Vichyanond�y
Princeton University
November 5, 2009
Abstract
The paper provides a simple theoretical model for understanding how the di¤erence in thelevel of intellectual property rights protection determines trade patterns. In particular, I examinehow countries�levels of patent rights protection a¤ect exports in industries with di¤erent degreesof reliance on innovation. In contrast to most models of institutional comparative advantage,which predict that countries with superior institutions specialize in industries that are verydependent on institutions, I show that higher patent rights protection does not necessarily leadto specialization in industries that rely heavily on innovation. There may exist a thresholdbeyond which occurs a reversal of specialization patterns, a consequence of monopoly powerinherent in intellectual property rights protection. I then use the model�s implications to assessempirically whether such predicted patterns hold in cross-country trade data and �nd evidencefor general patterns of specialization as well as a reversal of such patterns among countries withhigh levels of patent rights protection.
�[email protected] would like to thank Gene Grossman, Marc Melitz, and Esteban Rossi-Hansberg for their advice and guidance
throughout. I am also grateful to Alfonso Cebreros, Arpita Chatterjee, Rafael Dix Carneiro, Rasmus Jorgenson,Jan de Loecker, and Satoru Shimizu, as well as other participants of the student trade workshop for their valuablecomments, and the Center for Economic Policy Studies Fellowship and the International Economics Section SummerFellowship for research support.
1

1 Introduction
The past few decades have witnessed signi�cant improvements in the standards of intellectual
property rights protection throughout the world. Some of these improvements were matters of
domestic policy, designed to stimulate local invention through broader patent coverage or stricter
patent rights enforcement, while others stemmed from international pressure, as developed coun-
tries imposed minimum standards of intellectual property protection on developing countries as
requirements for joining trade agreements. One of the prime examples is the Agreement on Trade-
Related Aspects of Intellectual Property Rights (TRIPS), which has a list of minimum standards
concerning di¤erent types of intellectual property protection that WTO members had to adopt
within certain time frames.
While higher standards of intellectual property protection are likely to foster further innovation
in the economy as a whole, it is evident that the e¤ect of intellectual property policy varies from
one industry to another, depending on how signi�cant a role innovation plays in each industry.
This paper provides a simple theoretical model for understanding how the di¤erence in the level
of intellectual property rights protection determines trade patterns in di¤erent industries. In par-
ticular, I examine how countries�levels of patent rights protection a¤ect exports in industries with
di¤erent degrees of reliance on innovation. In contrast to most models of institutional comparative
advantage, which predict that countries with superior institutions specialize in industries that are
very dependent on institutions, I show that higher patent rights protection does not necessarily lead
to specialization in industries that rely heavily on innovation. There may exist a threshold beyond
which occurs a reversal of specialization patterns, a consequence of monopoly power inherent in
intellectual property rights protection.
The theoretical model is a Ricardian model with a continuum of goods, whereby production
of di¤erent goods employs labor and sector-speci�c intermediate goods in di¤erent intensities. In-
termediate goods need to be invented and the formulation of the invention process is based on
Grossman and Lai (2004). I �nd that among countries with low levels of patent rights protection,
which correspond to most developing countries, countries with relatively high protection specialize
in industries that are innovation-intensive, while countries with very low protection specialize in in-
dustries that are non-innovation-intensive. In contrast, the pattern may be reverse among countries
with high levels of patent rights protection; countries with especially high protection specialize in
2
industries that are non-innovation-intensive, while countries with only reasonably high protection
specialize in industries that are innovation-intensive. The rationale behind this reverse pattern is
that while higher patent rights protection encourages innovation activities, the enforcement that ac-
companies such protection is embodied in higher prices of patented products. On one hand, higher
innovation activities reduce the prices of �nal goods through the availability of more varieties of
intermediate goods (variety e¤ect). The increase in intermediate varieties is, however, tempered
by the fact that more varieties imply lower equilibrium output per variety (crowding e¤ect), which
lowers innovating �rms�expected pro�ts. On the other hand, increasing patent rights protection
puts an upward pressure on �nal good prices through higher markups of patented products (market
power e¤ect).
Since the variety e¤ect is subject to diminishing returns to labor in research and development,
raising the level of patent rights protection has a smaller impact on the creation of new varieties,
the higher the initial level of protection. Meanwhile, the market power e¤ect is not subject to any
diminishing returns; a higher level of patent rights protection increases �nal good prices by simply
raising the fraction of intermediate varieties that are protected. This is precisely why the market
power e¤ect may dominate the variety e¤ect at high levels of protection, leading to a reversal of
specialization patterns among countries with superior patent protection.
In the context of optimal patent policy, the dichotomy between the variety e¤ect and the market
power e¤ect is better known as the trade-o¤ between under-provision and monopoly distortions.
As pointed out by Nordhaus (1969), central to optimal patent policy is the fact that insu¢ cient
patent protection leads to sub-optimal levels of innovation while excessive patent protection lowers
consumer welfare through the monopolistic price setting of patent owners. Instead of studying
optimal patent policy, as in Gilbert and Shapiro (1990) or Grossman and Lai (2004), my model
takes countries�patent policies as given and derives patterns of trade that arise from the di¤erence
in those policies.
I then use the model�s implications to assess whether such predicted patterns appear in cross-
country trade data from 1980 to 1995. I make extensive use of the patent database provided by the
United States Patent and Trademark O¢ ce (USPTO) to construct proxies for innovation intensity
in di¤erent industries. For measures of patent rights protection across countries, I use the patent
rights protection index developed by Ginarte and Park (1997) as well as information on patent
3

reform episodes that occurred during the sample period. I found evidence for general patterns of
specialization as well as a reversal of such patterns among countries with high levels of patent rights
protection.
It is well-known that the adoption of intellectual property standards is subject to domestic
in�uence in the form of lobby groups and various government policies as well as foreign in�uence,
often as prerequisites for joining trade agreements. In view of these factors, I control for the
potential endogeneity issue by adopting the instrumental variable approach, using legal origins as
proxies for the level of patent rights protection, and �nd similar results.
Recently there has been a signi�cant body of literature on institutional sources of comparative
advantage, the manifestations of which include �nancial market development, contractual enforce-
ment, intellectual property rights, among others. Rajan and Zingales (1998) examines whether
�nancial development facilitates economic growth. Their hypothesis is that industries that are very
dependent on external �nancing develop faster in countries in which the �nancial system is well-
developed. The empirical �nding corroborates this, despite the potential bias in estimates due to
omitted variables and, more importantly, reverse causality. Nunn (2007) looks at how contractual
enforcement a¤ects export volumes. He tests whether industries in which products use inputs that
require sizeable numbers of relationship-speci�c investments export more in countries with good
contractual enforcement, and �nds that contractual enforcement explains patterns of trade very
well, in fact better than physical capital and human capital combined. Cunat and Melitz (2007)
develops a model that links labor market �exibility, industry volatility, and trade �ows, and �nd
that countries with more �exible labor markets display a comparative advantage in industries that
are subject to high-variance shocks. Similarly, Manova (2008) studies the impact of �nancial liber-
alization on exports patterns and �nds that liberalization increases exports disproportionately in
�nancially vulnerable industries, those that rely heavily on external �nance.
This paper focuses on a particular legal channel through which the institutional setting can
in�uence trade patterns across industries, namely intellectual property rights protection. The em-
pirical literature on this channel includes Maskus and Penubarti (1995), which studies whether
di¤erent levels of patent rights protection across countries in�uence bilateral trade �ows, using an
estimation approach based on an augmented version of the Helpman-Krugman bilateral gross im-
ports equations. They �nd that stronger patent rights protection leads to higher bilateral imports.
4

Similarly, Smith (1999) studies whether weak patent rights are barriers to US exports. Speci�cally,
she uses a commodity version of the gravity model to examine the e¤ect of di¤erences in patent
rights standards on the volumes of bilateral trade between the US (exporter) and other countries
(importers). The analysis also takes into account the degree of threat of imitation by importing
countries. Her �nding is that export volumes depend on patent rights standards; weak patent
rights discourage US exports to countries that pose a strong threat of imitation. Fink and Primo
Braga (1998) evaluates the e¤ect of patent rights protection on two types of trade �ows: non-fuel
trade aggregate and high technology trade. Their results con�rm previous �ndings of a positive
link between patent rights protection and trade �ows for non-fuel trade aggregate but do not �nd
any signi�cant e¤ect of patent rights protection on high technology trade.
Most studies on the importance of intellectual property rights make use of the gravity equation
and focus on bilateral trade. In Maskus and Penubarti (1995), industrial bilateral trade is esti-
mated as a function of the exporter�s industrial output and the importer�s market size, strength
of patent enforcement, and trade-resistance measures. Meanwhile, Smith (1999) uses the gravity
speci�cation; her key explanatory variables are the relative di¤erences in patent rights between two
regions.
This paper also uses each country�s quality of patent rights protection as a key variable. How-
ever, in order to see the e¤ects that patent rights protection has on di¤erent industries, we need
to take into consideration each industry�s relative dependence on patent rights protection. It is
therefore the interaction between a country�s overall level of patent rights protection and patent
intensities of di¤erent industries that ultimately drives patterns of trade �ows.
On the theoretical front, there are several studies that show mechanisms by which countries that
are di¤erent in some institutional aspect specialize in di¤erent industries. Nunn (2005) studies how
countries�di¤erent contracting environments a¤ect specialization patterns. With industries hetero-
geneous in the degree of reliance on relationship-speci�c investments, he �nds that countries with
better contracting environments specialize in industries that are more reliant on relationship-speci�c
investments. Addressing labor market �exibility, Cunat and Melitz (2007) presents a framework
in which within-industry dispersion of shocks is di¤erent across industries and �nd that countries
with more �exible labor markets specialize in industries with high volatility. In Costinot (2009b),
the dimension along which industries di¤er is complexity, de�ned as the number of tasks required
5

for production. He �nds that countries that have better institutions specialize in more complex
industries; these are industries that require a high degree of coordination among many workers,
and countries with superior judicial systems, through better contract enforcement, are more able
in forming larger teams of workers.
These studies, as well as this paper, derive patterns of trade by using the Dornbusch-Fischer-
Samuelson structure of a continuum of industries and obtaining Ricardian sources of comparative
advantage through exogenous di¤erences in institutional quality.1 Costinot (2009a) presents an
unifying theory for this class of models, using the mathematical concept of log-supermodularity
of country-level and sector-level characteristics to generate patterns of trade. However, contrary
to most studies on institutional comparative advantage, my paper demonstrates that when the
institution in question is the protection of intellectual property rights, we may observe a reversal
of specialization patterns.2
The modeling of product innovation is based on Grossman and Lai (2004), which studies the
determination of patent rights protection policies in a noncooperative framework. Their formula-
tion of the innovation process and its corresponding market structure is used in the intermediate
production stage of the economy in this paper, yielding closed-form solutions of the trading equi-
librium.
The paper is organized as follows. Sections 2 outlines the theoretical model and Section 3 derives
patterns of comparative advantage. Section 4 describes the estimating equation and identi�cation
strategies. Section 5 explains the data sources. Section 6 presents the main results and Section 7
reports the instrumental variable results. Section 8 studies the e¤ect of patent reforms. Section 9
consists of robustness checks. Section 10 concludes.
2 Model
In this section, I construct a simple model to illustrate how the di¤erence in the level of patent
rights protection acts as a source of comparative advantage and determines trade patterns. Unlike
1Alternatively, Chor (2009) develops a multi-country Ricardian model based on Eaton and Kortum (2002) toshow that comparative advantage is jointly determined by country-level institutional strength and industry-levelcharacteristics.
2 In the context of Costinot (2009a), the aggregate output function in my model is not always log-supermodularin the quality of countries�patent rights protection and the levels of sectors�dependence on innovation.
6
most models of institutional comparative advantage, which predict that countries with superior
institutions specialize in industries that are very dependent on institutions, I show that higher
patent rights protection does not necessarily lead to specialization in industries that rely heavily
on innovation. While higher protection encourages more innovation activity due to higher expected
pro�ts from invention, the fact that a greater fraction of innovation is protected implies higher
average prices of patented products. The opposing e¤ects of patent rights protection are key to
understanding the non-monotonicity of specialization patterns.
The model is a Ricardian model with a continuum of sectors z 2 [0; 1]: There are two countries
in the economy, H and F; which are identical in all aspects except for their levels of patent rights
protection. The representative consumer maximizes the utility function
U(t) =
Z 1
vu(v)e�rvdv;
where u(t) =R 10 b(z) ln q(z; t)dz; q(z; t) is the consumption of good z at time t; and r is the discount
factor. The consumer spends the share b(z) of his expenditure on good z, withR 10 b(z)dz = 1:
The production of good z has constant returns to scale and takes the Cobb-Douglas form
F (L(z); I(z)) = L(z)�(z)X(z)1��(z);
where L(z) and X(z) are the amounts of labor and aggregate intermediate input used in sector
z: The share of expenditure on labor is �(z); where we assume �(z) � 1; �0(z) > 0; the second
condition implies that high-z goods are labor-intensive relative to low-z goods. As will be introduced
below, X(z) represents the component of �nal good z that requires innovation. This production
structure allows us to capture the fact that sectors are heterogeneous in their degrees of reliance
on innovation.
The aggregate intermediate input is sector-speci�c and is de�ned as
X(z) =
"Z n(z)
0x(z; i)�di
#1=�;
where each x(z; i) is an intermediate variety, n(z) is an endogenous measure of sector-z varieties,
and � = 11�� is the elasticity of substitution among intermediate varieties, with 0 < � < 1.
7
The production structure of intermediate varieties is based on Grossman and Lai (2004). The
�ow of new intermediate varieties suitable for sector z at time t is
�(z; t) = Lr(z; t)�K(z; t)1��;
where Lr(z; t) is the amount of labor engaged in research and development (R&D) in sector z;
K(z; t) is the knowledge capital in sector z; and � is the share of labor in producing new varieties.
This equation characterizes the R&D process that in equilibrium determines the measure of inter-
mediate varieties available in sector z: The knowledge capital K(z; t) can alternatively be thought
of as the exogenous stock of fertile ideas from which inventions in sector z can �ow. I make the
assumption that, like all other variables in the model except the level of patent rights protection,
K(z; t) is identical in both countries, to highlight the channel through which di¤erent levels of
patent rights protection a¤ect specialization patterns: intermediate varieties.3
A Cobb-Douglas production function, as opposed to a linear production function, is chosen for
the intermediate variety production stage to introduce diminishing marginal returns to labor in
creating new varieties. I will show below that �; which captures the degree of diminishing returns
to labor in R&D, is crucial in determining the direction of trade patterns because it governs the
strength of the variety e¤ect relative to that of the market power e¤ect.
Each intermediate variety has �nite economic life � : A new intermediate variety is useful in the
production of �nal goods for a period of � from the time of its creation and its value drops to zero
after a period of � has elapsed.
Patent rights protection in this model applies to intermediate varieties. To �x ideas, we can
think of intermediate varieties as production processes and each patent as a "process patent," as
opposed to a "design patent."4 Heterogeneity in the quality of patent rights protection can take
many forms, such as patent length, patent rights enforcement, or participation in international
agreements. Without loss of generality, I focus on patent rights enforcement as the dimension in
which countries di¤er regarding patent rights protection and therefore assume that patent length
is greater than the economic life of intermediate varieties, so that patent length is of no relevance
3Allowing for K(z; t) to di¤er between two countries only adds one more parameter, relative knowledge capitalKH (z;t)KF (z;t)
, to the determination of specialization patterns but generates the same qualitative results.4Approximately 90% of patents in the USPTO patent database are process patents. The rest are design patents
and plant patents.
8

in the model. The probability that a patent is enforced by country c at any point in time is !c,
where I assume that !H > !F : When a variety is under patent enforcement, the patent owner has
exclusive rights to produce and sell the protected variety. When it is not, anyone can produce and
sell the variety. Once a variety has been invented, the actual production of each variety requires
one unit of labor for a units of output.
Final goods z are homogeneous and tradable, whereas intermediate varieties are di¤erentiated
and non-tradable.5 The mechanisms that operate in the intermediate production stage capture
parsimoniously how patent rights protection a¤ects productivity.
3 Equilibrium
Since each �nal good z is homogeneous, it is produced by either H or F; depending on which
country has a lower per-unit cost. If good z is produced in country c; there will be
nc(z) = ��c(z) = �Lc;r(z)�Kc(z)
1��
intermediate varieties. Note that time subscripts have been dropped because in equilibrium all
variables are time-invariant after a period of � has elapsed. For the !cnc(z) varieties whose patent
rights are enforced, each patent holder charges the markup price of �awc and earns a pro�t of
�c(z) =��1a wcxc(z); where � = 1
� , wc is the wage in country c; and xc(z) is the output of a typical
variety with an enforced patent. In contrast, the patent rights of the other (1� !c)nc(z) varieties
are not enforced, so any �rm can produce them. These �rms charge the competitive price of 1awc:
Pro�t maximization implies that the marginal value product of labor in the R&D sector is equal
to the wage rate. Thus, we have
vc(z)�L��1c;r (z)K(z)
1�� = wc;
where the value of a patent is the discounted value of expected pro�ts,
vc(z) = !c1� e�r�
r
�� 1a
wcxc(z):
5The assumption of non-tradability of intermediate goods is not required for the qualitative results of the modelbut is adopted because it yields concise expressions that clearly illustrate the model�s main mechanisms.
9
This implies that the amount of labor engaged in R&D in industry z is
Lc;r(z) =
�!c1� e�r�
r
�� 1a
xc(z)�K(z)1��� 1
1��:
The equation above shows that a higher level of patent enforcement raises the value of a patent,
thereby attracting more labor into R&D. Denoting (z) = 1�e�r�r
��1a �K(z)1��; we can now express
the number of intermediate varieties as
nc(z) = �( (z)!cxc(z))�
1�� : (1)
The price of the aggregate intermediate input Xc(z) is
Pc(z) =
�!cnc(z)(
�
awc)
1�� + (1� !c)nc(z)(1
awc)
1��� 11��
;
with the �rst and second terms corresponding to enforced and non-enforced varieties, respectively.
Taking the wage in country H as the numeraire and using (1), the relative price of the aggregate
intermediate input in industry z is
PH(z)
PF (z)=
�!H!F
� �1��
11��
�xH(z)
xF (z)
� �1��
11��
�!H(�
1�� � 1) + 1!F (�1�� � 1) + 1
� 11�� 1
w: (2)
The above expression captures the three channels through which the level of patent rights pro-
tection a¤ects the price of the aggregate intermediate input. First, the term�!H(�
1���1)+1!F (�1���1)+1
� 11��
captures the market power e¤ect, whereby a higher level of patent rights protection ensures en-
forcement of patent rights for a greater fraction of intermediate varieties. As a consequence, more
varieties command markup prices, leading to an upward pressure on the price of the aggregate
intermediate input. There is also the variety e¤ect, represented by�!H!F
� �1��
11��
; for a given level
of output per variety xc(z); a higher degree of patent rights protection increases expected pro�ts
in the R&D sector due to a higher patent value, thereby attracting more labor into innovation
activity and resulting in an increase in the number of intermediate varieties and a lower aggregate
intermediate input price. Finally, the term�xH(z)xF (z)
� �1��
11��
captures the crowding e¤ect, whereby a
higher number of intermediate varieties�as a result of higher patent rights protection�implies �ercer
10

competition among varieties and, generally, lower equilibrium output per variety. The crowding
e¤ect works against the variety e¤ect by lowering expected pro�ts of innovating �rms, thereby
reducing the incentive to invest in innovation.
In order to solve for the pattern of specialization, we need to characterize the relative price
of �nal goods. Denoting eP (z) as the price of good z; we speci�cally have to solve for ePH(z)ePF (z) =�PH(z)PF (z)
�1��(z) �1w
��(z): Using the fact that consumers spend the share b(z) of their income on �nal
good z, no matter where it is produced, we can express xH(z)xF (z); which determines the strength of the
crowding e¤ect, as xH(z)xF (z)
=�!H!F
��� �!H+(1�!H)���!F+(1�!F )���
��(1��)w1�� and, combining with (2), �nally
obtain ePH(z)ePF (z) =24�!H
!F
� �1��
�!H(�
1�� � 1) + 1!F (�1�� � 1) + 1
� 1��1��
w�
1��
351��(z) 1w: (3)
This expression, the relative price of �nal good z; pins down the pattern of specialization. Country
H has comparative advantage and specializes in all industries z such that ePH(z) < ePF (z), whilecountry F has comparative advantage and specializes in all industries z such that ePH(z) > ePF (z).
To close the model, note that the amount of labor used in the production of good z is
L(z) = Lf (z) + Li(z)
where Lf (z) is the amount of labor used by the �nal good producer of z and Li(z) is the amount
of labor used in the production of intermediate varieties. The latter term can be broken down
into the amount of labor used in R&D, denoted Lr(z); the amount of labor used in the actual
manufacturing of enforced intermediate varieties, denoted Lm;enf (z); and the amount of labor used
in the actual manufacturing of non-enforced intermediate varieties, denoted Lm;compet(z). Then the
labor market clearing condition for country c can be expressed as
Lc =
Zz2Zc
(Lc;f (z) + Lc;r(z) + Lc;m;enf (z) + Lc;m;compet(z))dz;
where Zc is the range of z in which country c specializes.
The �nal equilibrium condition equates savings and investment. Savings are the di¤erence be-
tween national income, which equals wcRz2Zc Lc(z)dz+r
Rz2Zc K(z)dz+
Rz2Zc !cnc(z)�c(z)dz; and
aggregate spending, denoted Ec; where wcRz2Zc Lc(z)dz is the income of workers, r
Rz2Zc K(z)dz
11
is the returns to the stock of fertile ideas, andRz2Zc !cnc(z)�c(z)dz is the pro�ts of �rms holding
live patents. I assume that pro�ts earned by patent owners are distributed to consumers equally,
like government transfers. All investment is devoted to R&D and this activity has the cost of
wcRz2Zc Lr;c(z)dz + r
Rz2Zc K(z)dz: Therefore, we have
wc
Zz2Zc
Lc(z)dz+r
Zz2Zc
K(z)dz+
Zz2Zc
!cnc(z)�c(z)dz�Ec = wc
Zz2Zc
Lc;r(z)dz+r
Zz2Zc
K(z)dz:
We can now obtain the following results:
Proposition 1 For any pair of arbitrary patent enforcement levels !H and !F ; there exists a
unique equilibrium.
Proof. See Appendix.
Proposition 2 For � > ����� , H specializes in low-z goods (patent-intensive) and F specializes
in high-z goods (non-patent-intensive).
For � < ����� , the pattern of specialization depends on !H and !F as follows:
� If !H < ������ and !F < ��
���� , then H specializes in low-z goods (patent-intensive) and F
specializes in high-z goods (non-patent-intensive)
� If !H > ������ and !F >
������ , then H specializes in high-z goods (non-patent-intensive) and
F specializes in low-z goods (patent-intensive)
� Otherwise, the pattern is ambiguous and depends on fundamental variables �; �; �:
Proof. See Appendix.
To understand the above results, it is useful to look at the behavior of m(!c; �; �; �) �
!�
1��c
�!c(�
1�� � 1) + 1� 1��1�� from (3), which is the average labor requirement per unit of aggre-
gate intermediate product. This term characterizes the interaction among the variety e¤ect, the
crowding e¤ect, and the market power e¤ect. Figure 1 shows the plot of m(!c; �; �; �) when
� > ����� : In this range of �; note that m(!c; �; �; �) is monotonically decreasing in !c. Intuitively,
when the level of patent rights protection increases, innovating �rms face an incentive to allocate
more labor to the invention of intermediate varieties due to an increase in expected pro�ts guaran-
teed by a more extensive enforcement of patent rights. The increase in the number of intermediate
12

varieties, however, leads to lower equilibrium output per variety, which dampens the increase in
expected pro�ts. Meanwhile, a higher level of protection guarantees enforcement of patent rights
for a greater fraction of varieties, resulting in an upward pressure on m(!c; �; �; �). In this range
of �; as the level of patent rights protection increases, the downward pressure on m(!c; �; �; �)
brought about by the net variety e¤ect dominates the upward pressure due to the market power
e¤ect. As a result, the country with the higher level of patent rights protection has comparative
advantage in innovation and specializes in patent-intensive goods, while the country with the lower
level of patent rights protection specializes in non-patent-intensive goods.
When � < ����� ; however, m(!c; �; �; �) is no longer monotonically decreasing in !c, as can be
seen in Figure 2. In this range of �, there are two cases in which patterns of comparative advantage
are explicitly determined. The �rst case is that in which both countries� protection levels are
below ������ : In this range of !c, m(!c; �; �; �) is decreasing in !c, just as when � >
����� ; so the
country with the higher level of protection has comparative advantage in innovation and specializes
in patent-intensive goods. The second case is that in which both countries�protection levels are
above ������ : In this range of !c; m(!c; �; �; �) is increasing in !c. Therefore, as the level of patent
rights protection increases, the net variety e¤ect is dominated by the market power e¤ect, implying
that the country with the lower level of protection has comparative advantage in innovation and
specializes in patent-intensive goods and the country with the higher level of protection specializes
in non-patent-intensive goods. If, however, one country�s level of protection is higher than ������
and the other country�s level of protection is above ������ ; we cannot immediately determine the
direction of comparative advantage because m(!c; �; �; �) is non-monotonic in !c in the range of
!c in question; we have to look at the actual values of m(!c; �; �; �) for the two countries. Here,
the country with the lower m(!c; �; �; �) is the one that has comparative advantage in innovation
and thus specializes in patent-intensive goods.
We can see that �; the share of labor in producing new varieties, plays an important role in
determining patterns of specialization. When � is large, labor is very productive in creating new
varieties, magnifying the variety e¤ect relative to the market power e¤ect, whose magnitude is
independent of �. If � is su¢ ciently large enough, e.g. � > ����� ; the net variety e¤ect trumps the
market power e¤ect as !c increases, so the country with the higher level of patent rights protection
specializes in patent-intensive goods. When � is small, i.e. � > ����� ; labor is not very productive
13

in creating new varieties. As a result, the net variety e¤ect does not always dominate the market
power e¤ect as !c increases; the net variety e¤ect dominates the market power e¤ect for low levels
of !c; while the market power e¤ect dominates the net variety e¤ect for high levels of !c: Hence, the
opposite pattern of specialization holds among countries with high levels of patent rights protection
when � is su¢ ciently small.
To understand the domination of the market power e¤ect at high levels of !c; as opposed to
low levels of !c; it is useful to look at the behavior of�!c(�
1�� � 1) + 1� 11�� and !
�1��
11��
c ; which
denote, respectively, the market power component and the variety component of m(!c; �; �; �).
Since the �rst and second derivatives of�!c(�
1�� � 1) + 1� 11�� with respect to !c are 1
1�� (�1�� �
1)�!c(�
1�� � 1) + 1� 11���1 > 0 and 1
1�� (11�� � 1)(�
1�� � 1)2�!c(�
1�� � 1) + 1� 11���2 > 0, the
market power component is increasing and convex in !c; suggesting that it increases as a country
raises its patent rights protection level and the rate of increase is particularly pronounced at high
levels of protection. Similarly, we can show that the variety component is decreasing and convex
in !c: Therefore, the variety "e¤ect" is increasing and concave in !c: As a country raises its
protection level, the variety e¤ect also increases, but the rate of increase is attenuated at high
levels of protection. In other words, both the market power e¤ect and the variety e¤ect increase as
the level of protection rises, but the market power e¤ect increases signi�cantly more than the variety
e¤ect at higher levels of protection. This is precisely why it is in the upper range of protection
levels where the market power e¤ect can topple the net variety e¤ect.
Intuitively, we can observe that raising the level of patent rights protection a¤ects the price of
the aggregate intermediate input by simply increasing the fraction of intermediate varieties that
are enforced; this fraction moves one-to-one with the level of protection. In contrast, the e¤ect of
higher patent rights protection on the number of intermediate varieties is subject to diminishing
marginal returns to labor in R&D. Increasing the level of protection has a smaller impact on the
creation of new varieties, the higher the initial level of protection. For this reason, the variety e¤ect
pales in comparison with the market power e¤ect at high levels of patent rights protection.
The fact that the model predicts the stark result that in equilibrium each �nal good z is
produced by only one country follows from the assumption that �nal goods are homogeneous, as in
Dornbusch, Fischer, and Samuelson (1977). One can extend the model by assuming that consumers
value di¤erent varieties of each �nal good z because they are imperfect substitutes and obtain the
14

less drastic result, shown in Romalis (2004), that all goods are produced by both countries, but the
country with a lower cost of producing good z captures a larger share of world trade in good z:
What is most important about my model is not the stark prediction about trade �ows but
rather how the di¤erence in the level of patent rights protection determines countries�comparative
advantage through the costs of intermediate goods. In particular, raising the level of protection
induces more innovation activity, resulting in greater varieties of intermediate goods and lower
costs of �nal goods. Meanwhile, a higher level of patent rights protection means that a greater
fraction of these varieties is protected and therefore sold at monopoly prices, thereby increasing the
costs of �nal goods. Under certain ranges of parameters, the model shows that the overall e¤ect of
increasing the level of patent rights protection on the costs of �nal goods is non-monotonic in such
a way that the net variety e¤ect dominates the market power e¤ect for low levels of protection,
while the market power e¤ect dominates the net variety e¤ect for high levels of protection. This is
the prediction that I test in the empirical section.
4 Empirics
In this section I use cross-country export data, country-level factor endowments, and sector-level
factor intensities to test whether the model�s implications on export patterns hold empirically. I
estimate the following equation
lnEXict = �i + �c + �t + �1Pct + �2Pctpi + �3Hct + �4Hcthi + �5Kct + �6Kctki + �ict; (4)
where EXict is the total value of exports in industry i by country c to the rest of the world in
year t; Hct and Kct are the human capital and physical capital endowments of country c in year t;
and hi and ki are the human capital and physical capital intensities of industry i: The terms �i;
�c; and �t are industry, country, and year �xed e¤ects, and �ict is the error term, assumed to be
independent and identically distributed with mean zero. Lastly, Pct is the quality of patent rights
protection in country c in year t and pi is the patent intensity of industry i; which represents the
degree of industry i�s reliance on innovation.
While the coe¢ cients �1; �3; and �5 capture the overall e¤ect of each factor of production on
exports, the coe¢ cients �2; �4; and �6 capture the extent to which the e¤ect of a given factor
15
of production varies from industry to industry according to the industry�s factor intensity. For
example, if the e¤ect of human capital endowment on exports is greater for industries that use
human capital extensively, we should expect a positive sign for �4:
The coe¢ cient of interest in this analysis is �2: I will �rst perform OLS regressions on the entire
sample of observations to see whether there is a general pattern of specialization with respect to
patent rights protection. A positive (negative) coe¢ cient estimate of �2 implies that the e¤ect
of patent rights protection on exports is greater (smaller) for more patent-intensive industries. I
will then divide the sample according to countries�levels of patent rights protection to determine
whether the pattern of specialization reverses among countries with high levels of protection. The
model suggests while �2 is positive in the subsample of low-protection countries, �2 may be negative
in the subsample of high-protection countries.
Rajan and Zingales (1998) uses a similar equation to test whether industries that are relatively
more dependent on external �nancing experience higher growth rates of value added. Romalis
(2004) and Levchenko (2007) use this functional form to estimate trade �ow patterns. Romalis
(2004) �nds that countries that are relatively abundant in human capital, physical capital, or raw
materials capture large shares of exports to the United States in industries that use those factors
of production intensively. He also shows that the quasi-Rybczynski prediction holds in the data,
i.e. countries that accumulate a factor more rapidly than the rest of the world tend to have their
export composition shift towards industries intensive in that factor. Levchenko (2007) focuses
on the role of institutions in explaining trade patterns. In particular, he tests whether countries
with superior institutions (comprising quality of contract enforcement, security of property rights,
and predictability of the judiciary) export more in industries with high product complexity, mea-
sured by the intensity of intermediate input use, because these are industries in which institutional
infrastructure is important.
This equation is also used by Nunn (2007) to analyze the e¤ect of contractual enforcement
on industries� exports. In his case, pi captures the degree to which an industry uses inputs of
production that rely on relationship-speci�c contracts, while Pct is the index of the quality of
contract enforcement in that country. Cunat and Melitz (2007) also uses this speci�cation to
�nd evidence that countries with more �exible labor markets export relatively more in sectors
with higher within-industry dispersions of shocks. More recently, Manova (2008) uses a similar
16
functional form to empirically show that the e¤ect of �nancial liberalization on export volumes
varies signi�cantly across industries according to the extent to which they depend on external
�nancing.
5 Data
Data on export values at the 4-digit SITC Rev.2 industry level are from Feenstra�s World Trade
Database and aggregated to the 3-digit ISIC level using Haveman�s concordance tables. Human and
physical capital endowments are from Caselli (2005). As in Barro and Lee (2001), human capital
endowments are proxied by human capital per worker, measured as a function of the average years
of schooling in the population over 25 years old. To construct physical capital endowments, capital
stock estimates are generated from the perpetual inventory equation and divided by the number of
workers to obtain capital stock per capita. In the full speci�cation of the estimating equation, two
additional interaction terms are included, one related to natural resources and the other to �nancial
markets. Data on natural resource endowments are from the World Bank (1997) and each country�s
endowment is the value of its minerals, fossil fuels, timber, non-timber forest bene�ts, cropland,
and pastureland, net of what is labeled as protected areas. Financial liberalization intensity data
are taken from Bekaert et al. (2005), which calculates the liberalization intensity measure as the
fraction of domestic equities available to foreign investors.
Measures of industry-level human capital, physical capital, natural resource, and external �-
nance intensities are from Braun (2003) and are computed using US data. Human capital intensity
is measured as the industry�s mean wage over that of the whole manufacturing sector. Physical
capital intensity corresponds to the industry�s ratio of gross �xed capital formation to value added.
Natural resource intensity is a dummy variable that takes a value of 1 for the following industries
(and 0 otherwise): wood products, except furniture; paper and products; petroleum re�neries;
miscellaneous petroleum and coal products; other nonmetallic mineral products; iron and steel;
and nonferrous metals. External �nance intensity is calculated as the ratio of capital expenditures
minus cash �ow from operations to capital expenditures of �rms in each industry.
Regarding patent intensity, an extensive dataset on patents from Hall, Ja¤e, and Trajtenberg
(2001) is used. This dataset includes information on every patent granted by the United States
17
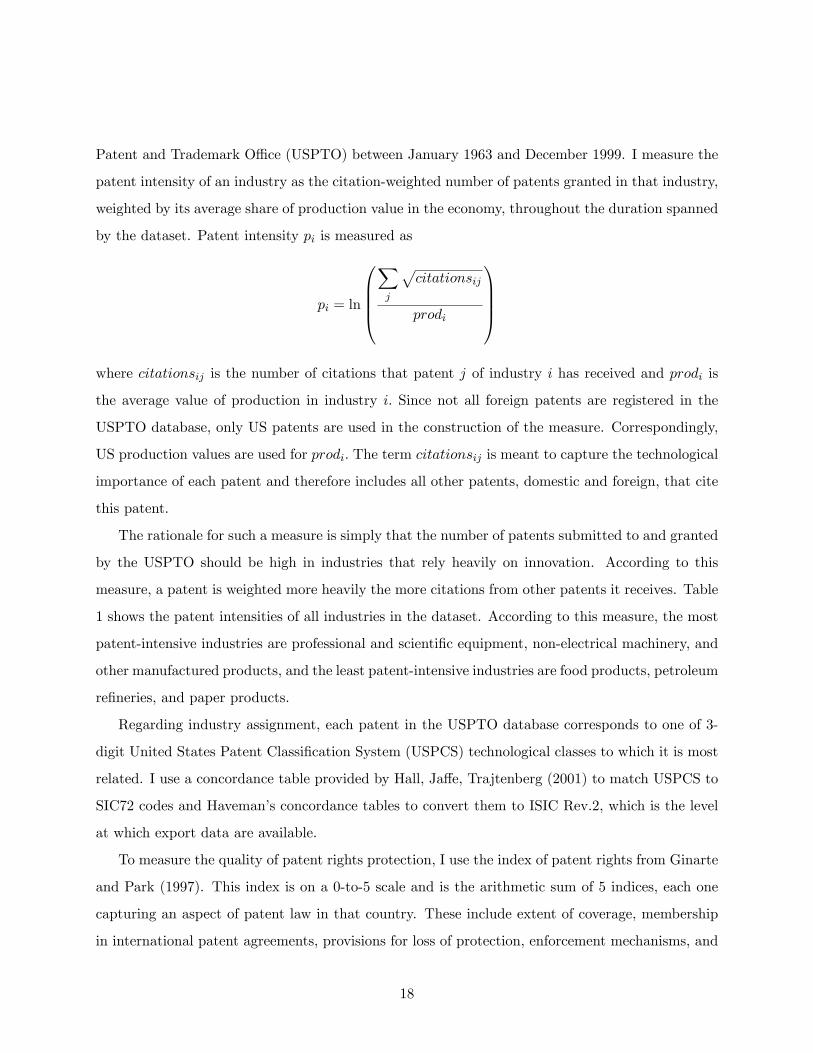
Patent and Trademark O¢ ce (USPTO) between January 1963 and December 1999. I measure the
patent intensity of an industry as the citation-weighted number of patents granted in that industry,
weighted by its average share of production value in the economy, throughout the duration spanned
by the dataset. Patent intensity pi is measured as
pi = ln
0BBB@Xj
pcitationsij
prodi
1CCCAwhere citationsij is the number of citations that patent j of industry i has received and prodi is
the average value of production in industry i: Since not all foreign patents are registered in the
USPTO database, only US patents are used in the construction of the measure. Correspondingly,
US production values are used for prodi: The term citationsij is meant to capture the technological
importance of each patent and therefore includes all other patents, domestic and foreign, that cite
this patent.
The rationale for such a measure is simply that the number of patents submitted to and granted
by the USPTO should be high in industries that rely heavily on innovation. According to this
measure, a patent is weighted more heavily the more citations from other patents it receives. Table
1 shows the patent intensities of all industries in the dataset. According to this measure, the most
patent-intensive industries are professional and scienti�c equipment, non-electrical machinery, and
other manufactured products, and the least patent-intensive industries are food products, petroleum
re�neries, and paper products.
Regarding industry assignment, each patent in the USPTO database corresponds to one of 3-
digit United States Patent Classi�cation System (USPCS) technological classes to which it is most
related. I use a concordance table provided by Hall, Ja¤e, Trajtenberg (2001) to match USPCS to
SIC72 codes and Haveman�s concordance tables to convert them to ISIC Rev.2, which is the level
at which export data are available.
To measure the quality of patent rights protection, I use the index of patent rights from Ginarte
and Park (1997). This index is on a 0-to-5 scale and is the arithmetic sum of 5 indices, each one
capturing an aspect of patent law in that country. These include extent of coverage, membership
in international patent agreements, provisions for loss of protection, enforcement mechanisms, and
18

duration of patents.
In particular, extent of coverage refers to the patentability of various kinds of inventions. De-
spite the fact that in general patents are granted for novel, industrially applicable, or non-obvious
inventions, for most countries there are certain inventions that are designated as unpatentable.
High scores in the category of extent of coverage are given to countries that have relatively few
unpatentable inventions. The measure of membership in international patent agreements is the
extent to which the country is willing to provide national, nondiscriminatory treatment to foreign-
ers regarding patent law. The three major agreements are the Paris Convention of 1883 (and its
subsequent revisions), the Patent Cooperation Treaty of 1970, and the International Convention for
the Protection of New Varieties of Plants of 1961. Countries with the highest score in this category
are those that have signed all three of the above agreements.
Loss of protection measures the country�s protection against losses arising from working require-
ments, compulsory licensing, and revocation of patents. Enforcement refers to the mechanisms of
enforcement when patent rights are violated. These mechanisms include preliminary injunctions,
contributory infringement pleadings, and burden-of-proof reversals. Lastly, duration of protection
refers to the length of the patent term; longer patent terms are more conducive to innovative
activity due to longer streams of �nancial returns. The standard term is 20 years of protection.
Tables 2 and 3 show average levels of patent rights protection for countries with the highest
and lowest protection levels over the 1980-1995 period. Countries with the highest levels are the
United States, the United Kingdom, the Netherlands, France, and Germany, and those with the
lowest levels are Jordan, Guatemala, Guyana, Nicaragua, and Peru.
In order to check for the robustness of results, I also use the Rapp-Rozek index of patent rights
protection, the discussion of which is provided in the robustness section.
6 Results
In this section, I �rst show regression results for the whole sample of observations to see the overall
e¤ect of patent rights protection on export volumes. If high levels of protection are associated
with high (low) export volumes in patent-intensive industries, we should expect the coe¢ cient
of the patent interaction Pctpi to be positive (negative). I then divide the dataset into smaller
19

samples based on countries�levels of protection and run similar regressions on these subsamples.
If the value of � is less than ����� ; then the model�s prediction is that the coe¢ cient of the
patent interaction variable is positive for samples comprising countries whose levels of patent rights
protection are lower than ������ and negative for samples comprising countries whose levels of patent
rights protection are higher than ������ .
The baseline regression results of equation (4) are presented in Table 4. I estimate the full panel
of log exports of 86 countries and 24 industries in the 1980-1995 period. Column (1) shows the
result of a regression of log exports on only the patent law and the patent interaction variables,
controlling for industry, country, and year �xed e¤ects. We can see that the coe¢ cient estimate is
positive and signi�cant, providing preliminary evidence that the e¤ect of patent rights protection
is biased positively towards patent-intensive industries.
However, the above regression is likely to su¤er from omitted variable bias, since there are
other variables that are correlated with the patent interaction variable but are not included in
the regression. One of these variables is country income, which is known to be highly correlated
with quality of patent law.6 Column (2) thus includes in the regression log real GDP as well
as the interaction between log real GDP and patent intensity. Even after controlling for these
two variables, the coe¢ cient estimate for the patent interaction variable still remains signi�cantly
positive.
The next two speci�cations, shown in Column (3) and (4), control for other factor interaction
terms that may be correlated with patent intensity. These include human capital, physical capital,
and natural resource endowments and their interactions with factor intensities. As recent papers
have suggested, external �nancial dependence plays a crucial role in determining trade patterns, so I
also include a �nancial liberalization measure and its interaction with external �nancial dependence.
The full speci�cation of the estimating equation takes the form
lnEXict = �i + �c + �t + �1Pct + �2Pctpi +
�3Hct + �4Hcthi + �5Kct + �6Kctki +
�7Nct + �8Nctni + �9Fct + �10Fctfi +
�11GDPct + �12GDPctpi + �ict;
6See Maskus (2000).
20

where Nct and ni denote, respectively, the natural resource endowment of country c in year t
and the natural resource intensity of industry i; and Fct and fi denote, respectively, the extent
of �nancial liberalization of country c in year t and the external �nancial dependence of industry
i: The coe¢ cient estimate for the patent interaction remains positive and signi�cant, suggesting
that, on average, countries with high levels of patent rights protection have relatively high export
volumes in patent-intensive sectors.
While we see that, on average across all countries in the sample, countries with strong patent
rights protection experience high export volumes in patent-intensive industries, Proposition 2 shows
that if the value of � is below ����� ; the export pattern can be reverse among countries with high
levels of patent rights protection. I therefore divide the sample into two samples, based on some
threshold level of patent rights protection. One sample consists of all observations for which the
country�s level of protection is above the threshold, and the other sample consists of all observations
for which the country�s level of protection is below the threshold. In the context of the model, the
former sample aims to capture the set of countries whose levels of protection are below ������ and
the latter sample the set of countries whose levels of protection are above ������ : This type of
sample splitting is common in the literature on the relationship between �nancial development
and economic growth, whereby the e¤ect of �nancial development on growth is often absent for
countries in which the level of �nancial development is beyond a certain threshold.7
In this analysis, I place threshold levels for the index of patent law at 0.25, 0.50, ... , 4.75
and run two regressions for each level of threshold. The levels for which there appears to be a
signi�cant reversal of trade patterns are those around the value of 3.75, and Chow tests con�rm
that the coe¢ cients of the two regressions are statistically di¤erent from each other to warrant
sample splitting. Table 5 presents the results of threshold regressions for values of 3.5, 3.75, and 4,
with Columns (1), (3), and (5) representing >3.5, >3.75, and >4 samples, and Columns (2), (4), and
(6) representing <3.5, <3.75, and <4 samples. I �nd that the coe¢ cient estimates for the patent
interaction term are signi�cantly positive for the low-protection groups and signi�cantly negative for
the high-protection groups, implying that the e¤ect of patent rights protection is biased positively
towards patent-intensive sectors among low-protection countries and biased negatively towards
patent-intensive sectors in the high-protection countries. The same procedure is also performed on
7For example, see Rioja and Valev (2004).
21

a 15-year average sample and the results, shown in Table 6, display similar patterns.8
An alternative approach to determining the threshold is to place threshold levels at the 5th,
10th, ... , 90th, 95th percentiles of the distribution of the patent rights protection index in a given
year. An observation of country c in year t is then put in the >nth group if country c�s protection
index is above the nth percentile of the distribution in year t or put in the <nth group if it is below.
The levels at which a signi�cant sign reversal takes place are those around the 90th percentile9,
and Table 7 shows the results of threshold regressions for the 85th, 90th, and 95th percentiles. The
coe¢ cient estimates imply that the e¤ect of patent rights protection is biased positively towards
patent-intensive sectors in the low-protection groups and biased negatively towards patent-intensive
sectors in the high-protection groups.
7 Endogeneity
There may be problems, however, regarding the endogeneity of the estimation of equation (4).
First, it is plausible that the causation runs in the opposite direction, from high export volumes to
the development of patent rights protection. In such scenario, a prosperous exporting sector that
is intensive in research and innovation prompts the government to enforce patent rights protection
in order to sustain the growth of the sector and not lose the competitive edge to other countries.
Another complication that may arise is that the development of patent rights protection may occur
simply because the government anticipates a growth potential in certain exporting sectors, so that
patent rights protection would only be an indicator rather than a cause of export volumes.
To account for this possibility, I adopt the instrumental variable approach and use a set of
legal origin variables to proxy for Pct and Pctpi:10 This set of instrumental variables consists of
Bc; Fc; Gc; Bcpi; Fcpi; and Gcpi; where Bc; Fc; and Gc denote British, French, and German legal
origins, respectively. The motivation is that colonizing countries often imposed their own legal
infrastructure on the colonized countries (e.g. common law for British colonies, civil law for French
colonies) and that di¤erent legal systems are likely to have di¤erent approaches in addressing issues
8Average patent rights protection and factor endowments are dropped from the regressions because they areabsorbed by country �xed e¤ects. The same holds for all other regressions using averaged data.
9Countries above the 90th percentile constitute more than 40% of world trade in 1995.10Nunn (2007) also uses legal origin interactions to isolate the causal impact of contract enforcement on comparative
advantage.
22

related to patent rights protection. According to Djankov et al. (2003), any legal system can be
thought of as a way to achieve a balance between disorder and dictatorship. French civil law is
particularly concerned with disorder and market failures and therefore exhibits a preponderance
for state-issued solutions when addressing social and economic problems. In contrast, British
common law displays a strong aversion of state encroachment, thus allowing for a greater scope of
market-based solutions and private contracting. As Damaska (1986) remarks, civil law is "policy-
implementing," while common law is "dispute resolution." In relation to issues of property rights,
La Porta et al. (2008) claims that the main channels through which the legal system a¤ects
property rights protection are judicial tenure and constitutional acceptance of case law. They �nd
that common law countries generally have higher judicial tenure and sharply higher constitutional
acceptance of case law than civil law counterparts. In turn, both high judicial tenure and high
constitutional acceptance of case law are associated with better protection of property rights.
However, one should keep in mind that there can be other ways in which the legal system in�uences
property rights protection. The reason is that "legal origins shape fundamental approaches to social
control of business. [L]egislation in common law countries expresses the common law way of doing
things."11
While a country�s legal origin is correlated with the status of the country�s current patent law,
it is not a¤ected by export volumes simply because the legal origin is predetermined as of the years
covered by the dataset. Hence, the set of legal origin variables satis�es the instrumental variable
requirement that the instruments are correlated with the potentially endogenous variable but not
with the error term, and allows us to examine how exogenous changes in patent rights protection
in�uence trade volumes.
One potential concern in this IV estimation is that the legal origin variables do not vary over
time, while the patent law variables Pct and Pctpi do. I address this issue by averaging all variables
over the time period and performing the IV procedure on this averaged sample.
To show that the instruments have explanatory power for patent rights protection, I regress Pc
on Bc; Fc; and Gc. Presented in Table 8, the regression result shows that two of three coe¢ cient
estimates are statistically signi�cant, with countries with French legal origin, on average, faring
worst in terms of average levels of patent rights protection, followed by those with British and
11La Porta et al. (2008)
23

German legal origins.
Table 9 shows the results of IV estimation. We can see that the signs of the IV estimates are
similar to those of the OLS estimates. In the high-protection groups (>3.5, >3.75, and >4 groups),
the coe¢ cient on the patent interaction is negative and signi�cant, as shown in Columns (1), (3),
and (5), while in the low-protection groups (<3.5, <3.75, and <4 groups), the coe¢ cient is positive
and signi�cant, as shown in Columns (2), (4), and (6). Again, the results suggest that the e¤ect of
patent rights protection is biased positively towards patent-intensive sectors in the low-protection
groups and biased negatively towards patent-intensive sectors in the high-protection groups.
Note that the magnitude of the IV estimates are comparable to that of the OLS estimates for the
>3.5, >3.75, and >4 groups (see Table 6). Meanwhile, the IV estimates are at least twice the size
of the OLS estimates for the <3.5, <3.75, and <4 groups. There are several reasons for this �nding.
First, if there is measurement error in the patent rights protection variable pi; OLS regressions will
su¤er from attenuation bias, in the sense that OLS estimates are underestimated. Second, there
is evidence that local business interests in developing economies campaigned for stronger patent
rights protection in patent-intensive industries, which were small but had high growth potential.12
This is an instance of reverse causation, albeit not one in which two factors reinforce each other, as
we often observe in the literature.13 In our case, it is as if low exports in patent-intensive sectors
"led to" (via campaigns by business interests) higher levels of patent rights protection. As a result,
the coe¢ cient estimate is underestimated in OLS regressions on low-protection countries. Lastly,
according to Maskus (2000), "[p]ressure from the United States and the European Union certainly
played a critical role in pushing forward a global reform agenda. Widely publicized American
negotiations and threats in the 1980s and 1990s helped usher in stronger intellectual property
rights legislation." The way this mechanism works is similar to the business interest mechanism,
whereby developing countries, which generally had relatively low exports of patent-intensive goods,
were forced to adopt higher intellectual property rights standards by developed countries.
12See Sherwood (1997).13Examples include studies of the e¤ect of �nancial development on economic growth, which have to take into
account the positive e¤ect of economic growth on �nancial development.
24
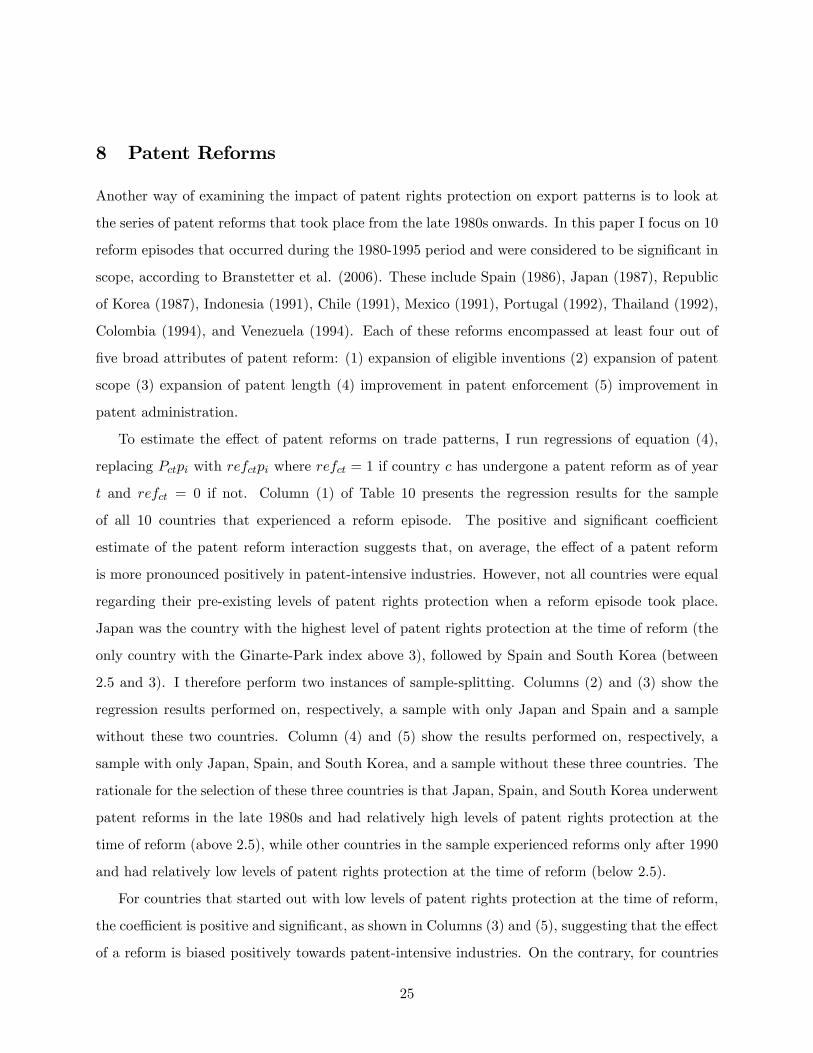
8 Patent Reforms
Another way of examining the impact of patent rights protection on export patterns is to look at
the series of patent reforms that took place from the late 1980s onwards. In this paper I focus on 10
reform episodes that occurred during the 1980-1995 period and were considered to be signi�cant in
scope, according to Branstetter et al. (2006). These include Spain (1986), Japan (1987), Republic
of Korea (1987), Indonesia (1991), Chile (1991), Mexico (1991), Portugal (1992), Thailand (1992),
Colombia (1994), and Venezuela (1994). Each of these reforms encompassed at least four out of
�ve broad attributes of patent reform: (1) expansion of eligible inventions (2) expansion of patent
scope (3) expansion of patent length (4) improvement in patent enforcement (5) improvement in
patent administration.
To estimate the e¤ect of patent reforms on trade patterns, I run regressions of equation (4),
replacing Pctpi with refctpi where refct = 1 if country c has undergone a patent reform as of year
t and refct = 0 if not. Column (1) of Table 10 presents the regression results for the sample
of all 10 countries that experienced a reform episode. The positive and signi�cant coe¢ cient
estimate of the patent reform interaction suggests that, on average, the e¤ect of a patent reform
is more pronounced positively in patent-intensive industries. However, not all countries were equal
regarding their pre-existing levels of patent rights protection when a reform episode took place.
Japan was the country with the highest level of patent rights protection at the time of reform (the
only country with the Ginarte-Park index above 3), followed by Spain and South Korea (between
2.5 and 3). I therefore perform two instances of sample-splitting. Columns (2) and (3) show the
regression results performed on, respectively, a sample with only Japan and Spain and a sample
without these two countries. Column (4) and (5) show the results performed on, respectively, a
sample with only Japan, Spain, and South Korea, and a sample without these three countries. The
rationale for the selection of these three countries is that Japan, Spain, and South Korea underwent
patent reforms in the late 1980s and had relatively high levels of patent rights protection at the
time of reform (above 2.5), while other countries in the sample experienced reforms only after 1990
and had relatively low levels of patent rights protection at the time of reform (below 2.5).
For countries that started out with low levels of patent rights protection at the time of reform,
the coe¢ cient is positive and signi�cant, as shown in Columns (3) and (5), suggesting that the e¤ect
of a reform is biased positively towards patent-intensive industries. On the contrary, for countries
25

with high levels of patent rights protection at the time of reform, the coe¢ cient is insigni�cantly
negative for the sample with Japan, Spain, and Korea and signi�cantly negative for the sample
with only Japan and Spain, implying that the bias is negative towards patent-intensive industries.
This �nding is again consistent with other results.
9 Robustness
The �rst robustness check I perform is to use a di¤erent measure of patent rights protection, one
developed by Rapp and Rozek (1990). This index is based on a 1984 evaluation of conformity
with the U.S. Chamber of Commerce guidelines on patent rights. Often used in studies before the
development of the Ginarte-Park index, the Rapp-Rozek index is cruder, taking a value of either
1, 2, 3, 4, or 5, with 1 corresponding to countries with inadequate protection laws and no law
prohibiting piracy and 5 to countries with protection and enforcement laws fully consistent with
minimum standards proposed by the U.S. Chamber of Commerce.
Table 11 shows the results of threshold regressions using the Rapp-Rozek index, with the thresh-
old value of 4. Since the index is based on a cross-country evaluation in 1984, I use data averaged
over the 1985-1995 period. Columns (1) and (2) correspond to high-protection and low-protection
groups, respectively. Unsurprisingly, the coe¢ cients on the patent interaction are negative and
signi�cant for the high-protection group, and positive and signi�cant for the low-protection group,
mirroring the results obtained when the Ginarte-Park index is used.
In the second robustness check, I use a di¤erent variable to instrument for the patent interaction
term. Because the Ginarte-Park index is available from 1960 onwards, I use the interaction between
the 1960 protection level and patent intensity, Pc;1960pi; as a proxy for Pctpi; under the assumption
that the only way in which the 1960 level of patent rights protection a¤ects export patterns in the
1980-1995 period is through the 1980-1995 level of protection. The results of IV estimation using the
1960 level of protection as the instrument are displayed in Table 12, with Columns (1), (3), and (5)
representing >3.5, >3.75, and >4 samples, and Columns (2), (4), and (6) representing <3.5, <3.75,
and <4 samples. In the high-protection groups, the estimates for the patent interaction coe¢ cient
are negative, statistically signi�cant, and similar in magnitude to those of the IV estimation using
legal origin interactions as instruments. On the other hand, the estimates for the low-protection
26
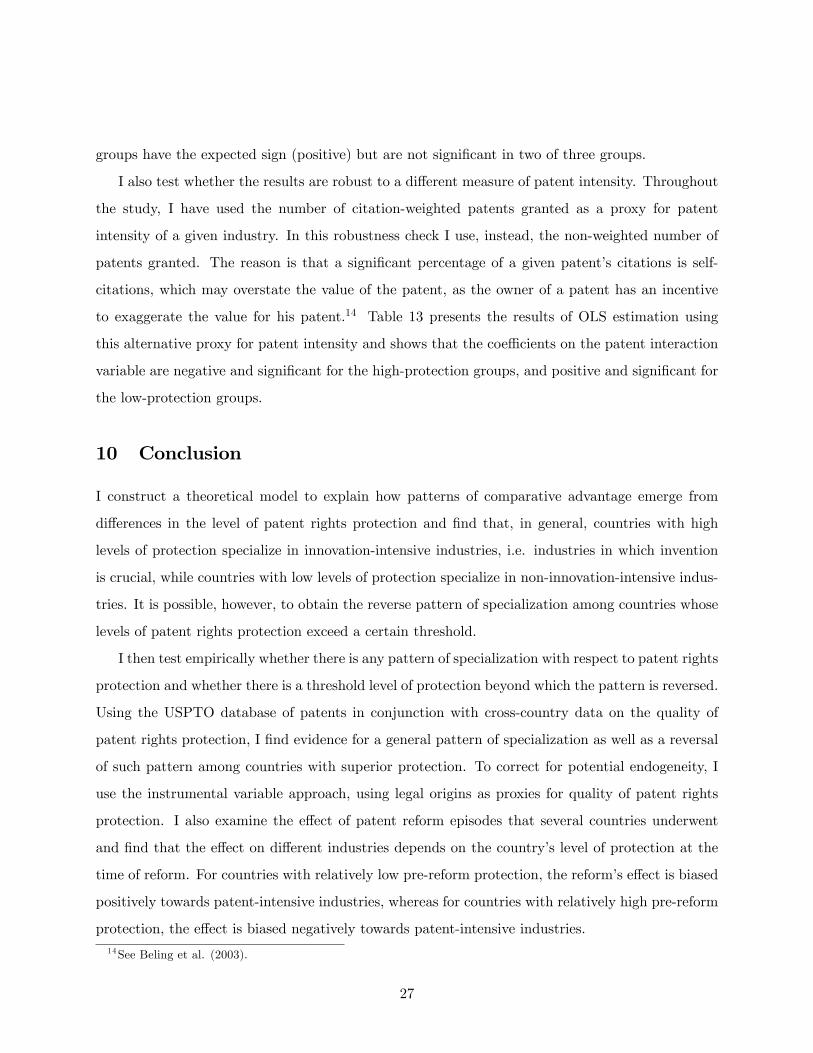
groups have the expected sign (positive) but are not signi�cant in two of three groups.
I also test whether the results are robust to a di¤erent measure of patent intensity. Throughout
the study, I have used the number of citation-weighted patents granted as a proxy for patent
intensity of a given industry. In this robustness check I use, instead, the non-weighted number of
patents granted. The reason is that a signi�cant percentage of a given patent�s citations is self-
citations, which may overstate the value of the patent, as the owner of a patent has an incentive
to exaggerate the value for his patent.14 Table 13 presents the results of OLS estimation using
this alternative proxy for patent intensity and shows that the coe¢ cients on the patent interaction
variable are negative and signi�cant for the high-protection groups, and positive and signi�cant for
the low-protection groups.
10 Conclusion
I construct a theoretical model to explain how patterns of comparative advantage emerge from
di¤erences in the level of patent rights protection and �nd that, in general, countries with high
levels of protection specialize in innovation-intensive industries, i.e. industries in which invention
is crucial, while countries with low levels of protection specialize in non-innovation-intensive indus-
tries. It is possible, however, to obtain the reverse pattern of specialization among countries whose
levels of patent rights protection exceed a certain threshold.
I then test empirically whether there is any pattern of specialization with respect to patent rights
protection and whether there is a threshold level of protection beyond which the pattern is reversed.
Using the USPTO database of patents in conjunction with cross-country data on the quality of
patent rights protection, I �nd evidence for a general pattern of specialization as well as a reversal
of such pattern among countries with superior protection. To correct for potential endogeneity, I
use the instrumental variable approach, using legal origins as proxies for quality of patent rights
protection. I also examine the e¤ect of patent reform episodes that several countries underwent
and �nd that the e¤ect on di¤erent industries depends on the country�s level of protection at the
time of reform. For countries with relatively low pre-reform protection, the reform�s e¤ect is biased
positively towards patent-intensive industries, whereas for countries with relatively high pre-reform
protection, the e¤ect is biased negatively towards patent-intensive industries.14See Beling et al. (2003).
27
I �nd the results to be robust to di¤erent measures of patent intensity and countries�levels of
patent rights protection, as well as an alternative instrumental variable. By and large, the empirical
�nding points to the non-monotonicity of the e¤ect of patent rights protection on trade patterns.
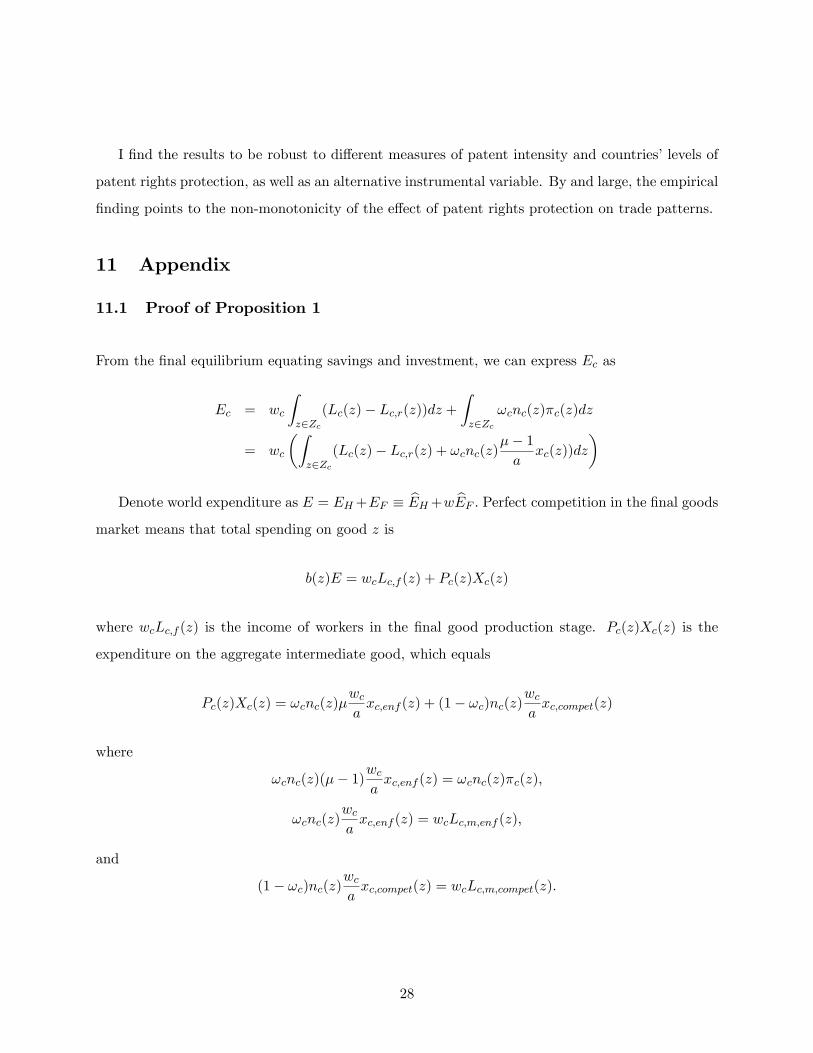
11 Appendix
11.1 Proof of Proposition 1
From the �nal equilibrium equating savings and investment, we can express Ec as
Ec = wc
Zz2Zc
(Lc(z)� Lc;r(z))dz +Zz2Zc
!cnc(z)�c(z)dz
= wc
�Zz2Zc
(Lc(z)� Lc;r(z) + !cnc(z)�� 1a
xc(z))dz
�
Denote world expenditure as E = EH+EF � bEH+w bEF : Perfect competition in the �nal goodsmarket means that total spending on good z is
b(z)E = wcLc;f (z) + Pc(z)Xc(z)
where wcLc;f (z) is the income of workers in the �nal good production stage. Pc(z)Xc(z) is the
expenditure on the aggregate intermediate good, which equals
Pc(z)Xc(z) = !cnc(z)�wcaxc;enf (z) + (1� !c)nc(z)
wcaxc;compet(z)
where
!cnc(z)(�� 1)wcaxc;enf (z) = !cnc(z)�c(z);
!cnc(z)wcaxc;enf (z) = wcLc;m;enf (z);
and
(1� !c)nc(z)wcaxc;compet(z) = wcLc;m;compet(z):
28
We can then express total spending on good z as
b(z)E = wc (Lc;f (z) + Lc;m;enf (z) + Lc;m;compet(z)) + !cnc(z)�c(z):
Without loss of generality, consider the case where H specializes in low-z goods. Denote �(z�) =R z�0 b(z)dz: Balanced budget meansH�s income (from goods production, which excludes investment)
is equal to world expenditure on H�s produced goods:
Z z�
0(LH;f (z) + LH;m;enf (z) + LH;m;compet(z) + !HnH(z)�H(z)) dz = �(z�)( bEH(z�) + w bEF (z�))Z z�
0(LH(z)� LH;r(z) + !HnH(z)�H(z)) dz = �(z�)( bEH(z�) + w bEF (z�))bEH(z�) = �(z�)( bEH(z�) + w bEF (z�))
or
w =
bEH(z�)�(z�)
� bEH(z�)! 1bEF (z�) = 1� �(z�)�(z�)
bEH(z�)bEF (z�) :Note that
bEH(z�) =
Z z�
0(LH(z)� LH;r(z) + !HnH(z)
�� 1a
xH(z))dz
= LH +
Z z�
0(�LH;r(z) + !HnH(z)
�� 1a
xH(z))dz
= LH+
Z z�
0
"��!H
1� e�r�r
�� 1a
xH(z)�K(z)1��� 1
1��+ !H�( (z)!cxc(z))
�1��
�� 1a
xH(z)
#dz
= LH +
Z z�
0
�(� (z)!HxH(z))
11�� + !H�( (z)!cxc(z))
�1��
�� 1a
xH(z)
�dz
= LH +
Z z�
0( (z)!HxH(z))
11��
��1 + �
(z)
�� 1a
�dz
and, similarly,
bEF (z�) = LF +
Z 1
z�( (z)!FxF (z))
11��
��1 + �
(z)
�� 1a
�dz:
As long as � (z)
��1a = � r
1�e�r�1
�K(z)1��< 1; we have that bEH(z�) is decreasing in z�and bEF (z�) is
increasing in z�; implying thatbEH(z�)bEF (z�) is decreasing in z�: Since 1��(z�)
�(z�) is also decreasing in z�; it
29
follows that B(z�) = 1��(z�)�(z�)
bEH(z�)bEF (z�) is decreasing in z�; and is equal to 1 when z� = 0 and is equal
to 0 when z� = 1:
We now need to show that the A curve crosses the B curve only once. To see that the A curve
is monotonic, positive, and �nite-valued for all z� 2 [0; 1], note that
�m(!H)
m(!F )w
�1��
�1��(z�)1
w= 1�
m(!H)
m(!F )
�1��(z�)w
�1�� (1��(z
�))�1 = 1
w =
�m(!H)
m(!F )
��(1��(z�)) 1�
1�� (1��(z�))�1
:
Let f(z�) � �(1��(z�)) 1�
1�� (1��(z�))�1< 0: Note that f(z�) is well-de�ned and it is straightforward
to show that f 0(z�) = � (�1+�)2�0(z�)(�1+�+����(z�))2 < 0; so the A curve is monotonic.
11.2 Proof of Proposition 2
First, note that if m(!H)m(!F )
w�
1�� < 1; thenhm(!H)m(!F )
w�
1��i1��(z)
is increasing in z and H specializes
in low-z goods. Similarly, if m(!H)m(!F )
w�
1�� > 1; thenhm(!H)m(!F )
w�
1��i1��(z)
is decreasing in z and H
specializes in high-z goods. Also, it is clear that if m(!H)m(!F )< 1, then m(!H)
m(!F )w
�1�� < 1, too. If not,
thenePH(z)ePF (z) =
hm(!H)m(!F )
w�
1��i1��(z)
1w > 1 for all z, which cannot be an equilibrium. Similarly, if if
m(!H)m(!F )
> 1, then m(!H)m(!F )
w�
1�� > 1, too.
Di¤erentiating m(!) with respect to ! yields
@m(!)
@!=
!��1+�+��1+�
�1 + (�1 + �1��)!
��1+��1+� [��� + (�� ��)!]
(�1 + �)[��(�1 + !)� �!]
= [(� � !)�� + !�]
(� � 1)[��(�1 + !)� �!] < 0
where = !��1+�+��1+�
�1 + (�1 + �1��)!
��1+��1+� > 0 and ��(�1+!)��! < 0:Hence,
(��1)[��(�1+!)��!] <
0:
For @m(!)@! to be negative for all !, we need (� � !)�� + !� to be positive for all !: Since
(� � !)�� + !� = ��� � !(�� � �); where �� � � > 1; the expression is smallest when ! = 1: In
30

that case,
��� � (�� � �) = 0
� =�� � ���
;
which means that � > ������ implies:
� @m(!)@! is negative for all !
� m(!H)m(!F )
< 1
� m(!H)m(!F )
w�
1�� < 1
�hm(!H)m(!F )
w�
1��i1��(z)
is increasing in z
� H specializes in low-z goods
If � < ������ ; then @m(!)
@! is not negative for all !; for high values of !; @m(!)@! is not negative for
all !: Denote !� the level of enforcement such that @m(!)@! = 0: It�s clear to show that !� = ��
���� :
If !H ; !F < !�; then m(!H)m(!F )
< 1 and H specializes in low-z goods. If !H ; !F > !�; then m(!H)m(!F )
> 1
and H specializes in high-z goods. Otherwise, we need to see whether m(!H)m(!F )< 1 or m(!H)m(!F )
> 1 and
draw conclusions accordingly.
31

References
[1] Barro, R. and J. Lee. 2001. International Data on Educational Attainment: Updates and Implications.
Oxford Economic Papers, 53 (3), 541-563 (July).
[2] Bekaert, G., C. Harvey, C. Lundblad. 2005. Does �nancial liberalization spur growth? Journal of
Financial Economics 77, 3-55.
[3] Beling, M., J. Fleming, F. Hannaka, C. Thomas, and P. Beling. 2003. Investigation of Forward Citation
Count as a Patent Analysis Method. Proceedings of the 2003 Systems and Information Engineering
Design Symposium. University of Virginia mimeo.
[4] Branstetter, L. G., R. Fisman, and C. F. Foley. 2006. Do Stronger Intellectual Property Rights Increase
International Technology Transfer? Empirical Evidence from U.S. Firm-level Panel Data. Quarterly
Journal of Economics, Vol. 121, No. 1, pp. 321-349.
[5] Braun, M. 2003. Financial Contractibility and Asset Hardness. University of California - Los Angeles
mimeo.
[6] Caselli, F. 2005. Accounting for cross-country income di¤erences. In: Aghion, P., S. Durlauf (Eds.),
Handbook of Economic Growth.
[7] Chor, D. 2009. Unpacking Sources of Comparative Advantage: A Quantitative Approach. Singapore
Management University mimeo.
[8] Costinot, A. 2009a. An Elementary Theory of Comparative Advantage. Econometrica, 2009, 77:4, pp.
1165-1192.
[9] Costinot, A. 2009b. On the origins of comparative advantage. Journal of International Economics 77:
255-264.
[10] Cunat, A. and M. Melitz. 2007. Volatility, Labor Market Flexibility, and the Pattern of Comparative
Advantage. Princeton University mimeo.
[11] Dama�ka, Mirjan R. 1986. The Faces of Justice and State Authority: A Comparative Approach to the
Legal Process. New Haven and London: Yale University Press.
32

[12] Djankov, S., E. Glaeser, R. La Porta, F. Lopez-de-Silanes, and A. Shleifer. 2003. �The New Comparative
Economics.�Journal of Comparative Economics, 31(4): 595-619.
[13] Dornbusch, R., S. Fischer, and P. Samuelson. 1977. Comparative Advantage, Trade, and Payments in
a Ricardian Model with a Continuum of Goods. American Economic Review, Vol. 67, No. 5, 823-839.
[14] Durlauf, S. and P. Johnson. 1995. Multiple Regimes and Cross-Country Growth Behaviour. Journal of
Applied Econometrics, 10:4, pp.365-84.
[15] Eaton, J. and S. Kortum. 2002. Technology, Geography, and Trade. Econometrica, 70:5, pp. 1741�79.
[16] Feenstra, R. 2000. World Trade Flows 1980-1997 CD-ROM.
[17] Fink, C. and C. Primo Braga. 1999. Intellectual Property Rights in a Gravity Model of International
Trade Flows. Policy research working paper, No. 2051. The World Bank.
[18] Gilbert, R. and C. Shapiro. 1990. The RAND Journal of Economics, Vol. 21, No. 1 (Spring, 1990), pp.
106-112.
[19] Ginarte, J. C. and W. Park. 1997. Determinants of patent rights: A cross-national study. Research
Policy 26 (October), 3:283-301.
[20] Grossman, G. and E. Lai. 2004. International Protection of Intellectual Property. American Economic
Review 94 (December), 5:1635-1653.
[21] Hall, B, A. Ja¤e, and M. Trajtenberg. 2001. The NBER patent citations data �le: lessons, insights,
and methodological tools. WP 8498 National Bureau of Economic Research
[22] Haveman, J. Industry Concordances. http://www.macalester.edu/research/economics/page/HAVEMAN/
[23] La Porta, R., F. Lopez-de-Silanes, A. Shleifer, and R. Vishny. 1997. Legal Determinants of External
Finance. Journal of Finance 52:1131-1150.
[24] La Porta, R., F. Lopez-de-Silanes, and A. Shleifer. 2007. Journal of Economic Literature, 46:2, 285�332.
[25] Levchenko, A. 2007. Institutional Quality and International Trade. Review of Economic Studies. 74:791-
819.
33

[26] Manova, K. 2008. Credit constraints, equity market liberalizations, and international trade. Journal of
International Economics 76:33-47.
[27] Maskus, K. and M. Penubarti. 1995. How trade-related are intellectual property rights? Journal of
International Economics 39:227-248.
[28] Maskus, K. 2000. Intellectual Property Rights in the Global Economy. Peterson Institute for Interna-
tional Economics.
[29] Nordhaus, W. 1969. Invention, growth and welfare: A theoretical treatment of technological change.
Cambridge, MA: MIT Press.
[30] Nunn, N. 2005. Relationship-Speci�city, Incomplete Contracts, and the Pattern of Trade. Mimeo.
[31] Nunn, N. 2007. Relationship-Speci�city, Incomplete Contracts, and the Pattern of Trade. Quarterly
Journal of Economics, Vol. 122, No. 2, 569-600.
[32] Rajan, R., L. Zingales. 1998. Financial Dependence and Growth. American Economic Review 88:559-
586.
[33] Rapp, R. and R. Rozek. 1990. Bene�ts and Costs of Intellectual Property Protection in Developing
Countries, Journal of World Trade 24, 75-102.
[34] Rioja, F. and N. Valev. 2004. Does one size �t all? A reexamination of the �nance and growth rela-
tionship. Journal of Development Economics 74:429-47.
[35] Romalis, J. 2004. Factor Proportions and the Structure of Commodity Trade. American Economic
Review 94:67-97.
[36] Sherwood, R. 1997. The TRIPS Agreement: Implications for Developing Countries. IDEA: The Journal
of Law and Technology 37:491-544.
[37] Smith, P. J 1999. Are weak patent rights a barrier to U.S. exports? Journal of International Economics
48:151-177.
[38] United States Patent and Trademark O¢ ce
[39] World Bank, 1997. Expanding the Measure of Wealth: Indicators of Environmentally Sustainable De-
velopment. World Bank, Washington, DC.
34

Figure 1: m(!) when � > �����
0 0.2 0.4 0.6 0.8 11
1.05
1.1
1.15
1.2
1.25
1.3
1.35
1.4
ω
m( ω
)
35

Figure 2: m(!) when � < �����
0 0.2 0.4 0.6 0.8 11.04
1.06
1.08
1.1
1.12
1.14
1.16
1.18
1.2
ω
m( ω
)
36
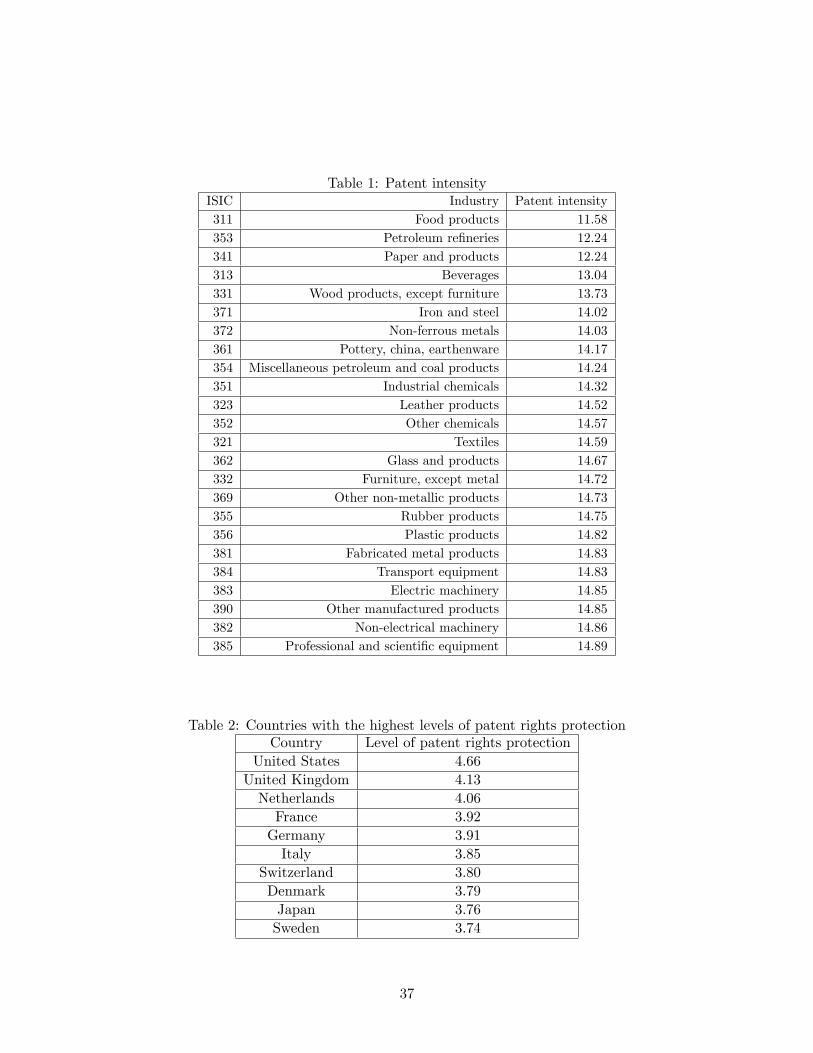
Table 1: Patent intensityISIC Industry Patent intensity311 Food products 11.58353 Petroleum re�neries 12.24341 Paper and products 12.24313 Beverages 13.04331 Wood products, except furniture 13.73371 Iron and steel 14.02372 Non-ferrous metals 14.03361 Pottery, china, earthenware 14.17354 Miscellaneous petroleum and coal products 14.24351 Industrial chemicals 14.32323 Leather products 14.52352 Other chemicals 14.57321 Textiles 14.59362 Glass and products 14.67332 Furniture, except metal 14.72369 Other non-metallic products 14.73355 Rubber products 14.75356 Plastic products 14.82381 Fabricated metal products 14.83384 Transport equipment 14.83383 Electric machinery 14.85390 Other manufactured products 14.85382 Non-electrical machinery 14.86385 Professional and scienti�c equipment 14.89
Table 2: Countries with the highest levels of patent rights protectionCountry Level of patent rights protection
United States 4.66United Kingdom 4.13Netherlands 4.06France 3.92Germany 3.91Italy 3.85
Switzerland 3.80Denmark 3.79Japan 3.76Sweden 3.74
37
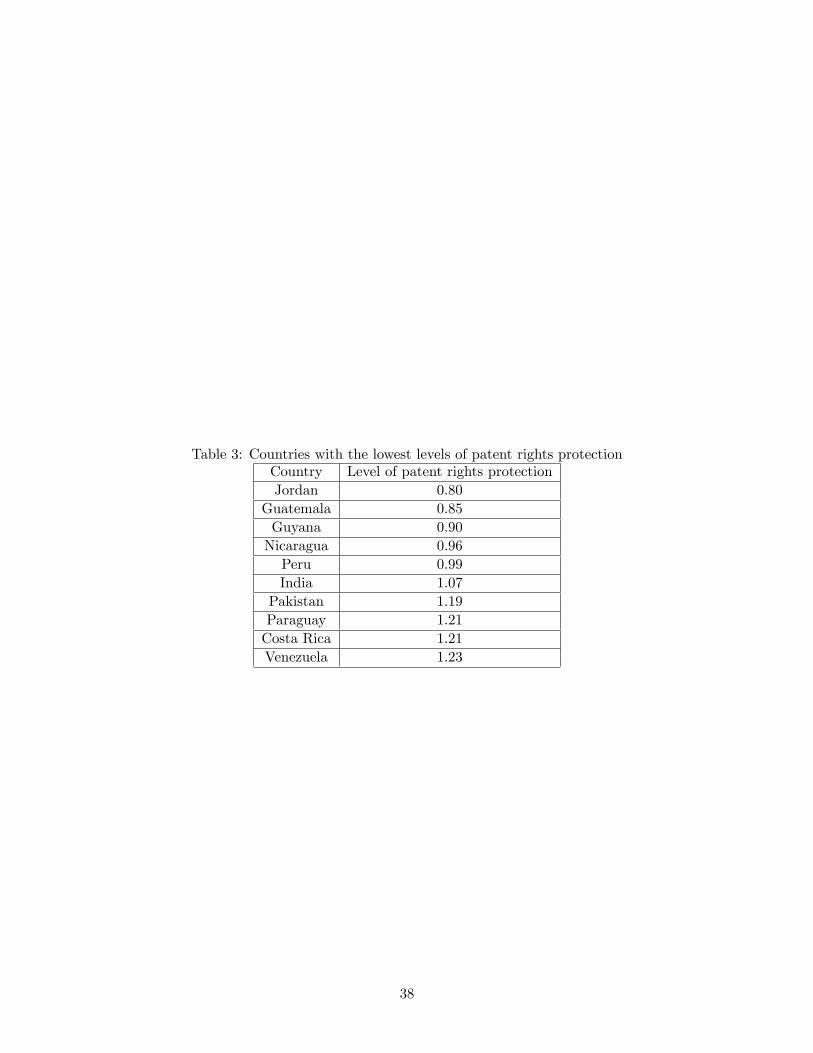
Table 3: Countries with the lowest levels of patent rights protectionCountry Level of patent rights protectionJordan 0.80
Guatemala 0.85Guyana 0.90Nicaragua 0.96Peru 0.99India 1.07
Pakistan 1.19Paraguay 1.21Costa Rica 1.21Venezuela 1.23
38
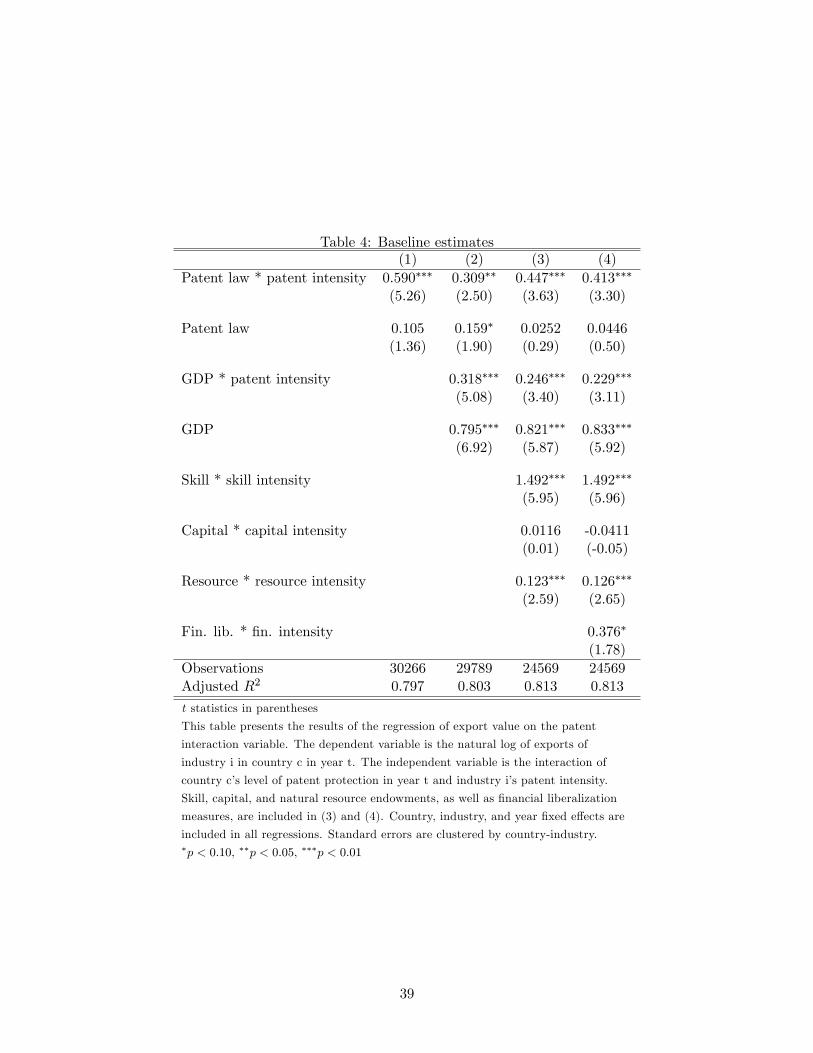
Table 4: Baseline estimates(1) (2) (3) (4)
Patent law * patent intensity 0.590��� 0.309�� 0.447��� 0.413���
(5.26) (2.50) (3.63) (3.30)
Patent law 0.105 0.159� 0.0252 0.0446(1.36) (1.90) (0.29) (0.50)
GDP * patent intensity 0.318��� 0.246��� 0.229���
(5.08) (3.40) (3.11)
GDP 0.795��� 0.821��� 0.833���
(6.92) (5.87) (5.92)
Skill * skill intensity 1.492��� 1.492���
(5.95) (5.96)
Capital * capital intensity 0.0116 -0.0411(0.01) (-0.05)
Resource * resource intensity 0.123��� 0.126���
(2.59) (2.65)
Fin. lib. * �n. intensity 0.376�
(1.78)Observations 30266 29789 24569 24569Adjusted R2 0.797 0.803 0.813 0.813
t statistics in parentheses
This table presents the results of the regression of export value on the patent
interaction variable. The dependent variable is the natural log of exports of
industry i in country c in year t. The independent variable is the interaction of
country c�s level of patent protection in year t and industry i�s patent intensity.
Skill, capital, and natural resource endowments, as well as �nancial liberalization
measures, are included in (3) and (4). Country, industry, and year �xed e¤ects are
included in all regressions. Standard errors are clustered by country-industry.�p < 0:10, ��p < 0:05, ���p < 0:01
39

Table 5: Threshold regression estimates>3.5 <3.5 >3.75 <3.75 >4 <4
Patent law * patent intens. -0.873��� 0.382�� -0.794�� 0.452��� -1.825��� 0.466���
(-3.11) (2.15) (-2.48) (2.80) (-3.57) (3.24)
Patent law 0.632��� 0.0529 0.617�� -0.0214 1.411��� -0.0521(2.76) (0.34) (2.43) (-0.15) (3.38) (-0.40)
GDP * patent intens. 0.286� 0.267��� 0.280� 0.269��� 0.326�� 0.265���
(1.93) (3.32) (1.95) (3.43) (2.30) (3.44)
GDP 0.434 0.635��� 0.386 0.687��� -0.124 0.714���
(1.21) (3.88) (1.32) (4.31) (-0.37) (4.59)
Skill * skill intensity 0.712� 1.006��� 0.793�� 1.102��� 0.834�� 1.300���
(1.89) (3.20) (2.24) (3.72) (2.27) (4.67)
Capital * capital intensity -8.313 1.342 -10.35� 0.998 -10.43� 0.580(-1.56) (1.39) (-1.86) (1.07) (-1.74) (0.64)
Resource * resource intensity 0.158��� 0.113�� 0.146�� 0.119�� 0.0962 0.123��
(2.86) (2.14) (2.57) (2.32) (1.58) (2.48)
Fin. lib. * �n. intensity 0.213 0.126 0.0798 0.208 1.902 0.258(0.36) (0.46) (0.14) (0.84) (1.40) (1.14)
Observations 4031 20538 3071 21498 1728 22841Adjusted R2 0.795 0.749 0.800 0.765 0.827 0.786
t statistics in parentheses
This table presents the results of the regression of export value on the patent interaction variable. The
dependent variable is the natural log of exports of industry i in country c in year t. The independent
variable is the interaction of country c�s level of patent protection in year t and industry i�s patent
intensity. Skill, capital, and natural resource endowments, �nancial liberalization measures, as well as
country, industry, and year �xed e¤ects are included in all regressions. Standard errors are clustered by
country-industry.�p < 0:10, ��p < 0:05, ���p < 0:01
40

Table 6: Threshold regression estimates - 15-year averages>3.5 <3.5 >3.75 <3.75 >4 <4
Patent law * patent intens. -2.760��� 0.253 -2.853��� 0.374�� -5.463�� 0.511���
(-3.69) (1.30) (-3.74) (2.09) (-2.60) (3.32)
GDP * patent intens. 0.604��� 0.213�� 0.727��� 0.207�� 1.393��� 0.228���
(3.61) (2.44) (4.35) (2.39) (3.16) (2.85)
GDP 0.390�� 0.882��� 0.300� 0.912��� 0.216 1.033���
(2.54) (7.84) (1.80) (8.23) (1.18) (10.41)
Skill * skill intensity 0.878 1.293��� 0.706 1.368��� -0.622 1.556���
(1.61) (3.70) (1.31) (4.12) (-1.11) (5.14)
Capital * capital intensity -24.14��� 0.933 -20.71��� 0.655 2.857 -0.00348(-3.47) (0.90) (-2.99) (0.66) (0.25) (-0.00)
Resource * resource intensity 0.112� 0.0992�� -0.0731 0.111�� 0.0868 0.112��
(1.72) (1.98) (-0.94) (2.24) (0.53) (2.47)
Fin. lib. * �n. intensity -3.185 -0.0103 -5.751 0.104 -1.030 0.229(-0.38) (-0.03) (-0.70) (0.30) (-0.12) (0.78)
Observations 240 1416 192 1464 72 1584Adjusted R2 0.811 0.833 0.826 0.840 0.924 0.860
t statistics in parentheses
This table presents the results of the regression of export value on the patent interaction variable. The
dependent variable is the natural log of exports of industry i in country c. The independent variable is
the interaction of country c�s level of patent protection and industry i�s patent intensity. Country and
industry �xed e¤ects are included in all regressions. Standard errors are clustered by country-industry.�p < 0:10, ��p < 0:05, ���p < 0:01
41

Table 7: Threshold regression estimates - percentile>95th <95th >90th <90th >85th <85th
Patent law * patent intens. -0.877��� 0.487��� -1.101��� 0.450��� -0.899��� 0.287�
(-3.13) (3.52) (-3.33) (2.92) (-3.02) (1.73)
Patent law 0.235 -0.0965 0.941�� -0.0640 0.701�� 0.0706(0.57) (-0.78) (2.59) (-0.47) (2.54) (0.49)
GDP * patent intens. 0.521��� 0.259��� 0.375�� 0.262��� 0.348�� 0.240���
(3.29) (3.34) (2.36) (3.28) (2.08) (2.90)
GDP -0.812 0.754��� 0.0468 0.710��� 0.0471 0.669���
(-1.60) (4.98) (0.10) (4.51) (0.13) (4.09)
Skill * skill intensity 0.649 1.296��� 0.806� 1.148��� 0.806� 0.988���
(1.45) (4.68) (1.85) (3.90) (1.86) (3.10)
Capital * capital intensity -3.979 0.330 -19.80�� 0.853 -13.39�� 1.263(-0.77) (0.36) (-2.53) (0.90) (-2.42) (1.28)
Resource * resource intensity 0.259� 0.125�� 0.0944 0.123�� 0.223��� 0.103�
(1.88) (2.56) (1.25) (2.41) (3.37) (1.90)
Fin. lib. * �n. intensity -6.535 0.332 -9.229 0.220 -0.119 0.0666(-1.57) (1.45) (-1.05) (0.87) (-0.16) (0.22)
Observations 1272 23297 2808 21761 4248 20321Adjusted R2 0.902 0.793 0.834 0.769 0.816 0.747
t statistics in parentheses
This table presents the results of the regression of export value on the patent interaction variable. The
dependent variable is the natural log of exports of industry i in country c in year t. The independent variable
is the interaction of country c�s level of patent protection in year t and industry i�s patent intensity. Skill,
capital, and natural resource endowments, �nancial liberalization measures, as well as country, industry, and
year �xed e¤ects are included in all regressions. Standard errors are clustered by country-industry.�p < 0:10, ��p < 0:05, ���p < 0:01
42
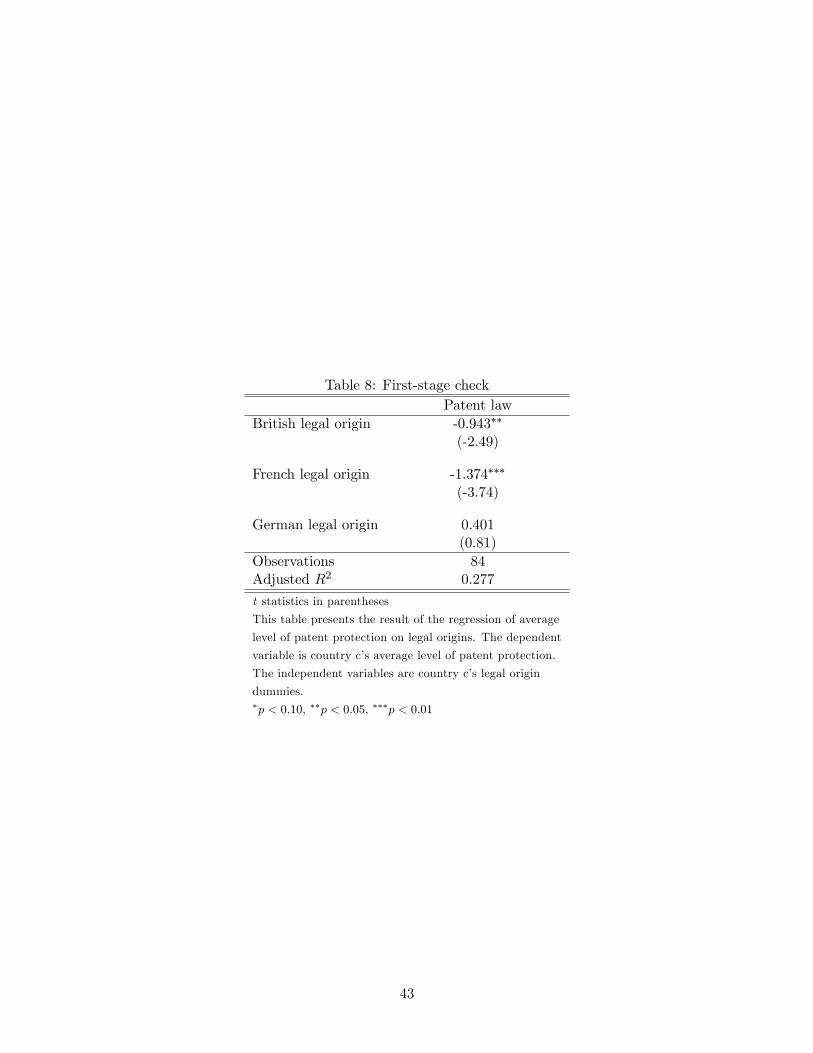
Table 8: First-stage checkPatent law
British legal origin -0.943��
(-2.49)
French legal origin -1.374���
(-3.74)
German legal origin 0.401(0.81)
Observations 84Adjusted R2 0.277
t statistics in parentheses
This table presents the result of the regression of average
level of patent protection on legal origins. The dependent
variable is country c�s average level of patent protection.
The independent variables are country c�s legal origin
dummies.�p < 0:10, ��p < 0:05, ���p < 0:01
43

Table 9: Instrumental variables>3.5 <3.5 >3.75 <3.75 >4 <4
Patent law * patent intens. -2.991��� 0.877�� -2.819��� 0.971��� -5.463��� 1.160���
(-3.40) (2.44) (-3.15) (3.41) (-3.45) (4.49)
GDP * patent intens. 0.639��� 0.187�� 0.722��� 0.171�� 1.393��� 0.137�
(3.66) (2.18) (4.30) (2.02) (4.18) (1.65)
GDP 0.406��� 1.018��� 0.297� 1.050��� 0.216 1.186���
(2.79) (8.04) (1.88) (8.86) (1.56) (11.01)
Skill * skill intensity 0.849� 1.305��� 0.711 1.369��� -0.622 1.534���
(1.69) (3.86) (1.45) (4.26) (-1.47) (5.23)
Capital * capital intensity -23.81��� 1.265 -20.78��� 1.052 2.857 0.553(-3.71) (1.24) (-3.29) (1.07) (0.33) (0.62)
Resource * resource intensity 0.111� 0.123�� -0.0726 0.136��� 0.0868 0.138���
(1.85) (2.51) (-1.03) (2.82) (0.70) (3.10)
Fin. lib. * �n. intensity -2.602 -0.221 -5.833 -0.118 -1.030 -0.0267(-0.33) (-0.57) (-0.78) (-0.33) (-0.15) (-0.09)
Observations 240 1392 192 1440 72 1560Adjusted R2 0.811 0.835 0.826 0.842 0.924 0.861
t statistics in parentheses
This table presents the results of the regression of export value on the patent interaction variable. The
dependent variable is the natural log of average exports of industry i in country c. The potentially endogenous
variable is the interaction of country c�s average level of patent protection and industry i�s patent intensity,
which is instrumented by interactions of legal origin dummies and patent intensity. Country and industry �xed
e¤ects are included in all regressions. Standard errors are clustered by country-industry.�p < 0:10, ��p < 0:05, ���p < 0:01
44

Table 10: Patent reforms(1) (2) (3) (4) (5)
Patent reform * patent intens. 1.085��� -0.446��� 1.469��� -0.296�� 1.024���
(6.48) (-3.41) (6.70) (-1.99) (3.69)
Patent reform -0.730��� 0.251 -0.980��� 0.172 -0.547��
(-4.73) (1.39) (-4.84) (0.82) (-2.17)
GDP * patent intens. 1.118��� 1.369��� 0.692��� 1.064��� 0.681���
(11.66) (13.70) (5.10) (10.48) (4.83)
GDP -0.350� -0.564 0.167 -1.496�� 0.398(-1.67) (-0.30) (0.62) (-2.31) (1.39)
Skill * skill intensity 0.440�� 2.640��� -0.351 0.311 0.204(2.21) (9.35) (-1.49) (1.26) (0.64)
Capital * capital intensity 1.872�� -9.580��� 5.018��� 5.657��� 6.035���
(1.99) (-4.23) (3.68) (4.28) (4.01)
Resource * resource intensity 0.292��� 0.0855� 0.352��� 0.315��� 0.302���
(8.61) (1.92) (8.49) (5.76) (6.81)
Fin. lib. * �n. intensity -0.283 4.751��� -1.646��� -0.962��� -0.429(-1.24) (8.27) (-4.37) (-5.41) (-0.93)
Observations 4389 766 3623 1143 3246Adjusted R2 0.740 0.888 0.674 0.810 0.639
t statistics in parentheses
This table presents the results of the regression of export value on the patent interaction variable.
The dependent variable is the natural log of exports of industry i in country c. The independent
variable is the interaction of country c�s reform dummy variable in year t and industry i�s patent
intensity. Skill, capital, and natural resource endowments, �nancial liberalization measures, as well as
country, industry, and year �xed e¤ects are included in all regressions. Standard errors are clustered
by country-industry.�p < 0:10, ��p < 0:05, ���p < 0:01
45

Table 11: Rapp-Rozek index(1) (2)
Patent law * patent intens. -4.649��� 0.984���
(-3.44) (4.63)
GDP * patent intens. 0.269�� 0.574���
(2.01) (4.63)
GDP 0.0476 1.162���
(0.28) (8.71)
Skill * skill intensity 1.353��� 1.176�
(2.70) (1.87)
Capital * capital intensity -48.78��� 3.089�
(-2.77) (1.81)
Resource * resource intensity 0.162�� 0.0943(2.02) (1.35)
Fin. lib. * �n. intensity 39.30��� -0.892(2.84) (-1.12)
Observations 144 792Adjusted R2 0.842 0.806
t statistics in parentheses
This table presents the results of the regression of average
export value on the patent interaction variable. The dependent
variable is the natural log of average exports of industry i
in country c. The independent variable is the interaction of
country c�s Rapp-Rozek index of patent protection and industry
i�s patent intensity. Country and industry �xed e¤ects are
included in both regressions. Standard errors are clustered by
country-industry.�p < 0:10, ��p < 0:05, ���p < 0:01
46

Table 12: Instrument: 1960 protection level>3.5 <3.5 >3.75 <3.75 >4 <4
Patent law * patent intens. -2.533�� 0.0830 -3.333��� 0.211 -5.463��� 0.332�
(-2.51) (0.37) (-4.37) (1.02) (-3.45) (1.84)
GDP * patent intens. 0.569��� 0.152 0.790��� 0.147 1.393��� 0.222��
(2.99) (1.38) (5.04) (1.35) (4.18) (2.23)
GDP 0.374�� 1.094��� 0.342�� 1.137��� 0.216 1.130���
(2.51) (7.64) (2.24) (8.10) (1.56) (8.68)
Skill * skill intensity 0.906� 1.494��� 0.640 1.566��� -0.622 1.743���
(1.79) (3.65) (1.31) (4.05) (-1.47) (4.99)
Capital * capital intensity -24.47��� 2.076� -19.79��� 1.625 2.857 0.693(-3.79) (1.65) (-3.16) (1.35) (0.33) (0.65)
Resource * resource intensity 0.114� 0.0692 -0.0797 0.0844 0.0868 0.0943�
(1.90) (1.18) (-1.13) (1.47) (0.70) (1.85)
Fin. lib. * �n. intensity -3.757 0.126 -4.585 0.242 -1.030 0.358(-0.48) (0.31) (-0.62) (0.65) (-0.15) (1.15)
Observations 240 1080 192 1128 72 1248Adjusted R2 0.811 0.782 0.825 0.793 0.924 0.825
t statistics in parentheses
This table presents the results of the regression of export value on the patent interaction variable. The
dependent variable is the natural log of average exports of industry i in country c. The potentially
endogenous variable is the interaction of country c�s average level of patent protection in year t and
industry i�s patent intensity, which is instrumented by the interaction of country c�s 1960 level of patent
protection and industry i�s patent intensity. Country and industry �xed e¤ects are included in all
regressions. Standard errors are clustered by country-industry.�p < 0:10, ��p < 0:05, ���p < 0:01
47
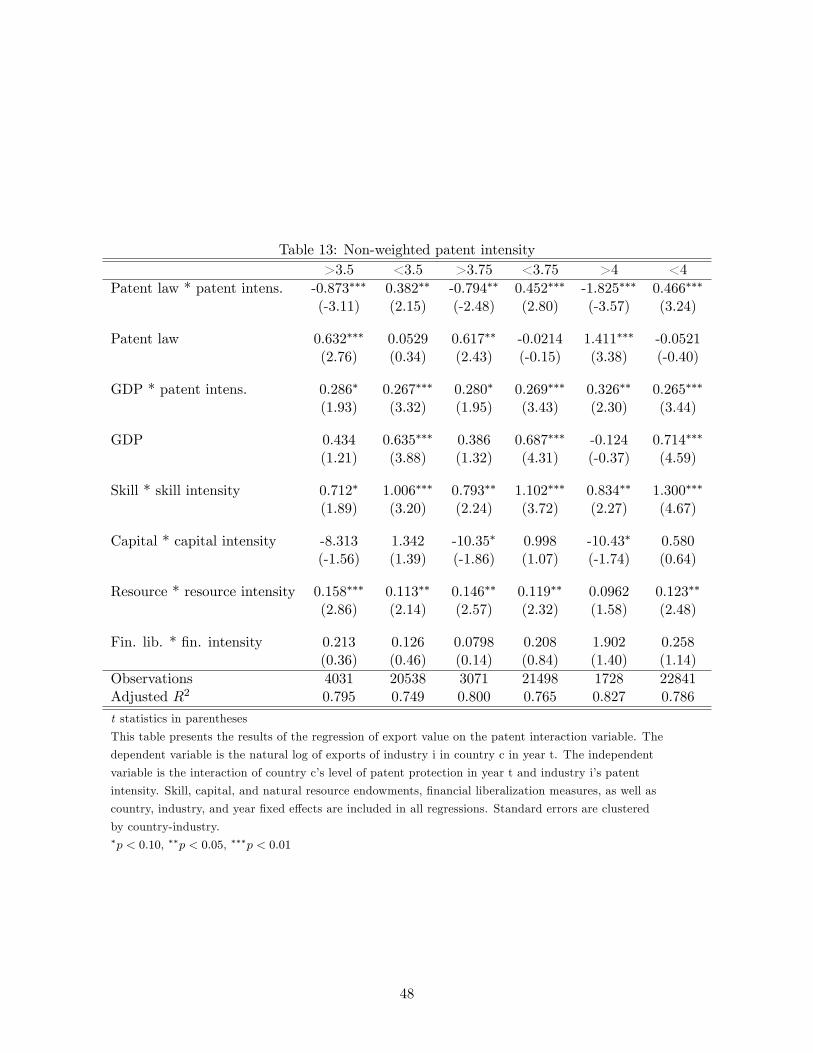
Table 13: Non-weighted patent intensity>3.5 <3.5 >3.75 <3.75 >4 <4
Patent law * patent intens. -0.873��� 0.382�� -0.794�� 0.452��� -1.825��� 0.466���
(-3.11) (2.15) (-2.48) (2.80) (-3.57) (3.24)
Patent law 0.632��� 0.0529 0.617�� -0.0214 1.411��� -0.0521(2.76) (0.34) (2.43) (-0.15) (3.38) (-0.40)
GDP * patent intens. 0.286� 0.267��� 0.280� 0.269��� 0.326�� 0.265���
(1.93) (3.32) (1.95) (3.43) (2.30) (3.44)
GDP 0.434 0.635��� 0.386 0.687��� -0.124 0.714���
(1.21) (3.88) (1.32) (4.31) (-0.37) (4.59)
Skill * skill intensity 0.712� 1.006��� 0.793�� 1.102��� 0.834�� 1.300���
(1.89) (3.20) (2.24) (3.72) (2.27) (4.67)
Capital * capital intensity -8.313 1.342 -10.35� 0.998 -10.43� 0.580(-1.56) (1.39) (-1.86) (1.07) (-1.74) (0.64)
Resource * resource intensity 0.158��� 0.113�� 0.146�� 0.119�� 0.0962 0.123��
(2.86) (2.14) (2.57) (2.32) (1.58) (2.48)
Fin. lib. * �n. intensity 0.213 0.126 0.0798 0.208 1.902 0.258(0.36) (0.46) (0.14) (0.84) (1.40) (1.14)
Observations 4031 20538 3071 21498 1728 22841Adjusted R2 0.795 0.749 0.800 0.765 0.827 0.786
t statistics in parentheses
This table presents the results of the regression of export value on the patent interaction variable. The
dependent variable is the natural log of exports of industry i in country c in year t. The independent
variable is the interaction of country c�s level of patent protection in year t and industry i�s patent
intensity. Skill, capital, and natural resource endowments, �nancial liberalization measures, as well as
country, industry, and year �xed e¤ects are included in all regressions. Standard errors are clustered
by country-industry.�p < 0:10, ��p < 0:05, ���p < 0:01
48