intellifoot - heim | skemman final thesis.pdf · divided into smaller packets to fit each ble_tx...
TRANSCRIPT

IntelliFoot
Gait Detection and Analysis on Carbon Fibre Prosthetic Foot Using Embedded Real-Time Bend Sensor Technology
Skarphéðinn Ölver Sigurðsson
Final thesis for B.Sc. degree
Keilir Institute of Technology
University of Iceland
School of Engineering and Natural Sciences


IntelliFoot
Skarphéðinn Ölver Sigurðsson
24 ECTS thesis submitted in partial fulfilment of a Baccalaureus Scientiarum degree in mechatronics engineering
Advisors Krista Hannesdóttir Atli Örn Sverrisson
Keilir Institute of Technology
University of Iceland
School of Engineering and Natural Sciences
Reykjanesbær, June 2014

IntelliFoot 24 ECTS thesis submitted in partial fulfilment of a Baccalaureus Scientiarum degree in mechatronics engineering Copyright © 2014 Skarphéðinn Ölver Sigurðsson All rights reserved Keilir Institute of Technology School of Engineering and Natural Sciences University of Iceland Grænásbraut 910 235 Reykjanesbær Phone: +354-578 4000 Bibliographic information: Skarphéðinn Ölver Sigurðsson, 2014, IntelliFoot, BSc thesis, Keilir Institute of Technology, University of Iceland, pp. 73. Printing: Pixel prentþjónusta ehf Reykjanesbær, June 2014

Abstract
Össur is one of the world leading manufacturer of prosthetic legs. A Certified Prosthetics
& Orthotics (CPO) has to do gait analysis on the amputee patient to adjust and find the
prosthesis that is suitable.
Few of the problems CPO's and amputees face are the following:
The time it takes to install a new prosthesis.
The patient has to go at the clinic where the necessary equipment is during gait
analysis.
Not enough data for reimbursement claim in the US.
The IntelliFoot prototype is a monitoring device, mounted inside the foot cover of a
prosthesis. The IntelliFoot will be used to do real-time gait detection and analysis on
carbon fibre prosthetic foot, using embedded real-time bend sensor technology. It will store
cumulative gait statistics in embedded memory and relay the data, either in real-time or on
demand, to the CPO wirelessly through a low powered Bluetooth connection.
The results are a working prototype of the IntelliFoot. It can successfully detect and save
necessary data and statistics for a comprehensive gait report.


Útdráttur
Össur er eitt af leiðandi stoðtækjafyrirtækjum í heiminum. Stoðtækjafræðingar þurfa að
gera göngugreiningu á sjúklingum, sem hafa misst útlim, til þess að stilla og finna fót sem
hefur rétta eiginleika.
Helstu vandamál sem stoðtækjafræðingar og stoðtækjanotendur þurfa að eiga við, eru
eftirfarandi:
Tíminn sem það tekur að setja nýjan gervifót á einstakling.
Sjúklingur þarf að mæta á tiltekinn stað þar sem búnaður til göngugreiningar er til
staðar.
Ekki eru alltaf næg gögn til staðar sem styðja göngugreiningu sjúklinga fyrir
endurgreiðslukerfið í Bandaríkjunum.
Frumgerðin af IntelliFoot er búnaður sem safnar gögnum. Búnaðurinn er staðsettur í
fótahlíf gervifótarins. IntelliFoot mun vera notað til göngugreiningar á koltrefjafæti með
notkun á innbyggðri rauntíma sveigjuskynjun á koltrefjunum. Búnaðurinn mun geta vistað
uppsöfnuð gögn í innbyggðu minni og sent gögnin, hvort heldur sem í rauntíma eða eftir
þörfum, til stoðtækjafræðings með þráðlausri Blátannar tengingu.
Niðurstaða verkefnisins er starfhæf frumgerð. Frumgerðin getur greint göngulag og vistað
tölfræðileg gögn í minni sem er svo hægt að nota við gerð göngugreiningarskýrslu.


vii
Table of Contents
List of figures ...................................................................................................................... ix
List of Tables ..................................................................................................................... xiii
Acknowledgements ............................................................................................................ xv
1 Introduction ..................................................................................................................... 1 1.1 The problem and solution ........................................................................................ 2 1.2 Thesis overview ....................................................................................................... 2
2 Background ..................................................................................................................... 3 2.1 Terminologies .......................................................................................................... 3 2.2 IntelliFoot definition................................................................................................ 4
3 Requirement analysis ..................................................................................................... 5 3.1 Linear Bend Sensor ................................................................................................. 6
3.1.1 Flexpoint bend sensor .................................................................................... 6
3.1.2 Hall effect sensor ........................................................................................... 7
3.2 System on a Chip (SoC) .......................................................................................... 9 3.2.1 Comparison of SoC's ..................................................................................... 9
3.3 External memory ................................................................................................... 11
3.4 Gyroscope and accelerometer ............................................................................... 12
4 IntelliFoot development ................................................................................................ 13 4.1 Prototype hardware setup ...................................................................................... 13
4.1.1 Vari-Flex Low Profile (LP) ......................................................................... 13 4.1.2 Hall effect sensors setup .............................................................................. 14 4.1.3 Wireless board ............................................................................................. 15
4.1.4 Amplifier circuit for the Hall effect sensors ................................................ 17
4.1.5 NRF51822 evaluation board ........................................................................ 22
4.1.6 UART communication ................................................................................. 22 4.2 Firmware ............................................................................................................... 23
4.2.1 Data processing ............................................................................................ 23 4.2.2 Data processing algorithms .......................................................................... 24 4.2.3 Wireless communication using Bluetooth ................................................... 29
5 Hardware analysis and prototype testing ................................................................... 31 5.1 Preliminary gait analysis ....................................................................................... 31 5.2 Hall effect sensor output voltage and force analysis - Experiment 1 .................... 32 5.3 First prototype testing ............................................................................................ 36
5.3.1 Results .......................................................................................................... 36 5.4 Hall effect sensor output data and force analysis - Experiment 2 ......................... 37 5.5 Second prototype testing ....................................................................................... 38
5.5.1 Results .......................................................................................................... 39

viii
6 Discussion ....................................................................................................................... 43 6.1 The IntelliFoot ........................................................................................................ 43
6.1.1 Sensors ......................................................................................................... 43 6.1.2 Sensor casing and prosthesis carbon fibre ................................................... 43
6.1.3 Electronics related to the sensors ................................................................. 43 6.1.4 Firmware ...................................................................................................... 44
6.2 Future work ............................................................................................................ 45
7 Conclusions .................................................................................................................... 47
8 Abbreviations ................................................................................................................. 49
9 Bibliography ................................................................................................................... 51
Appendix A - Data Alignment in Memory ....................................................................... 53
Appendix B - Preliminary Gait Analysis Results ............................................................ 55
Appendix C - FM25V10 F-RAM Specifications .............................................................. 62
Appendix D - LP Vari-Flex Specifications ....................................................................... 63
Appendix E - IntelliFoot Data from Test 1 ...................................................................... 64
Appendix F - Zebris Gait Report ...................................................................................... 66
Appendix G - IntelliFoot Data from Test 2 ...................................................................... 70

ix
List of figures
Figure 2-1: Human gait cycle explained. In this thesis, the classic gait terms are used
[4, p. 458]. ........................................................................................................... 3
Figure 2-2: A typical curve from a gait analysis equipment. This graph shows the
stance phase from 0% to 65% of the stride. Max force 1 is where
maximum heal-load is and max force 2 is where the maximum toe-load
is. Image is from a report in Appendix F. ........................................................... 4
Figure 3-1: Hysteresis on a Flexpoint bend-sensor [1]. ........................................................ 6
Figure 3-2: Drift in Flexpoint bend-sensor [1]. ..................................................................... 7
Figure 3-3: How magnetic field changes voltage between point 1 and 2 [6, p. 1]. ............... 7
Figure 3-4: F-RAM compared to regular flash, in context of write endurance [9, p.
1]. ...................................................................................................................... 11
Figure 4-1: Low Profile (LP) Vari-Flex (to the left) compared to normal Vari-Flex. ........ 13
Figure 4-2: A neodymium magnet is mounted in front of the sensor. When the plastic
case bends, the distance between the magnet and the sensor changes, thus
giving different readings. .................................................................................. 15
Figure 4-3: LP Vari-Flex carbon fibre prosthesis with the IntelliFoot sensors
attached. The Hall effect sensors are mounted in the flexible plastic case. ...... 15
Figure 4-4: LP Vari-Flex prosthesis with IntelliFoot prototype attached. The larger
PCB is the BWM-V01 circuit. .......................................................................... 16
Figure 4-5: Electronic scheme for the RKN67825SCH1.2 [14, p. 1] amplifier circuit....... 18
Figure 4-6: A voltage divider is used to get the right voltage on pin 1 on the op-amp
(-Input). ............................................................................................................. 20
Figure 4-7: NRF51822 Evaluation kit. ................................................................................ 22
Figure 4-8: UB232R UART to USB communication dongle.............................................. 23
Figure 4-9: Flow diagram showing basic flow of the data collecting and processing. ....... 24
Figure 4-10: Here are the four of the stages used to detect the stance: 1. heel-strike, 2.
maximum heel-load, 3. maximum toe-load and 4. toe-off. Image is from
preliminary research for the IntelliFoot. ........................................................... 25
Figure 4-11: A flow chart explaining how the algorithm for stance detection works. ........ 26

x
Figure 4-12: Test data that shows the difference of 160 data points (lower graph)
compared to graph that has been normalized (resampled) to 40 data
points (upper graph). ........................................................................................ 27
Figure 4-13: This array diagram shows how a part of original stance data is
converted to a normalized stance with fixed amount of data. The upper
number in the arrays represent the index number and the lower number
represent the data. The chop-array's data show the corresponding index
number in the normalized array. ....................................................................... 28
Figure 4-14: Simplified example of how data is stored in memory. The numbers with
the blue background represents the memory address, each 2 bytes. The
red numbers show how often it has been written to the specific memory
location, where the memory address represents the actual value of the
data. .................................................................................................................. 28
Figure 4-15: While collecting data in real time via Bluetooth, data packets must be
divided into smaller packets to fit each BLE_TX buffer. ................................ 30
Figure 5-1: LP Vari-Flex and different sizes of wedges. The wedges are used to
increase heel stiffness without changing the CAT. .......................................... 31
Figure 5-2: A test showing different wedge settings with the same CAT and size. ........... 32
Figure 5-3: Vari-flex LP prosthesis. Force (N) compared to voltage output of the Hall
effect sensor. Heel-test is under 15 degrees inclination. .................................. 33
Figure 5-4: Vari-flex LP prosthesis. Force (N) compared to voltage output of the Hall
effect sensor. Toe-test is under 20 degrees declination. ................................... 34
Figure 5-5: Maximum deflection (below) at 1,230 N toe-load and minimum
deflection (above) at 1,230 N heel-load. When no load is applied to the
prosthesis, the distance is 3.30 mm. ................................................................. 34
Figure 5-6: Linearity of voltage output from the Hall effect sensor versus applied
load in newtons. Data from Table 5-1. ............................................................. 35
Figure 5-7: Displacement of magnet from Hall effect sensor versus applied load in
newtons. Data from Table 5-1. ......................................................................... 35
Figure 5-8: Stance from first prototype testing. The graph shows how the data
saturates while in toe-load. The amputee weight is around 107 kg and the
prosthesis used was size 26, CAT 5 with no wedge. ........................................ 36
Figure 5-9: The linearity of the applied load to the prosthesis versus the digital
signal. The polynomial equations are generated by MS Excel. Also see
Table 5-2. .......................................................................................................... 38
Figure 5-10: Output in newtons compared to applied load. By using the polynomial
equations the output is linear, with the exception of sensor 2 being
saturated in 1,000 N. ......................................................................................... 38
xi
Figure 5-11: The average results from the IntelliFoot. The stance is 63% of the stride
length and the swing is 37% of the stride. ........................................................ 39
Figure 5-12: The average results from the 30 second gait analysis on the Zebris
treadmill. The stance is 64% of the stride and the swing is 36% of the
stride. Image is from Zebris gait analyser report (see Appendix E) ................. 40
Figure 5-13: Mean value of 107 steps with 95% C.I and max/min values.......................... 41
Figure 5-14: Mean data from both IntelliFoot sensors. This test was done on flat
surface with a total of 107 steps. ...................................................................... 41
Figure 9-1: 107 stance phases successfully recorded into memory. The two steps that
are clearly off the standard are when the amputee was turning around
while walking. Memory addresses 3, 5 and 6 hold data to calculate time,
as each datapoint represent 5 ms. Address 3 is for total points in stance,
address 5 is for total points in swing and address 6 is showing total
swings recorded. The memory mapping is out of sync to have the data
properly lined up. .............................................................................................. 53
Figure 9-2: Here the data can be seen as they should appear. ............................................. 54


xiii
List of Tables
Table 3-1: Perform characteristics and comparison of few Hall effect sensors. ................... 8
Table 3-2: Perform Characteristics and comparison of few SoC's. ..................................... 10
Table 3-3: Performance comparison of different types of memory in embedded
systems [9, p. 2], [8, p. 1] and [10, p. 56]. ........................................................ 12
Table 4-1: LP Vari-Flex technical specifications [11]. ....................................................... 14
Table 4-2: Maximum voltage applied to the GPIO of the NRF51822. ............................... 17
Table 4-3: Op-amp AD8226 Pin Function Descriptions. .................................................... 19
Table 4-4: Gains Achieved Using 1% Resistors [15, p. 9]. ................................................. 21
Table 5-1: Hall effect sensor output voltage compared to applied force on the
prosthetic foot. .................................................................................................. 33
Table 5-2: Digital values from both Hall effect sensors. The range spans from 1,230
N heel-load to 1,230 N toe-load, with the exception of sensor 2 saturates
in 1,000 N in heel-load. .................................................................................... 37
Table 5-3: Comparison of the Zebris gait analysis and IntelliFoot analysis. ...................... 40
Table 9-1: Data filename explanation ................................................................................. 55


xv
Acknowledgements
I would like to thank all of the staff members at Össur who have either participated in this
project or helped me in any way through it.
I would like to thank Gunnar Ó. L. Magnússon for helping me with the use of electrical
equipment and other electrical related aspects of the project.
Thanks to Grettir Yngvason who did all of the user testing of the IntelliFoot.
The CPO's, Guðfinna Halldórsdóttir and Guðrún María Ómarsdóttir, thank you.
Special thanks go to my advisor Atli Örn Sverrisson for always being there to help or give
me professional advice throughout the project. Atli, being a good embedded software
engineer that is very enthusiastic in his work, only inspired me on my path to becoming a
embedded software engineer.
Special thanks go to my advisor, Krista Hannesdóttir for providing me very professional
advice throughout the project. Krista truly helped me overcome many obstacles, such as
understanding fundamental aspects of the material I was working with. She has a very
good academic background in conjunction with abstract thinking. This combination in an
instructor is very helpful.
For being helpful in terms of technical advising and other general aspects of writing, my
classmate and friend Karl Ingi Eyjólfsson gets a big thank you.
Finally, and most importantly, I would like to thank my wife Líza Rose for not only
standing by my side through this project, but for being there during the past three years of
study.


1
1 Introduction
Losing a limb is one of the most catastrophic event that a person can experience in their
life. This does happen to people at any age and nationality. This can happen due to
accident, disease, war or people can even be born without a limb. There are nearly 2
million people with limb loss in the US alone and there are nearly 200 thousand
amputations every year in the US [1, p. 422].
The evolution of prosthesis has taking the advantage of the technology era by using
sensors, actuators and microcontrollers to control the prosthetic foot as the user walks. This
gives the user more comfort and natural walking, compared to older types of prosthesis.
While older static prosthesis are still widely used, they can never replace the comfort and
usability a dynamic prosthesis has.
Össur's products are mainly designed for amputees that have lost their leg below knee
(BK) or above knee (AK) with the main goal to give the patient's the ability to live their
life as normal as possible, or "without limitations" as Össur's slogan refers to. What makes
Össur stand out as a pioneer in prosthetic manufacturing, is the significant investment in
research and development. The products are always getting more technical and user
friendly, resulting in better experience for the customers [2].
Certified Prosthetics & Orthotics (CPO) is a personnel that attaches the prosthetic foot to a
amputees limb. The CPO’s job is to find the right type, size and stiffness of the prosthetic
foot and adjust it right. This procedure is time consuming since there are a lot of
configurations to make on the prosthetic foot, so the client can walk as natural as possible.
A slight misalignment or wrong type of prosthesis can lead to other type of symptoms such
as back pain, thus making it necessary to have the configuration of the prosthesis correct.
The CPO usually adjusts the prosthesis by eye and relies on the feedback from the user.
The user may not find anything particularly bad to the configuration the CPO has made,
but might experience e.g. back pain after walking for several days.
By using sensor technology to monitor how the prosthetic foot is behaving, while the user
walks, can give the user and the CPO opportunity to make appropriate adjustments in less
time. This can save time and money during installation of a new prosthesis.
The technology behind the IntelliFoot uses sensors to monitor how the carbon fibre blades
in the prosthetic foot are bending while the user is walking. These data can give a graphical
representation of the gait cycle, i.e. heel-strike, maximum heel-load, maximum toe-load
and toe-off. By using these data, certain adjustments can be done accordingly.
Other important benefit of the IntelliFoot technology is the ability to print out a report that
shows how active the user is in his daily routine. This report can be used for
reimbursement in the US.

2
1.1 The problem and solution
1. The installation of a prosthesis can be time consuming, leading to unnecessary cost
and discomfort to the patient.
o Solution would be developing a working prototype monitoring device that
has the ability to do gait analysis in real time and relay data wirelessly.
2. Applying for reimbursement in the US for a new prosthesis can be difficult due to
lack of data.
o Solution would be statistical data from the IntelliFoot, to be used in an
activity report.
1.2 Thesis overview
This thesis will cover the following aspects of the IntelliFoot development and how the
data acquired can be presented or used effectively for enhancement of prosthesis
installation.
Preliminary gait analysis
Analysis of required hardware for the IntelliFoot
Hardware setup for successful prototype development
Firmware
o Data processing and algorithms
o Data storage with limited memory resources
o Wireless communications
Results from prototype testing
Discussion
Conclusion

3
2 Background
Before amputees can get a prosthesis, they must see a CPO personnel for analysis. The
most common analysis technique used in this field of work is a gait analysis. A gait
analysis is a process of analysing how the patient walks or how the body motion is during
gait [3]. This is done by observing how the patient walks and by oral communication.
Technology allows CPO's to use specialized equipment to help them doing necessary gait
analysis. Common equipment to do gait analysis is e.g.:
Force plate that patient walks over. The plate maps the pressure of the step from
heel to toe, giving an idea of how the gait is.
Strain gauges, or load cells. Often put in between the knee and ankle. This
equipment can map load in x, y and z plane.
Treadmill with pressure sensors. This equipment works similar as the force plate,
except it can record every step taken continuously while walking.
2.1 Terminologies
There are a few terminologies used for describing gait analysis. The most commonly used
terms in this thesis are:
Stride
Stance phase
Swing phase
Heel-strike
Midstance
Toe-off
The term stride is the same as one gait cycle. There are many terms used to describe the
gait cycle, but in this thesis the "classic gait terms" are used, see Figure 2-1.
Figure 2-1: Human gait cycle explained. In this thesis, the classic gait terms are used [4, p. 458].

4
The CPO often uses a graphical representation of the pressure that the foot creates in
stance phase, from heel-strike to toe-off, to determine the how the gait is.
Figure 2-2: A typical curve from a gait analysis equipment. This graph shows the stance phase from
0% to 65% of the stride. Max force 1 is where maximum heal-load is and max force 2 is where the
maximum toe-load is. Image is from a report in Appendix F.
Most gait analysis equipment uses either pressure sensing technology or strain gauges
(load cells) to measure the force created by the foot in stance phase. The IntelliFoot uses
different approach to achieve compatible results.
2.2 IntelliFoot definition
The IntelliFoot is a small device that is placed inside a footcover of a prosthesis. This
device can sense the bending of the carbon fibre blades of the foot. The data acquired is
stored to an embedded memory to be sent through Bluetooth connection to a smart device,
see Figure 4-4. The IntelliFoot can therefore be used as a gait analysing device that is
attached to the prosthesis at all times.
.

5
3 Requirement analysis
The hardware selection for the IntelliFoot has to comply with specific requirements to
fulfil both the outcome to the end user and the physical requirements of the prosthetic foot.
Since the prosthetic foot is kept as lightweight as possible, the IntelliFoot must be kept as
lightweight also, without compromising requirements. The evolution of embedded
technology is rapidly growing, making the best solution today possibly outmoded
tomorrow.
Though the rapid evolution in embedded technology makes it difficult to stick to one
solution because there is a better product available while the product is in its development
stage, the advantage is that it is relatively easy to find System on a Chip (SoC) solution that
has all of the required needs of the product.
The IntelliFoot hardware will consists of the following:
Microcontroller Unit (MCU)
Flash memory
BLE (Bluetooth low energy)
Linear bend sensors
Gyroscope
Accelerometer
When searching for the best solution the following requirements where considered:
The equipment's power consumption has to be at minimal to achieve long life span
with small/lightweight battery pack.
Linear bend sensor that has steady output signal, meaning:
o It does not drift over time
o It has negligible hysteresis
o It has high signal to noise ratio
Accelerometer and gyroscope. These sensors are to be used for activating the bend
sensors via interrupt and for detecting different types of walking, such as:
o Straight on flat surface
o Uphill

6
o Downhill
o In stairs
The accelerometer and gyroscope sensors are required for the final product of the
IntelliFoot, but are not in the scope of the thesis. Therefore, a requirement analysis
for these sensors has not been done by the author of the thesis.
The physical size of the equipment and sensors must fall within a certain size frame
so it can be mounted inside the foot-cover.
The IntelliFoot must have a low power, wireless interface, for communication to
the front end application.
The memory has to be able to keep data before uploaded to external device.
3.1 Linear Bend Sensor
What makes the IntelliFoot a unique product, is the ability to measure the carbon fibre
bending of the prosthetic foot. There has been conducted a research on what sensor
technology should be used for this product [5]. This research was based on analysing only
bend sensor technology that involves electrical resistance change if bent.
Since then, Össur's Research and Development (R&D) team have developed other bend
sensing technology that does the same job, only better. In chapter 3.1.1 and 3.1.2 these
sensor technologies are explained.
3.1.1 Flexpoint bend sensor
The research conducted, for the IntelliFoot, on using bend sensors that change electrical
resistance (ohms) if bent [1]. These sensors looked promising, but they have too much
hysteresis and drift over time, as seen in figures 3-1 and 3-2.
Figure 3-1: Hysteresis on a Flexpoint bend-sensor [1].

7
Figure 3-2: Drift in Flexpoint bend-sensor [1].
The hysteresis and drift could possibly be corrected by using software algorithms but it
was decided to find another solution that would give better results from the bend sensors.
3.1.2 Hall effect sensor
A Hall effect sensor is a type of transducer that converts a magnetic field to an output
voltage. These sensors are very common in industrial, commercial and medical products
due to its small footprint, reliability and low power consumption. These sensors are linear,
have very long live-span due to frictionless sensing and exhibit no significant hysteresis or
memory effects [6, p. xii].
The basic physics of a Hall effect sensor
For simplicity, the Figure 3-3 (a) shows how current flows through a metal plate. When
voltage is read between point 1 and 2, it will measure 0 V. If the metal plate is exposed to
magnetic field, Figure 3-3 (b), a small voltage, between point 1 and 2, will be read. If the
polarity of the magnetic field will change, the voltage output will also be reversed.
Figure 3-3: How magnetic field changes voltage between point 1 and 2 [6, p. 1].

8
What makes the Hall effect special is the fact that the voltage read between point 1 and 2 is
static under steady-state conditions, i.e. while the current and the external magnetic field is
static, the voltage output is constant over time. Under the influence of magnetic field the
current flowing through a metal plate, or a wire, slightly moves to one side of the
conducting material, thus giving change in voltage from one side to the other. This voltage
difference is relatively small though, making it necessary to use material that has low
carrier concentration1 for more extreme Hall effect. The less the carrier concentration is,
more Hall voltage can be read [6, p. 8].
Comparison of Hall effect sensors
There are literally thousands of Hall effect sensors to choose from. To make the right
selection of a Hall effect sensor the following was considered:
Supply voltage
Supply current
Operating temperature
Size
In Table 3-1, the comparison of three Hall effect sensors can be seen.
Table 3-1: Perform characteristics and comparison of few Hall effect sensors.
Performance Characteristics
Manufacturer
Brand/Type
Panasonic
AN48836B
Honeywell
SS49E
Honeywell
SL353HT
Supply Voltage 1.65 V to 3.6 V 2.7 V to 6.5 V 2.2 V to 5.5 V
Supply Current Typ. 3 µA 6 mA 2.5 mA or 1.5 µA*
Operation Temp. -40 C to 85 C -40 C to 100 C -40 C to 85 C
Size 2.0x2.1x0.7 mm 4.1x3.0x1.6 mm 2.9x1.6x1.45 mm
Type SMD THD SMD
* 1.5 µA in suspend mode 87% of the duty cycle.
As seen in Table 3-1, the AN48836B and SL353HT consume less power than the SS49E
Hall effect sensor. There are many sensors available with similar specification but the
1 Carrier concentration is the density of charge carriers [12, p. 40] per volume.

9
AN48836B from Panasonic would be chosen for mass production. Since the Hall effect
sensors in the lowest energy consumption group are typically SMD (Surface Mount
Device), the Honeywell SS49E was chosen for prototyping. The SS49E can be easily
soldered and mounted without the extra effort using special tools to do so. Price was not
included in the comparison since Hall effect sensors cost is not a significant factor.
3.2 System on a Chip (SoC)
In the mid-1990s, SoC was arguably a marketing term which only included relatively
simple digital systems. Since the year 1970, the number of transistors has increased at an
exponential rate, sometimes referred as the Moore's law, thus leading to design and
manufacturing a true SoC chips from the year 2000 [7, p. XI]. SoC consists of multiple
hardware peripherals on a single chip, such as:
Microcontroller Unit (MCU), including Central Processing Unit (CPU)
Memory
o Random Access Memory (RAM)
o Read Only Memory (ROM)
o Flash memory
Converters
o Analogue to Digital Converter (ADC)
o Digital to Analogue Converter (DAC)
Analogue and Digital in and out ports (I/O)
Digital Signal Processing (DSP)
Wireless communication
o Wireless Fidelity, IEEE 802.11b (Wi-Fi)
o Bluetooth or Bluetooth Low Energy (BLE)
The above list is not comprehensive, but should give an idea what the today's definition of
SoC is and what is possible to put on a single chip, at roughly the size of a fingernail.
3.2.1 Comparison of SoC's
There are dozens of SoC manufacturers, but only a few companies that are in the front line
of making low powered system that fulfils the IntelliFoot requirements. After thorough
research, there were three companies that had systems that might fit for this project.
When choosing the SoC for the IntelliFoot the following aspects where considered:
Physical size and weight
Integrated components
o MCU
o Memory
o BLE
Energy consumption

10
In Table 3-2, the comparison of three SoC's can be seen.
Table 3-2: Perform Characteristics and comparison of few SoC's.
Performance Characteristics
Manufacturer
Brand/Type
Texas Instruments
CC2541
Nordic
Semiconductor
NRF51822
Dialog
Semiconductor
DA14580
Flash memory size 256 KB 256 KB 84 KB
RAM Size 8 KB 16 KB 42 KB
Standby current 0.5 µA 0.6 µA 0.6 µA
TX/RX current 17.9 mA 13 mA 3.7 mA
MCU Architecture Intel 8051 Cortex M0 Cortex M0
Physical size 6x6x1 mm * 6x6x1 mm * 6x6x1 mm *
*QFN socket. The actual chip is slightly smaller and can be soldered directly on the Printed Circuit Board
(PCB).
All of the SoC's compared have Bluetooth 4.0 stack (BLE). It is difficult to compare the
power consumption on the numbers that are given in the overview specifications. There are
so many factors that influence the power consumption, such as transmit power and what
components are kept in sleep mode while not in use.
The size of the compared SoC's are the same and the price ranges from about 3 USD to 6
USD, DA14580 at the lowest price. The price is not a significant factor, thus not
influencing the selection.
How to determine which one is used for this project is based on what architecture the
Össur's R&D team are used to work with. The data specification on all of the three SoC's
are more than enough to fulfil the product specification.
The SoC of preference is the NRF51822 from Nordic Semiconductor, chosen by Össur's
R&D team.

11
3.3 External memory
The internal memory in the SoC is rather limited, often around 128 kB to 256 kB. This
leaves limited space for data collecting after the program has been written to the memory.
Another thing to consider is the fact that it is generally power consuming to constantly
write to a flash memory. The solution is to have an external memory to store the data. The
alternative to regular flash memory is to use technology called F-RAM or Ferroelectric
Random Access Memory [8, p. 1]. F-RAM is a non volatile (keeps data even though the
device is turned off) memory with extremely low power consumption and very fast
write/read speeds.
Normal Flash memory has limitation of around 10.000 write cycles before failure. F-RAM
has more than 100.000.000.000.000 [8, p. 1] cycles before failure. Also F-RAM can log
data continuously for more than 150.000 years, but normal flash would fail in less than 7
minutes of continuous writing to it [9, p. 1].
Figure 3-4: F-RAM compared to regular flash, in context of write endurance [9, p. 1].
F-RAM has fast writing speeds compared to normal flash memory. It is similar in writing
speed as the S-RAM memory, which is though volatile.
In Table 3-3 the comparison of F-RAM to other common types of memory, both volatile
and non volatile.
12
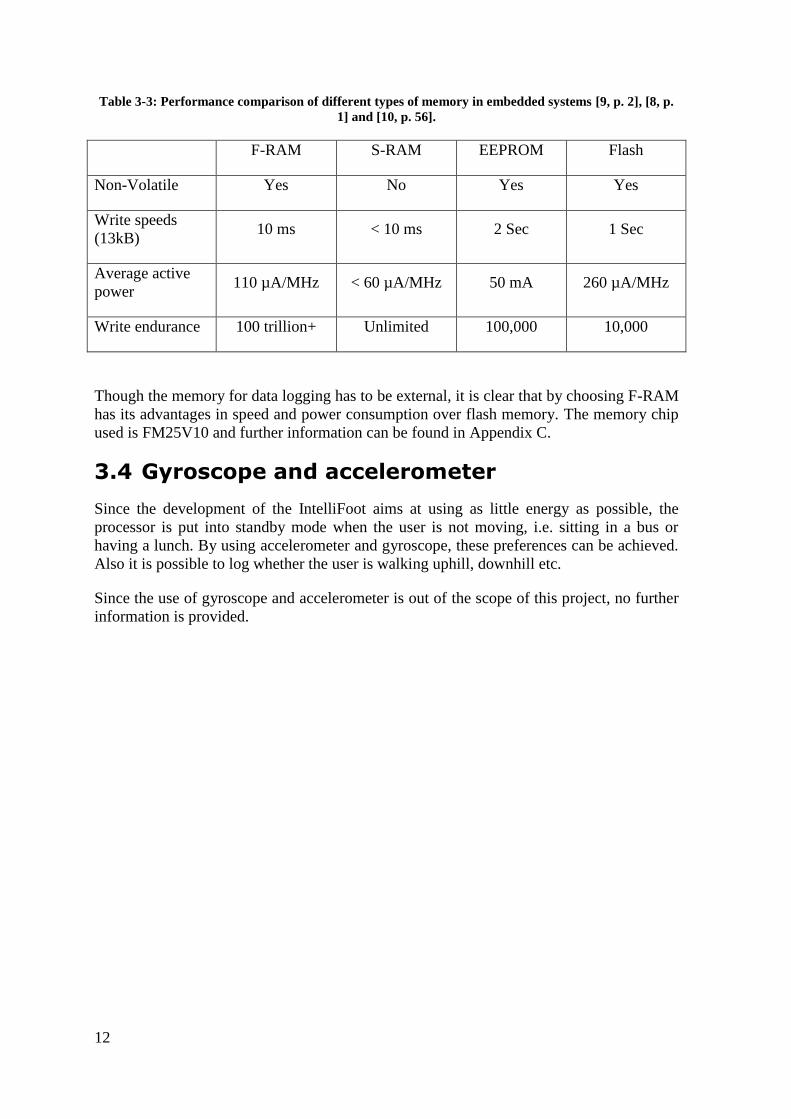
Table 3-3: Performance comparison of different types of memory in embedded systems [9, p. 2], [8, p.
1] and [10, p. 56].
F-RAM S-RAM EEPROM Flash
Non-Volatile Yes No Yes Yes
Write speeds
(13kB) 10 ms < 10 ms 2 Sec 1 Sec
Average active
power 110 µA/MHz < 60 µA/MHz 50 mA 260 µA/MHz
Write endurance 100 trillion+ Unlimited 100,000 10,000
Though the memory for data logging has to be external, it is clear that by choosing F-RAM
has its advantages in speed and power consumption over flash memory. The memory chip
used is FM25V10 and further information can be found in Appendix C.
3.4 Gyroscope and accelerometer
Since the development of the IntelliFoot aims at using as little energy as possible, the
processor is put into standby mode when the user is not moving, i.e. sitting in a bus or
having a lunch. By using accelerometer and gyroscope, these preferences can be achieved.
Also it is possible to log whether the user is walking uphill, downhill etc.
Since the use of gyroscope and accelerometer is out of the scope of this project, no further
information is provided.

13
4 IntelliFoot development
The development of the IntelliFoot is a process of doing experiments with different sensor
technologies and different prosthesis settings on the user. It is also important to choose the
right hardware to have a robust data collection with minimum energy consumption. In
early stages of the development it was decided to use hardware from other prosthesis
equipment for sensor testing and data collection. Though that hardware setup is too
extensive and power consuming for the IntelliFoot, it suits well for early stages of
prototyping such as; data collection, sensor testing and proof of concept of the IntelliFoot.
As the development progressed the hardware changed to low powered microcontroller with
the ability to send data wirelessly via Bluetooth communication.
4.1 Prototype hardware setup
The hardware used for the IntelliFoot development consists mainly of already built
material from Össur. While the circuits used, do have the desired components that the
IntelliFoot will have, they have to be modified in some way and come in pieces instead of
a solid piece that can be implemented neatly inside the foot-cover. This chapter will
describe the setup of the hardware components used.
4.1.1 Vari-Flex Low Profile (LP)
There are many types of prosthetic feet that Össur manufactures. The Vari-Flex feet are
made for all purpose of user activity, therefore suits well for the IntelliFoot prototyping.
The LP version of the Vari-Flex is for users that have long residual limbs where the non
LP version is too high, see Figure 4-1[11].
Figure 4-1: Low Profile (LP) Vari-Flex (to the left) compared to normal Vari-Flex.

14
The Vari-Flex prosthesis suits both transfemoral (above knee) and transtibial (below knee)
amputees, as seen in Table 4-1. The LP version of the Vari-Flex prosthesis is used for the
testing since it suits well for the amputee doing the tests.
Table 4-1: LP Vari-Flex technical specifications [11].
Amputation Level: Transfemoral (AK), Transtibial (BK)
Impact Level: Low to High
Maximum Patient Weight: 166 kg (366 lbs)
Categories: Size 22-24; Cat. 1-5 / Size 25-30; Cat. 1-9
Sizes (shoes): 22-30
Weight Of Foot: 540 g (19 oz) w. Pyramid and Foot Cover
Build Height Standard: 68 mm (2 11/16") w. Pyramid and Foot Cover
Heel Height: 10 mm (3/8")
Adapter Options: Male Pyramid or Lamination Adapter
Flex Foot Characteristics: Carbon-x, evo, full length toe lever, proportional
response, split toe
4.1.2 Hall effect sensors setup
The design of the bend sensor technology, in the IntelliFoot, is a mechanical design by
Össur's R&D team. This design is under patent pending process. The design uses the Hall
effect sensor in conjunction with a neodymium magnet to successfully measure how the
carbon fibre blades curve. The magnet is put in a plastic case in front of the Hall effect
sensor, see Figure 4-2. If the casing bends, the distance between the magnet and the Hall
effect sensor changes.

15
Figure 4-2: A neodymium magnet is mounted in front of the sensor. When the plastic case bends, the
distance between the magnet and the sensor changes, thus giving different readings.
The plastic case is then glued on the carbon fibre blades on a fixed location. As a result
from a research [12] the location of the plastic case is near the bolt where the carbon blades
are fastened, see Figure 4-3.
Figure 4-3: LP Vari-Flex carbon fibre prosthesis with the IntelliFoot sensors attached. The Hall effect
sensors are mounted in the flexible plastic case.
4.1.3 Wireless board
Össur's electrical engineers developed a wireless board (BWM-V01) capable of reading
from actuators, do calculations and store or send data wirelessly via Bluetooth. BWM-V01
includes the following hardware:
SoC (NRF51822)
Real time clock (MT41T83)
F-RAM memory (FM25V10)
Gyroscope and accelerometer (LSM330DLC)

16
Voltage regulator (LTC3129)
Though the BWM-V01 was originally developed for other products than the IntelliFoot, it
was useful for the IntelliFoot development and prototyping. It has all of the necessary
components needed and can be mounted on the Vari-Flex prosthesis, see Figure 4-4.
Figure 4-4: LP Vari-Flex prosthesis with IntelliFoot prototype attached. The larger PCB is the BWM-
V01 circuit.
When applying voltage to the General Purpose Input/Output (GPIO) pins of the NRF51822
there are two rules to consider and should be referenced when looking at Table 4-2:
1. The Analogue to Digital Converter (ADC) should not be exposed to higher voltage
than 2.4 V.
2. The GPIO pins should not be exposed to higher voltage than VDD+0.3 V.
The NRF51822 has built in Analogue to Digital Converter (ADC) which is used to change
analogue input signals to digital signal for manipulating programmatically. Since analogue
sensors vary in voltage output and voltage range, a prescaler is built in the NRF51822. The
prescaler can be configured programmatically and must be configured with care as the
ADC can be damaged if too much voltage is applied to it. The prescaler has three
configurations [13]:
1. 1/1 - No prescaling. The ADC receives the same voltage as applied to the GPIO.
2. 1/3 - One third of the input voltage applied to the GPIO goes to the ADC.
3. 2/3 - Two thirds of the input voltage applied to the GPIO goes to the ADC.
In Table 4-2 is an example of maximum voltage applied to the GPIO without damaging the
ADC.

17
Table 4-2: Maximum voltage applied to the GPIO of the NRF51822.
VDD Prescaling GPIO Max Voltage Rule Nr.
Limitation
3.6 V 1/1 2.4 V 1
3.6 V 2/3 3.6 V 1
3.6 V 1/3 3.9 V 2
3.3 V 1/1 2.4 V 1
3.3 V 2/3 3.6 V 1 and 2
3.3 V 1/3 3.6 V 2
1.8 V 1/1 2.1 V 2
1.8 V 2/3 2.1 V 2
1.8 V 1/3 2.1 V 2
The VDD in the prototype varies from 3.3V to 3.7V, depending on whether it is powered
by USB or a battery. The ADC has the ability to give 10 bit resolution. This means that the
analogue signal can give 0 to 1024 digital steps. It is possible to use either external or
internal voltage reference to control what voltage range should be divided into those 1024
steps. The built in voltage reference has built in voltage stabilizer in regards to heat, thus
making it convenient to use. The built in voltage reference in the NRF51822 is 1.2 V. In
chapter 4.1.4 the prescaling is discussed in depth.
4.1.4 Amplifier circuit for the Hall effect sensors
The Hall effect sensors have to be calibrated for the desired voltage output and voltage
range to comply the input voltage of the ADC. An amplifier circuit, consisting of
operational amplifier (op-amp) and other common electronics, are used for this calibration.
The Össur's R&D team have built such amplifier circuit (RKN67825SCH1.2) for other
products, but it can be used for the IntelliFoot prototype. As seen in Figure 4-5 the
amplifier circuit has two op-amps, thus convenient to use since there are two Hall effect
sensors in the IntelliFoot.

18
Figure 4-5: Electronic scheme for the RKN67825SCH1.2 [14, p. 1] amplifier circuit.
For the circuit to work with the IntelliFoot it has to be modified to change the voltage from
the Hall effect sensor to give corresponding voltage for the input of the ADC in the
NRF51822. The test results, from Table 5-1, shows the output voltage from the Hall effect
sensor are from 1.424 V to 1.543 V. The required input voltage of the ADC is from 0 to
1.2 V.
The RKN67825SCH1.2 circuit is driven by 3.3 V from the wireless board. To get required
voltage from the Hall effect sensors, the output voltage has to be modified for the input of
the NRF51822. The following steps have to be considered:
1. The voltage range, or voltage difference of the Hall effect sensor.
2. The reference voltage of the 10 bit ADC.
3. The amount of amplification.
4. The reference voltage of the op-amp.
Table 4-3 shows the pin layout for the op-amp (AD8226) used in the circuit.

19
Table 4-3: Op-amp AD8226 Pin Function Descriptions.
Pin No. Mnemonic Description
1 -IN Negative Input
2,3 RG Gain Settings Pins. Place
gain resistor between these
two pins.
4 +IN Positive Input.
5 -VS Negative Supply
6 REF Reference. Must be driven
by low impedance.
7 VOUT Output.
8 +VS Positive Supply.
The voltage difference of the Hall effect sensor is 119 mV (1.543 V-1.424 V) from 1,230
N heel-load to 1,230 N2 toe-load. To extend 119 mV to the range of 10 bit resolution the
ADC supports the amplification must fall within certain voltage. The results from these
tests can be seen in more details in chapter 5.2.
Considering Table 4-2, using VDD 3.3 V the maximum voltages range from 2.4 V to 3.6
V. Since we have 3.3 V, we can choose between these three settings:
1/1 Prescaling, max 2.4 V.
2/3 Prescaling, max 3.6 V.
1/3 Prescaling, max 3.6 V.
It could be dangerous to use the 1/1 prescaling, since the op-amp can give out 3.6 V before
it saturates, so either the 3.3 V with 2/3 prescaling or the 3.3 V with 1/3 prescaling are
considered as a good starting point.
The internal 1.2 V voltage reference in the ADC is used, therefore the calculations of the
op-amp output should be as close to maximum of 1.2 V.
A voltage divider is put between pin 1 and 4 of P100 LC Solder Pads, see Figure 4-6. This
is to make the minus input on the op-amp the same as the lowest output value of the Hall
effect sensor.
2 1,230 N is the standard maximum load during load tests in Össur inc.

20
Figure 4-6: A voltage divider is used to get the right voltage on pin 1 on the op-amp (-Input).
The output of the Hall effect sensor is connected to the plus input of the op-amp to
calculate the difference in voltage from 1.424 V to 1.543 V. The transfer function for the
op-amp can be seen in Equation 4-1, where G is the op-amp gain and VREF is a voltage
reference, to shift the output voltage for fixed value.
4-1
To get the desired amplification, a resistor is put between pin 2 and pin 3 on the op-amp.
The amplification, or gain, can be determined by Equation 4-2.
4-2
If desired gain is known, the size of the resistor can be determined by Equation 4-3.
4-3
Table 4-4 shows various amplification levels by using different sizes of resistors.

21
Table 4-4: Gains Achieved Using 1% Resistors [15, p. 9].
1% Standard Table Value of RG (Ω) Calculated Gain
49.9 K 2.0
12.4 K 5.0
5.49 K 10.0
2.61 K 20.0
1.00 K 50.4
499 100.0
249 199.4
100 495.0
49.9 991.0
By using the following information in combination of Equation 4-1 and Equation 4-2,
Equation 4-4 can be derived:
Desired voltage (VOUT) for the ADC is 1.2 V.
Prescaling is 2/3.
VIN+ - VIN- is 119 mV.
VREF is 0 V.
4-4
Therefore:
4-5
To find out the size of the resistor (RG), G is put into Equation 4-3:
4-6
Therefore, RG is 3.48 KΩ. By using common 3.3 KΩ resistor for the gain control of the op-
amp and using the above equations, the following results are expected:

22
The gain (G) would be around 16.
The maximum voltage applied to the ADC would be around 1.27 V
The voltage applied to the ADC could theoretically never exceed the max 3.6 V
because of the 2/3 prescaling together with the 3.3 V input. The theoretical voltage
exposed to the ADC while 1,230 N are applied on the prosthetic foot is around 0.07 V
above the limit. This would be considered within limits of the prototype.
4.1.5 NRF51822 evaluation board
To be able to program the NRF51822 SoC, an Evaluation kit (NRF51822EK) must be
used, see Figure 4-7. The evaluation kit is connected to the computer, used to program the
firmware, via USB cable.
Figure 4-7: NRF51822 Evaluation kit.
4.1.6 UART communication
When developing software programs it has significant benefits to be able to debug the
program at the same time as it is written. Usually the debugging is done within the
Integrated Development Environment (IDE) and the developer can stop the program at any
time to see what is happening at the specific time. When programming firmware in
embedded systems, this approach can be tedious. By setting up UART communication
from the microcontroller it is possible to extract text messages written within the code.
This way it is possible to use terminal software to follow specific variables or methods at
runtime.
An UART to USB dongle (UB232R) is used for this purpose, see Figure 4-8.

23
Figure 4-8: UB232R UART to USB communication dongle.
4.2 Firmware
A firmware is a program written specifically for embedded systems. It is used to control
the hardware, such as I/O or Bluetooth communications [16, p. 6]. The firmware used for
this project is based on firmware used in other products from Össur. The C programming
language is used for the firmware programming of the IntelliFoot. Since the memory of the
nRF51822 chip is limited, the programming strategy must be made with that in mind.
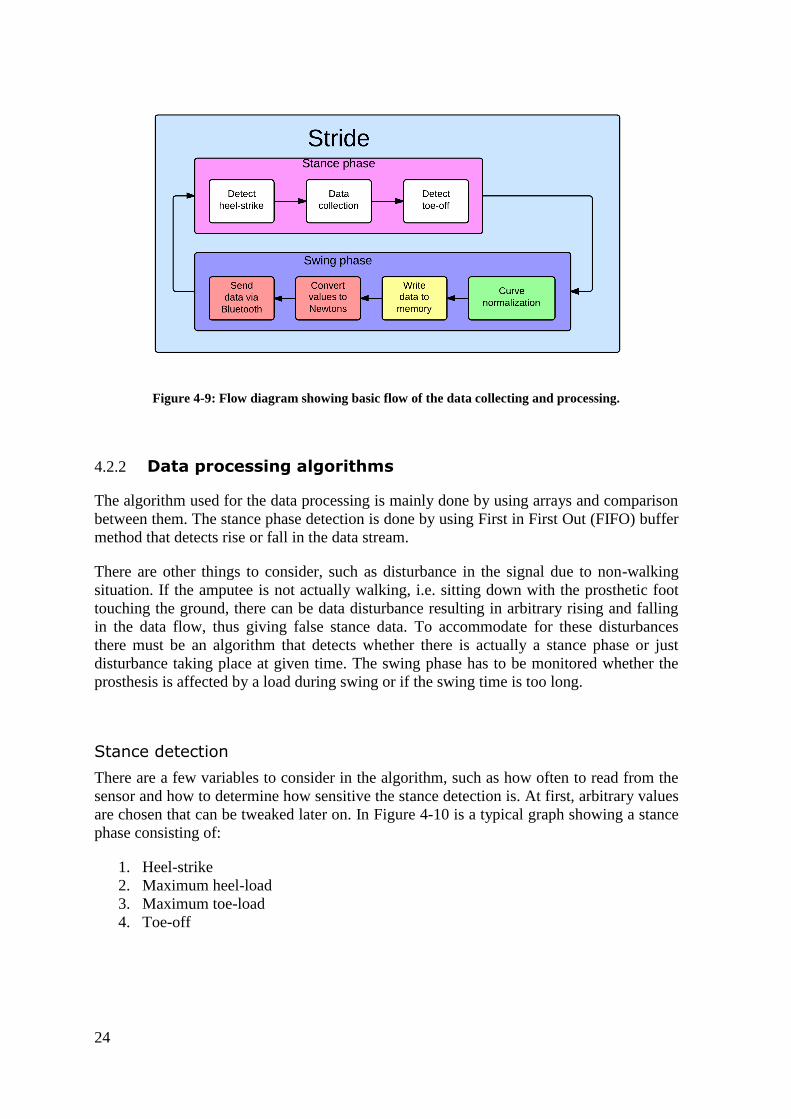
4.2.1 Data processing
Though data can be acquired at a high sampling rate, e.g. 5 ms, data processing must
minimize the amount of memory the data acquisition takes. There are three main stages
that the data processing goes through:
1. Stance detection
2. Normalizing the stance
3. Write data to memory
The stage 2 and 3 happen while the gait is in a swing phase.
The data processing for each stance phase is done when the swing phase is taking place,
see Figure 4-9.
24
Figure 4-9: Flow diagram showing basic flow of the data collecting and processing.
4.2.2 Data processing algorithms
The algorithm used for the data processing is mainly done by using arrays and comparison
between them. The stance phase detection is done by using First in First Out (FIFO) buffer
method that detects rise or fall in the data stream.
There are other things to consider, such as disturbance in the signal due to non-walking
situation. If the amputee is not actually walking, i.e. sitting down with the prosthetic foot
touching the ground, there can be data disturbance resulting in arbitrary rising and falling
in the data flow, thus giving false stance data. To accommodate for these disturbances
there must be an algorithm that detects whether there is actually a stance phase or just
disturbance taking place at given time. The swing phase has to be monitored whether the
prosthesis is affected by a load during swing or if the swing time is too long.
Stance detection
There are a few variables to consider in the algorithm, such as how often to read from the
sensor and how to determine how sensitive the stance detection is. At first, arbitrary values
are chosen that can be tweaked later on. In Figure 4-10 is a typical graph showing a stance
phase consisting of:
1. Heel-strike
2. Maximum heel-load
3. Maximum toe-load
4. Toe-off

25
Figure 4-10: Here are the four of the stages used to detect the stance: 1. heel-strike, 2. maximum heel-
load, 3. maximum toe-load and 4. toe-off. Image is from preliminary research for the IntelliFoot.
To determine whether the curve is rising or falling, the derivative of the curve is taken. The
algorithm for the stance detection detects the rising or falling of the curve at point 1, 2, 3
and 4 by calculating the slope of the curve. The slope is not calculated between two
adjacent data points, rather a few points apart. This is to eliminate the false rising/falling of
the curve due to signal noise. The further the data points are apart in the calculation, the
more delay is in the calculation process, relatively to the actual stance. The delay is
minimal though, or 5 ms per data point apart. The algorithm has one data point in between
the data points used for the calculations. The algorithm also accounts for how steep the
slope is to be detected as an important point in the phase. A flowchart for the stance
detection algorithm can be seen in Figure 4-11.
The swing phase is recorded from toe-off to heel-strike. The following criteria must be met
for the swing phase being recorded successfully:
The signal from the sensors must be near zero at all times.
The swing time must be within certain time frame or it will be dismissed.

26
Figure 4-11: A flow chart explaining how the algorithm for stance detection works.
Curve normalization
Every stance detected and recorded, is normalized before it is written to the memory or
sent through BLE connection. The normalization is with respect to time, i.e. on the x-axis
to fit one gait cycle. To determine the amount of data points in the normalized stance there
where two aspects considered:
1. Data retention
2. Memory capacity

27
By combining these two aspects the results are 40 data points (di) in every normalized
stance, from heel-strike to toe-off. Meaning, all data are resampled to fit 40 data points.
This way, the curve for the stance retains the original data visually, see Figure 4-12.
Figure 4-12: Test data that shows the difference of 160 data points (lower graph) compared to graph
that has been normalized (resampled) to 40 data points (upper graph).
The IntelliFoot can store at least 65,535 steps in memory, each consisting of 40 data points.
The memory usage for these steps are theoretically at maximum of 16 KB.
The algorithm operation for the normalization has three stages:
1. Create a scaling constant (C) to divide the original data points into 40 data points.
4-7
2. Create an array (Chop-array), of the same size as the original array, that represents
which data points in the original step should go into each array slot of the
normalized array. Ni represents the slot in the new array, which the mean of the
original data will go into, see Figure 4-13.
4-8
3. Calculate the mean of the data points in the original array that match the chop-array
representation of normalized array index, and copy the value into the normalized
array.

28
Figure 4-13: This array diagram shows how a part of original stance data is converted to a normalized
stance with fixed amount of data. The upper number in the arrays represent the index number and the
lower number represent the data. The chop-array's data show the corresponding index number in the
normalized array.
Writing data to memory
To use as little memory as possible, it was decided to let memory addresses represent a
certain data value instead of write the actual values to the memory, e.g. the value "257"
would go to memory address 257 (h0x00101). This way it is possible to add up to 65,535
data-point entries to the memory by using only 2 bytes of memory per data point. If the
actual data value would be put into the memory it would quickly fill up the 2 bytes.
Every time a stance has been detected, the value of each data-point is represented as a
memory address, thus incrementing the current value by 1 in the memory address location.
In the example seen in Figure 4-14, there are total of five stances recorded into memory.
Figure 4-14: Simplified example of how data is stored in memory. The numbers with the blue
background represents the memory address, each 2 bytes. The red numbers show how often it has
been written to the specific memory location, where the memory address represents the actual value of
the data.

29
The values added to the memory take 2 bytes of memory since they can go up to the value
of 16 bit unsigned integer.
To convert the value from the Hall effect sensors into memory address is as follows:
4-9
The constant "100" added to the "value" is to raise the value above zero (there is no
memory address below zero). The multiplication by the constant 2 is because there are 2
bytes used for each entry. The "datapointi " represents each datapoint, or column in
memory. The constant "200" is to make the datapoint far enough from the last datapoint to
avoid overlapping. Figure 9-1 in Appendix A, shows real data from 107 stance phases in
memory.
Converting the data to newtons
The digital value from the ADC is not linear when comparing its output to the force
applied to the prosthesis. To compensate for the nonlinearity, a polynomial equation (4-10)
is derived by using mathematical tool such as Excel or Matlab. By using polynomial
equation of fourth order, a regression ( ) of 0,996 can be achieved.
4-10
The testing and results of the data conversion is in Chapter 5.4, Hall effect sensor output
data and force analysis - Experiment 2.
4.2.3 Wireless communication using Bluetooth
The wireless communication between the IntelliFoot and handheld device is achieved by
using the internal Bluetooth in the NRF51822 SoC. A soft-device (S110) is a firmware
protocol stack that gives the chip ability to use integrated BLE circuit [17, p. 3]. The soft-
device uses 80 KB of the internal memory of the SoC, thus leaving less space for the actual
firmware on the chip. The Bluetooth protocol uses a 128 bit Universally Unique Identifier
(UUID) to identify a broadcasted service that a peripheral can connect to.
There are two types of packet (data) sending methods in the IntelliFoot:
1. Real time data flow to the CPO while the user is walking.
2. Download cumulative statistics from memory.
The real time data flow sends data while in swing phase, thus giving last stance data and
previous swing data. The data are put into buffer (sendout) before sent to the Bluetooth
transmit buffer (BLE_TX). Every 5 ms it is checked whether the sendout buffer or the
BLE_TX buffer are empty. If data are sent to the BLE_TX buffer while it is not empty,
the system will halt. Therefore these precautions must be made (see Figure 4-15).

30
Figure 4-15: While collecting data in real time via Bluetooth, data packets must be divided into smaller
packets to fit each BLE_TX buffer.
To send all of the cumulated data from IntelliFoot memory to the handheld device, the data
collecting loop is stopped. It is possible to send up to 20 bytes per packet [17, p. 7],
therefore the data must be divided before sent.
31
5 Hardware analysis and prototype testing
To understand better how to present the data more concisely from the IntelliFoot, a
preliminary gait analysis was conducted. This analysis was made concurrently with a
consultation to a CPO. This way it is possible to have the necessary data available for
future gait analysis using the IntelliFoot.
A force test analysis was made to map the output of the IntelliFoot in newtons. The results
were then compared to tests done on a treadmill that has sensors for gait analysis.
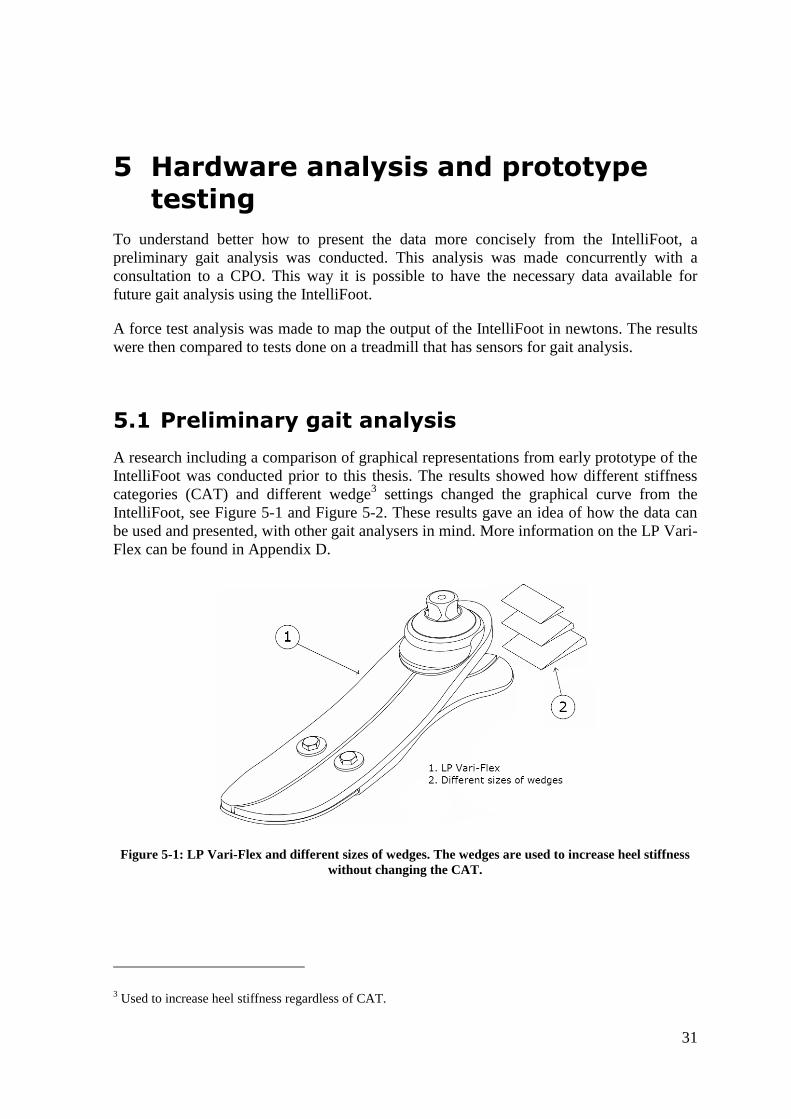
5.1 Preliminary gait analysis
A research including a comparison of graphical representations from early prototype of the
IntelliFoot was conducted prior to this thesis. The results showed how different stiffness
categories (CAT) and different wedge3 settings changed the graphical curve from the
IntelliFoot, see Figure 5-1 and Figure 5-2. These results gave an idea of how the data can
be used and presented, with other gait analysers in mind. More information on the LP Vari-
Flex can be found in Appendix D.
Figure 5-1: LP Vari-Flex and different sizes of wedges. The wedges are used to increase heel stiffness
without changing the CAT.
3 Used to increase heel stiffness regardless of CAT.

32
Figure 5-2: A test showing different wedge settings with the same CAT and size.
The output values from the IntelliFoot sensors were not showing newtons but digital values
from the microcontroller. This was enough to see difference between different settings.
Further test data from this research can be found in Appendix B.
5.2 Hall effect sensor output voltage and force
analysis - Experiment 1
The deflection force is to be displayed in newtons. Measurements were conducted to map
the voltage output of the Hall effect sensor relative to newtons. A Mechanical Strength
Testing (MST) machine was used to test various forces on the Vari-flex foot. These tests
were conducted to see how the output voltage and the distance between the Hall effect
sensor and the magnet, changed in relation to applied force, see Table 5-1.
33
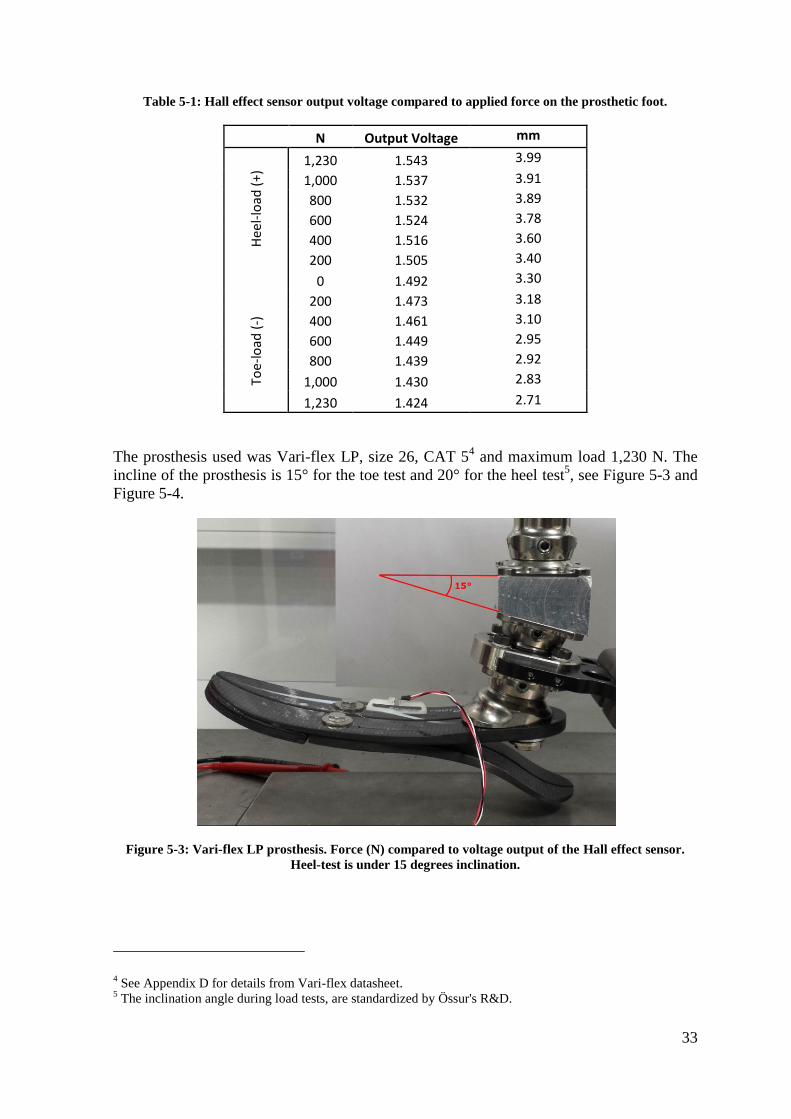
Table 5-1: Hall effect sensor output voltage compared to applied force on the prosthetic foot.
N Output Voltage mm
Hee
l-lo
ad (
+) 1,230 1.543 3.99
1,000 1.537 3.91
800 1.532 3.89
600 1.524 3.78
400 1.516 3.60
200 1.505 3.40
0 1.492 3.30
Toe
-lo
ad (
-)
200 1.473 3.18
400 1.461 3.10
600 1.449 2.95
800 1.439 2.92
1,000 1.430 2.83
1,230 1.424 2.71
The prosthesis used was Vari-flex LP, size 26, CAT 54 and maximum load 1,230 N. The
incline of the prosthesis is 15° for the toe test and 20° for the heel test5, see Figure 5-3 and
Figure 5-4.
Figure 5-3: Vari-flex LP prosthesis. Force (N) compared to voltage output of the Hall effect sensor.
Heel-test is under 15 degrees inclination.
4 See Appendix D for details from Vari-flex datasheet.
5 The inclination angle during load tests, are standardized by Össur's R&D.

34
Figure 5-4: Vari-flex LP prosthesis. Force (N) compared to voltage output of the Hall effect sensor.
Toe-test is under 20 degrees declination.
In Figure 5-5 the maximum and minimum distance between the Hall effect sensor and the
magnet can be seen. The distance varies from 2.71 mm (1,230 N toe-load) to 3.99 mm
(1,230 N heel-load). In neutral position, i.e. when no load is applied, the distance is 3.30
mm.
Figure 5-5: Maximum deflection (below) at 1,230 N toe-load and minimum deflection (above) at 1,230
N heel-load. When no load is applied to the prosthesis, the distance is 3.30 mm.

35
The linearity of the voltage output versus the applied force can be seen in Figure 5-6, and
the linearity of the displacement of the magnet from the Hall effect sensor versus the
applied force can be seen in Figure 5-7.
Figure 5-6: Linearity of voltage output from the Hall effect sensor versus applied load in newtons. Data
from Table 5-1.
Figure 5-7: Displacement of magnet from Hall effect sensor versus applied load in newtons. Data from
Table 5-1.
The linearity is not perfect, as the output voltage is with maximum 3% from the linear
trend line. There are two main reasons for this nonlinearity.
1. The carbon fibre does not bend linearly under applied load. This is because the
prosthetic foot is not regular in shape, thus making the bending nonlinear.
2. The plastic case, holding the magnet and Hall effect sensor, is not designed in that
way making the distance between the magnet and the Hall effect sensor linear
versus the bending of the carbon fibre.
The first point is inevitable due to the build of the prosthesis. Regarding the second point,
it is possible to enhance the mechanical structure of the plastic case to make the bending
more linear.
36
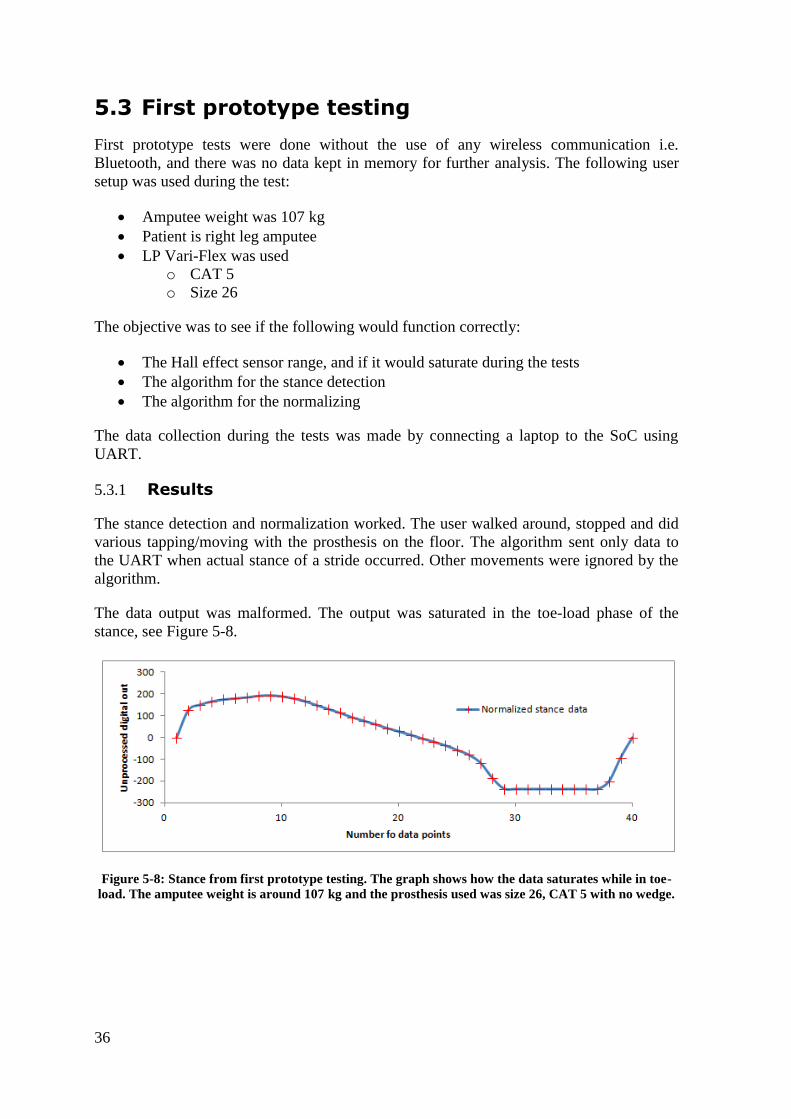
5.3 First prototype testing
First prototype tests were done without the use of any wireless communication i.e.
Bluetooth, and there was no data kept in memory for further analysis. The following user
setup was used during the test:
Amputee weight was 107 kg
Patient is right leg amputee
LP Vari-Flex was used
o CAT 5
o Size 26
The objective was to see if the following would function correctly:
The Hall effect sensor range, and if it would saturate during the tests
The algorithm for the stance detection
The algorithm for the normalizing
The data collection during the tests was made by connecting a laptop to the SoC using
UART.
5.3.1 Results
The stance detection and normalization worked. The user walked around, stopped and did
various tapping/moving with the prosthesis on the floor. The algorithm sent only data to
the UART when actual stance of a stride occurred. Other movements were ignored by the
algorithm.
The data output was malformed. The output was saturated in the toe-load phase of the
stance, see Figure 5-8.
Figure 5-8: Stance from first prototype testing. The graph shows how the data saturates while in toe-
load. The amputee weight is around 107 kg and the prosthesis used was size 26, CAT 5 with no wedge.

37
The op-amp circuit needed further configuration of both signal amplification and voltage
reference to solve the signal saturation problem, which required more load testing on the
prosthesis.
5.4 Hall effect sensor output data and force
analysis - Experiment 2
After further analysing and refining the op-amp circuit (chapter 4.1.4), the sensor 1 gave
signal from 1,230 N toe-load to 1,230 N in heel-load6. The other sensor gave signal from
1,000 N heel-load to 1,230 N in toe-load.
Table 5-2: Digital values from both Hall effect sensors. The range spans from 1,230 N heel-load to
1,230 N toe-load, with the exception of sensor 2 saturates in 1,000 N in heel-load.
N Sensor 1 digital out Sensor 2 digital out
Hee
l-lo
ad
1,230 316 289
1,000 276 289
800 246 246
600 206 209
400 148 154
200 82 88
0 1 1
Toe-
load
200 -154 -180
400 -291 -326
600 -407 -448
800 -510 -550
1,000 -600 -641
1,230 -677 -720
Total digital range: 993 1009
The linearity of the applied newtons versus the digital output of the ADC in the NRF51822
SoC is not linear as mentioned in chapter 5.2. The second linearity tests of the sensors can
be seen in Figure 5-9.
6 1,230 N are the standard maximum test load defined by Össur's R&D.

38
Figure 5-9: The linearity of the applied load to the prosthesis versus the digital signal. The polynomial
equations are generated by MS Excel. Also see Table 5-2.
After applying the polynomial equations (see Figure 5-9) into the firmware of the
IntelliFoot, the nonlinearity was nearly eliminated, see Figure 5-10.
Figure 5-10: Output in newtons compared to applied load. By using the polynomial equations the
output is linear, with the exception of sensor 2 being saturated in 1,000 N.
5.5 Second prototype testing
The following setup was used during the test:
Amputee weight was 107 kg.
Patient is right leg amputee.
LP Vari-Flex was used.

39
o CAT 5
o Size 26
The gait analyser used for comparison was treadmill from Zebris7.
The following aspects were tested in the second prototype testing:
The Hall effect sensor range, and if it would saturate during the tests
The data from the IntelliFoot compared to other gait analyser
The data collecting into the F-RAM
Wireless communication through Bluetooth connection
5.5.1 Results
Treadmill test
The sensors stayed in range i.e. no saturation occurred. During the test on the treadmill the
IntelliFoot recorded 28 strides. The gait analysing treadmill recorded for 30 seconds of
total 21 strides. By calculating the mean of the 28 strides (equation 5-1), high, low and the
confidence interval (C.I.) at 95%, it is possible to compare the results from the IntelliFoot
(Figure 5-11) to the results from the Zebris treadmill (Figure 5-12).
5-1
Figure 5-11: The average results from the IntelliFoot. The stance is 63% of the stride length and the
swing is 37% of the stride.
7 http://www.zebris.de/

40
Figure 5-12: The average results from the 30 second gait analysis on the Zebris treadmill. The stance is
64% of the stride and the swing is 36% of the stride. Image is from Zebris gait analyser report (see
Appendix E)
The main data comparison results from the IntelliFoot and the Zebris gait analyser can be
seen in Table 5-3.
Table 5-3: Comparison of the Zebris gait analysis and IntelliFoot analysis.
IntelliFoot Zebris
Average Stride length 1.080 s 1.16+/-0,39 s
Average Stance length 680 ms (63%) 742 ms (64%)
Average Swing length 400 ms (37%) 420 ms (36%)
Max force in heel-load 1.265 N 929 N
Max force in toe-load 920 N 917 N
The IntelliFoot data from the treadmill can be seen in Appendix E and the datasheet from
the treadmill Zebris can be seen in Appendix F.
Walking on flat surface test
The following setup was used during the test:
Amputee weight was 107 kg
Patient is right leg amputee
LP Variflex was used
o CAT 5
o Size 26
The gait analyser used was battery powered IntelliFoot

41
The amputee walked 107 steps on flat surface without any obstacles except for making two
U-turns. The IntelliFoot was connected wirelessly to an Android device via BLE. The data
from both Hall effect sensors were successfully logged to the IntelliFoot memory. One
Hall effect sensor (Sensor 1) was logged into the Android device.
The data were downloaded from the memory through UART, and the data run through
Equation 4-2 to get the results in newtons. The data from sensor 1 can be seen in Figure
5-13.
Figure 5-13: Mean value of 107 steps with 95% C.I and max/min values.
After extracting all of the data from the IntelliFoot memory, it was possible to create a
graph that has the same basic information as the report from the Zebris gait analyser.
Figure 5-14 shows the data results from the IntelliFoot "walking on flat surface test". This
graph can be compared to the 30 second test on the Zebris treadmill in Figure 5-12. These
comparisons are not to compare the data itself, rather the report setup.
Figure 5-14: Mean data from both IntelliFoot sensors. This test was done on flat surface with a total of
107 steps.
The data from the "walking on flat surface" test can be found in Appendix G.

43
6 Discussion
The idea behind the IntelliFoot is without a doubt a useful idea, and will make a change for
both the CPO's and the amputees using it. It is the considerably tougher than expected, to
achieve the goals needed to make the IntelliFoot as robust as it should be. There are many
aspects that influence the outcome of the IntelliFoot, thus making it hard to create a
generalized product that fits all types and variances of prosthesis.
6.1 The IntelliFoot
6.1.1 Sensors
By using Hall effect sensors instead of the resistor based Flexpoint sensors is a good idea
and eliminates lot of problems, such as hysteresis and different characteristics if
temperature changes. The Hall effect sensors are well known in many industrial
applications because of their characteristics and robustness. The sensors proved to be
reliable and linear as expected.
6.1.2 Sensor casing and prosthesis carbon fibre
Though the Hall effect sensors are linear by themselves, there are other aspects that make
the measurements nonlinear. How the prosthesis is built makes the bending of the carbon
fibre nonlinear under load. Even the same type of prosthesis has different linearity between
categories and sizes. The sensor casing can be implemented in countless ways. Though the
approach of the sensor casing used in this project is quite neat, it has it flaws regarding the
linearity. The carbon fibre blades are curved when the prosthesis is in neutral position i.e.
no load is applied on the foot. When load is applied, the sensor and magnet move closer or
more apart from each other, but not linearly. This makes an extra variable to the
nonlinearity on top of the prosthesis itself. There are countless ways to implement the
casing and its location on the carbon fibre. It should be possible to make the casing
dynamic, mechanically speaking, so the distance between the sensor and the magnet
changes in relation to the applied load.
6.1.3 Electronics related to the sensors
How the signal from the sensors are handled before they enter the microcontroller for
further manipulation is a trivial concern. It was not in the scope of this project in the
beginning to interfere with the electronics to an extent. It was inevitable though, and it was
a challenging experience.
The signal has to be amplified correctly for desired digital range in the microcontroller.
The difference in curvature, of the carbon fibre under the sensor casing, in conjunction to
the sensitivity of the sensors, makes it difficult to have a general amplification for the
sensors. The solution could be e.g.:

44
Have a variable resistor for fine tuning under controlled load and settings of the
prosthesis that the sensor is to be mounted on
Have the analogue range narrower so it will always be in the scope of the digital
range. The drawback would be less resolution in data acquired
Possibly a digital solution from a third party can solve this problem8
The question is whether to have a general solution or a solution that either has to be
configured specifically for each and one prosthetic foot or a solution that decreases the
resolution of the signal.
6.1.4 Firmware
The firmware development included in this thesis is divided into four parts:
1. Stance detection
2. Swing detection
3. Write data to memory
4. Send data via Bluetooth
Stance detection
The stance detection algorithm worked well during the tests. It detected stance every time
the amputee took normal steps and it did not detect stance if the amputee tried deliberately
to create bad stance by tapping down the toe or heel. During the second test, while the user
walked 107 steps, he took two U-turns. During these turns the algorithm detected the
stances. They are definitely different than the rest but should, however, be recorded (See
Appendix A).
There are some considerations regarding how the data is manipulated. In every stance there
is a beginning and end, heel-strike and toe-off. Due to how the algorithm detects whether
the amputee is in heel-strike or toe-off depends on two things; the location of the data
points relatively to the zero value and the inclination (rising or falling) of the curve. When
the algorithm has detected e.g. the heel-strike, and starts to record the stance, it is a little bit
late to get the beginning of the stance. The first data point stored in memory is one to two
data points late (5 ms to 10 ms).Therefore every stance written into memory has both the
first data point and the last datapoint manually fixed to zero. This has no affect on how the
rest of the data is in the stance.
By manipulating the first and last point in the stance phase is probably not considered good
practise but it has no significance in relation to the data retention. On the contrary, every
normalized curve will have the same beginning and end value (0) making the plots more
visually appealing.
8 This is a thought that has no confirmation.

45
Swing detection
The swing algorithm worked properly in the tests and only more testing will show if it
needs any tweaking. There are few variables that control the swing algorithm, making it
relatively easy to work with.
Converting the data to newtons
The process of converting digital values to newtons is a matter of simple multiplication.
However, the nonlinearity of the signal from the Hall effect sensors, caused by mechanical
design, makes it necessary to correct it by using fourth degree polynomial. This is not an
efficient way as the polynomial equation will be different for each sensor installed.
Memory writing
The memory writing algorithm is designed to reduce the memory required for the data
acquired. Even though the solution provided does reduce the memory requirements,
compared writing the actual data to the memory, it does have drawbacks. The algorithm
technique maps the data value to its concurrent memory address, making the memory map
the data like a plotted graph. This leaves a lot of unused space in between the data points in
the memory.
There is also a certain flaw in the algorithm that makes the memory writing overlap (see
Appendix A). This is not exactly a problem in terms of retaining data, rather making the
software capable of reading the memory right.
The stance detection and swing algorithms both use only one sensor (sensor 1). The other
sensor (sensor 2) acts as a dummy. The second sensors data is acquired at the same time as
sensor 1. If there were to be comparison between sensor 1 and sensor 2 when e.g. heel-
strike starts, the algorithm would have to read the signal from both sensors. However, the
stance sync can be monitored as is by comparing the timing of high and low points of the
stance.
Wireless communication
The wireless communication works via Bluetooth connection. The data from only one
sensor is sent through the Bluetooth due to buffer problem. In Figure 4-15 the Bluetooth
communication is described. It has not been implemented yet in the firmware, to check if
the BLE_TX buffer is empty. Therefore if too much data is sent, the system halts.
6.2 Future work
The development of the IntelliFoot is on its way to final product, but it needs additional
work and rethinking in many aspects. The next steps to achieve a better prototype are
mechanical, electrical and software based.
Mechanical
The mechanical work should aim at redesigning the plastic case to make have a functional
behaviour. i.e. when the curvature of the carbon fibre takes place, the magnet and the Hall
effect sensor should move away and towards each other linearly with respect to applied

46
load. The case design as it is, has probably be thought as if the movement should be with
respect to the curvature of the carbon fibre, but that movement itself is nonlinear with
respect to the applied load.
Electrical
The electrical work should be aimed at developing a single PCB that includes all of the
necessary components for the IntelliFoot. The emphasis in this design would be on the op-
amp circuit to make the amplification correct. The best option would be to have the
electrical circuit general for all designs, i.e. no need for adjusting anything for each and
every IntelliFoot.
Software
The algorithms can surely be tweaked in many ways, but the emphasis should lay in the
memory writing. The memory writing algorithm is a working concept as is, but can be
enhanced dramatically i.e. by using the space in between the stance data.
In regards to statistical data of the time each stride is taking, it should be carefully
considered in future firmware development of the IntelliFoot. Keeping more information
does require more memory, but could be beneficial in the long run.
If the mechanical and electrical designs are carefully done, with respect to linearity of the
data/applied load, it is possible to fine tune the IntelliFoot within the software.

47
7 Conclusions
The IntelliFoot prototype is capable of recognizing a stride successfully and log the
statistics into embedded memory. It can either keep cumulative data in the memory, or
send the statistics in real-time through Bluetooth connection.
The data from the IntelliFoot can be used for gait analysis and gait statistics, thus making it
possible to create an activity report.
The results of the development is a working prototype of the IntelliFoot. The prototype
needs further enhancement to be considered as a final product.


49
8 Abbreviations
ADC Analogue to Digital
Converter
AK Above knee
BK Below knee
BLE Bluetooth Low Energy
C.I. Confidence Interval
CAT Category
CPO Certified Prosthetics &
Orthotics
CPU Central Processing Unit
DAC Digital to Analogue
Converter
DSP Digital Signal Processing
FIFO First in First Out
GPIO General Purpose
Input/Output
I/O In/Out
IDE Integrated Development
Environment
ISO International Organization
for Standardization
LP Low Profile
MCU Microcontroller Unit
N newton
Op-amp Operational Amplifier
PCB Printed Circuit Board

50
R&D Research and
development
RAM Random Access Memory
ROM Read Only Memory
SMD Surface Mount Device
SoC System On a Chip
THD Through Hole Device
UART Universal Asynchronous
Receiver/Transmitter
USB Universal Serial Bus
UUID Universally Unique
Identifier
V Volt

51
9 Bibliography
[1] K. Ziegler-Graham, E. J. MacKenzie, P. L. Ephraim, T. G. Travison and R.
Brookmeyer, “Estimating the Orevalence of Limb Loss in the United States: 2005 to
2050,” March 2008.
[2] Össur Inc., “Company background,” 2014. [Online]. Available:
http://www.ossur.com/?PageID=12569. [Accessed 24 April 2014].
[3] C. Kirtley, Clinical Gait Analysis: Theory and Practise, Elsevier inc., 2006.
[4] S. Cuccurullo, Physical Medicine and Rehabilitation Board Review, New York:
Demos Medical Publishing, 2010.
[5] L. Ikelaar, “Development and evaluation of an ambulant,” Reykjavík, 2009.
[6] E. Ramsden, Hall-Effect Sensors: Theory and application, Burlington: Elsevier
Science, 2011.
[7] M. Kaufmann, Modeling Embedded Systems and SoC's, San Francisco: Elsevier
Science, 2004.
[8] Cypress Semiconductor Corp., FM25V10: 1Mb Serial 3V F-RAM Memory -
Datasheet, Cypress Semiconductor Corp., 2013.
[9] P. Thanigai, “Embedded: Cracking the code to systems development,” UBM Tech, 19
july 2012. [Online]. Available: http://www.embedded.com/design/mcus-processors-
and-socs/4390688/1/FRAMs-as-alternatives-to-flash-memory-in-embedded-designs.
[Accessed 21 april 2014].
[10] Texas Instruments Inc., MSP430F22x2 Mixed Signal Controller, Dallas: Texas
Instruments Inc., 2012.
[11] Össur Inc., “LP Vari-Flex,” Össur Inc., 2014. [Online]. Available:
http://www.ossur.com/prosthetic-solutions/products/feet/feet/lp-vari-flex. [Accessed
27 april 2014].
[12] Arinbjörn.
[13] S. B. Sverrisson, “What is the maximum input voltage for the adc,” Nordic
Semiconductor, 14 June 2013. [Online]. Available:
https://devzone.nordicsemi.com/index.php/what-is-the-maximum-input-voltage-for-

52
the-adc. [Accessed 29 May 2014].
[14] K. Zhang, RHEO Expansion - Datasheet, Reykjavík: Össur hf, 2012.
[15] I. Analog Devices, Preliminary Technical Data - AD8226, Analog Devices Inc., 2008.
[16] G. Stringham, Hardware/Firmware Interface Design - Best Practises For Improving
Embedded Systems Development, Burlington: Elsevier Inc., 2010.
[17] Nordic Semiconductor Inc., Creating Bluetooth Low Energy Applications Using
nRF51822, Trondheim: Nordic Semiconductor Inc., 2013.
[18] C. S. Solanki, Solar Photovoltaics: Fundamental Technologies And Applications,
Delhi: Asoke K. Ghosh, PHI Learning Private Limited, 2009.

53
Appendix A - Data Alignment in Memory
Figure 9-1: 107 stance phases successfully recorded into memory. The two steps that are clearly off the
standard are when the amputee was turning around while walking. Memory addresses 3, 5 and 6 hold
data to calculate time, as each datapoint represent 5 ms. Address 3 is for total points in stance, address
5 is for total points in swing and address 6 is showing total swings recorded. The memory mapping is
out of sync to have the data properly lined up.

54
Figure 9-2: Here the data can be seen as they should appear.

55
Appendix B - Preliminary Gait Analysis Results
Here are more results from preliminary gait analysis conducted before this thesis. These
graphs show different curves from the Hall effect sensors depending on category and
wedges used. The title of each graph can be seen in Table 9-1.
Table 9-1: Data filename explanation
XXTxxRxxAxxCPxxSxxCAxxWxxDddmmyy.txt XX Sensor type HS=Hall Sensor XS=Xsens
Test Number of the test
Run Number of run
Amputee Number of the user
CPO Number of the CPO
Size Size of the foot CAT Stiffness category
Wedge 00=none 01=Yellow 02=Red 03=Blue
Date Date the test was run
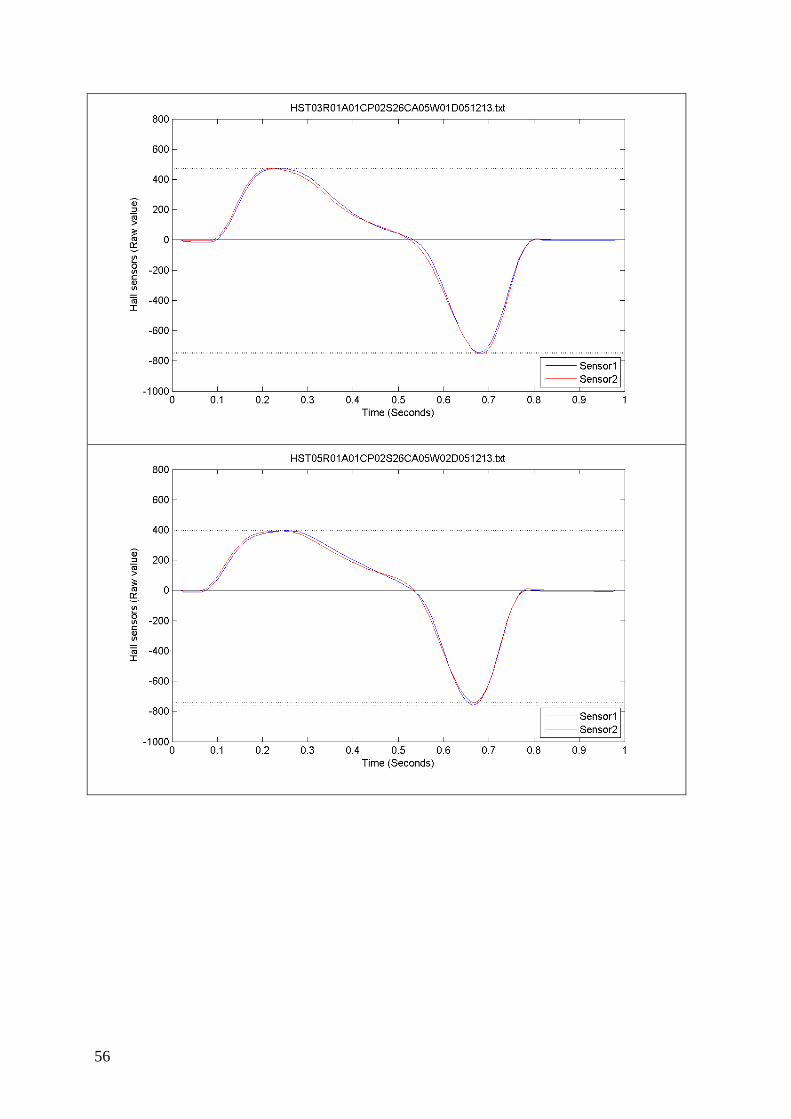
56

57

58

59

60
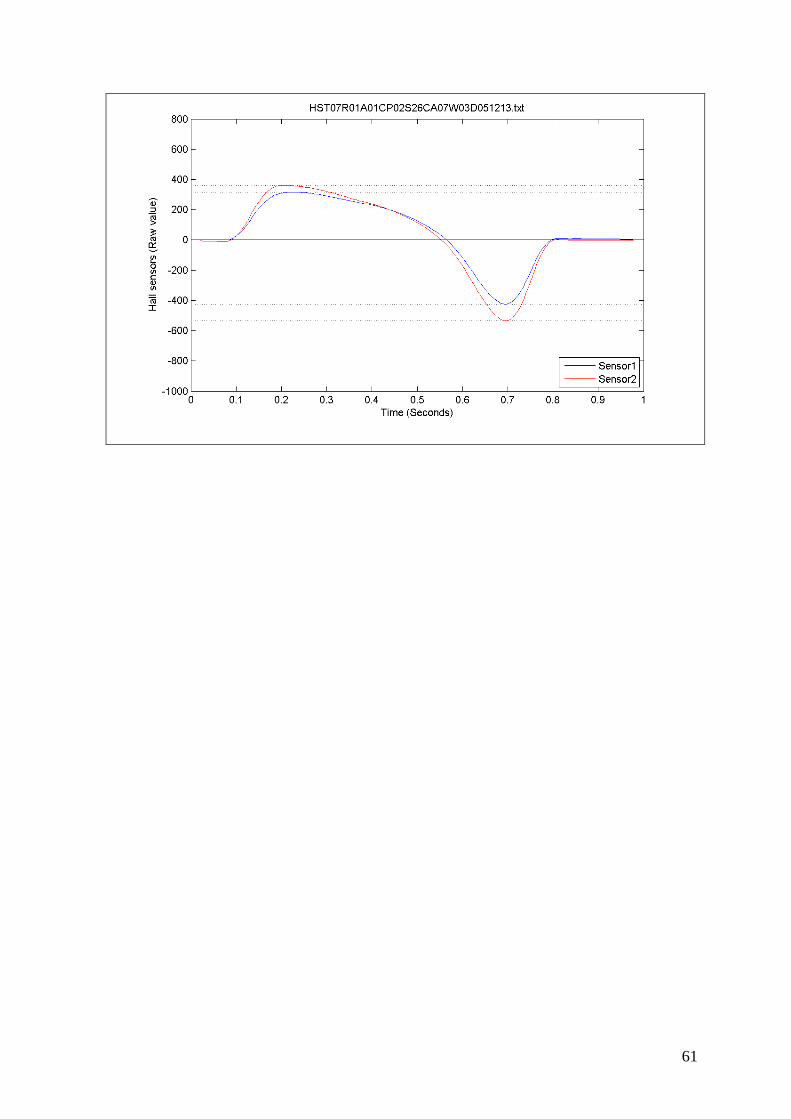
61

62
Appendix C - FM25V10 F-RAM Specifications
FM25V10
1Mb Serial 3V F-RAM Memory
Features
1M bit Ferroelectric Nonvolatile RAM
Organized as 131,072 x 8 bits
High Endurance 100 Trillion (1014)
Read/Writes
10 Year Data Retention
NoDelay™ Writes
Advanced High-Reliability
Ferroelectric Process
Device ID and Serial Number
Device ID reads out Manufacturer ID & Part ID
Unique Serial Number (FM25VN10)
Very Fast Serial Peripheral Interface - SPI
Up to 40 MHz Frequency
Direct Hardware Replacement for
Serial Flash
SPI Mode 0 & 3 (CPOL, CPHA=0,0
& 1,1)
Low Voltage, Low Power
Low Voltage Operation 2.0 V – 3.6 V
90 A Standby Current (typ.)
5 A Sleep Mode Current (typ.)
Write Protection Scheme
Hardware Protection
Software Protection
Industry Standard Configurations
Industrial Temperature -40 C to +85 C
8-pin “Green”/RoHS SOIC Package

63
Appendix D - LP Vari-Flex Specifications
LP VARI-FleX® with evo™
The LP Vari-Flex with EVO is designed for users
with long residual limbs that do not have enough
clearance for the Vari-Flex with EVO. The new EVO feature enables users to experience
natural gait progression by utilizing the foot plate
to its fullest potential. A more natural gait reduces
fatigue and puts less strain on the lower back and
sound side
User information
Amputation level: Transfemoral and Transtibial
Impact Level: Low to High
Maximum Patient Weight: 166kg (365lbs)
Foot information
Categories: Size 22-24; Cat. 1-5 / Size 25-30; Cat. 1-9
Size: 22-30
Weight of Foot: (Size 27) 540g (19oz) w/ Pyramid and Foot Cover
Build Height: (Size 27) 68mm (2 11/16") w/ Pyramid and Foot Cover
Heel Height: 10mm (3/8")
Adapter Options: Male Pyramid or Lamination Adapter
Category Selection Chart
Weight kg 45-52 53-59 60-68 69-77 78-88 89-100 101-116 117-130 131-147 148-166
Weight lbs 99-115 116-130 131-150 151-170 171-194 195-221 222-256 257-287 288-324 325-365
Low Impact Level 1 1 2 3 4 5 6 7 8 9
Moderate Impact Level 1 2 3 4 5 6 7 8 9 N/A
High Impact Level 2 3 4 5 6 7 8 9 N/A N/A

64
Appendix E - IntelliFoot Data from Test 1

65

66
Appendix F - Zebris Gait Report

67

68

69

70
Appendix G - IntelliFoot Data from Test 2

71

72

73