intelligent investing - …communications.canaccordgenuity.com/legacy/documents/en-gb... · to us...
TRANSCRIPT

To us there are no foreign markets.TM
The information provided in Intelligent Investing is not tailored advice – it has no regard for the specific investment objectives, financial situation or needs of any specific person.
Investment involves risk. The value of investments and the income from them can go up as well as down and you may not get back the amount originally invested.
This is a marketing communication under FCA rules. For important information please see the full disclosures.
Intelligent Investing | April 2016
Intelligent Investing
ContentsMarket Review 1
EquitiesLloyds Banking Group 2RELX 2
Equity Screens UK 3 US 4
US EquitiesJohnson & Johnson 5
Investment TrustsScottish Mortgage 5
Profit Takers 6
In the main, we continue to view the potential impact of Brexit on larger FTSE 100 companies as relatively muted, as their underlying exposure to UK earnings is not especially sizable. However, it may be different for smaller UK companies, as we hear anecdotal evidence of corporate spending delays, although we have yet to see many announcements of weaker than expected orders.
Our underlying investment thesis remains that global growth will continue to be anaemic and consequently interest rates worldwide will stay lower for longer. Despite all the recent volatility, nothing has happened during the first three months of the year to change this view - and we continue to look for good investment opportunities which we believe are well suited to current market conditions.
On review in this issue, Lloyds Bank is well-poised to become a ‘normal’ bank after years of clean-up; while RELX (formerly Reed Elsevier) has a business model that chimes with a lower global growth environment. In the US, Johnson & Johnson has an impressive long-term track record and continues to deliver steady growth with a strong new drug pipeline. Finally, we take a look at Scottish Mortgage Investment Trust, which has a commendable track record of identifying attractive growth companies and delivering returns ahead of global equity benchmarks which currently stands at a discount to its net asset value.
Markets have had a wild ride so far in 2016 – it would be nice to hope that the next three months may be calmer!
Richard Champion Deputy Chief Investment Officer, UK
Market Review
After the roller coaster ride of January and February, March has been relatively sedate by comparison as worldwide financial stress began to abate:
• emerging markets have done better, both in equities and in fixed income
• the difference narrowed between the highest and lowest quality bond yields
• commodity prices have rallied, with oil around US$40 per barrel at the time of writing, compared with a late January low of around US$30
• the gold spot price has stopped its rapid rise
• sectorally, financial, mining and energy shares have rallied sharply
• in aggregate at the time of writing, equities had risen by a few percent – and in most markets are now close to, or even above, their end 2015 levels.
This calmer period was underpinned by the European Central Bank who cut interest rates still further into negative territory, increased their quantitative easing programme to €80bn per month from €60bn and provided structured lending incentives to the eurozone banking system.
The uncertainty surrounding Brexit continues to influence sterling negatively – and after a rally early in March, the sell-off resumed. Against the US dollar, the pound is at levels not seen since 1985, though this weakness has flattered returns from overseas markets; for instance, in dollars the S&P 500 Index is barely changed, but up by more than 3% in sterling year to date.
Published: 04 April 2016

Scientific, Technical &
Medical+2%
Risk &Business Analytics
+7%
Legal+1%
Exhibitions+5%
Divisional revenue growth FY 2015
Lloyds Banking Group
Share price: 68p
Market cap: £48.4bn
RELX
Share Price 1,294p
Market Cap £14.2bn
2014A 2015F 2016F
Price Earnings Ratio 11.0 9.1 9.0
Earnings per Share (p) 7.2 7.5 7.6
Dividend per Share (p) 2.3 4.3 5.0
Dividend Yield 2.9% 6.3% 7.4%
Bad Debt Ratio 0.1% 0.3% 0.2%
Return on Equity 11.0% 11.0% 10.7%
Loans & advances (£bn) 466
2015A 2016F 2017F
Revenue (£m) 3,159 3,427 3,515
Earnings per Share (p) 62.6 68.0 72.0
Dividend per Share (p) 29.7 31.0 34.0
Dividend Yield 2.7% 2.4% 2.6%
Free Cash Flow Yield 4.3% 4.9% 5.2%
Price Earnings Ratio 17.9 19.0 18.0
Return on Capital Employed 17.0% 17.8% 17.6%
Source: Quest®
Intelligent Investing | April 2016 2
EquitiesA bank we believe in
Lloyds Banking Group has come a long way since the depths of the financial crisis and is now a UK focused retail and commercial bank. In fact it is the UK’s largest retail bank, offering services through a number of well-known brands such as Lloyds Bank, Halifax, Bank of Scotland and Scottish Widows. As part of its restructuring, Lloyds has disposed of over £180bn of non-core assets, reduced its loan to deposit ratio and, significantly, improved its funding position by lessening its reliance on wholesale funding.
In February Lloyds reported its full year results for 2015 which underlined the strength of the business, with a 10% increase in underlying profits to £8.1bn. This was topped with a threefold increase in the ordinary dividend for the year to 2.25p with a further one-off special dividend of 0.5p. As ever, the elephant in the room was the PPI provisions which were £4bn in 2015 and total £16bn since Lloyds began providing for them. This meant that on a statutory basis (i.e. including the recently disposed TSB business and the PPI provisions) profit before tax fell 7% to £1.6bn. Nevertheless following the recent consultation paper from the Financial Conduct Authority
Keep calm and RELaX
Founded in the late 19th century, RELX Group (formerly Reed Elsevier) is a leading provider of professional information solutions in the science, medical, risk, legal and business sectors. Their science and technology business is the largest academic journal publisher in the world and their business segment is a prominent provider of both scientific and medical information and solutions. Impressively, they rank in the top two globally across all of their markets.
In 2009, the culmination of a slump in advertising, failing to sell its business information unit, having too much debt on the balance sheet and being forced into an emergency equity raise resulted in the previous CEO resigning after just nine months. Taking over in November 2009, Erik Engstrom set about rationalising the business and refocusing towards more attractive markets. Structurally challenged lower growth businesses have been exited, while they have made selective acquisitions in higher growth markets. As a result, only 15% of revenue now comes from print, compared to 64% in 2000 and digital revenues have markedly increased from 22% to 70% over the period. This trend is likely to continue.
(FCA) calling for a time bar on complaints, Lloyds believes this should be the last time that it has to provide for PPI.
With its broad product offering and multi-channel distribution approach, we consider that Lloyds is well placed for the future. In the shorter term its cost leadership position means that it can cope with the current prolonged period of low interest rates. Over the longer term its fortunes are tied to the performance of the UK economy. The shares remain attractive compared to the UK market, trading on a 12-month forward P/E 9.1x (the UK market is on 17.0x) and a 12-month forward dividend yield of 6.6% versus the market on 4.0%.
Marc Pullen Senior Equity Analyst
Importantly, most of their businesses have significant barriers to entry given that their relationships with data suppliers have been built up over decades and are difficult to replicate. The company’s significant brand portfolio also gives it a competitive advantage and more predictable revenues.
In 2015, RELX continued its stellar track record with its fifth consecutive year of 3% organic revenue growth. Over the same period EPS growth has averaged 8% per annum. With 54% of revenues coming from North America they are also well exposed to the US economy which is growing at 2.0% compared to just 1.5% for the Eurozone. For these reasons, we believe the shares look attractive on 18.8x 12-month forward earnings, despite trading at a 17% premium to the UK media sector. RELX also offer a dividend yield of 2.5% but it is worth noting that over the last four years £1.95bn (c.14% of market capitalisation) of shares have been repurchased with a further £700m expected in 2016. This should, in effect, increase future distributions to shareholders well in excess of the 2.5% yield.
Simon McGarry Senior Equity Analyst
Source: Quest®
Source: RELX Group Results 2015

Past performance and future forecasts figures are not a reliable indicator of future results.
Intelligent Investing | April 2016 3
UK Equity ScreenThe Quest for Growth
Quality growth stocks are proving increasingly elusive to find in the current economic climate as growth, earnings expectations and cash flow returns remain under pressure. Recently, fearing deflation, the European Central Bank has undertaken a new package of measures to encourage lending to both companies and households, aiming to bolster demand and drive growth within the Eurozone.
So in a bid to find UK companies which are still delivering growth, we have developed a screen that searches for stocks that have a proven ability to grow sales, invested capital and profitability over the last three years and are expected, by consensus analyst estimates, to continue to do so in each of the next two years.
To ensure that this growth has not come at the expense of quality and balance sheet strength we have only selected those stocks that rank in the top half of Canaccord Genuity’s Quest® UK universe (700+ companies) using Quest®’s proprietary measure of risk. This screen produces a list of 19 stocks which you can see below.
Search Criteria
1. Market capitalisation greater than £400m
2. 3-year historical average sales growth greater than 4%
3. 3-year historical average invested capital growth higher than 4%
4. 3-year historical average Earning Per Share (EPS) growth greater than 10%
5. Consensus analyst expectations are for both current year and next year’s sales growth to exceed 4%
6. Consensus analyst expectations are for both current year and next year’s EPS growth to exceed 10%
12-month forward Sales Growth EPS Growth
Company name Industry
Market cap
(£m) P/EDividend
yield3 year
averageCurrent
YearNext Year
3 year average Invested
capital growth3 year
averageCurrent
YearNext Year
Risk 1=highest risk
100=lowest risk
ARM HoldingsSemiconductors and Semiconductor Equipment
14,281 33.3 1.0% 19% 16% 11% 13% 27% 15% 20% 84
DCCIndustrial Conglomerates
5,445 21.9 1.7% 6% 8% 6% 11% 16% 26% 12% 83
MerlinHotels Restaurants and Leisure
4,699 21.6 1.7% 6% 10% 10% 6% 18% 18% 15% 72
AshteadTrading Companies and Distributors
4,333 9.6 2.4% 22% 24% 12% 19% 51% 28% 13% 73
Provident Financial
Consumer Finance 4,271 16.3 4.6% 8% 10% 10% 11% 17% 12% 11% 89
NMC HealthHealthcare Providers and Services
1,963 18.0 1.0% 26% 33% 15% 30% 13% 73% 27% 53
Redrow Household Durables 1,491 7.1 3.0% 34% 14% 13% 18% 66% 14% 14% 77
Crest Nicholson Household Durables 1,427 8.7 5.4% 25% 23% 11% 15% 25% 23% 15% 82
CRH Household Durables 1,252 8.1 5.2% 31% 12% 11% 11% 50% 20% 15% 60
Ted BakerTextiles Apparel and Luxury Goods
1,197 23.2 2.1% 22% 14% 13% 24% 21% 13% 19% 66
ZooplaInternet Software and Services
1,045 21.2 2.0% 44% 58% 13% 37% 73% 37% 22% 85
Paragon GroupThrifts and Mortgage Finance
914 7.5 4.3% 7% 27% 10% 6% 15% 14% 10% 94
Breedon Aggregates
Construction Materials
807 22.2 0.4% 22% 55% 38% 20% 41% 12% 28% 57
Fevertree Drinks Beverages 764 44.1 0.6% 54% 35% 15% 110% 66% 25% 13% 57
888 HoldingsHotels Restaurants and Leisure
758 19.4 4.3% 11% 10% 7% 7% 15% 24% 12% 74
Clinigen Group Plc
Life Sciences Tools and Services
677 15.6 0.7% 31% 95% 15% 85% 22% 31% 24% 78
boohoo.comInternet and Catalog Retail
503 31.8 0.0% 69% 37% 25% 266% 236% 30% 29% 94
CVSHealthcare Providers and Services
461 23.2 0.5% 15% 27% 10% 11% 17% 20% 19% 70
Sanne Grp Capital Markets 427 24.0 2.3% 38% 29% 19% 50% 46% 51% 17% 84
Source: Quest®

Past performance and future forecast figures are not a reliable indicator of future results. The figures above are shown in US$. These returns may differ significantly when converted to other currencies at the prevailing exchange rates.
12 month forward 10 year averagePerformance over
previous
Company name Industry name
Market cap
(US$m) P/E PEG
Divi-dend yield
EPS Growth
Return on Cap.
Emp.
Return on Cap.
EmpEPS
Growth 3 months 12 months
Microsoft Software 436,831 18.5 1.4 2.7% 13% 143% 150% 6% -1% 36%
Johnson & Johnson Pharmaceuticals 298,452 16.4 1.3 2.9% 13% 41% 36% 5% 5% 8%
Altria Tobacco 122,817 20.1 1.9 3.9% 10% 65% 77% 9% 8% 25%
UnitedHealthHealthcare Providers and Services
122,542 16.2 0.9 1.5% 17% 24% 28% 10% 10% 9%
McDonaldsHotels Restaurants and Leisure
113,314 22.6 1.9 2.9% 12% 33% 30% 9% 6% 29%
NikeTextiles Apparel and Luxury Goods
104,553 25.5 1.8 1.2% 14% 67% 47% 13% -2% 23%
United Technologies Aerospace and Defense 83,757 15.1 1.1 2.8% 14% 20% 25% 5% 4% -15%
Priceline GroupInternet and Catalog Retail
63,954 19.2 1.1 0.0% 18% 31% 127% 27% 1% 11%
Express ScriptsHealthcare Providers and Services
43,467 10.9 1.5 0.0% 8% 23% 30% 23% -21% -21%
Auto Data Processing IT Services 41,038 25.1 1.9 2.3% 13% 82% 49% 7% 6% 5%
Monsanto Chemicals 38,629 15.2 1.9 2.5% 8% 27% 27% 18% -11% -22%
Raytheon Co Aerospace and Defense 36,666 16.9 1.6 2.4% 10% 25% 27% 12% -2% 12%
eBayInternet Software and Services
27,263 12.7 0.7 0.0% 18% 39% 22% 17% -13% 10%
Cardinal HealthHealthcare Providers and Services
26,989 14.2 0.9 1.9% 15% 41% 25% 7% -8% -9%
Hershey Food Products 19,939 20.8 1.2 2.7% 18% 47% 45% 5% 3% -9%
Lam ResearchSemiconductors and Semiconductor Equipment
13,125 12.2 0.8 1.4% 15% 38% 38% 9% 4% 18%
Alaska Air Group Airlines 10,230 10.7 1.1 1.3% 10% 80% 33% 22% 2% 24%
Seagate TechnologyTechnology Hardware Storage and Peripherals
10,212 9.8 0.5 7.0% 19% 25% 36% 10% -6% -34%
Intelligent Investing | April 2016 4
Growth at a reasonable price
Following a long period of underperformance, Value investing (as we highlighted in last month’s US screen) has been the pre-eminent investment style since the turn of the year. However, with the S&P 500 (at the time of writing) just marginally above the level it was at the start of the year, the market is hardly cheap. The 580 companies that make up the US large capitalisation universe on Quest® are trading on an average 12-month forward P/E multiple of 18.0x which, in turn, is more than four times the earnings growth expected over the next 12 months i.e. a PEG (price earnings ratio divided by EPS growth) of 4.4x.
Therefore, we believe that investors would be wise to look for valuations that are supported by value creation (Return on Capital Employed or ROCE) and earnings growth.
To that end we have screened the large capitalisation North American universe looking for companies with a history of above market average ROCE which is set to continue over the next 12 months. In addition, they have a 10-year track record of above market average earnings per share growth – which is also forecast to continue over the next 12 months. In terms of valuation we have only included those companies on a 12-month PEG of 2 or less, significantly below the 4.4x universe average.
The 18 companies that make our list have averaged a ROCE of 47% over the last 10 years, with the same level forecast over the
US Equity Screen
Search Criteria1. Market capitalisation greater than US$10 billion
2. 10-year average ROCE greater than 20%
3. 12-month forward ROCE greater than 20%
4. 10-year average EPS growth greater than 4%
5. 12-month forward EPS growth greater than 4%
6. 12-month forward PEG less than 2x
Source: Quest®
next 12 months; while earnings per share have grown by 12% pa over the last 10 years, with 14% growth forecast for the next 12 months. In terms of valuation our group are, on average, trading on 16.8x 12-month forward earnings, which is 7% below the US market average of 18x. When growth is taken into account, our group of companies look even more attractive on a 12-month forward PEG of 1.3x versus the US market on 4.4x.
Johnson & Johnson (that features as a separate article in this publication) makes the screen along with other household names such as McDonalds, Microsoft and Nike.

Investment Trusts
US Equities
the financial crisis. As at the 31 March 2016 the Trust traded at a 0.4% discount to asset value - an unusual discount compared to the average premium in recent times - following a challenging start to the year and a general widening of discounts throughout the sector. The Trust has a below average 0.3% annual management charge.
In our view this is an intelligently run investment trust with a preference for investing in higher growth stocks coupled with an element of long-term gearing (12%). The use of gearing can result in share prices being more volatile and subject to sudden or large falls in value. Despite the inherent volatility of some of the Trust’s underlying assets, we believe that it is very well placed to continue its stellar track record of delivering healthy long-term shareholder returns.
Alex WhitingInvestment Director
Picking stocks with Scottish precision
Established in 1909, Scottish Mortgage is a globally orientated investment trust with an objective of maximising total return through an emphasis on capital growth.
The Trust is large with a market capitalisation of £3.5bn, holding 70 investments. The top 10 holdings represent a concentrated 50.7% of total assets and there is a strong weighting to technology with the largest holdings including such companies as Amazon, Baidu, Tencent, Facebook, Alphabet and Alibaba. The Trust also has c.10% of its value in unlisted investments in businesses that have gone through several rounds of funding.
The lead co-manager, James Anderson, is focussed on investments benefitting from long-term thematic global change – although with some foresight has avoided investing in oil companies. The average targeted holding period for investments is five years or more. Long term returns have been excellent with net asset value appreciating 151.6% over the last 10 years to the end of February, as opposed to 90.8% from the FTSE All-World Index. However, the Trust’s growth strategy has led to marked volatility, notably during
emerging markets, including Russia and Brazil, continued to deliver double digit growth for the Consumer division.
The company has a strong balance sheet, robust drug pipeline, innovative track record (25% of current sales come from products launched within the last five years) and market leading positions in key consumer segments, such as over the counter (OTC), oral care, baby and beauty. Consequently we believe that JNJ is well placed to continue delivering the kind of growth that has seen it grow adjusted operation earnings consecutively for 32 years and increase the dividend in each of the last 53 years. Trading on a 12-month forward P/E of 16.4x and 2.9% dividend yield the shares are relatively cheap compared to the North American Healthcare Sector on 16.6x and 1.6% respectively.
Marc PullenSenior Equity Analyst
In good health
Johnson & Johnson (JNJ) is one of the world’s largest and most diversified healthcare companies and is engaged in the research, development, manufacture and sale of a broad range of products worldwide. JNJ is organised into three segments: Pharmaceutical (45% sales), Medical Devices (36% sales) and Consumer (19% sales). The company has 24 brands with sales of at least US$1bn, with 70% of its sales derived from products ranked either number one or number two in the world.
The Pharmaceutical division has an impressive track record, having launched 16 new products that have generated US$41bn of cumulative sales since 2009, with six of the products delivering over US$1bn of sales each over the last 12 months. Going forward, JNJ has ten new products in its pipeline out to 2019, each with a US$1bn sales plus potential.
In the Medical Devices division JNJ is focusing on its priority platforms and key markets. The Consumer division continues to focus on its 12 megabrands while implementing a new marketing model and improving margins by reducing both costs and complexity. During 2015 JNJ’s key
Source: Baillie Gifford & Co 29th February 2016
Revenue by division
Source: 4th Quarter 2015 Earnings Call Presentation
These figures are shown in US$.
Returns may differ significantly when converted to other currencies at the prevailing exchange rates.
PharmaUS$31.4bn
Medical DevicesUS$25.1bn
Consumer US$13.5bn
Past performance is not a reliable indicator of future returns. You should be aware that unlisted securities and overseas securities (which are exposed to currency movements) may cause the value of your investments (or your income from them) to fluctuate.
Source: Bloomberg
Intelligent Investing | April 2016 5
Scottish Mortgage Investment Trust
Market capitalisation: £3.5bnShare price: 262.5Latest NAV per share: 263.5Premium/(Discount): (0.4%)Dividend yield: 1.14%
Holdings % of Total Assets
Johnson & Johnson
Share Price US$108.2Market Cap US$298.5bn
2015A 2016F 2017F
Revenue (US$m) 70,074 71,581 74,684
Earnings per Share (US$) 5.7 6.5 6.9
Dividend per Share (US$) 3.0 3.1 3.2
Dividend Yield 3.0% 2.8% 3.0%
Free Cash Flow Yield 7.1% 5.7% 6.1%
Price Earnings Ratio 17.6 16.6 15.7
Return on Capital Employed 19.4% 19.9% 18.3%
1 Amazon.com 8.4
2 Illumina 7.4
3 Inditex 5.8
4 Baidu 5.6
5 Tencent 4.6
6 Facebook 4.6
7 Tesla Motors 4.2
8 Alphabet 4.0
9 Alibaba 3.9
10 Kering 2.3
TOTAL 50.7
Source: Quest®
Intelligent Investing | April 2016 6
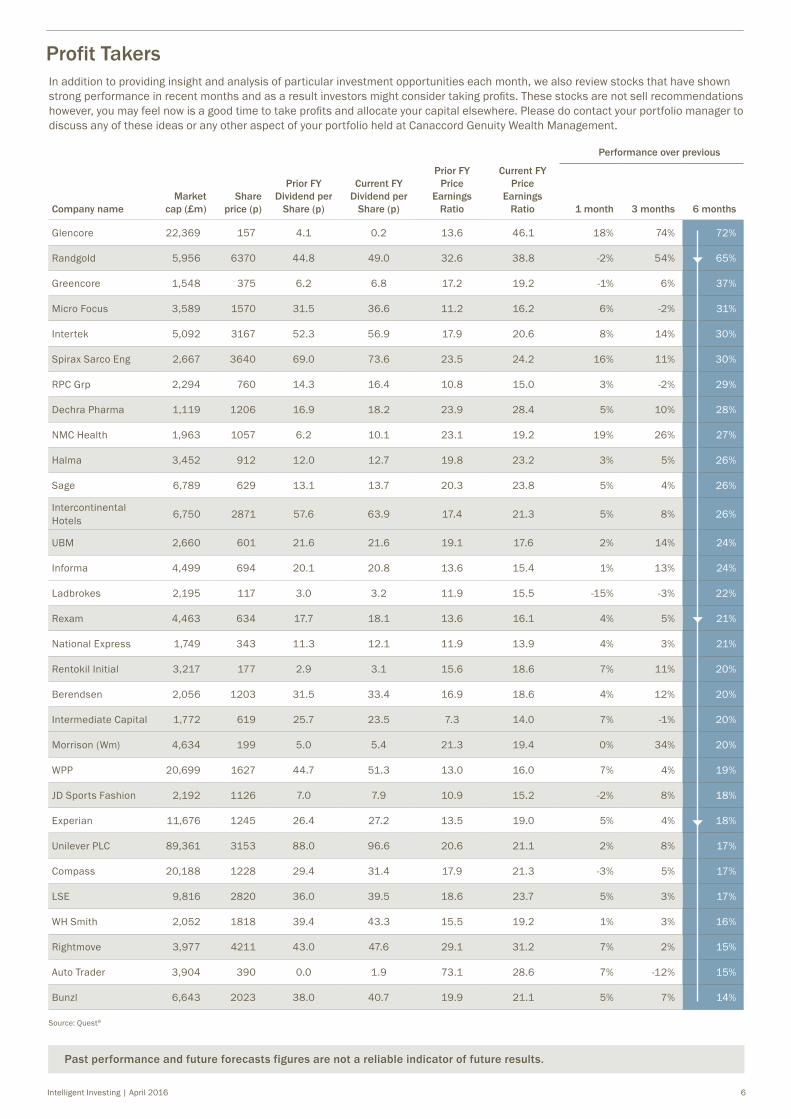
Profit TakersIn addition to providing insight and analysis of particular investment opportunities each month, we also review stocks that have shown strong performance in recent months and as a result investors might consider taking profits. These stocks are not sell recommendations however, you may feel now is a good time to take profits and allocate your capital elsewhere. Please do contact your portfolio manager to discuss any of these ideas or any other aspect of your portfolio held at Canaccord Genuity Wealth Management.
Past performance and future forecasts figures are not a reliable indicator of future results.
Performance over previous
Company nameMarket
cap (£m)Share
price (p)
Prior FY Dividend per
Share (p)
Current FY Dividend per
Share (p)
Prior FY Price
Earnings Ratio
Current FY Price
Earnings Ratio 1 month 3 months 6 months
Glencore 22,369 157 4.1 0.2 13.6 46.1 18% 74% 72%
Randgold 5,956 6370 44.8 49.0 32.6 38.8 -2% 54% 65%
Greencore 1,548 375 6.2 6.8 17.2 19.2 -1% 6% 37%
Micro Focus 3,589 1570 31.5 36.6 11.2 16.2 6% -2% 31%
Intertek 5,092 3167 52.3 56.9 17.9 20.6 8% 14% 30%
Spirax Sarco Eng 2,667 3640 69.0 73.6 23.5 24.2 16% 11% 30%
RPC Grp 2,294 760 14.3 16.4 10.8 15.0 3% -2% 29%
Dechra Pharma 1,119 1206 16.9 18.2 23.9 28.4 5% 10% 28%
NMC Health 1,963 1057 6.2 10.1 23.1 19.2 19% 26% 27%
Halma 3,452 912 12.0 12.7 19.8 23.2 3% 5% 26%
Sage 6,789 629 13.1 13.7 20.3 23.8 5% 4% 26%
Intercontinental Hotels 6,750 2871 57.6 63.9 17.4 21.3 5% 8% 26%
UBM 2,660 601 21.6 21.6 19.1 17.6 2% 14% 24%
Informa 4,499 694 20.1 20.8 13.6 15.4 1% 13% 24%
Ladbrokes 2,195 117 3.0 3.2 11.9 15.5 -15% -3% 22%
Rexam 4,463 634 17.7 18.1 13.6 16.1 4% 5% 21%
National Express 1,749 343 11.3 12.1 11.9 13.9 4% 3% 21%
Rentokil Initial 3,217 177 2.9 3.1 15.6 18.6 7% 11% 20%
Berendsen 2,056 1203 31.5 33.4 16.9 18.6 4% 12% 20%
Intermediate Capital 1,772 619 25.7 23.5 7.3 14.0 7% -1% 20%
Morrison (Wm) 4,634 199 5.0 5.4 21.3 19.4 0% 34% 20%
WPP 20,699 1627 44.7 51.3 13.0 16.0 7% 4% 19%
JD Sports Fashion 2,192 1126 7.0 7.9 10.9 15.2 -2% 8% 18%
Experian 11,676 1245 26.4 27.2 13.5 19.0 5% 4% 18%
Unilever PLC 89,361 3153 88.0 96.6 20.6 21.1 2% 8% 17%
Compass 20,188 1228 29.4 31.4 17.9 21.3 -3% 5% 17%
LSE 9,816 2820 36.0 39.5 18.6 23.7 5% 3% 17%
WH Smith 2,052 1818 39.4 43.3 15.5 19.2 1% 3% 16%
Rightmove 3,977 4211 43.0 47.6 29.1 31.2 7% 2% 15%
Auto Trader 3,904 390 0.0 1.9 73.1 28.6 7% -12% 15%
Bunzl 6,643 2023 38.0 40.7 19.9 21.1 5% 7% 14%
Source: Quest®

The information provided is not to be treated as investment advice. It has no regard for the specific investment objectives, financial situation or needs of any specific person or entity.
The information contained herein is based on materials and sources that we believe to be reliable, however, Canaccord Genuity Wealth Management makes no representation or warranty, either expressed or implied, in relation to the accuracy, completeness or reliability of the information contained herein. All opinions and estimates included in this document are subject to change without notice and Canaccord Genuity Wealth Management is under no obligation to update the information contained herein.
Canaccord Genuity Wealth Management and/or connected persons may, from time to time, have positions in, make a market in and/or effect transactions in any investment or related investment mentioned herein and may provide financial services to the issuers of such investments. Details of these interests can be found on our website at http://www.canaccordgenuity.com/en-GB/wm/wealth-management-uk/Conflicts-Disclosure/ or if this document has been provided to you in hard copy, in the attached covering letter.
Quest® is used under licence and with permission of Canaccord Genuity Ltd. Accounts, Share Prices & Global Consensus Estimates data provided in conjunction with S&P Capital IQ © 2015; Benchmark Sector comparatives are based on the Global Industry Classification Standard (GICS®) and provided in conjunction with S&P Capital IQ © 2015 (and its affiliates, as applicable). see restrictions. Share prices are relative to the MSCI USA IMI (see restrictions) Quest® is at this stage registered in the UK and in the USA, and common law trade mark rights are asserted in other jurisdictions. CFROC, CITN and triAngle are trademarks of Canaccord Genuity Limited. Quest® is at this stage registered in the UK and in the US, and common law trade mark rights are asserted in other jurisdictions.
Canaccord Genuity Wealth Management is a trading name of Canaccord Genuity Wealth Limited (CGWL) and Canaccord Genuity Financial Planning Limited (CGFPL), both of which are authorised and regulated by the Financial Conduct Authority. Both are wholly owned subsidiaries of Canaccord Genuity Group Inc. and have their registered office at 41 Lothbury, London, EC2R 7AE. CGWL is registered in England no. 03739694, CGFPL is registered in England no. 02762351. Canaccord Genuity Wealth Management (“CGWM”) is a trading name of Canaccord Genuity Wealth (International) Limited (“CGWI”) which is licensed and regulated by the Guernsey Financial Services Commission, the Isle of Man Financial Services Authority and the Jersey Financial Services Commission and is a member of the London Stock Exchange and the Channel Islands Securities Exchange, CGWI is registered in Guernsey no. 22761 and is a wholly owned subsidiary of Canaccord Genuity Group Inc. Registered office: Trafalgar Court, Admiral Park, St. Peter Port, GY1 2JA.
Glossary
Prices are as at market close 31.03.2016
Investments discussed in this document may not be suitable for all investors. Investors should make their own investment decisions based upon their own financial objectives and resources, and if in any doubt, seek specific advice from an investment adviser.
Intelligent Investing is a marketing communication under FCA rules; it has not been prepared in accordance with the legal requirements designed to promote the independence of investment research and we are not therefore subject to any prohibition on dealing ahead of its dissemination.
Intelligent Investing | April 2016 7
Cash Flow Return on Capital (CFROC):
Cash Flow Return on Capital is an internal rate of return calculation that measures the inflation adjusted after-tax economic return that a company earns on all forms of capital, including goodwill. It is a measure of a company’s profitability and the efficiency with which it uses its capital.
Dividend Yield: Dividend per share divided by the share price, often expressed as a percentage. For historic periods the average share price for the year is used, for forecasts the current share price is used.
Earnings per Share (EPS): An indicator of a company’s profitability, it is the portion of profit after tax allocated to each outstanding share in issue.
EBITDA: Earnings before Interest, Tax, Depreciation and Amortisation: enables better comparison between companies as it is not affected by the way that the company is financed or by subjective accounting charges for depreciation and amortisation.
EBITDAR: EBITDA + rental expenses.
Enterprise Value: Market capitalisation + net debt.
Fixed Charge Cover: A measure of a company’s ability to satisfy financing expenses out of profits. It is calculated as income before net interest and operating lease payments divided by all fixed (financial) charges, i.e. interest, preference.
Free Cash Flow Yield:
Free cash flow represents the cash that a company is able to generate after laying out the money required to maintain or expand its asset base. Free cash flow yield is the annual free cash flow of the company divided by the market capitalisation of the company.
Gearing: Gearing is a measure of leverage and is calculated as net debt/shareholder equity.
Free Cash Flow Yield: Pre-tax, pre-financing cash flow relative to enterprise value (including pension liability). This is a high level measure of value often favoured by potential acquirers.
Net Debt to Capital Employed:
A measure of how much of the capital employed (resources on which the company pays a cost) is debt. Higher debt in the capital employed means higher risk of insolvency.
Price Earnings Ratio (P/E):
Share price divided by EPS. For historic periods the average share price for the year is used, for forecast years, the current share price is used. It shows how much investors are willing to pay per pound of earnings.
Price Earnings Growth (PEG):
Price earnings ratio (P/E) divided by the prospective earnings growth.
Quest®: Canaccord Genuity’s proprietary online valuation and analytical tool which combines consensus market figures with the Quest® Discounted Cash Flow (DCF) Valuation Model.
Return on Capital Employed (ROCE):
A measure of a company’s profitability and the efficiency with which it uses its capital. It is calculated as operating profit divided by capital employed.
Return on Equity (RoE): Net income (before exceptional items and goodwill amortisation) divided by book value of equity. RoE reveals how much profit a company earned in comparison to the total amount of shareholder equity found on the balance sheet.
Tables: F- Forecast results, figures based on the combined estimates of analysts covering the company. A- Actual results, company’s published results.
The glossary is not intended as a technical definition as most of these metrics can be calculated in a number of different ways.

canaccordgenuity.com
Australia
Canada
China
France
Guernsey
Ireland
Isle of Man
Jersey
Singapore
United States
United Kingdom
The company of the Canaccord Genuity group of companies through which products and services are offered may differ by location and service. See www.canaccordgenuitygroup.com/en/companies for more information.