intelligent investing’s weekly digest june 10, 2017 · 2017-07-17 · 2 | p a g e trading...
TRANSCRIPT

1 | P a g e
Executive Summary
Friday was a great example of sector rotation: tech to financials. While big names like the F A A N G T stocks were down
>5% intra-day; financials were up. As such the tech indices ended down for the day and week, while the DOW JONES ended up on both time frames and the hybrid S&P500 ended essentially flat. Please note that when big names are
ALL down at the same time by that much (e.g. AAPL and AMZN erased >1 month of gains) the market is telling us something. It is therefore prudent to listen and assess and analyses charts –and your portfolio- extra carefully. As I
said before, the closer we get to SPX2500 the more prudent it will become to start cashing in on winners. Friday showed IMHO the beginning of the end.
In last week’s update I set targets of SPX2445 and SPX2425-2415 for the S&P500, which were all reached but not necessarily in that order: SPX2425 on Wednesday, SPX2445 and SPX2415 on Friday. What a ride. Using EWT I now
expect ideally one more drop to SPX2410 before the next rally to SPX2475; one more correction to SPX2430 and then a finally rally to SPX2485-2500 to conclude all of major-3 and the largest correction of this year should then set in. Indeed we’re closer to an important top then bottom. Per OEW this advance to SPX2485-2500 will likely be qualified
as an EDT. Note the drop to SPX2410 is not necessary; over SPX2436 without making a lower low strongly suggests the low is in.
Surprisingly, several market breadth indictors ended up on Friday for the S&P500 and the SPX-SI remains on buy/long. So do most of the Technical Indicators (TIs) on the weekly charts. On the daily chart the TIs are a bit more of a mixed
bag, but price is above the 20d to 200d SMAs as well as above most uptrend lines. Hence, despite Friday’s wild action (it was a Bradley Turn date nonetheless), the charts for the S&P500 still point to higher prices. A break below SPX2405
is now needed to put the Bull-count in jeopardy. Until then we have to look up, as the charts tell us to.
2 | P a g e
Trading Performance Update with North Post Partners, LLC
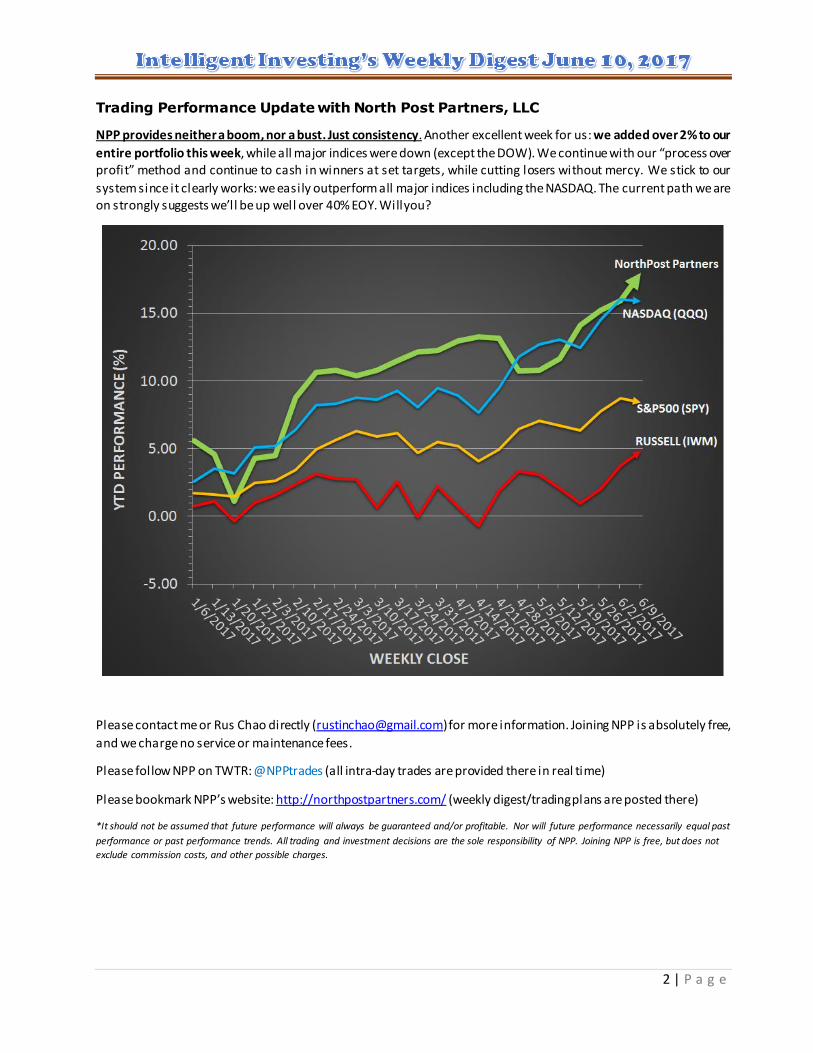
NPP provides neither a boom, nor a bust. Just consistency. Another excellent week for us: we added over 2% to our
entire portfolio this week, while all major indices were down (except the DOW). We continue with our “process over profit” method and continue to cash in winners at set targets, while cutting losers without mercy. We stick to our
system since it clearly works: we easily outperform all major indices including the NASDAQ. The current path we are on strongly suggests we’ll be up well over 40% EOY. Will you?
Please contact me or Rus Chao directly ([email protected]) for more information. Joining NPP is absolutely free,
and we charge no service or maintenance fees.
Please follow NPP on TWTR: @NPPtrades (all intra-day trades are provided there in real time)
Please bookmark NPP’s website: http://northpostpartners.com/ (weekly digest/trading plans are posted there)
*It should not be assumed that future performance will always be guaranteed and/or profitable. Nor will future performance necessarily equal past
performance or past performance trends. All trading and investment decisions are the sole responsibility of NPP. Joining NPP is free, but does not
exclude commission costs, and other possible charges.

3 | P a g e
Elliot wave updates
Last week I expected the S&P500 to “… ideally target the 1.236x extension at SPX2445 +/- 2p for micro-3. Then Micro-
4 ideally down to SPX2425-2415, which is good support, and micro-5 to SPX2455-2475 to complete all of minor 3.” Well we pretty much got all this week, and most on Friday: first a dip to SPX2425 on Wednesday, then a rally to SPX2446 on
Friday followed by the largest decline since the SPX2353 low to SPX2416 the same day. Not a shabby forecast huh!? ☺
Figure 1A and B show the Ell iot wave (EWT) and Objective Elliot Wave (OEW) counts: both work. Please note I’ve
upgraded the waves for the EWT count as I excluded the <10p decline on May 19: it can’t be quantified and by excluding it the “upgraded count” improved. This means the S&P500 is now in minute-iv not micro-4. The EWT count will have
one more correction in between the race to SPX2485-2500, whereas the OEW count sets sight on it pretty much instantly. On Thursday I presented the expanded irregular flat options and so far that has been playing out well; as the
advance off the SPX2425 low to SPX2446 high lacks a non-overlapping impulse structure: b-wave. Per OEW there were 5 quantifiable waves up off the SPX2353 low with a 1>3>5 relationship. That means minor-3 is in place.
Figure 1. SPX 1min and 60min chart, with preferred Bullish Elliot Wave and Objective Elliot Wave count, respectively.
A
B

4 | P a g e
In the case of the Elliot wave count, we had a minute-iii of minor-3 wave not reaching its full extension target (SPX2440 vs SPX2445).In that case the b-wave does the trick, which it sure did on Friday: see table 1. If we then look at how an
ideal impulse wave progresses (curtesy www.elliotwavetrader.net) it suggests minute-iv is now underway, with an ideal target of SPX2410: the 0.764x Fib-extension: see table 1, and figure below. Minor-3 should then ideally target
SPX2475 (the 1.618x extension), then minor-4 down to SPX2428 and minor-5, which will be all of Major-3 to SPX2485-2500. From there on a much larger correction will ensue. We’ll tackle it once we get there.
Table 1: Ideal wave tracker counter for minute and minor waves of intermediate-v to SPX2480-2500.
Bottom line: all though the minimum requirements for an expanded irregular flat have been met (SPX2416) on Friday, I would ideally like to see one more push down to SPX2410 +/-2p to complete all of minute-iv / minor-4. That
would fulfill the ideal wave tracker table’s Fib-target (retrace) as well as meet the OEW requirements for a confirmed minor-4. Then the market should rally again to SPX2475. A break above SPX2436 will confirm this.

5 | P a g e
Technical Market update
The S&P500 daily chart shows a third possible count: an ending diagonal triangle. It’s not my favorite, but possible.
Take it as an FYI. Wave-d of an a,b,c,d,e advance to SPX2480-2500 is in that case underway. What matters more for this chart is what the TIs are doing and where price is in relation to SMAs and trend lines. Well, the TIs are pointing
down, with a confirmed non-ideal A.I. sell signal. Also the (black) MACD-line is now pointing down, but the (orange) signal line is still pointing up. The Money Flow Index is still trending up as it is still above the red trend line it broke
above. Similarly, price is still above 20d to 200d SMA, but lost the upper black trend line. Hence, overall the daily price chart is still in reasonable good shape, but cracks are starting to appear.
Figure 2. SPX daily chart. Price still above 20d to 200d SMAs and red trend line. A.I. sell signal, MACD and RSI5 weak.
6 | P a g e
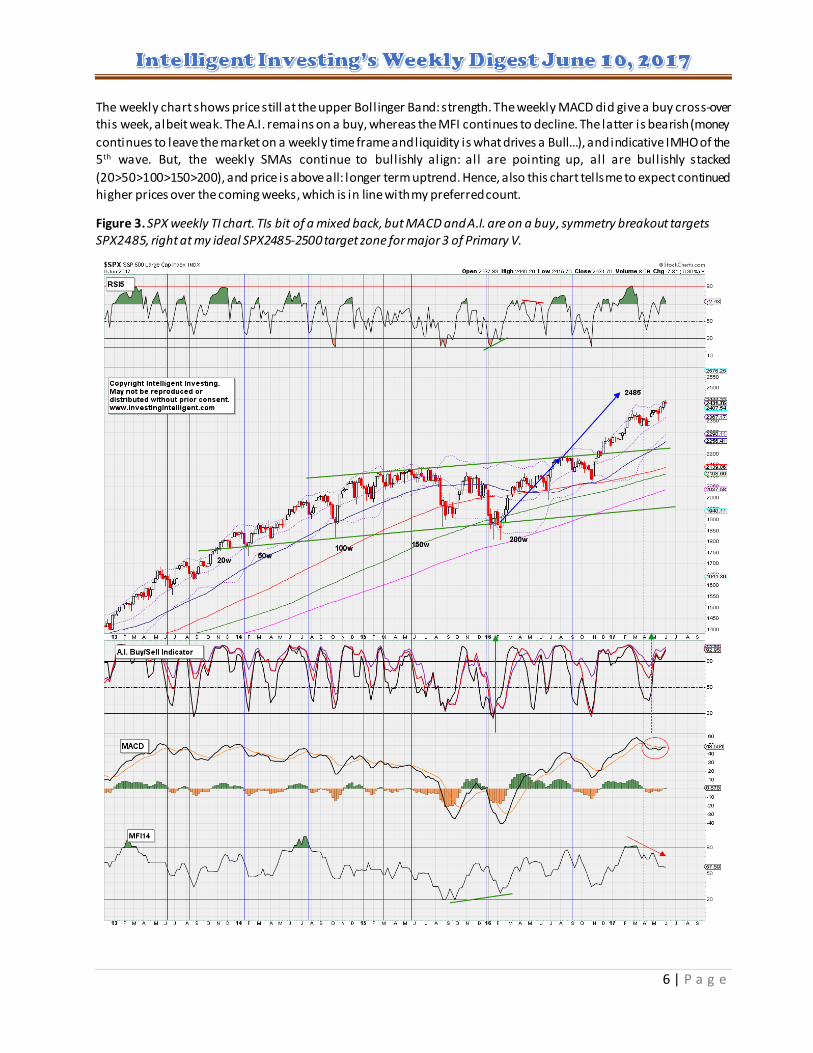
The weekly chart shows price still at the upper Bollinger Band: strength. The weekly MACD did give a buy cross-over this week, albeit weak. The A.I. remains on a buy, whereas the MFI continues to decline. The latter is bearish (money
continues to leave the market on a weekly time frame and liquidity is what drives a Bull…), and indicative IMHO of the 5th wave. But, the weekly SMAs continue to bullishly align: all are pointing up, all are bullishly stacked
(20>50>100>150>200), and price is above all: longer term uptrend. Hence, also this chart tells me to expect continued higher prices over the coming weeks, which is in line with my preferred count.
Figure 3. SPX weekly TI chart. TIs bit of a mixed back, but MACD and A.I. are on a buy, symmetry breakout targets SPX2485, right at my ideal SPX2485-2500 target zone for major 3 of Primary V.
7 | P a g e
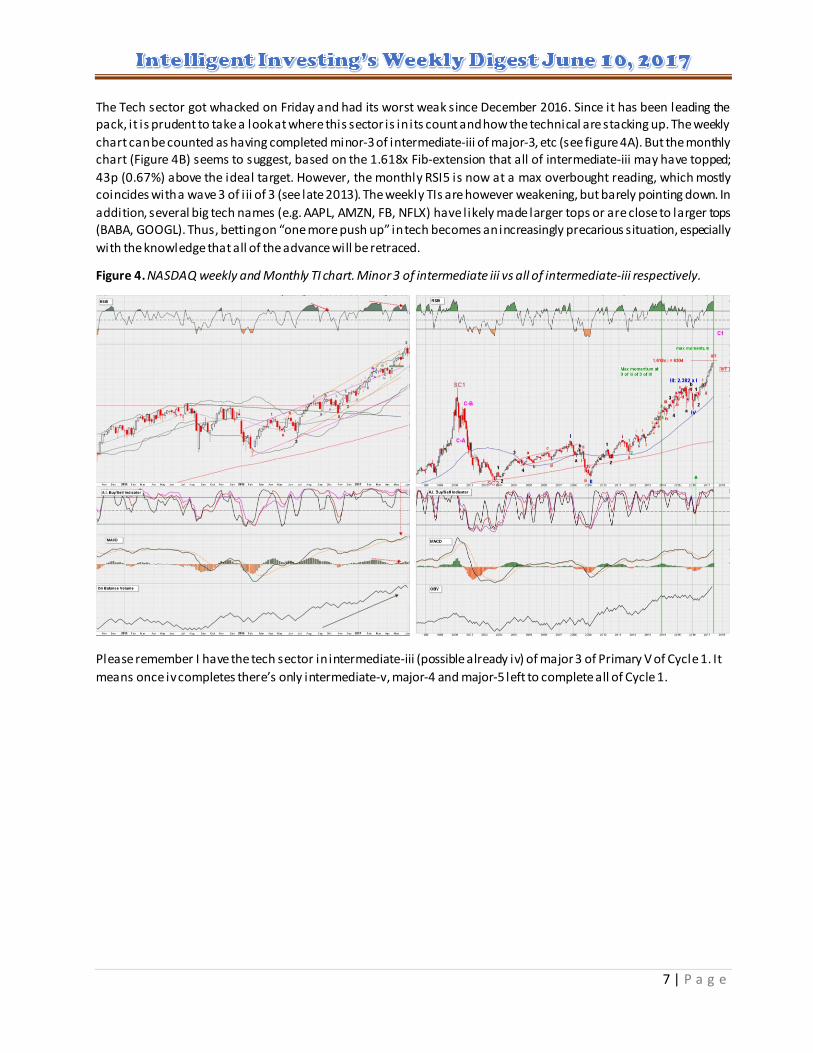
The Tech sector got whacked on Friday and had its worst weak since December 2016. Since it has been leading the pack, it is prudent to take a look at where this sector is in its count and how the technical are stacking up. The weekly
chart can be counted as having completed minor-3 of intermediate-iii of major-3, etc (see figure 4A). But the monthly chart (Figure 4B) seems to suggest, based on the 1.618x Fib-extension that all of intermediate-iii may have topped;
43p (0.67%) above the ideal target. However, the monthly RSI5 is now at a max overbought reading, which mostly coincides with a wave 3 of i ii of 3 (see late 2013). The weekly TIs are however weakening, but barely pointing down. In
addition, several big tech names (e.g. AAPL, AMZN, FB, NFLX) have likely made larger tops or are close to larger tops (BABA, GOOGL). Thus, betting on “one more push up” in tech becomes an increasingly precarious situation, especially
with the knowledge that all of the advance will be retraced.
Figure 4. NASDAQ weekly and Monthly TI chart. Minor 3 of intermediate iii vs all of intermediate-iii respectively.
Please remember I have the tech sector in intermediate-iii (possible already iv) of major 3 of Primary V of Cycle 1. It
means once iv completes there’s only intermediate-v, major-4 and major-5 left to complete all of Cycle 1.

8 | P a g e
Market breadth & Simple Moving Averages Charts
The SPXSI (Summation Index for the S&P500, derived from the McClellan Oscillator for S&P500 (SPXMO)) continues to
remain on buy/long as breadth remains positive, and actually increased on Friday compared to Thursday (5A). As did the NYAD (advancing/declining issues, 5B)) and the number of stocks on the S&P500 above their respective 50d SMA
(5C). This indicator remains above its long term average: Bullish. However, the Bullish Percent Index (5D) is negatively diverging longer term, and although history shows this can persist for some time it does lead to corrections (Major 4
in this case). Shorter term; the CPCE (put/call ratio; a contrarian indicator at very low and high levels) ended at 0.72 on Friday after the recent (too bullish) <0.55 readings. 0.72 is not too extreme, but could mark a low.
Figure 5. A) SPXSI. B) NYAD. C) S&P500 stocks >50d SMA. D) Bullish Percent Index S&P500. E) CPCE ratio.
A
B C
D E

9 | P a g e
Our long-term Simple Moving Averages only chart (LT-SMA, for trend followers and long term traders) continues to be 100% bullish. It’s telling long term traders to stay long and strong: major 3 still underway. As such this chart also
continues to support our overall view of the market and where it will head over the next several months: higher. Our short term chart (ST-SMA, for short term to swing traders) remains ~90% bullish despite Friday’s price action; which is
also in line with our view that the market is in intermediate wave iii of major 3.
Figure 6. A: LT-SMA chart 100% bullish B: ST-SMA chart 90% Bullish.
Copyright Intelligent Investing. May
not be distributed without permission.
www.investingintelligent.com
Copyright Intelligent Investing. May
not be distributed without permission.
www.investingintelligent.com
A
B

10 | P a g e
Fib-based Trading Interval Turn dates & Remaining Bradley Turn Dates for 2017
The next turn date is June 20th (+/- 3 days) The May 30th turn date market the SPX2404 low. Friday June 9 was a
Bradley turn date and turn it did. There are two very strong turn dates slated for June 21 and 30, with the first in-line with my Fib-based turn date. It is reasonable to expect a top around that time given where the market is now.
June 9 (61/100 Long Terms Power)
June 21 (100/100 Bradley Siderograph Power)
June 30 (100/100 Declinations Power)
July 4 (100/100 Middle Terms Power)
August 19 (17/100 Bradley Siderograph Power)
September 5 (17/100 Declinations Power)
September 7 (29/100 Bradley Siderograph Power)
October 7 (48/100 Middle Terms Power)
December 3 (23/100 Bradley Siderograph Power)
December 6 (100/100 Long Terms Power)
ALOHA
Soul, Ph.D.
©2017, Intelligent Investing. This copyrighted weekly periodical is published on non-stock market trading weekend
days by Intelligent Investing, and is intended solely for use by designated recipients. No reproduction, retransmission,
or other use of the information or images is authorized. Legitimate news media may quote representative passages, in
context and with full attribution, for the purpose of reporting on our opinions.
Analysis is derived from data believed to be accurate, but such accuracy or completeness cannot be guaranteed. It
should not be assumed that such analysis, past or future, will be profitable or will equal past performance or guarantee
future performance or trends. All trading and investment decisions are the sole responsibility of the reader. Inclusion
of information about managed accounts, program positions and other information is not intended as any type of
recommendation, nor solicitation.
For more information, contact intelligent investing at [email protected]. We reserve the right to refuse
service to anyone for any reason.