intelligent structuring and exploration of digital …i_2005.pdf · intelligent structuring and...
TRANSCRIPT

Intelligent Structuring and Exploration of Digital Music Collections Authors: Markus Schedl (1)
[email protected] Elias Pampalk (1) [email protected] Gerhard Widmer (1, 2)
Address: 1.)
Austrian Research Institute for Artificial Intelligence (ÖFAI) Freyung 6/6 A-1010 Vienna Austria 2.) Department of Computational Perception Johannes Kepler Universität (JKU) Linz Altenberger Straße 69 A-4040 Linz Austria
Date: November 2004

Abstract In this paper we present a general approach to the automatic content-based organization and visualization of large digital music collections. The general methodology consists in extracting musically and perceptually relevant patterns (‘features’) from the given audio recordings (e.g., mp3 files), using topology-preserving data projection methods to map the entire music collection onto two-dimensional visualization planes (possibly in a hierarchical fashion), and using a new display metaphor (the ‘Islands of Music’) to display the inherent structure of the music collection to the user. It is shown how arbitrary meta-data can be integrated into the visualization process, and how similarity according to different viewpoints can be defined and exploited. The basic methodology is briefly described, three prototype systems are presented, and a general discussion of the practical application possibilities of such technologies is offered. Keywords: intelligent music processing, music similarity, automatic hierarchical structuring, interfaces to music
Abstract (German) Diese Arbeit präsentiert eine allgemeine Methodik zur automatischen inhaltsbasierten Strukturierung und Visualisierung großer digitaler Musiksammlungen. The Methode besteht im Extrahieren musikalisch und perzeptuell relevanter Muster (‚Features’) aus Audioaufnahmen (z.B. mp3-Files), der Projektion der Daten und der Musiksammlung auf zweidimensionale (möglicherweise hierarchisch strukturierte) Visualisierungsebenen mittels topologiererhaltender Projektionsmethoden, und der Visualisierung der resultierenden Strukturen mittel einer neuen graphischen Metapher (den sogenannten ‚Islands of Music’), so dass die inhärente Struktur der Musiksammlung für den Benutzer sichtbar wird. Es wird auch gezeigt, wie beliebige zusätzliche Meta-Daten in den Visualisierungsvorgang integriert und verschiedene Gesichtspunkte von (musikalischer) Ähnlichkeit definiert und mit einbezogen werden können. Die Arbeit bietet eine kurze Beschreibung der Grundmethodik, präsentiert drei Softwareprototypen und diskutiert dann die praktischen Anwendungsmöglichkeiten solcher Technologien.
Schlüsselwörter: intelligente Musikverarbeitung, musikalische Ähnlichkeit, automatische hierarchische Strukturierung, Schnittstellen zu Musik Title (German): Intelligente Strukturierung und Exploration von digitalen Musiksammlungen

1. Introduction Music exchange systems like Napster1 and peer-to-peer networks like Kazaa2, where users can easily share their music or other data, have been gaining popularity over the past few years. Thanks to Internet-based music stores like iTunes3, digital music distribution (DMD) is becoming an important economic factor. According to a recent report4, the online music market in Germany is growing by 25 percent per week. Naturally, this leads to an increase in the number and size of digital music collections and therefore to the necessity of intelligent strategies for searching in and browsing through such music databases. At the moment, the standard approach is text-based search, i.e. the user has to enter the name of the artist, album, or song s/he intends to find. However, this approach is not very suitable if the user does not know exactly what s/he wants to hear or is not able to express it in a textual manner [Pachet, 2003]. The desired mode of operation would be content-based, where the music collections can be browsed and searched according to musical content rather than external description, or, better, a combination of content- and description-based. To that end, methods which take into account both aspects of the musical content – e.g., rhythm, timbre, tempo, etc. – and meta-data of various kinds – e.g. instrumentation, style, artist – would be needed. The approach which is presented here is based on the extraction of features from audio and the visualization of these data together with various kinds of meta-data, by forming clusters of similar pieces of music. To obtain musical data such as rhythm or timbre, features relating to these properties are extracted from the audio files. Afterwards, a similarity measure is applied to the features in order to capture the relative degrees of similarity between pieces of music. These similarities are then used to train a Self-Organizing Map (SOM) that is finally visualized by so-called smoothed data histograms, which reveal clusters with similar songs. Since we have been working on this topic for several years, we developed some prototypes for user interfaces. One of the first, called Islands of Music (IoM), is described in detail in [Pampalk, 2001]. It uses solely features based on loudness modulation to create an HTML-document that is linked to the pieces of music of the collection. IoM implements a visualization approach that resembles geographical maps where clusters with many songs are presented as mountains whereas sparse areas are colored in blue like oceans on maps. As the user may be interested in more than one musical feature, IoM was extended with the capability of switching between different views, each of which weights the available features differently and in effect implements a different notion of musical similarity. The user can 1 http://www.napster.com 2 http://www.kazaa.com 3 http://www.apple.com/itunes 4 http://www.heise.de/newsticker/meldung/50150

choose to view a map where, for example, rhythm is weighted by one third and timbre by two thirds. This is done with so-called Aligned Self-Organizing Maps and is explained in detail in [Pampalk, Dixon, Widmer, 2003a]. However, this second approach, called IoMv2, still lacks the capability to process collections of arbitrary size since it does not use any hierarchical information. To address this issue, in [Schedl, 2003] the prototype of a user interface called Visualization of Structured Music Collections (ViSMuC) is presented. In addition to IoMv2, ViSMuC uses two hierarchical components to deal with large collections: directory structure and musical similarity. The remainder of this article is structured as follows. In chapter 2, first the process of feature extraction and similarity measurement is sketched. Afterwards, our prototypes for music visualization are presented and the used techniques explained. Chapter 3 gives a summary and an outlook of possible application areas.
2. Methods and Discussion Our approach to visualizing musical properties of music collections basically involves two stages. First, features capturing some kind of musical properties have to be extracted and a similarity measure needs to be applied to them. Hereafter, methods of artificial intelligence, e.g. Self-Organizing Maps, are used to cluster the data and perform the automatic structuring of the collection. Both stages are described in the following.
2.1. Musical Features and Similarity Measures Extracting meaningful descriptors such as instrumentation or genre from music (audio) is a very difficult task. Various approaches exist to extract low-level features that capture some aspects relevant to our hearing sensation. Characterising music through such low-level features is comparable for example to the use of color histograms to describe the content of an image. Clearly, one would expect higher-level patterns like rhythm, melody, or harmony to describe a piece of music much more accurately. Extracting such semantically meaningful descriptors from audio is currently a hot topic of research; there are no reliable solutions to these problems at the moment, so currently we must make do with lower-level features. In the following, we briefly describe the steps performed to extract such features from audio recordings, and indicate that even such low-level information can be used to create quite useful and meaningful organizations of digital music collections. To describe the content of a piece of music, we first transform the audio signal into the frequency domain via a Fast Fourier Transformation (FFT) [Cooley, Tukey, 1965]. The human ear is not equally responsive to all frequencies. Thus we apply an outer and middle ear model that reduces the impact of frequencies in the low (around 50 Hz) and high end (16 kHz) of the frequency range [Terhardt, 1979]. The linear frequency scale is transformed to a

perceptive scale known as the Bark scale with a critical band width defined by listening experiments [Zwicker, Fastl, 1999]. Spectral masking effects are computed to take into account the occlusion of two simultaneous sounds with similar frequencies [Schröder, Atal, Hall, 1979], and the loudness is computed according to the perceptual Sone scale [Bladon, Lindblom, 1981]. As a result of the described psychoacoustic preprocessing we obtain a sonogram, also known as an auditory spectrogram, with the dimensions time, loudness, and frequency. Based on these sonograms we compute a spectrum histogram (SH) for each piece by simply counting how often a certain loudness level was reached in each frequency band. This results in a 2-dimensional histogram where each bin contains the count for the number of times a specific loudness level was exceeded, for each frequency band. Alternatively, we can compute so-called fluctuation patterns (FP) by modelling the modulations in each frequency band over time with sinusoids. In particular, we compute a Fast Fourier Transformation (FFT) [Cooley, Tukey, 1965] on segments of the sonogram with a length of 6 seconds and apply some filters to emphasize fluctuations with a frequency around 4 Hz. For each 6-second-sequence of the song, we obtain a representation describing the strength in each frequency band and for each modulation frequency. All these 6-second-segments are then aggregated into one common representation of the entire piece by combining them into some statistical model (e.g., simple models like the median, or more complex ones such as Gaussian Mixture Models (GMMs)). The results of all this computation is a fixed-size model representing a specific property of the processed piece of music. In the next step, distances between the representations of all songs in a collection are calculated to measure the similarity of arbitrary songs. This can be done in various ways, using various distance functions, ranging from a simple Euclidean distance measure to sophisticated methods like the Kullback-Leibler and Earth Mover’s distances, which are used in [Logan, Salomon, 2001]. There have been a variety of experimental studies recently that tried to establish which of the many features and similarity measures that were proposed in the past few years actually work best (e.g., in the context of categorical tasks like genre classification). The results obtained so far (e.g., [Aucouturier, Pachet, 2002], [Logan, Salomon, 2001], [Pampalk, Dixon, Widmer, 2003b], [Schedl, 2003]) are inconclusive in the sense that they show no clear superiority of one measure over all others, and over all experiments. Music similarity is a complex concept and cannot be fully captured in one single representation and measure. Our latest prototype ViSMuC uses two types of features to characterize music, one describing the timbre and another one addressing rhythmic characteristics. Specifically, we found that the above-mentioned “modified fluctuation patterns” (MFS) [Pampalk, Rauber, Merkl, 2002a], which describe rhythmic aspects at various levels, and “spectrum histograms” (SH)

[Pampalk, Dixon, Widmer, 2003a], which address timbral properties, represent a reasonable compromise with regard to accuracy and computing time. The MFS features describe loudness modulations in 20 frequency bands and reveal their fluctuations in the range from 0 to 10 Hertz. In figure 1, the strong beats of the Techno piece “Anthem #5” by “Floorfilla” at about 4.5 Hz can be seen. In contrast, the Mozart piano sonata contains no typical periodic beat, instead many variations in tempo can be observed. The timbre-based SH features measure how many times the piece of music reaches or exceeds a specific loudness in each of 20 frequency bands. Figure 2 shows spectrum histograms of four very different pieces of music. Like in figure 1, it can be seen that the piano sonata has quite low activations, mainly in the lower frequency bands. The song by “Nightwish” is very melodious but also characterized by high energy in all frequencies. Thus, its spectrum histogram shows high loudness levels in all critical bands, especially at higher frequencies. The outcome of the feature extraction is a data matrix containing the features (data vectors) of all pieces of music of the collection under consideration. During the last few years, we have been developing a number of prototypes for visualizing music collections using such feature matrices. In the following sections, the main three prototypes are presented in chronological order.
2.2. Automatic Structuring of Digital Music Collections Since all our prototypes use some standard techniques of statistical data analysis and AI, these common steps are briefly described before the prototypes themselves are presented. After the features have been extracted, we use a Principal Components Analysis (PCA) [Jolliffe, 1986] to compress the data, i.e. to reduce the dimensionality of the feature vectors. This task is performed in order to reduce the computation times for the following calculations. We are able to reduce the dimensionality of the feature matrices from values greater than 1000 to 80 without any visible influence on the quality of the visualizations. Afterwards, we use Self-Organizing Maps (SOM) [Kohonen, 1982, 2001] to discover structure in the data by clustering the data items (pieces of music). The SOM organizes multivariate data on a usually 2-dimensional map in such a way that data items which are similar in the high-dimensional data space are projected to similar locations on the map. Basically, the SOM consists of an ordered set of map units, each of which is assigned a “model vector” im of the same dimensionality as the original data space. The set of all model
vectors of a SOM is called its “codebook”. Before the SOM is trained, we initialize the codebook linearly along the greatest eigenvectors. In each iteration of the sequential training algorithm [Kohonen, 1982], one randomly selected data item x is chosen. Subsequently, the Euclidean distance between x and each model vector im is calculated. The map unit possessing the model vector bmum that is closest to the
data item x is referred to as “best matching unit” (BMU) and is used to represent x on the
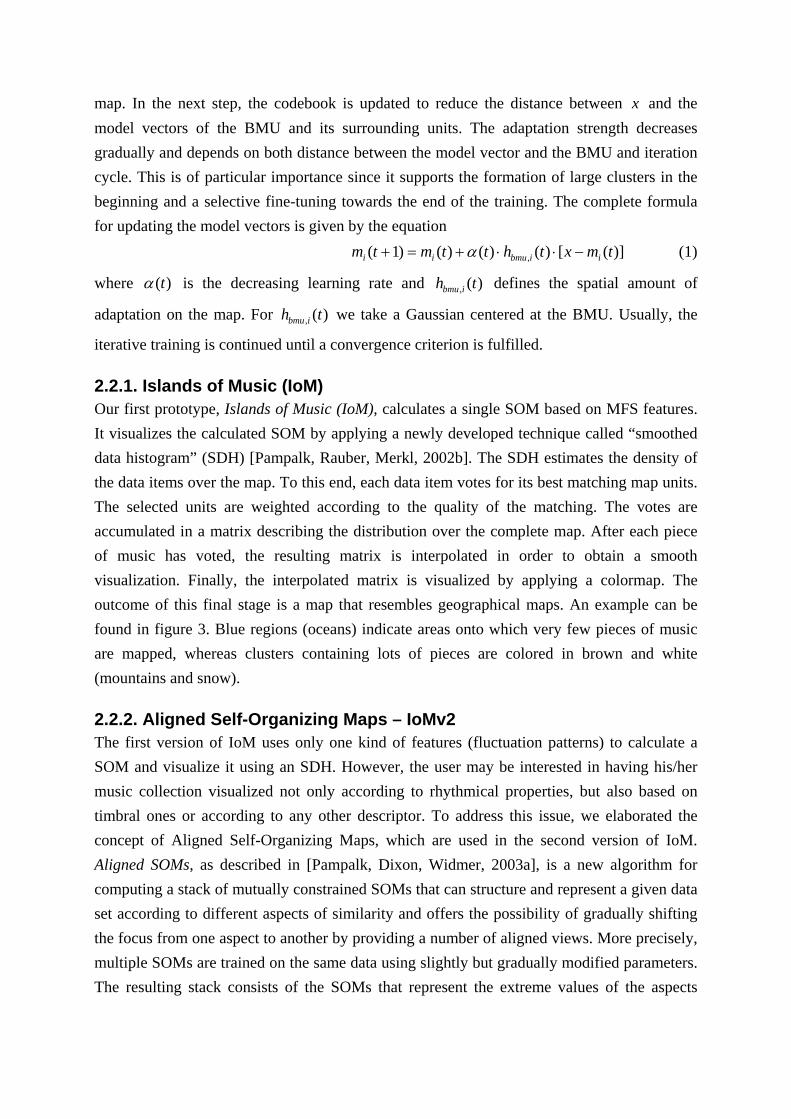
map. In the next step, the codebook is updated to reduce the distance between x and the model vectors of the BMU and its surrounding units. The adaptation strength decreases gradually and depends on both distance between the model vector and the BMU and iteration cycle. This is of particular importance since it supports the formation of large clusters in the beginning and a selective fine-tuning towards the end of the training. The complete formula for updating the model vectors is given by the equation
)]([)()()()1( , tmxthttmtm iibmuii −⋅⋅+=+ α (1)
where )(tα is the decreasing learning rate and )(, th ibmu defines the spatial amount of
adaptation on the map. For )(, th ibmu we take a Gaussian centered at the BMU. Usually, the
iterative training is continued until a convergence criterion is fulfilled.
2.2.1. Islands of Music (IoM) Our first prototype, Islands of Music (IoM), calculates a single SOM based on MFS features. It visualizes the calculated SOM by applying a newly developed technique called “smoothed data histogram” (SDH) [Pampalk, Rauber, Merkl, 2002b]. The SDH estimates the density of the data items over the map. To this end, each data item votes for its best matching map units. The selected units are weighted according to the quality of the matching. The votes are accumulated in a matrix describing the distribution over the complete map. After each piece of music has voted, the resulting matrix is interpolated in order to obtain a smooth visualization. Finally, the interpolated matrix is visualized by applying a colormap. The outcome of this final stage is a map that resembles geographical maps. An example can be found in figure 3. Blue regions (oceans) indicate areas onto which very few pieces of music are mapped, whereas clusters containing lots of pieces are colored in brown and white (mountains and snow).
2.2.2. Aligned Self-Organizing Maps – IoMv2 The first version of IoM uses only one kind of features (fluctuation patterns) to calculate a SOM and visualize it using an SDH. However, the user may be interested in having his/her music collection visualized not only according to rhythmical properties, but also based on timbral ones or according to any other descriptor. To address this issue, we elaborated the concept of Aligned Self-Organizing Maps, which are used in the second version of IoM. Aligned SOMs, as described in [Pampalk, Dixon, Widmer, 2003a], is a new algorithm for computing a stack of mutually constrained SOMs that can structure and represent a given data set according to different aspects of similarity and offers the possibility of gradually shifting the focus from one aspect to another by providing a number of aligned views. More precisely, multiple SOMs are trained on the same data using slightly but gradually modified parameters. The resulting stack consists of the SOMs that represent the extreme values of the aspects

( maxmin , pp ) and a number of layers that are inserted between them. The individual SOMs are
trained such that each layer maps similar data items near one another within the layer. Neighboring layers are further constrained to map the same items to similar locations, which makes for smooth transitions between layers. To that end, we define a distance between individual SOM layers (inter-layer distance) that is made to depend on how similar the respective views are. An illustration of the concept of Aligned SOMs can be found in figure 4. The training algorithm for standard SOMs that was presented above had to be extended to handle the multi-layer-architecture of Aligned SOMs. In detail, in each iteration, not only a data item x , but also a layer l is chosen randomly. Hereafter, the BMU bmum for x within
layer l is calculated. The adaptations of the model vectors within layer l are calculated based on the intra-layer distances exactly as shown in equation 1. The update function for all other layers takes into account the inter-layer distances and adapts the model vectors according to the representation of the data item x in the respective layer. After having updated all model vectors in all layers, the described process is repeated iteratively until convergence. As for the representation of the same data item in different layers, each data item is assigned one feature vector lx for each layer l , where each lx is composed of at least two feature sets (one for
each aspect), which are weighted differently according to the feature balance parameters ip
of the layer. Equation 2 shows the compound feature vector x in the two-feature-case. 1p and
2p are in the range of [ maxmin , pp ], m denotes the dimensionality of feature 1 and n that of
feature 2. Furthermore, 1p and 2p sum up to maxp so that an increase in either of the two
parameters causes a decrease in the other. [ ]nm xpxpxpxpx 2221211111 ⋅⋅⋅⋅= LL (2)
Figure 5 gives an illustration of the effect of Aligned SOMs. For this figure, we used a simple artificial dataset consisting of 16 animals, each described via 13 Boolean features describing aspects of the animal’s appearance (e.g. type of skin or number of legs) and activity (e.g. ability to swim). The leftmost picture, which uses solely appearance features, clusters all mammals together in the lower half of the map, whereas birds are located in the upper regions. As the focus is gradually shifted from appearance to activity, the map becomes reorganized as can be seen in the two center figures. In the rightmost picture, with a ratio of 0:1 between appearance and activity, all predators can be found on the left. The same technology can be applied to collections of music pieces represented as feature vectors. We have made available an online demonstration of IoMv2 on a small music collection that combines three different features: rhythm-based, timbre-based, and user-

defined (i.e. based on a direct positioning, by the user, of the songs on the map according to personal musical preferences). The reader is invited to interact with the on-line demo5.
2.2.3. Hierarchical Organization of Music Collections – ViSMuC Although IoMv2 permits focusing the view on various musical properties, the system is still constrained to a limited number of pieces of music since it does not allow creating a hierarchical structure. Our latest prototype, Visualization of Structured Music Collections (ViSMuC)6, in contrast, provides an automatic structuring of the input music collection. Figure 6 shows the user interface of ViSMuC, which uses Aligned SOMs to permit focus shifting between rhythm and timbre. As for the automatic structuring that is necessary to handle music collections of arbitrary size, two different hierarchies are used together with focusing and linking techniques. The first hierarchy is defined by the number of music files which are mapped to each unit. If this number exceeds a specified limit for a certain map unit (five in our demonstration), only the best matching data item is chosen and displayed to represent a prototype for the map unit (focusing). The omitted pieces of music are made available to the user via a link to a SOM on a lower hierarchy level which consists of all omitted pieces of the particular map unit together with its prototype (linking). Since users often define sophisticated, or at least meaningful, directory structures for their music collections, the second hierarchical component is given by the directory structure. Hence, for each displayed piece of music, a link to a SOM that comprises all music files in the same directory is made available to the user. In figure 6, these links are situated in the lower right corner of the map units, next to the darker links used by the first hierarchy. The user interface also permits visualizing almost arbitrary meta-information taken, for example, from ID3-tags or external databases. For this purpose, the distribution of (attribute, value)-pairs over the map is visualized with an SDH, as can be seen for some examples in the right frame in figure 6. Since ID3 is very widely used for tagging music collections, these data are visualized not only by SDHs but are also presented in a pop-up-window that appears when the user moves the mouse over the name of a piece of music. Furthermore, VisMuC offers different colormaps, some of which focus more on strong contrasts, whereas others produce smoother transitions.
3. Summary and Application Areas This article has presented three prototypes for the intelligent structuring and visualization of digital music collections, and briefly described the underlying techniques for feature extraction, similarity measurement, data compression, clustering, and visualization. Our latest
5 http://www.oefai.at/~elias/aligned-soms/IoMv2 6 http://vismuc.schedl.name

prototype, Visualization of Structured Music Collections (ViSMuC), combines similarity based collection mapping with automatic hierarchy building and thus makes it possible to work with truly large music archives (tens of thousands of recordings). There is a wide field of application possibilities for these technologies. Systems such as those described above could be used either for organizing and browsing through private music collections, or for supporting users of commercial music stores in exploring their content. Other application areas are phone-based services and smart home entertainment devices. We are currently discussing exploitation strategies with several companies from the digital music sector. The main device on which the prototypes can be used currently is the personal computer. Future versions should be extended towards usage on mobile devices like Personal Digital Assistants (PDAs) or MP3 players with built-in screens. Unfortunately, today’s screen resolutions of such devices are still too low to display the complete user interface properly. Another research question concerns improvements of the computational complexity, e.g. by optimizing the algorithms. Ideally, the calculation times should be reduced to a level where, given the musical features, the visualizations can be calculated on demand. Moreover, experiments with additional meta-data should be conducted in order to improve the quality of the clustering and to enhance the information given to the user. A step in this direction is the European FP6 project “Semantic Interaction with Music Audio Contents” (SIMAC)7, which, among other things, aims at finding and organizing “semantic” (i.e., musically interpretable) descriptors of musical content. Also, extra-musical information like social meta-data may be used to improve the quality of collection organization. For example, in [Knees, Pampalk, Widmer, 2004] a web-based approach for artist classification has described which entirely bypasses the actual music and characterizes artists exclusively via information that can be found about them on the Internet. This approach uses solely information gained from the Internet search engines Yahoo8 and Google9. Generally, research on intelligent music processing is currently experiencing a strong boost, driven by the ongoing rapid transition of the music market from physical (e.g., CD) to digital media (e.g., distribution of audio files via the Internet). Music industry urgently asks for new intelligent music processing technology that will support novel types of content-based music services on many types of devices (home entertainment centers, PDAs, MP3 players, mobile phones), and Artificial Intelligence with its subfields such as machine learning and intelligent data analysis has an important role to play in all this.
7 http://www.semanticaudio.org 8 http://www.yahoo.com 9 http://www.google.com

Figures
Figure 1 This image visualizes the MFS values for four selected pieces of music. The color (grey-scale) bars next to the figures reveal the unequal scaling of the MFS values.
Figure 2 This figure shows the spectrum histograms for the selected pieces of music. The bar beside each figure shows the number of frames into which each track was split.

Figure 3 This figure shows a smoothed data histogram (SDH) created with the first version of Islands of Music. The SOM was trained with a data set containing 273 “Queen”-songs. For each map unit, the pieces mapped to this unit are displayed.
Figure 4 This figure shows the basic architecture of Aligned SOMs.
Figure 5 This figure shows four Aligned SOMs trained on a test dataset which contains appearance and activity features for a few animals. From left to right the organization of the SOMs changes according to the weighting

of the features. The ratio between appearance and activity is the following: 1:0 (leftmost), 2:1, 1:2, 0:1 (rightmost).
Figure 6 This image depicts the ViSMuC-user interface for a collection of 834 songs. The left frame shows the control panel with the Aligned SOM- and colormap-selector, the centered one contains the actual visualization, and the right frame gives information about the distribution of meta-data values from an external database.
References [Aucouturier, Pachet, 2002] Aucouturier, J.-J., Pachet, F. (2002): Music Similarity Measures: What's the Use? In Proceedings of the 3rd International Symposium on Music Information Retrieval (ISMIR'02), Paris, France, October 2002. [Bladon, Lindblom, 1981] Bladon, R.A.W., Lindblom, B. (1981): Modeling the Judgment of Vowel Quality Differences. Journal of the Acoustic Society of America, 69(5):1414-1422, 1981. [Cooley, Tukey, 1965] Cooley, J.W. and Tukey, J.W. (1965): An algorithm for the machine calculation of complex Fourier series. Mathematics of Computation, 19(90):297-301, 1965. [Jolliffe, 1986] Jolliffe, I.T. (1986): Principal Component Analysis. Springer, New York, 1986. [Knees, Pampalk, Widmer, 2004] Knees, P., Pampalk, E., Widmer, G. (2004): Artist Classification with Web-based Data. In Proceedings of the 5th International Symposium on Music Information Retrieval (ISMIR'04), Barcelona, Spain, October 2004. [Kohonen, 1982] Kohonen, T. (1982): Self-Organizing Formation of Topologically Correct Feature Maps. Biological Cybernetics, 43:59-69, 1982.
[Kohonen, 2001] Kohonen, T. (2001): Self-Organizing Maps, volume 30 of Springer Series in Information Sciences. Springer, Berlin, 3rd edition, 2001. [Logan, Salomon, 2001] Logan, B., Salomon, A. (2001): A Music Similarity Function Based on Signal Analysis. In Proceedings of the IEEE International Conference on Multimedia and Expo (ICME'01), Tokyo, Japan, 2001. Institute of Electrical and Electronics Engineers. [Pachet, 2003] Pachet, F. (2003): Content Management for Electronic Music Distribution: The Real Issues. Communications of the Association for Computing Machinery (CACM), April 2003. [Pampalk, 2001] Pampalk, E. (2001): Islands of Music: Analysis, Organization, and Visualization of Music Archives. Master's thesis, Vienna University of Technology, Austria, December 2001. [Pampalk, Dixon, Widmer, 2003a] Pampalk, E., Dixon, S., and Widmer, G. (2003): Exploring Music Collections by Browsing Different Views. In Proceedings of the 4th International Conference on Music Information Retrieval (ISMIR'03), Washington, D.C., USA, October 2003. [Pampalk, Dixon, Widmer, 2003b] Pampalk, E., Dixon, S., and Widmer, G. (2003): On the Evaluation of Perceptual Similarity Measures for Music. In Proceedings of the 6th International Conference on Digital Audio Effects (DAFx'03), volume 8, London, UK, September 2003. [Pampalk, Rauber, Merkl, 2002a] Pampalk, E., Rauber, A., and Merkl, D. (2002): Content-based Organization and Visualization of Music Archives. In Proceedings of the Association for Computing Machinery (ACM) Multimedia, pages 570-579, Juan les Pins, France, December 2002. ACM. [Pampalk, Rauber, Merkl, 2002b] Pampalk, E., Rauber, A., and Merkl D. (2002): Using Smoothed Data Histograms for Cluster Visualization in Self-Organizing Maps. In Proceedings of the International Conference on Artificial Neural Networks (ICANN'02), pages 871-876, Madrid, Spain, August 2002. [Schedl, 2003] Schedl, M. (2003): An Explorative, Hierarchical User Interface to Structured Music Repositories. Master’s thesis, Vienna University of Technology, Austria, December 2003. [Schröder, Atal, Hall, 1979] Schröder, M.R., Atal, B.S., Hall, J.L. (1979): Optimizing Digital Speech Coders by Exploiting Masking Properties of the Human Ear. Journal of the Acoustic Society of America, 66(6):1647-1652, 1979. [Terhardt, 1979] Terhardt, E. (1979): Calculating virtual pitch. Hearing Research, volume 1, 155-182, 1979. [Zwicker, Fastl, 1999] Zwicker, E., Fastl H. (1999): Psychoacoustics, Facts and Models, volume 22 of Springer Series of Information Sciences. Springer, Berlin, 2nd updated edition, 1999.