intelligent transportation systems technical report...
TRANSCRIPT
Prepared by the Genesee County Metropolitan Planning Commission
“Shaping our Transportation Future Together”Genesee County
2035 Long Range Transportation Plan
Intelligent Transportation Systems Technical Report
MDOT

Michigan Department of Transportation Regional ITS Architectures and Deployment Plans
Bay Region
Final Regional ITS Architecture Prepared by: In association with:
January 31, 2008 012578005 Copyright © 2008 by Kimley-Horn and Associates, Inc. All rights reserved.

USE AND MAINTENANCE PLAN As the Region moves forward with programming projects and deploying ITS, the regional architecture can quickly become out-of-date. The use and maintenance section presents recommendations for integrating the regional architecture into the existing planning process and documenting changes that affect the regional architecture.
STAKEHOLDER ROLES AND RESPONSIBILITIES Table 8 identifies each stakeholder’s current and future roles and re-sponsibilities across a range of transportation services. The operational concepts are grouped by transportation service and then by stakeholder name.
CUSTOMIZED MARKET PACKAGES The market packages in the National ITS Architecture were customized to reflect the unique systems, subsystems, and terminators in the Re-gion. Appendix B contains all of the customized market packages that were developed for the Region.
APPLICABLE STANDARDS Standards facilitate deployment of interoperable systems at local, re-gional, and national levels without impeding innovation as technology advances, vendors changes, and as new approached evolve. Table 7 identifies each of the ITS standards that could apply to the Region based on the physical subsystem architecture flows identified.
REGIONAL NEEDS Identifying the needs of the region provided guidance for determining which market packages should be included in the architecture. Table 6 shows the needs identified by the stakeholders for the Region and the corresponding market packages that could address the identified need.
INTERCONNECT DIAGRAM The customized system interconnect diagram, or “sausage diagram” shows the systems and primary interconnects in the Region. Subsys-tems and elements specific to the Region are called out in the boxes surrounding the main interconnect diagram, and are color coded to the associated subsystem.
STAKEHOLDER DESCRIPTIONS A listing of stakeholders as identified in the architecture can be found in Table 3 along with a description of the stakeholder. This section pro-vides a reference to determine which stakeholder name captures each agency in the architecture.
INVENTORY OF ELEMENTS Table 4 sorts the inventory of elements by stakeholder so that each stakeholder can easily identify and review all of the architecture ele-ments associated with their agency. This table also identifies a “planned” or “existing” status for each element.
An ITS architecture is a f r a m e w o r k f o r t h e i m p l e m e n t a t i o n a n d operation of ITS in a region. Development of a regional ITS architecture is required by the Federal Highway Administration and Federal Transit Administration for a region to be eligible for federal funding of any ITS projects. This document contains an overview of the data include in the Turbo Architecture database; guidelines for integrating the regional ITS architecture into the existing planning and project programming p r o c e s s ; a n d recommendat ions fo r maintaining the regional architecture.
ITS
Regi
onal
Arc
hite
ctur
e U
ser
Gui
de

TABLE OF CONTENTS FINAL REGIONAL ITS ARCHITECTURE REPORT – BAY REGION
1/31/2008 Bay Region i Final Regional ITS Architecture
1. INTRODUCTION ................................................................................................................................. 1 1.1 Project Overview ....................................................................................................................... 1 1.2 Document Overview .................................................................................................................. 1 1.3 Assessment.................................................................................................................................. 2 1.4 The Bay Region.......................................................................................................................... 3
1.4.1 Geographic Overview ........................................................................................................... 3 1.4.2 Transportation Infrastructure ............................................................................................... 3 1.4.3 Bay Region ITS Plans............................................................................................................ 5 1.4.4 Stakeholders .......................................................................................................................... 5
2. REGIONAL ITS ARCHITECTURE DEVELOPMENT PROCESS ........................................................... 7
3. CUSTOMIZATION OF THE NATIONAL ITS ARCHITECTURE FOR THE BAY REGION ..................... 9 3.1 Systems Inventory...................................................................................................................... 9 3.2 Regional Needs........................................................................................................................... 9 3.3 Element Customization ........................................................................................................... 10
3.3.1 Subsystems and Terminators............................................................................................... 10 3.3.2 ITS Inventory by Stakeholder .............................................................................................. 11 3.3.3 Top Level Regional System Interconnect Diagram............................................................. 23
3.4 Market Packages...................................................................................................................... 25 3.4.1 Selection and Prioritization of Regional Market Packages ................................................ 25 3.4.2 Customized Market Packages ............................................................................................. 27 3.4.3 Regional ITS Needs and Customized Market Packages...................................................... 27
3.5 Architecture Interfaces ........................................................................................................... 29 3.5.1 Element Connections........................................................................................................... 29 3.5.2 Data Flows Between Elements............................................................................................ 30
4. APPLICATION OF THE REGIONAL ITS ARCHITECTURE ............................................................... 35 4.1 Functional Requirements........................................................................................................ 35 4.2 Standards.................................................................................................................................. 35 4.3 Operational Concepts.............................................................................................................. 38 4.4 Potential Agreements............................................................................................................... 45 4.5 Phases of Implementation ....................................................................................................... 47
5. USE AND MAINTENANCE PLAN FOR THE REGIONAL ITS ARCHITECTURE................................. 48 5.1 Process for Determining Architecture Conformity .............................................................. 48 5.2 Maintenance Process ............................................................................................................... 49 5.3 Procedure for Submitting ITS Architecture Changes Between Scheduled Updates......... 50
APPENDIX A – NATIONAL ITS ARCHITECTURE MARKET PACKAGE DEFINITIONS
APPENDIX B – CUSTOMIZED MARKET PACKAGES
APPENDIX C – ELEMENT FUNCTIONAL REQUIREMENTS
APPENDIX D – STAKEHOLDER DATABASE
APPENDIX E – ARCHITECTURE CONFORMANCE AND MAINTENANCE DOCUMENTATION FORM

TABLE OF CONTENTS FINAL REGIONAL ITS ARCHITECTURE REPORT – BAY REGION
1/31/2008 Bay Region ii Final Regional ITS Architecture
LIST OF FIGURES Figure 1 - Bay Regional Boundaries .......................................................................................................... 4 Figure 2 - Bay Regional ITS Architecture and Deployment Plan Development Process .......................... 7 Figure 3 - National ITS Architecture Physical Subsystem Interconnect Diagram................................... 11 Figure 4 - Bay Regional System Interconnect Diagram........................................................................... 24 Figure 5 - Example Market Package Diagram: ATMS03 – Surface Street Control ............................... 27 Figure 6 - Example Interconnect Diagram: Local Agency Public Safety Vehicles ................................ 30 Figure 7 - Example Flow Diagram: EM01-1 – Michigan State Police ................................................... 31 Figure 8 - Example Emergency Routing Diagram: EM02 – Local Agency Public Safety ..................... 32 Figure 9 - Example Two Element Flow Diagram ....................................................................................33 Figure 10 - Example Emergency Context Flow Diagram: MDOT Traveler Information Database ....... 34 Figure 11 - Process for Documenting Architecture Performance ............................................................ 52
LIST OF TABLES Table 1 - Summary of Architecture Assessment Categories...................................................................... 2 Table 2 - Bay Stakeholder Agencies and Contacts .................................................................................... 6 Table 3 - Bay Region Stakeholder Descriptions ...................................................................................... 12 Table 4 - Bay Region Inventory of ITS Elements .................................................................................... 13 Table 5 - Bay Region Market Package Prioritization by Functional Area ............................................... 26 Table 6 - Regional ITS Needs and Corresponding Market Packages ...................................................... 28 Table 7 - Bay Region Applicable ITS Standards ..................................................................................... 36 Table 8 - Bay Region Stakeholder Roles and Responsibilities ................................................................ 39 Table 9 - Bay Region Potential Agreements ............................................................................................ 46 Table 10 - Regional ITS Architecture and Deployment Plan Maintenance Summary............................. 50

LIST OF ACRONYMS
1/31/2008 Bay Region iii Final Regional ITS Architecture
AASHTO American Association of State Highway and Transportation Officials
AD Archived Data
AHS Automated Highway System
AMBER America’s Missing: Broadcast Emergency Response
ANSI American National Standards Institute
APTS Advanced Public Transportation Systems
ATIS Advanced Travel Information System
ATMS Advanced Traffic Management System
AVL Automated Vehicle Location
AVSS Advanced Vehicle Safety System
CCTV Closed Circuit Television
CJIC Criminal Justice Information Center
CRC County Road Commission
CVISN Commercial Vehicle Information Systems and Networks
CVO Commercial Vehicle Operations
DCM Data Collection and Monitoring
DMS Dynamic Message Sign
DNR Department of Natural Resources
DPW Department of Public Works
DSRC Dedicated Short Range Communication
EM Emergency Management
EMS Emergency Medical Services
EOC Emergency Operations Center
FHWA Federal Highway Administration
FTA Federal Transit Administration
HAR Highway Advisory Radio
HAZMAT Hazardous Materials
HRI Highway Rail Intersection
LIST OF ACRONYMS
1/31/2008 Bay Region iv Final Regional ITS Architecture
IDAS ITS Deployment Analysis Software
IEEE Institute of Electrical and Electronics Engineers
IMMS Incident Management Message Sets
ISO International Standards Organization
ISP Information Service Provider
ITE Institute of Transportation Engineers
ITS Intelligent Transportation System
MAC Medium Access Control
MC Maintenance and Construction
MDOT Michigan Department of Transportation
MDT Mobile Data Terminal
MITSC Michigan Intelligent Transportation Systems Center
MOU Memorandum of Understanding
MSP Michigan State Police
NEMA National Emergency Management Association
NOAA National Oceanic and Atmospheric Administration
NTCIP National Transportation Communications for ITS Protocol
NWS National Weather Service
RWIS Roadway Weather Information System
SAE Society of Automotive Engineers
SAFETEA-LU Safe, Accountable, Flexible, Efficient Transportation Equity Act – A Legacy for Users
SDO Standards Development Organization
STMF Simple Transportation Management Framework
TCP/IP Transmission Control Protocol/Internet Protocol
TEA-21 Transportation Equity Act for the 21st Century
TIP Transportation Improvement Program
TMC Transportation Management Center

LIST OF ACRONYMS
1/31/2008 Bay Region v Final Regional ITS Architecture
TOC Traffic Operations Center
TSC Transportation Service Centers
UDP/IP User Datagram Protocol/Internet Protocol
USDOT United States Department of Transportation
VIVDS Vehicle Imaging Video Detection Systems
XML Extensible Mark-up Language

1/31/2008 Bay Region 1 Final Regional ITS Architecture
1. INTRODUCTION
1.1 Project Overview
Development of a regional intelligent transportation system (ITS) architecture is one of the most important steps in planning for and implementing ITS in a region. ITS architectures provide a framework for implementing ITS projects, encourage interoperability and resource sharing among agencies, identify applicable standards to apply to projects, and allow for cohesive long-range planning among regional stakeholders. The ITS architecture allows stakeholders to plan for what they want their system to look like in the long-term, and then break out the system into smaller, more modular pieces that can be implemented over time as funding permits.
ITS architectures satisfy the conformity requirements first established in the Transportation Equity Act for the 21st Century (TEA-21) highway bill and continued in the Safe, Accountable, Flexible, Efficient Transportation Equity Act: A Legacy for Users (SAFETEA-LU) bill passed in 2005. In response to Section 5206(e) of TEA-21, the Federal Highway Administration (FHWA) issued a final rule and the Federal Transit Administration (FTA) issued a final policy that required regions implementing any ITS projects using federal funds to have an ITS architecture in place by April 2005. After this date, any ITS projects must show conformance with their regional ITS architecture in order to be eligible for funding from FHWA or FTA. Regions that had not yet deployed ITS were given four years to develop an ITS architecture after their first ITS project proceeded to final design.
In November 2006, the Michigan Department of Transportation (MDOT) began development of the Bay Regional ITS Architecture. The Regional ITS Architecture has the same geographic boundaries of the MDOT Bay Region. The Regional ITS Architecture focuses on a 20-year vision of ITS for the Bay Region. In addition, a separate ITS Deployment Plan was developed to identify and prioritize specific ITS projects recommended for the Region in order to implement the ITS architecture. The ITS Deployment Analysis Software (IDAS) was utilized to evaluate and prioritize the list of ITS projects outlined for the Bay Region.
The ITS Architecture and the ITS Deployment Plan were both developed with significant input from local, state, and federal officials. A series of four workshops were held to solicit input from stakeholders and ensure that the plans reflected the unique needs of the Region. Copies of the draft reports were provided to all stakeholders. The Regional ITS Architecture and Deployment Plan developed reflects an accurate snapshot of existing ITS deployments and future ITS plans in the Region. Needs and priorities of the Region will change over time and in order to remain effective this plan should be periodically reviewed and updated.
1.2 Document Overview
The Bay Regional ITS Architecture report is organized into five key sections:
Section 1 – Introduction
This section provides an overview of the National ITS Architecture requirements, the Bay Regional ITS Architecture, and the key features and stakeholders in the Bay Region.
Section 2 – Regional ITS Architecture Development Process
An overview of the key steps involved in developing the ITS architecture for the Bay Region is provided in this section. It includes a discussion of stakeholder involvement, architecture workshops, and the architecture development process.

1/31/2008 Bay Region 2 Final Regional ITS Architecture
Section 3 – Customization of the National ITS Architecture for the Bay Region
This section contains a summary of regional needs and details the customization of the National ITS Architecture to meet the ITS vision for the Bay Region. The market packages that were selected for the Region are included in this section and interconnects are presented, including the “sausage diagram” showing the relationships of the key subsystems and elements in the Region.
Section 4 – Application of the Regional ITS Architecture
Functional requirements and standards that apply to the Region, as indicated by the Regional ITS Architecture, are presented in Section 4. Operational concepts identifying stakeholder roles and responsibilities have been prepared and potential agreements to support the sharing of data and resources have been identified.
Section 5 – Use and Maintenance Plan for the Regional ITS Architecture
A use and maintenance plan will be developed for the Bay Regional ITS Architecture and included in this section in the Final Document. The plan will outline the procedure for updating the ITS architecture over time.
The Bay Regional ITS Architecture also contains five appendices:
Appendix A – National ITS Architecture Market Package Definitions; Appendix B – Customized Market Packages; Appendix C – Element Functional Requirements; Appendix D – Stakeholder Database; and Appendix E – Architecture Maintenance Documentation Form.
1.3 Assessment
The Final Draft of the Bay Region ITS Architecture and Deployment Plan has been assessed based on twelve items derived from both the April 8, 2001 USDOT ITS Architecture and Standards Conformity Rule/Policy and from the architecture development process described in the Regional ITS Architecture Guidance Document. A listing of these items is shown in Table 1.
Table 1 - Summary of Architecture Assessment Categories
Content Criteria Architecture Implementation Criteria
1. Architecture Scope 8. Implementation Plan (use) 2. Stakeholder Identification 9. Maintenance Plan 3. System Inventory 10. Agreements 4. Needs and Services 11. Standards Identification 5. Operational Concept 12. Project Sequencing 6. Functional Requirements 7. Interfaces/Flows

1/31/2008 Bay Region 3 Final Regional ITS Architecture
1.4 The Bay Region
1.4.1 Geographic Overview
The Bay Region is defined by the boundary of Lake Huron and Saginaw Bay to the east, the MDOT North Region to the north, the MDOT Grand Region to the west, and the MDOT University and Metro Region to the south, as shown in Figure 1. The Region encompasses all of the 13 counties of the MDOT Bay Region of Michigan.
The largest cities within the geographical boundaries of the Bay Region include Flint, Saginaw, Bay City, Midland, and Mt. Pleasant. When developing the stakeholder group, the project team coordinated with MDOT to invite the appropriate townships, cities, counties, State and Federal agencies, and area transit providers. The Bay-Metro Transit Authority, Flint-Mass Transportation Authority, and the Saginaw Transit Authority Regional Services are the primary transit providers that operate within the regional boundaries. The Bay-Metro Transit Authority provides fixed route and paratransit services within Bay County. The Flint-Mass Transportation Authority operates fixed route and paratransit services in and near Genesee County. The Saginaw Transit Authority Regional Services operates fixed route and paratransit for the urbanized Saginaw area. Table 2 in Section 1.3.4 identifies the stakeholders that participated in the process.
When developing the architecture, a 20-year vision for ITS in the Region was documented. In the ITS Deployment Plan, the 20-year time frame will be broken down into smaller time periods to prioritize and sequence the projects. The naming convention used for elements in the Bay Regional ITS Architecture is consistent with the naming convention that was used in the Grand, North, Superior, and Southwest Regions and the Statewide ITS Architecture. This consistency provides seamless connections to those other architectures without requiring that they be specifically called out. Statewide initiatives, such as statewide commercial vehicle operations and the 511 traveler information service, are referenced in the Regional ITS Architecture, but will be addressed in further detail in the Statewide ITS Architecture.
1.4.2 Transportation Infrastructure
As illustrated in Figure 1, the Region is connected by several State and Federal highways. The primary roadway facilities include I-75, I-69, US 127, US 10, and M-46.
I-75 is the only interstate in Michigan that runs north-south north of Flint. I-75 connects Detroit with Lansing and continues north through Saginaw, Bay City, and on to Grayling in the North Region. I-69 runs east-west through the southern portion of the Bay Region. It connects Lansing in the University Region with Flint and continues east to Port Huron on the Lake Huron coastline in the Metro Region. US 127 is one of the major north-south roadways that connects Lansing in the University Region with Mt. Pleasant. US 127 continues north of Mt. Pleasant, running parallel with I-75 until they intersect just south of Grayling in the North Region. US 10 runs east-west through the Bay Region from US 127 on the west side to Midland and Bay City. M-46 is another east-west route that connects the Grand Region with Saginaw and continues east to Port Sanilac on the Lake Huron coastline.

1/31/2008
Figure 1 - Bay Regional Boundaries

1/31/2008 Bay Region 5 Final Regional ITS Architecture
1.4.3 Bay Region ITS Plans
The Bay Region began the development of a Regional ITS Architecture in 2006 when MDOT contracted with a consultant to develop several regional ITS architectures and deployment plans in the State of Michigan. Version 5.1 of the National ITS Architecture was used in the architecture development.
It is important to recognize the initial deployment of ITS infrastructure in a region because as of April 2005, in order for a region to receive funding for ITS projects from the Highway Trust Fund, the United States Department of Transportation (USDOT) requires that the region have an ITS architecture developed. This requirement only applies to regions with existing ITS infrastructure deployed. For regions that do not have any ITS infrastructure deployed, the USDOT requires that they have an ITS architecture within four years of their first ITS project entering final design.
The Bay Region includes Genesee County, which approved a Regional ITS Architecture in December 2002. Genesee County has several deployments and those existing and planned ITS components are included in the Bay Region ITS Regional Architecture. The Bay Region also has several ITS components deployed outside of Genesee County. Examples of implementations in the Region include closed loop signal systems, portable dynamic message signs (DMS), and weigh-in-motion sensors. As the Bay Region pursues funding opportunities for proposed projects, it will be necessary to show that a project fits within the ITS architecture developed for the Region.
1.4.4 Stakeholders
Due to the fact that ITS often transcends traditional transportation infrastructure, it is important to involve non-traditional stakeholders in the architecture development and visioning process. Input from these stakeholders, both public and private, is a critical part of defining the interfaces, integration needs, and overall vision for ITS in a region.
Table 2 contains a listing of stakeholders in the Bay Region who have participated in the project workshops or provided input to the study team as to the needs and issues that should be considered as part of the Regional ITS Architecture. Other stakeholders that were invited to participate but were not able to attend were provided minutes of workshops and copies of reports to encourage their participation as much as possible. Appendix D contains a copy of the stakeholder database and workshop attendance records.

1/31/2008 Bay Region 5 Final Regional ITS Architecture
Table 2 - Bay Stakeholder Agencies and Contacts
Stakeholder Agency Address Contact Bay City Area Transportation Study (BCATS) - Bay County
515 Center Avenue Bay City, Michigan 48708
Dave Engelhardt
Bay County Road Commission 2600 East Beaver Road Kawkawlin, Michigan 48631
James Lillo
Bay Metro Transit 1510 North Johnson Street Bay City, Michigan 48708
Eric Sprague
Bay Metro Transit 1510 North Johnson Street Bay City, Michigan 48708
Glenn Cardinali
ECMPDR (Regional Planning Commission) 3144 Davenport Avenue, Suite 200 Saginaw, Michigan 48602
Anamika Laad
FHWA - HAD -MT 400 Seventh Street, SW Washington, DC 20590
Tim Crothers
FHWA - Michigan 315 West Allegan, Suite 201 Lansing, Michigan 48933
Morrie Hoevel
Genesee County Metropolitan Planning Commission
1101 Beach Street Flint, Michigan 48502
Sharon Gregory
Genesee County Road Commission 211 West Oakley Street Flint, Michigan 48503
Kenneth Johnson
Genesee County Road Commission 211 West Oakley Street Flint, Michigan 48503
Christina Michael
Genesee County Road Commission 211 West Oakley Street Flint, Michigan 48503
Bonnie Wood
Gratiot County Road Commission 214 East Center Street Ithaca, Michigan 48847
Ray Welke
Local Agency Programs, MDOT - Lansing 425 West Ottawa Lansing, Michigan 48909
Jim D'Lamater
MDOT - Bay City TSC 2590 E. Wilder Road Bay City, Michigan 48706
Louis Taylor
MDOT - Bay Region 55 East Morley Drive Saginaw, Michigan 48601
Wendy Cloutier
MDOT - Bay Region 55 East Morley Drive Saginaw, Michigan 48601
Steve Palmer
MDOT - Bay Region 55 East Morley Drive Saginaw, Michigan 48601
Linda Burchell
MDOT - Bay Region 55 East Morley Drive Saginaw, Michigan 48601
Jay Reithel
MDOT - Cass City TSC 6867 East Cass City Road Cass City, Michigan 48726
Doug Wilson
MDOT - Central Maintenance 6333 Old Lansing Road Lansing, Michigan 48917
Tim Croze
MDOT - Davison TSC 9495 East Potter Road Davison, Michigan 48423
David Thorp
MDOT - ITS Program Office 425 W. Ottowa Street, Mail Code B235 Lansing, Michigan 48933
Greg Krueger
MDOT - Metro Region 18101 West Nine Mile Road Southfield, Michigan 48075
Collin Castle
MDOT - Metro Region 18101 West Nine Mile Road Southfield, Michigan 48075
Michelle Mueller
MDOT – MT. Pleasant TSC 1212 Corporate Drive Mt. Pleasant, Michigan 48858
Terry Palmer
MDOT – Planning 425 W. Ottowa Street, Mail Code B235 Lansing, Michigan 48933
Dave Schade
Saginaw County MPO 111 South Michigan Avenue Saginaw, Michigan 48602
Doug Bell
Saginaw County Road Commission 3020 Sheridan Avenue Saginaw, Michigan 48605
Bill Miller
Saginaw Metropolitan Area Transportation Study (SMATS) and SCMPC
615 Court Street Saginaw, Michigan 48602
Phil Grimaldi
Saginaw Transit Authority Regional Services 301 East Genesee, Suite 500 Saginaw, Michigan 48607
Bill Wright
Tuscola County Road Commission 1733 Mertz Road Caro, Michigan 48723
Michelle Zawerucha

1/31/2008 Bay Region 7 Final Regional ITS Architecture
2. REGIONAL ITS ARCHITECTURE DEVELOPMENT PROCESS Development of the Regional ITS Architecture and Deployment Plan for the Bay Region relied heavily on stakeholder input to ensure that the architecture reflected local needs. A series of four workshops was held with stakeholders to gather input, and draft documents were made available to stakeholders for review and comment.
The process followed for the Bay Region was designed to ensure that stakeholders could provide input and review for the development of the Region’s ITS Architecture and Deployment Plan. Figure 2 illustrates the process followed.
Figure 2 - Bay Regional ITS Architecture and Deployment Plan Development Process
A total of four workshops with stakeholders over a period of eleven months were used to develop the Bay Regional ITS Architecture and Deployment Plan. These workshops included:
Kick-Off Workshop – December 7, 2006; Regional ITS Architecture Development Workshop – January 18, 2007; ITS Deployment Plan Workshop – August 3, 2007; and Comment Resolution Workshop – December 5, 2007.
Key components of the process are described below:
Task 1 – Kick-Off Workshop and ITS Needs: A stakeholder group was identified that included representatives from regional transportation, transit, and emergency management/public safety agencies. The group was invited to the project Kick-Off Workshop where ITS needs for the Region were identified.
Task 2 – System Inventory: Collecting information for the system inventory began at the Kick-Off Workshop through discussions with the stakeholders to determine existing and planned ITS elements in the Region. After the Kick-Off Workshop, follow-up calls were conducted with several local stakeholders to gather additional input.
Task 3 – ITS Architecture Workshop and ITS Architecture Development: The purpose of the Regional ITS Architecture Workshop was to review the system inventory with stakeholders and develop the Bay Regional ITS Architecture. Training on the National ITS Architecture was integrated into the workshop so that key elements of the architecture, such as market packages, could be explained prior to
Kick-off
Workshop and ITS Needs
ITS Deployment
Plan Workshop and ITS Deployment
Plan Development
Comment Resolution Workshop and Final Report
System Inventory
ITS
Architecture Workshop
and ITS
Architecture Development

1/31/2008 Bay Region 8 Final Regional ITS Architecture
the selection and editing of these elements. The result of the Regional ITS Architecture Workshop was an ITS Architecture for the Bay Region that included a system inventory, interconnect diagram, customized market packages, and relevant ITS standards. Following the workshop, a Draft Regional ITS Architecture document was prepared and sent to stakeholders for review and comment.
Task 4 – ITS Deployment Plan Workshop and ITS Deployment Plan Development: A draft project listing for the Region will be presented to stakeholders at the Regional ITS Deployment Plan Workshop. Stakeholders will be asked to provide input on the recommended projects, responsible agencies, associated costs, and deployment timeframe. Following the workshop, a Draft Regional ITS Deployment Plan document was prepared and sent to stakeholders for review and comment
Task 5 – Comment Resolution Workshop and Final Report: A Comment Resolution Workshop was held with stakeholders to review the Draft Regional ITS Architecture and the Draft Regional ITS Deployment Plan. Next steps for the Region were also discussed. Comments were incorporated and a final Regional ITS Architecture and Regional ITS Deployment Plan were developed.

1/31/2008 Bay Region 9 Final Regional ITS Architecture
3. CUSTOMIZATION OF THE NATIONAL ITS ARCHITECTURE FOR THE BAY REGION
3.1 Systems Inventory
An important initial step in the architecture development process is to establish an inventory of existing ITS elements. At the Kick-Off Workshop and through subsequent discussions with agency representatives, Bay Region stakeholders provided the team with information about existing and planned systems that would play a role in the Region’s ITS architecture.
The National ITS Architecture has eight groups of ITS service areas. Existing, planned, and future systems in the Region were identified in the following service areas:
Traffic Management – includes the Michigan Intelligent Transportation Systems Center (MITSC) located in Detroit as well as other existing and future TMCs and traffic operations centers (TOCs), detection systems, closed circuit television (CCTV) cameras, fixed and portable dynamic message signs, and other related technologies.
Emergency Management – includes emergency operations/management centers, improved information sharing among traffic and emergency services, automated vehicle location (AVL) on emergency vehicles, traffic signal preemption for emergency vehicles, and wide-area alerts.
Maintenance and Construction Management – includes work zone management, roadway maintenance and construction information, winter maintenance, and road weather detection systems.
Public Transportation Management – includes transit and paratransit AVL, dispatch systems, transit travel information systems, electronic fare collection, and transit security.
Commercial Vehicle Operations – includes coordination with Commercial Vehicle Information Systems and Networks (CVISN) efforts, and hazardous material (HAZMAT) management
Traveler Information – includes broadcast traveler information such as 511, traveler information kiosks, and highway advisory radio (HAR).
Archived Data Management – includes electronic data management and archiving systems. Vehicle Safety – includes collision avoidance and automated highway systems.
3.2 Regional Needs
Needs from the Region were identified by Stakeholders at the Kick-Off Workshop held in December of 2006. The needs identified provided guidance for determining which market packages should be included in the architecture. Stakeholders identified ITS needs for the Bay Region in the following areas:
Traffic management; Emergency management; Maintenance and construction management; Public transportation management; Commercial vehicle operations; Traveler information; and Archived data management.

1/31/2008 Bay Region 10 Final Regional ITS Architecture
Section 3.4.3 contains additional information about the specific needs identified and relates those needs to the market packages that document the corresponding ITS service.
3.3 Element Customization
The inventory and needs documented at the Kick-Off Workshop are the starting point for developing an ITS architecture for the Bay Region. These ITS systems and components are used to customize the National ITS Architecture and create the architecture for the Bay Region.
When developing customized elements, the stakeholder group agreed not to create individual traffic, maintenance, and emergency management elements for all of the individual cities within the Bay Region. The smaller communities in the Region were documented as part of the local agency elements. This documentation allows the communities to be included in the Regional ITS Architecture, and therefore eligible to use federal monies on potential future ITS deployments.
3.3.1 Subsystems and Terminators
Each identified system or component in the Bay Region ITS inventory was mapped to a subsystem or terminator in the National ITS Architecture. Subsystems and terminators are the entities that represent systems in ITS.
Subsystems are the highest level building blocks of the physical architecture, and the National ITS Architecture groups them into four major classes: Centers, Field, Vehicles, and Travelers. Each of these major classes includes various components that represent a set of transportation functions (or processes). Each set of functions is grouped under one agency, jurisdiction, or location, and correspond to physical elements such as: traffic operations centers, traffic signals, or vehicles. Figure 3 shows the National ITS Architecture subsystems. This figure, also known as the “sausage diagram,” is a standard interconnect diagram, showing the relationships of the various subsystems within the architecture. A customized interconnect diagram for the Bay Region is shown in Figure 4. Communication functions between the subsystems are represented in the ovals. Fixed-point to fixed-point communications include not only twisted pair and fiber optic technologies, but also wireless technologies such as microwave and spread spectrum.
Terminators are the people, systems, other facilities, and environmental conditions outside of ITS that need to communicate or interface with ITS subsystems. Terminators help define the boundaries of the National ITS Architecture as well as a regional system. Examples of terminators include: drivers, weather information providers, and information service providers.

1/31/2008 Bay Region 11 Final Regional ITS Architecture
Travelers
Vehicles Field
CentersMaintenance &ConstructionManagement
Archived DataManagement
PersonalInformation
Access
Commercial Vehicle
Administration
Toll Administration
EmergencyManagement
Fleet andFreight
Management
TransitManagement
EmissionsManagement
RemoteTravelerSupport
Wide Area Wireless (Mobile) Communications
InformationServiceProvider
TrafficManagement
CommercialVehicle
EmergencyVehicle
Vehicle
TransitVehicle
Vehi
cle
to V
ehic
le C
omm
unic
atio
ns
Maint & ConstVehicle
Ded
icat
ed S
hort
Ran
geC
omm
unic
atio
ns
Toll Collection
CommercialVehicleCheck
Roadway
ParkingManagement
SecurityMonitoring
Term
inat
ors
Fixed-Point to Fixed-Point Communications
Figure 3 - National ITS Architecture Physical Subsystem Interconnect Diagram
3.3.2 ITS Inventory by Stakeholder
Each stakeholder is associated with one or more systems or elements (subsystems and terminators) that make up the transportation system in the Bay Region. A listing of stakeholders as identified in the architecture can be found in Table 3 along with a description of the stakeholder. For example, rather than individually documenting each of the smaller local agencies in the Region, a single stakeholder was created for local agencies which represents the counties, cities, and towns not specifically called out in the architecture. Table 4 sorts the inventory by stakeholder so that each stakeholder can easily identify and review all of the architecture elements associated with their agency. The table includes the status of the element. In many cases, an element classified as existing might still need to be enhanced to attain the service level desired by the Region.

1/31/2008 Bay Region 12 Final Regional ITS Architecture
Table 3 - Bay Region Stakeholder Descriptions
Stakeholder Stakeholder Description Bay Metro Transit Authority Transit provider that operates fixed route and paratransit in Bay County.
Department of Homeland Security The Department of Homeland Security is responsible for coordinating with multiple agencies to secure the nation's borders and protect the infrastructure and citizens.
DNR Michigan Department of Natural Resources is responsible for the operations and maintenance of all Parks and Recreation facilities including infrastructure components on those properties. DNR utilizes some technologies to provide information to visitors at Parks and Recreation facilities.
Financial Institution Banks involved in the transfer of funds for fare collection as well as for other fee based transportation services. Can handle the exchange of money for transit electronic fare collection or toll collection.
Flint-Mass Transportation Authority Transit provider that operates fixed route and paratransit in and near Genesee County.
Local Agency Local government includes municipalities, counties, and townships and covers all departments within those agencies that deal with traffic, public safety, emergency management, public works and school transportation agencies. Local Agencies include: Bay City, Bay CRC, City of Burton, City of Clio, City of Davison, City of Fenton, City of Flint, City of Flushing, City of Grand Blanc, City of Linden, City of Midland, City of Montrose, City of Mount Morris, City of Mt. Pleasant, City of Saginaw, City of Swartz Creek, Genesee CRC, Gratiot CRC, Isabella CRC, Midland CRC, Saginaw CRC.
MDOT The Michigan Department of Transportation is responsible for the planning, design, construction, maintenance and operation for all aspects of a comprehensive integrated transportation system in the State of Michigan. Some of these roles are achieved through contract services with local agencies and private entities.
Media Local media outlets. This can include television stations, newspapers, radio stations and their associated websites.
MSP Michigan State Police is the state law enforcement agency that enforces traffic safety laws as well as commercial vehicle regulations.
NOAA National Oceanic and Atmospheric Administration gathers weather information and issues severe weather warnings.
Other Agencies This stakeholder represents a wide variety of agencies. The associated elements are groups of agencies or providers that do not have a primary stakeholder agency.
Other Elements Other elements include potential obstacles, roadway environment and other vehicles.
Private Information Service Provider
Private sector business responsible for the gathering and distribution of traveler information. This service is typically provided on a subscription basis.
Private Operators Private Operators manage privately owned resources that interconnect with public sector elements and sub-systems of the Regional Architecture.
Private Transportation Providers Private transportation service providers such as taxis and shuttle services.
Rail Operators Companies that operate trains and/or are responsible for the maintenance and operations of railroad tracks.
Regional Demand Response Transit Providers
Transit providers in the Bay region aside from Bay Metro Transit Authority, Flint-Mass Transportation Authority and Saginaw Transit Authority Regional Services that operate paratransit service in the region. The agencies include Caro Area Transit Authority, Midland Dial-A-Ride and Greater Lapeer Transit Authority.
Saginaw Transit Authority Regional Services
Transit provider that operates fixed route and paratransit for urbanized Saginaw area.
System Users All of the users of the transportation system.
1/31/2008 Bay Region 13 Final Regional ITS Architecture
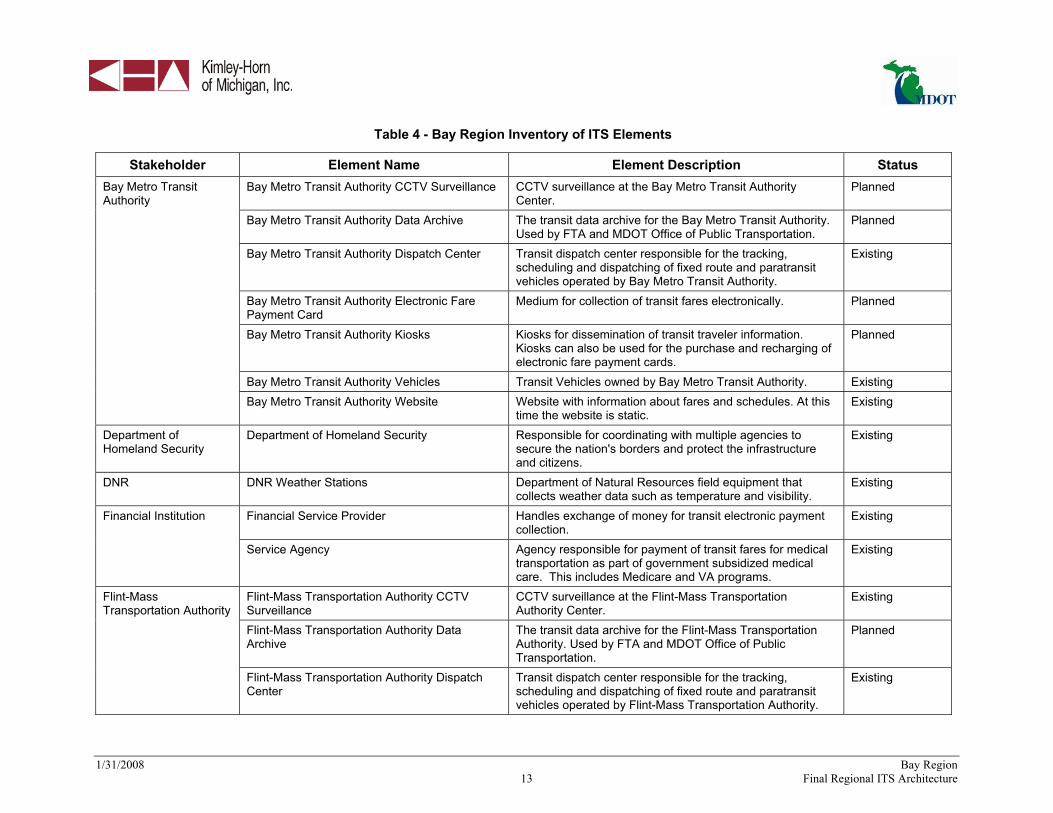
Table 4 - Bay Region Inventory of ITS Elements
Stakeholder Element Name Element Description Status Bay Metro Transit Authority CCTV Surveillance CCTV surveillance at the Bay Metro Transit Authority
Center. Planned
Bay Metro Transit Authority Data Archive The transit data archive for the Bay Metro Transit Authority. Used by FTA and MDOT Office of Public Transportation.
Planned
Bay Metro Transit Authority Dispatch Center Transit dispatch center responsible for the tracking, scheduling and dispatching of fixed route and paratransit vehicles operated by Bay Metro Transit Authority.
Existing
Bay Metro Transit Authority Electronic Fare Payment Card
Medium for collection of transit fares electronically. Planned
Bay Metro Transit Authority Kiosks Kiosks for dissemination of transit traveler information. Kiosks can also be used for the purchase and recharging of electronic fare payment cards.
Planned
Bay Metro Transit Authority Vehicles Transit Vehicles owned by Bay Metro Transit Authority. Existing
Bay Metro Transit Authority
Bay Metro Transit Authority Website Website with information about fares and schedules. At this time the website is static.
Existing
Department of Homeland Security
Department of Homeland Security Responsible for coordinating with multiple agencies to secure the nation's borders and protect the infrastructure and citizens.
Existing
DNR DNR Weather Stations Department of Natural Resources field equipment that collects weather data such as temperature and visibility.
Existing
Financial Service Provider Handles exchange of money for transit electronic payment collection.
Existing Financial Institution
Service Agency Agency responsible for payment of transit fares for medical transportation as part of government subsidized medical care. This includes Medicare and VA programs.
Existing
Flint-Mass Transportation Authority CCTV Surveillance
CCTV surveillance at the Flint-Mass Transportation Authority Center.
Existing
Flint-Mass Transportation Authority Data Archive
The transit data archive for the Flint-Mass Transportation Authority. Used by FTA and MDOT Office of Public Transportation.
Planned
Flint-Mass Transportation Authority
Flint-Mass Transportation Authority Dispatch Center
Transit dispatch center responsible for the tracking, scheduling and dispatching of fixed route and paratransit vehicles operated by Flint-Mass Transportation Authority.
Existing

1/31/2008 Bay Region 14 Final Regional ITS Architecture
Table 4 - Bay Region Inventory of ITS Elements
Stakeholder Element Name Element Description Status Flint-Mass Transportation Authority Electronic Fare Payment Card
Medium for collection of transit fares electronically. Existing
Flint-Mass Transportation Authority Kiosks Kiosks for dissemination of transit traveler information. Kiosks can also be used for the purchase and recharging of electronic fare payment cards.
Planned
Flint-Mass Transportation Authority Vehicles Transit Vehicles owned by Flint-Mass Transportation Authority.
Existing
Flint-Mass Transportation Authority (continued)
Flint-Mass Transportation Authority Website Website with information about fares and schedules. At this time the website is static.
Planned
Bay City Drawbridge Control Equipment Roadside equipment located on Bay City drawbridges that close approaching roadways or stop traffic prior to the drawbridge opening to waterway traffic.
Planned
Bay City Drawbridge Notification Equipment Roadside equipment located on Bay City drawbridges that send notifications when the drawbridge is open for waterway traffic.
Planned
City of Flint 911 911 Dispatch for the City of Flint. Central Dispatch is responsible for the dispatch of all Flint public safety vehicles (police and fire).
Existing
County 911 Dispatch Central Dispatch is responsible for the dispatch of all public safety vehicles (police and fire). After hours Central Dispatch will also dispatch the Street Department on-call emergency responder. Counties included are Clare, Gladwin, Arenac, Isabella, Midland, Bay, Gratiot, Saginaw, Huron, Tuscola, Sanilac, Genesee and Lapeer.
Existing
County Road Commission Contract agency managed by a county that oversees road maintenance and snow removal on local and MDOT facilities.
Existing
County Road Commission Equipment Repair Facility responsible for maintenance of County Road Commission vehicles.
Planned
County Road Commission Maintenance Vehicles
County Road Commission vehicles used in maintenance operations.
Existing
Fenton Police Department Municipal police responsible for enforcement within the City of Fenton.
Existing
Local Agency
Local Agency Airports Municipal and county owned airports. Existing

1/31/2008 Bay Region 15 Final Regional ITS Architecture
Table 4 - Bay Region Inventory of ITS Elements
Stakeholder Element Name Element Description Status Local Agency CCTV Cameras Roadside equipment on local routes used for traffic
condition monitoring and management of incidents. Existing
Local Agency DPW Contract agency managed by a local municipality that oversees road maintenance and snow removal on local and MDOT facilities.
Existing
Local Agency DPW Vehicles Local Government vehicles used in maintenance operations. Existing Local Agency Field Sensors Roadway equipment on local routes used to detect vehicle
volumes and/or speeds. This information is used in the operation of the traffic signal system and collected by the TOC.
Planned
Local Agency Parking Management System System operated by a local agency that monitors available vehicle parking at key parking facilities.
Planned
Local Agency Public Safety Vehicles Local law enforcement, fire and EMS vehicles. Includes the ITS equipment installed on the cruisers (AVL, MDTs, etc.).
Existing
Local Agency Ride Sharing Program System used for matching riders with similar origins and destinations to promote carpooling.
Planned
Local Agency Speed Monitoring Equipment Speed monitoring equipment owned and operated by a local agency. Includes radar, lidar, etc.
Planned
Local Agency TOC Local Traffic Operations Center responsible for municipal signal system operations.
Planned
Local Agency Traffic Signals Multiple traffic signals interconnected and operated by a Local Agency.
Existing
Local Agency Website Website for the Local Agencies. Existing
Local Agency (continued)
Local Emergency Operations Center Central command and control facility responsible for carrying out the principles of emergency preparedness and emergency management, or disaster management functions at a strategic level in an emergency situation.
Planned
Bay City Drawbridge Management Center Central facility that monitors vehicle and waterway traffic and controls drawbridge traffic in Bay City.
Planned
Maintenance and Construction Field Personnel MDOT field forces that operate and maintain MDOT facilities.
Existing
MDOT
MDOT Animal Crossing Detection Roadside equipment that monitors roadway for animal activity that could impact traffic.
Planned

1/31/2008 Bay Region 16 Final Regional ITS Architecture
Table 4 - Bay Region Inventory of ITS Elements
Stakeholder Element Name Element Description Status MDOT Animal Crossing Warning System In-vehicle and roadside equipment that can notify drivers
about possible animal activity. Planned
MDOT Anti-Icing Field Equipment Roadside equipment located along MDOT routes that collects weather data such as temperature and visibility.
Planned
MDOT Bay Region Commercial Vehicle Parking Management System
System operated on MDOT routes that monitors available commercial vehicle parking at rest areas and other key locations.
Planned
MDOT Bay Region Maintenance Management System
Central system used to track and plan maintenance on MDOT Bay Region vehicles.
Planned
MDOT Bay Region Office The Bay Region Office serves as a data collection and dissemination point for traffic information in the Bay Region. This includes coordination with other agencies such as public safety, emergency management, and transit.
Existing
MDOT Bay Region Transportation Service Centers
MDOT field office that oversees road construction and maintenance on MDOT facilities. Most maintenance and snow removal in this region is achieved through contract agencies.
Planned
MDOT CCTV Cameras Roadside equipment located on local roadways used for traffic condition monitoring and management of incidents.
Planned
MDOT Commercial Vehicle Permitting System MDOT system for tracking and monitoring oversize and overweight permits for commercial vehicles.
Planned
MDOT DMS Roadside equipment on MDOT routes used to share traveler information with motorists through dynamic messaging.
Planned
MDOT Drawbridge Control Equipment Roadside equipment located on MDOT drawbridges that close approaching roadways or stop traffic prior to the drawbridge opening to waterway traffic.
Existing
MDOT Drawbridge Management Center Management of the waterways used by boats and ferries and the roadways used by vehicles.
Planned
MDOT Drawbridge Notification Equipment Roadside equipment located on MDOT drawbridges that send notifications when the drawbridge is open for waterway traffic.
Existing
MDOT (continued)
MDOT ESS Environmental sensor stations located on MDOT routes that collect information about the roadways such as temperature and moisture levels.
Planned
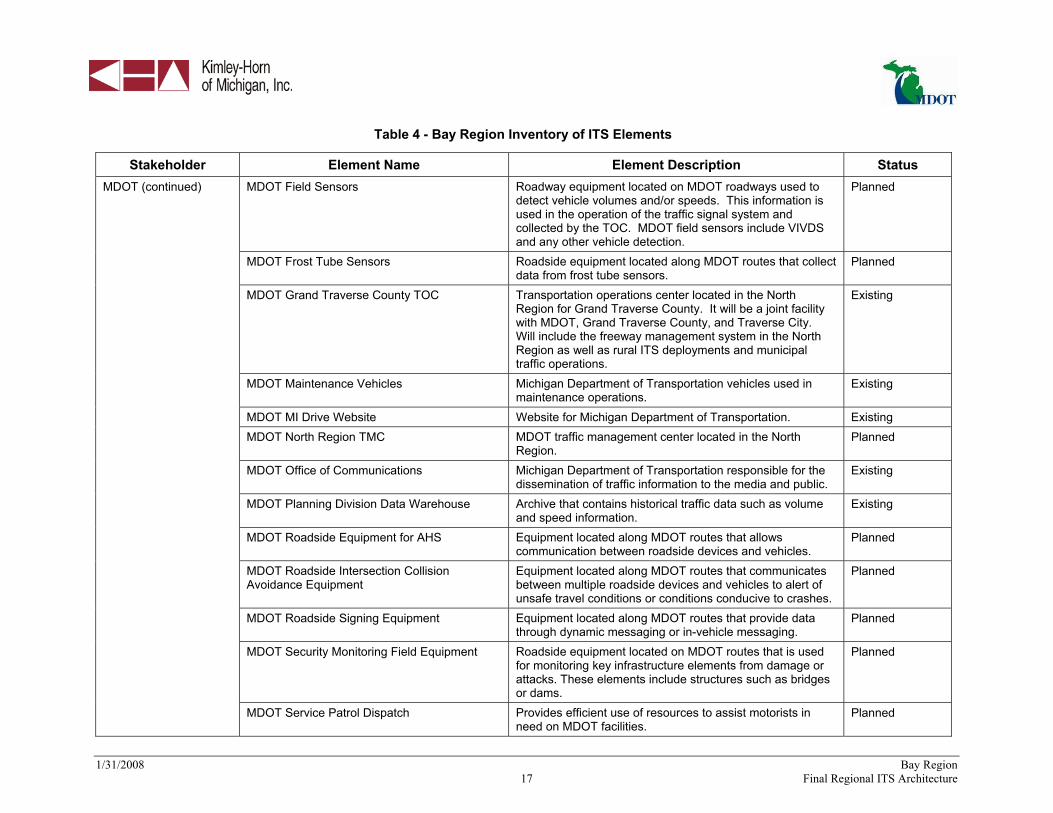
1/31/2008 Bay Region 17 Final Regional ITS Architecture
Table 4 - Bay Region Inventory of ITS Elements
Stakeholder Element Name Element Description Status MDOT Field Sensors Roadway equipment located on MDOT roadways used to
detect vehicle volumes and/or speeds. This information is used in the operation of the traffic signal system and collected by the TOC. MDOT field sensors include VIVDS and any other vehicle detection.
Planned
MDOT Frost Tube Sensors Roadside equipment located along MDOT routes that collect data from frost tube sensors.
Planned
MDOT Grand Traverse County TOC Transportation operations center located in the North Region for Grand Traverse County. It will be a joint facility with MDOT, Grand Traverse County, and Traverse City. Will include the freeway management system in the North Region as well as rural ITS deployments and municipal traffic operations.
Existing
MDOT Maintenance Vehicles Michigan Department of Transportation vehicles used in maintenance operations.
Existing
MDOT MI Drive Website Website for Michigan Department of Transportation. Existing MDOT North Region TMC MDOT traffic management center located in the North
Region. Planned
MDOT Office of Communications Michigan Department of Transportation responsible for the dissemination of traffic information to the media and public.
Existing
MDOT Planning Division Data Warehouse Archive that contains historical traffic data such as volume and speed information.
Existing
MDOT Roadside Equipment for AHS Equipment located along MDOT routes that allows communication between roadside devices and vehicles.
Planned
MDOT Roadside Intersection Collision Avoidance Equipment
Equipment located along MDOT routes that communicates between multiple roadside devices and vehicles to alert of unsafe travel conditions or conditions conducive to crashes.
Planned
MDOT Roadside Signing Equipment Equipment located along MDOT routes that provide data through dynamic messaging or in-vehicle messaging.
Planned
MDOT Security Monitoring Field Equipment Roadside equipment located on MDOT routes that is used for monitoring key infrastructure elements from damage or attacks. These elements include structures such as bridges or dams.
Planned
MDOT (continued)
MDOT Service Patrol Dispatch Provides efficient use of resources to assist motorists in need on MDOT facilities.
Planned

1/31/2008 Bay Region 18 Final Regional ITS Architecture
Table 4 - Bay Region Inventory of ITS Elements
Stakeholder Element Name Element Description Status MDOT Service Patrol Vehicles Fully equipped vehicles that provide motorist assistance to
vehicles in need on MDOT facilities. Planned
MDOT Speed Monitoring Equipment Speed monitoring equipment owned and operated by the Michigan Department of Transportation. Includes radar, lidar, etc.
Planned
MDOT Statewide TMC - Lansing MDOT traffic management center located in Lansing. Planned MDOT Superior Region TMC MDOT traffic management center located in the Superior
Region. Planned
MDOT Traffic Signals Multiple traffic signals interconnected and operated by MDOT.
Existing
MDOT Traveler Information Database MDOT maintained database for collecting and disseminating road condition data about construction and maintenance activities, incidents, and special events.
Planned
MDOT Traveler Information Kiosks Interactive kiosks that provides users the ability to request and received transportation information.
Planned
MDOT Weigh-in-Motion In-road equipment that monitors vehicle weights. Existing MDOT West Michigan TMC Co-located traffic management center in Traverse City.
Responsible for the operation of the ITS equipment located in Traverse City and the surrounding areas in the North Region.
Planned
MDOT Work Zone Safety Monitoring Equipment Portable ITS equipment that can be used in work zones to more efficiently manage traffic and provide traveler information. Includes CCTV, vehicle detection, and/or DMS.
Planned
Michigan 511 System 511 Traveler information system central server. Planned Michigan 511 Voice Response System Michigan 511 Interactive Voice Response system. This is
the customer interface component of the 511 system. Planned
MITSC MDOT traffic management center located in the Metro Region.
Existing
MDOT (continued)
Other MDOT Region TSC’s Local MDOT Transportation Service Centers outside of the Bay Region that oversee the operations and maintenance on MDOT facilities.
Existing
Media Local Print and Broadcast Media Local media that provide traffic or incident information to the public.
Existing

1/31/2008 Bay Region 19 Final Regional ITS Architecture
Table 4 - Bay Region Inventory of ITS Elements
Stakeholder Element Name Element Description Status CJIC Database Criminal Justice Information Center Database stores
criminal justice data and can be accessed by multiple agencies.
Existing
Michigan Intelligence Operations Center (MIOC)
Michigan Intelligence Operations Center. Provides 24-hour statewide information sharing among local, state, and federal public safety agencies and private sector organizations in order to facilitate the collection, analysis, and dissemination of intelligence relevant to terrorism and public safety.
Existing
MSP District 3 - Saginaw Michigan State Police dispatch for the Bay Region. Provides call-taking and dispatch for public safety agencies.
Existing
MSP Headquarters - East Lansing Michigan State Police headquarters that oversees operations of MSP.
Existing
MSP Motor Carrier Division Responsible for monitoring commercial vehicle regulations on MDOT routes.
Existing
MSP Office of Highway Safety Planning Manages crash data for MDOT routes. Existing MSP Toll Free Winter Road Conditions Phone Number
Winter weather information operated from November through March to share winter weather conditions as received.
Existing
MSP Vehicles Public Safety vehicles owned and operated by Michigan State Police. Includes the ITS equipment installed on the cruisers (AVL, MDTs, etc.).
Existing
MSP
MSP Winter Travel Advisory Website Traveler Information website operated by Michigan State Police for dissemination of winter weather advisories.
Existing
National Weather Service Provides official US weather, marine, fire and aviation forecasts, warnings, meteorological products, climate forecasts, and information about meteorology.
Existing NOAA
NWS Weather Stations National Weather Service Field equipment that collects weather data such as temperature and visibility.
Existing
MBS International Airport Midland Bay City Saginaw International Airport is a municipal airport. Tri-owned by three municipalities.
Planned Other Agencies
Multimodal Transportation Service Provider Agency that offers services across multiple transportation modes.
Planned

1/31/2008 Bay Region 20 Final Regional ITS Architecture
Table 4 - Bay Region Inventory of ITS Elements
Stakeholder Element Name Element Description Status Private Concierge Provider Private entities that provides customized services to the
traveler. This service is usually subscription based. Existing
School Transportation Agencies Agencies responsible for operating school bus fleets. Existing Potential Obstacles Obstacles that could interfere with the safe operation of
vehicles. Existing
Other Elements (continued)
Roadway Environment All objects and conditions in the vicinity of the traveler that can affect the operations of the traveler.
Existing
Private Sector ISP Private entities that collect and disseminate traffic information.
Existing Private Information Service Provider
Private Sector Traveler Information Services Website sponsored by a private entity. Often this information is provided through a subscription.
Existing
Contractor Smart Work Zone Equipment Smart Work Zone Equipment owned by private contractor. Portable ITS equipment that can be used in work zones to more efficiently manage traffic and provide traveler information. Includes CCTV, vehicle detection, and/or DMS.
Existing
Private Fleet Management Systems A way to track and manage the contents private commercial vehicle fleets carry.
Existing
Private Fleet Operators Private companies that proactively manage and operate their fleet routing. Includes reactions to incidents and possible delays.
Existing
Private Operators
Private Parking Operator System operated on private property that monitors available commercial vehicle parking.
Existing
Private Transportation Providers
Private Transportation Providers Private providers of transportation services in the Region such as taxis and intercity bus services.
Planned
Rail Operators Rail Operator Wayside Equipment Equipment located along the tracks including railroad crossing gates, bells, and lights as well as the interface to the traffic signal controller indicating the presence of a train.
Planned
Regional Demand Response Transit Providers CCTV Surveillance
CCTV surveillance at the Regional Demand Response Transit Providers Center.
Planned Regional Demand Response Transit Providers Regional Demand Response Transit Providers
Data Archive The transit data archive for the Regional Demand Response Transit Providers. Used by FTA and MDOT Office of Public Transportation.
Planned

1/31/2008 Bay Region 21 Final Regional ITS Architecture
Table 4 - Bay Region Inventory of ITS Elements
Stakeholder Element Name Element Description Status Regional Demand Response Transit Providers Dispatch Center
Transit dispatch center responsible for the tracking, scheduling and dispatching of demand response vehicles operated by Regional Demand Response Transit Providers.
Existing
Regional Demand Response Transit Providers Electronic Fare Payment Card
Medium for collection of transit fares electronically. Planned
Regional Demand Response Transit Providers Vehicles
Transit Vehicles owned by Regional Demand Response Transit Authority.
Existing
Regional Demand Response Transit Providers (continued)
Regional Demand Response Transit Providers Website
Website with information about fares and schedules. At this time the website is static.
Existing
STARS CCTV Surveillance CCTV surveillance at the Saginaw Transit Authority Regional Services.
Planned
STARS Data Archive The transit data archive for the Saginaw Transit Authority Regional Services. Used by FTA and MDOT Office of Public Transportation.
Planned
STARS Dispatch Center Transit dispatch center responsible for the tracking, scheduling and dispatching of fixed route and paratransit vehicles operated by Saginaw Transit Authority Regional Services.
Existing
STARS Electronic Fare Payment Card Medium for collection of transit fares electronically. Planned STARS Kiosks Kiosks for dissemination of transit traveler information.
Kiosks can also be used for the purchase and recharging of electronic fare payment cards.
Planned
Saginaw Transit Authority Regional Services
STARS Website Website with information about fares and schedules. At this time the website is static.
Existing
Archived Data Users Those who request information from the data archive systems.
Planned
Commercial Vehicles Privately owned commercial vehicles that travel throughout the Region. Included in the architecture to cover HAZMAT incident reporting.
Existing
Driver Individual operating a vehicle on roadways within the Region.
Existing
Other Vehicles Vehicles outside of the control of the driver. Existing
System Users
Private Travelers Personal Computing Devices Computing devices that travelers use to access public information.
Existing

1/31/2008 Bay Region 22 Final Regional ITS Architecture
Table 4 - Bay Region Inventory of ITS Elements
Stakeholder Element Name Element Description Status Private Vehicles Vehicles operated by the public. Existing STARS Vehicles Transit Vehicles owned by STARS. Existing
System Users (continued)
Traveler Individual operating a vehicle on roadways within the Region.
Existing
1/31/2008 Bay Region 23 Final Regional ITS Architecture
3.3.3 Top Level Regional System Interconnect Diagram
A system interconnect diagram, or “sausage diagram” (shown previously in Figure 3), shows the systems and primary interconnects in the Region. The National ITS Architecture interconnect diagram has been customized for the Bay Region based on the system inventory and information gathered from the stakeholders. Figure 4 summarizes the existing and planned ITS elements for the Bay Region in the context of a physical interconnect. Subsystems and elements specific to the Region are called out in the boxes surrounding the main interconnect diagram, and these are color-coded to the subsystem with which they are associated.

1/31/2008 Bay Region 24 Final Regional ITS Architecture
Figure 4 - Bay Regional System Interconnect Diagram

1/31/2008 Bay Region 25 Final Regional ITS Architecture
3.4 Market Packages
Upon completion of the system inventory, the next step in the development of the architecture was to identify the transportation services that are important to the Bay Region. In the National ITS Architecture, services are referred to as market packages. Market packages can include several stakeholders and elements that work together to provide a service in the Region. Examples of market packages from the National ITS Architecture include Network Surveillance, Traffic Information Dissemination, and Transit Vehicle Tracking. There are currently a total of 85 market packages identified in the National ITS Architecture Version 5.1. Appendix A provides definitions for each of the National ITS Architecture market packages.
The market packages are grouped together into eight ITS service areas: Traffic Management, Emergency Management, Maintenance and Construction Management, Public Transportation Management, Commercial Vehicle Operations, Traveler Information, Archived Data Management, and Vehicle Safety.
3.4.1 Selection and Prioritization of Regional Market Packages
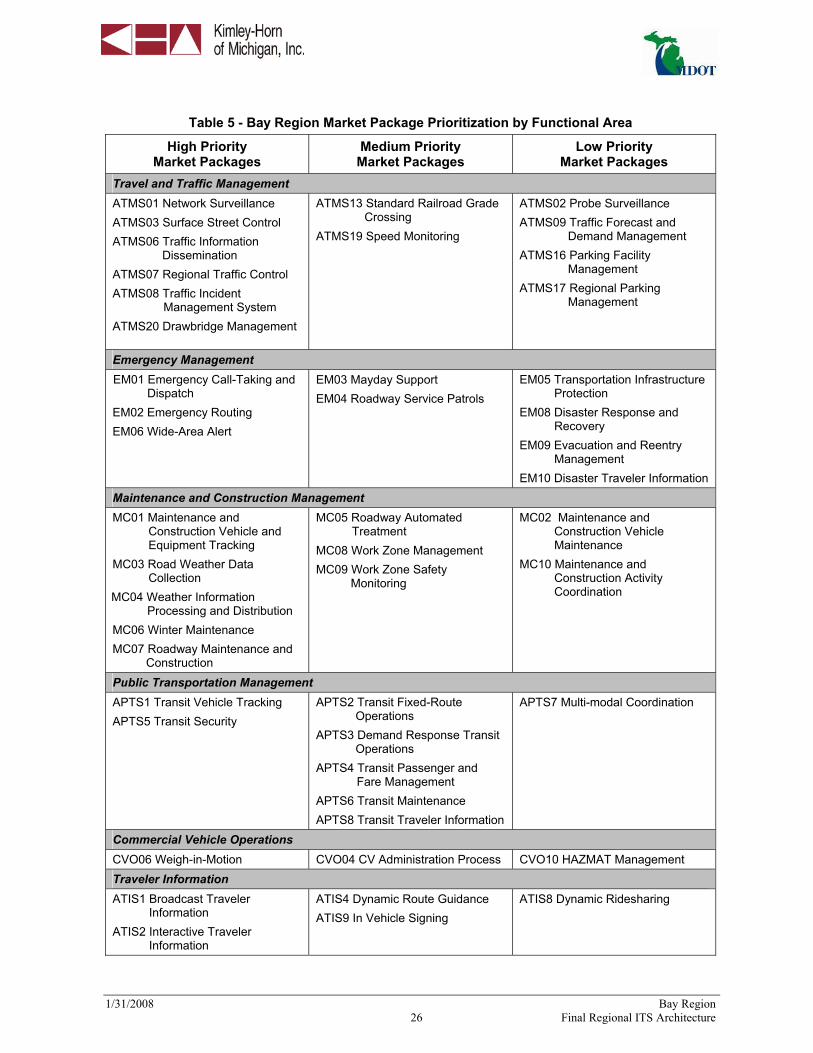
In the Bay Region, the National ITS Architecture market packages were reviewed by the stakeholders and selected based on the relevance of the service that the market package could provide to the Region. Fifty-one market packages were selected for implementation in the Region. They are identified in Table 5. Stakeholders prioritized the selected market packages during the workshop, and the table organizes the market packages into service areas and priority groupings. These priorities are based on the stakeholders’ opinion of need and do not necessarily represent the timeframe for funding of the deployments. These priorities can also be affected by several other factors such as existing infrastructure, dependency on other systems, and the maturity of the technology associated with the market package.
After selecting the market packages that were applicable for the Region, stakeholders customized each market package by reviewing the elements that could be included. This customization is discussed further in the following section.
1/31/2008 Bay Region 26 Final Regional ITS Architecture
Table 5 - Bay Region Market Package Prioritization by Functional Area
High Priority Market Packages
Medium Priority Market Packages
Low Priority Market Packages
Travel and Traffic Management ATMS01 Network Surveillance ATMS03 Surface Street Control ATMS06 Traffic Information
Dissemination ATMS07 Regional Traffic Control ATMS08 Traffic Incident
Management System ATMS20 Drawbridge Management
ATMS13 Standard Railroad Grade Crossing
ATMS19 Speed Monitoring
ATMS02 Probe Surveillance ATMS09 Traffic Forecast and
Demand Management ATMS16 Parking Facility
Management ATMS17 Regional Parking
Management
Emergency Management EM01 Emergency Call-Taking and
Dispatch EM02 Emergency Routing EM06 Wide-Area Alert
EM03 Mayday Support EM04 Roadway Service Patrols
EM05 Transportation Infrastructure Protection
EM08 Disaster Response and Recovery
EM09 Evacuation and Reentry Management
EM10 Disaster Traveler Information Maintenance and Construction Management MC01 Maintenance and
Construction Vehicle and Equipment Tracking
MC03 Road Weather Data Collection
MC04 Weather Information Processing and Distribution
MC06 Winter Maintenance MC07 Roadway Maintenance and
Construction
MC05 Roadway Automated Treatment
MC08 Work Zone Management MC09 Work Zone Safety
Monitoring
MC02 Maintenance and Construction Vehicle Maintenance
MC10 Maintenance and Construction Activity Coordination
Public Transportation Management APTS1 Transit Vehicle Tracking APTS5 Transit Security
APTS2 Transit Fixed-Route Operations
APTS3 Demand Response Transit Operations
APTS4 Transit Passenger and Fare Management
APTS6 Transit Maintenance APTS8 Transit Traveler Information
APTS7 Multi-modal Coordination
Commercial Vehicle Operations CVO06 Weigh-in-Motion CVO04 CV Administration Process CVO10 HAZMAT Management Traveler Information ATIS1 Broadcast Traveler
Information ATIS2 Interactive Traveler
Information
ATIS4 Dynamic Route Guidance ATIS9 In Vehicle Signing
ATIS8 Dynamic Ridesharing

1/31/2008 Bay Region 27 Final Regional ITS Architecture
Table 5 - Bay Region Market Package Prioritization by Functional Area
High Priority Market Packages
Medium Priority Market Packages
Low Priority Market Packages
Archived Data Management AD1 ITS Data Mart AD3 ITS Virtual Data Warehouse
Advanced Vehicle Safety System AVSS10 Intersection Collision
Avoidance AVSS11 Automated Highway
System
3.4.2 Customized Market Packages
The market packages in the National ITS Architecture were customized to reflect the unique systems, subsystems, and terminators in the Bay Region. Each market package is shown graphically with the market package name, local agencies involved and desired data flows included. Market packages represent a service that will be deployed as an integrated capability.
Figure 5 is an example of an ATMS market package for Surface Street Control that has been customized for the Region. This market package shows the two subsystems, Traffic Management and Roadway, and the associated entities (Local Agency TOC and Local Agency Traffic Signals) for surface street control in the Region. Data flows between the subsystems indicate what information is being shared. The remainder of the market packages that were customized for the Bay Region is shown in Appendix B.
Figure 5 - Example Market Package Diagram: ATMS03 – Surface Street Control
3.4.3 Regional ITS Needs and Customized Market Packages
Input received from stakeholders at the Architecture Workshop provided valuable input for the market package customization process. The specific needs identified are included in Table 6. The table also identifies which market package corresponds to the particular ITS need.

1/31/2008 Bay Region 28 Final Regional ITS Architecture
Table 6 - Regional ITS Needs and Corresponding Market Packages
ITS Need Market Package Traffic Management and Traveler Information Need surveillance in Flint area to complement DMS installation ATMS01
ATMS02 Need freeway management solution in Saginaw ATMS01
ATMS06 ATMS07 ATMS08
Need improved communication with MSP about incidents when they occur ATMS08 Need better information sharing through Media ATMS06 Need real-time access to ATR locations ATMS01 Need information directed towards tourist traffic and incident management freeways
ATMS06 ATMS08 ATIS01 ATIS02
Need system to handle recurring congestion and incidents at I-69/I-75 ATMS01 ATMS06 ATMS07 ATMS08
Need traffic management solutions for: Tourist traffic at I-75/US-10 interchange, M-25, Trumball Alternate routes to I-75: 84/13/25/Wilder in Bay City, M-13/US 23, M-54 in Flint Signal Coordination on M-46 in Saginaw
ATMS01 ATMS03 ATMS06 ATMS07 ATMS08 ATMS09
Need animal collision warning system on routes in several areas ATMS01 Public Transportation Management Need system for sharing GPS information from Flint MTA with other agencies APTS1
ATMS08 Need improved coordination between transit agencies in Tri-county area APTS7 Emergency Management Need RWIS installations for fog and winter weather incident detection MC03
MC04 Need improved incident management throughout region ATMS08 Need safety solutions at high speed intersections in rural areas ATMS19
AVSS10 Maintenance and Construction Management Need detection and surveillance in work zones MC08 Need system to communicate construction and maintenance activities to the public ATMS06
MC08 MC10 ATIS1 ATIS2
Need AVL technology to improve coordination during snowplow operation MC01 MC06
Need coordination in tri-county area for snow removal for access to Midland-Bay-Saginaw Airport
MC01 MC06

1/31/2008 Bay Region 29 Final Regional ITS Architecture
Table 6 - Regional ITS Needs and Corresponding Market Packages
ITS Need Market Package Commercial Vehicle Management Need truck rollover systems that monitors the speed and weight of vehicles and disseminates warning messages if unsafe conditions exist
ATMS01 ATMS06 ATMS19
Need system to manage freight movement through region on I-69 CVO04 Archived Data Management Need improved access to historical ATR data and crash data AD1
AD3
3.5 Architecture Interfaces
While it is important to identify the various systems and stakeholders that are part of a regional ITS, a primary purpose of the architecture is to identify the connectivity between transportation systems in the Bay Region. The system interconnect diagram shown previously in Figure 4 showed the high-level relationships of the subsystems and terminators in the Bay Region and the associated local projects and systems. The customized market packages represent services that can be deployed as an integrated capability and the market package diagrams show the information flows between the subsystems and terminators that are most important to the operation of the market packages. How these systems interface with each other is an integral part of the overall ITS architecture.
3.5.1 Element Connections
There are a variety of elements identified as part of the Bay Regional ITS Architecture. These elements include traffic management centers, transit vehicles, dispatch systems, emergency management agencies, media outlets, and others—essentially, all of the existing and planned physical components that contribute to the regional ITS. Interfaces have been identified for each element in the Bay Region ITS Architecture and each element has been mapped to those other elements with which it must interface. The Turbo Architecture software can generate interconnect diagrams for each element in the Region that show which elements are connected to one another. Figure 6 is an example of a context style interconnect diagram from the Turbo database output. This particular interconnect diagram is for Local Agency Public Safety Vehicles and is called a context diagram because it shows every element in the architecture that the vehicles connect to.

1/31/2008 Bay Region 30 Final Regional ITS Architecture
Local AgencyLocal Agency Public Safety Vehicles
MSPMSP District 3 - Saginaw
Local AgencyCity of Flint 911
Local AgencyLocal Agency Police Department
Local AgencyCounty 911 Dispatch
Local AgencyLocal Agency Traffic Signals
MDOTMDOT Traffic Signals
ExistingPlanned
Figure 6 - Example Interconnect Diagram: Local Agency Public Safety Vehicles
3.5.2 Data Flows Between Elements
In the market package diagrams, flows between the subsystems and terminators define the specific information (data) that is exchanged between the elements and the direction of the exchange. The data flows could be requests for information, alerts and messages, status requests, broadcast advisories, event messages, confirmations, electronic credentials, and other key information requirements. Turbo Architecture can be used to output flow diagrams and can be filtered by market package for ease of interpretation; however, it is important to remember that custom data flows will not show up in diagrams that are filtered by market package. An example flow diagram for the Michigan State Police that has been filtered for EM01-1- Emergency Call Taking and Dispatch is shown in Figure 7.
The flow diagrams can vary greatly in complexity and, in turn, legibility. Figure 8 shows a more complex flow diagram for EM02: Emergency Routing – Local Agency Public Safety.

1/31/2008 Bay Region 31 Final Regional ITS Architecture
Local AgencyLocal Agency Public Safety Vehicles
MSPMSP District 3 - Saginaw
Local AgencyCity of Flint 911
Local AgencyLocal Agency Police Department
Local AgencyCounty 911 Dispatch
MSPMSP Vehicles
emergency dispatch responseemergency vehicle tracking data
emergency dispatch requestsemergency dispatch response
emergency vehicle tracking dataemergency dispatch requests
incident reportincident response coordination
emergency dispatch responseemergency vehicle tracking data
emergency dispatch requests
incident reportincident response coordination
emergency dispatch responseemergency vehicle tracking data
emergency dispatch requests
incident reportincident response coordination
emergency dispatch requestsemergency dispatch response
emergency vehicle tracking data
ExistingPlanned
Figure 7 - Example Flow Diagram: EM01 – Michigan State Police
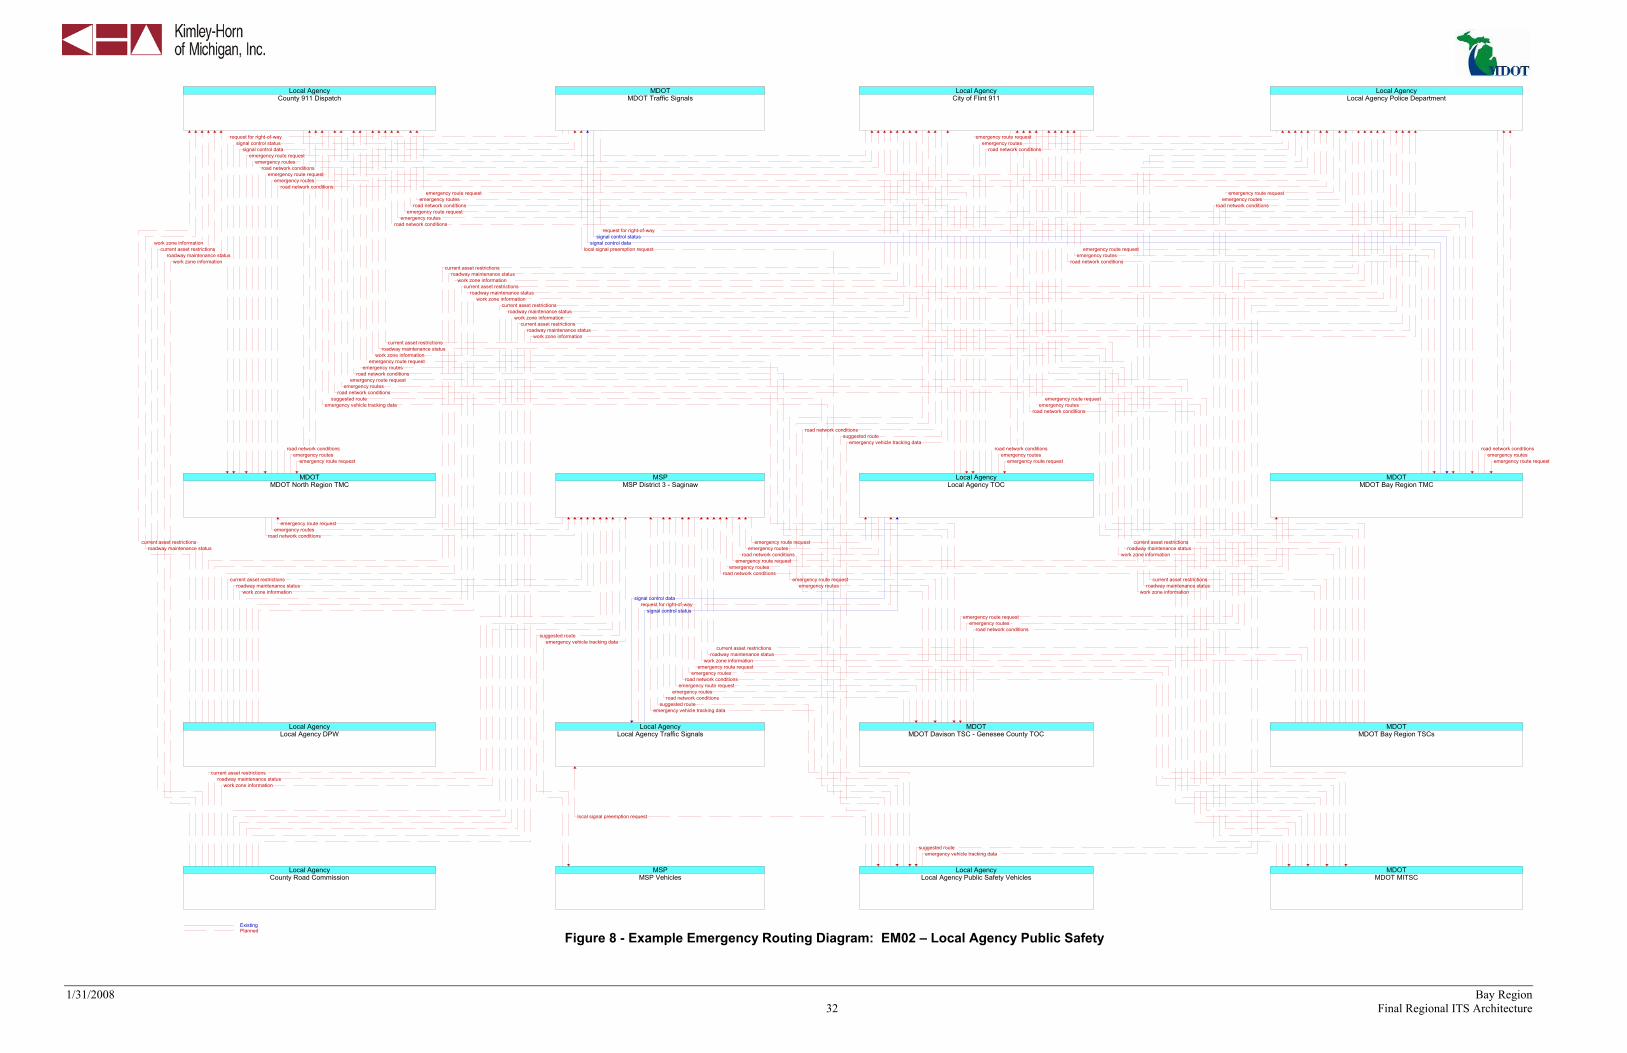
1/31/2008 Bay Region 32 Final Regional ITS Architecture
MSPMSP District 3 - Saginaw
Local AgencyCounty 911 Dispatch
MDOTMDOT Traffic Signals
Local AgencyCity of Flint 911
Local AgencyLocal Agency Police Department
MDOTMDOT North Region TMC
Local AgencyLocal Agency TOC
MDOTMDOT Bay Region TMC
Local AgencyLocal Agency DPW
Local AgencyCounty Road Commission
Local AgencyLocal Agency Traffic Signals
MSPMSP Vehicles
MDOTMDOT Bay Region TSCs
MDOTMDOT MITSC
MDOTMDOT Davison TSC - Genesee County TOC
Local AgencyLocal Agency Public Safety Vehicles
emergency route requestemergency routes
road network conditions
emergency route requestemergency routes
road network conditions
request for right-of-waysignal control status
signal control dataemergency route request
emergency routesroad network conditions
emergency route requestemergency routes
road network conditions
emergency route requestemergency routes
road network conditions
emergency route requestemergency routes
road network conditions
emergency route requestemergency routes
road network conditions
emergency route requestemergency routes
road network conditions
emergency route requestemergency routes
road network conditions
emergency route requestemergency routes
road network conditionsrequest for right-of-way
signal control statussignal control data
emergency route requestemergency routes
road network conditions
emergency route requestemergency routes
road network conditions
current asset restrictionsroadway maintenance status
work zone information
current asset restrictionsroadway maintenance status
work zone information
current asset restrictionsroadway maintenance status
work zone informationcurrent asset restrictions
roadway maintenance statuswork zone information
current asset restrictionsroadway maintenance status
work zone information
current asset restrictionsroadway maintenance status
work zone information
current asset restrictionsroadway maintenance status
work zone informationcurrent asset restrictions
roadway maintenance statuswork zone information
signal control datarequest for right-of-way
signal control status
suggested routeemergency vehicle tracking data
current asset restrictionsroadway maintenance status
work zone information
current asset restrictionsroadway maintenance status
work zone information
current asset restrictionsroadway maintenance status
work zone information
current asset restrictionsroadway maintenance status
work zone information
emergency route requestemergency routes
road network conditions
emergency route requestemergency routes
road network conditionsemergency route request
emergency routesroad network conditions
emergency route requestemergency routes
road network conditions
emergency route requestemergency routes
road network conditions
emergency route requestemergency routes
road network conditions
emergency route requestemergency routes
road network conditions
emergency route requestemergency routes
road network conditions
suggested routeemergency vehicle tracking data
suggested routeemergency vehicle tracking data
local signal preemption request
suggested routeemergency vehicle tracking data
suggested routeemergency vehicle tracking data
local signal preemption request
ExistingPlanned
Figure 8 - Example Emergency Routing Diagram: EM02 – Local Agency Public Safety

1/31/2008 Bay Region 33 Final Regional ITS Architecture
In addition to market package style flow diagrams, Turbo Architecture has the ability to create flow diagrams that show only the connections between two or three specific elements or context diagrams that show all of the flows that involve an element. Filtering the diagrams to generate specific scenarios can be very useful during the project implementation process. For example, Figure 9 shows the flows between the MDOT Bay Region Office and the MDOT Traveler Information Database. While this is a portion of the planned interactions, it could also be useful to use a context diagram for the element, as shown in Figure 10 to view all of the other interactions so that the project can be designed with the future in mind. Context style flow diagrams can get very large and complicated for elements with lots of connections such as a TMC.
Figure 9 - Example Two Element Flow Diagram
MDOTMDOT Traveler Information Database
MDOTMDOT Bay Region TMC
road network conditions
Planned

1/31/2008 Bay Region 34 Final Regional ITS Architecture
MDOTMDOT Traveler Information Database
MDOTMDOT Bay Region TSCs
Local AgencyLocal Emergency Operations Center
Local AgencyCounty 911 Dispatch
MSPMIOC
Local AgencyLocal Agency Police Department
Local AgencyCity of Flint 911
MSPMSP District 3 - Saginaw
Bay Metro Transit AuthorityBay Metro Transit Authority Dispatch
Center
Flint-Mass Transportation AuthorityFlint-Mass Transportation Authority
Control Center
MDOTMDOT Traveler Information Kiosks
Regional Demand Response Transit ...Regional Demand Response Transit
Providers Dispatch Center
Private Transportation ProvidersPrivate Transportation Providers
Saginaw Transit Authority Regional S...STARS Dispatch Center
MDOTMDOT North Region TMC
MDOTMDOT Bay Region TMC
Local AgencyLocal Agency TOC
MDOTMDOT Davison TSC - Genesee County
TOC
MDOTMDOT Planning Division Data
Warehouse
Private Information Service ProviderPrivate Sector ISP
MDOTMDOT Office of Communications
MDOTMDOT Commercial Vehicle Permitting
System
Local AgencyCounty Road Commission
Local AgencyLocal Agency DPW
MDOTMDOT MI Drive Website
MDOTMDOT MITSC
MDOTMichigan 511 System
current asset restrictionsmaint and constr work plans
road weather informationroadway maintenance status
work zone informationevacuation information
incident informationtransportation system status
evacuation informationincident information
transportation system statusevacuation information
incident informationtransportation system status
evacuation informationincident information
transportation system statusevacuation information
incident informationtransportation system status
evacuation informationincident information
transportation system statustransit information request
transit and fare schedulestransit information request
transit and fare schedulestraveler information
traveler requesttransit information request
transit and fare schedulestransit information request
transit and fare schedulestransit information request
transit and fare schedulesroad network conditions
road network conditions
road network conditionsroad network conditions
archive coordinationISP coordination
ISP coordinationroute restrictions
current asset restrictionscurrent asset restrictions
ISP coordinationroad network conditions
ISP coordination
Planned
Figure 10 - Example Context Flow Diagram: MDOT Traveler Information Database

1/31/2008 Bay Region 35 Final Regional ITS Architecture
4. APPLICATION OF THE REGIONAL ITS ARCHITECTURE Once a region has identified the desired components of ITS for their area and established which agencies and systems need to be connected, the structure of the National ITS Architecture assists with the region’s planning and implementation. This section addresses the application of the Regional ITS Architecture in the Bay Region. The National ITS Architecture provides recommendations for standards and functional requirements that should be considered when implementing ITS elements. In addition, an operational concept has been developed for the Region and documents the roles and responsibilities of stakeholders in the operation of the regional ITS. The implementation of ITS in the Bay Region will likely require interagency agreements. Potential agreements have been identified based on the desired data flows identified in the Bay Region. The ITS Architecture and ITS Deployment Plan developed as part of this process will be incorporated into the existing planning process for the Region to ensure that the maximum benefit is realized from the development effort.
4.1 Functional Requirements
Functions are a description of what the system has to do. In the National ITS Architecture, functions are defined at several different levels, ranging from general subsystem descriptions through somewhat more specific equipment package descriptions to Process Specifications that include substantial detail. Guidance from the USDOT on developing a Regional ITS Architecture recommends that each Region determine the level of detail of the functional requirements for their Region. In the Bay Region, it is recommended that the development of detailed functional requirements such as the “shall” statements included in Process Specifications for a system be developed at the project level. These detailed “shall” statements identify all functions that a project or system needs to perform.
For the Bay Regional ITS Architecture, functional requirements have been identified at two levels. The customized market packages, discussed previously in Section 3.4.2, describe the services that ITS needs to provide in the Region and the architecture flows between the elements. These market packages and data flows describe what the systems in the Bay Region have to do and the data that needs to be shared among elements.
At a more detailed level, functional requirements for the Bay Region are described in terms of functions that each element in the architecture performs or will perform in the future. Appendix C contains a table that summarizes the functions by element.
4.2 Standards
Standards are an important tool that will allow efficient implementation of the elements in the Bay Regional ITS Architecture over time. Standards facilitate deployment of interoperable systems at local, regional, and national levels without impeding innovation as technology advances, vendors change, and as new approaches evolve. The USDOT’s ITS Joint Program Office is supporting Standards Development Organizations (SDOs) with an extensive, multi-year program of accelerated, consensus-based standards development to facilitate successful ITS deployment in the United States. Table 7 identifies each of the ITS standards that could apply to the Bay Regional ITS Architecture. These standards are based on the physical subsystem architecture flows previously identified in Section 3.5.2.

1/31/2008 Bay Region 36 Final Regional ITS Architecture
Table 7 - Bay Region Applicable ITS Standards
SDO Document ID Title ANSI ANSI TS286 Commercial Vehicle Credentials
NTCIP 1101 Simple Transportation Management Framework (STMF) NTCIP 1102 Octet Encoding Rules Base Protocol NTCIP 1103 Transportation Management Protocols NTCIP 1104 Center-to-Center Naming Convention Specification NTCIP 1105 CORBA Security Service Specification NTCIP 1106 CORBA Near-Real Time Data Service Specification NTCIP 1201 Global Object Definitions NTCIP 1202 Object Definitions for Actuated Traffic Signal Controller Units NTCIP 1203 Object Definitions for DMS NTCIP 1204 Environmental Sensor Station Interface Standard NTCIP 1205 Object Definitions for CCTV Camera Control NTCIP 1206 Object Definitions for Data Collection and Monitoring (DCM)
Devices NTCIP 1208 Object Definitions for CCTV Switching NTCIP 1209 Data Element Definitions for Transportation Sensor Systems NTCIP 1210 Field Management Stations – Part 1: Object Definitions for Signal
System Masters NTCIP 1211 Object Definitions for Signal Control and Prioritization NTCIP 1401 TCIP Common Public Transportation Objects NTCIP 1402 TCIP Incident Management Objects NTCIP 1403 TCIP Passenger Information Objects NTCIP 1404 TCIP Scheduling/Runcutting Objects NTCIP 1405 TCIP Spatial Representation Objects NTCIP 1406 TCIP On-Board Objects NTCIP 1407 TCIP Control Center Objects NTCIP 1408 TCIP Fare Collection Business Area Objects NTCIP 2101 Point to Multi-Point Protocol Using RS-232 Subnetwork Profile NTCIP 2102 Point to Multi-Point Protocol Using Frequency Shift Keying
Modem Subnetwork Profile NTCIP 2103 Point-to-Point Protocol Over RS-232 Subnetwork Profile NTCIP 2104 Ethernet Subnetwork Profile NTCIP 2201 Transportation Transport Profile NTCIP 2202 Internet (TCP/IP and UDP/IP) Transport Profile NTCIP 2301 STMF Application Profile NTCIP 2302 Trivial File Transfer Protocol Application Profile NTCIP 2303 File Transfer Protocol Application Profile NTCIP 2304 Application Profile for DATEX-ASN (AP-DATEX) NTCIP 2305 Application Profile for CORBA (AP-CORBA) NTCIP 2306 Application Profile for XML Message Encoding and Transport in
ITS Center-to-Center Communications NTCIP 2501 Information Profile for DATEX
AASHTO/ITE/NEMA
NTCIP 2502 Information Profile for CORBA

1/31/2008 Bay Region 37 Final Regional ITS Architecture
Table 7 - Bay Region Applicable ITS Standards
SDO Document ID Title ASTM E2158-01 Standard Specification for Dedicated Short Range
Communication (DSRC) Physical Layer using Microwave in the 902-928 MHz Band
ASTM E2259-xx Standard Specification for Metadata to Support Archived Data Management Systems
ASTM
ASTM PS 105-99 Standard Provisional Specification for DSRC Data Link Layer IEEE 1512.1-2003 Standard for Traffic Incident Management Message Sets for Use
by EOCs IEEE 1512.2-2004 Standard for Public Safety Incident Management Message Sets
(IMMS) for use by EOCs IEEE 1512.3-2002 Standard for Hazardous Material IMMS IEEE 1512-2000 Standard for Common IMMS for use by EOCs IEEE 1570-2002 Standard for Interface Between the Rail Subsystem and the
Highway Subsystem at a Highway Rail Intersection IEEE 1609.1 Resource Manager for DSRC 5.9 GHz IEEE 1609.2 Application Services (Layers 6,7) for DSRC 5.9 GHz IEEE 1609.3 Communications Services (Layers 4,5) for DSRC 5.9 GHz (Future
Standard) IEEE 1609.4 Medium Access Control (MAC) Extension and the MAC Extension
Management Entity for DSRC 5.9 GHz IEEE 802.11 Standard Specification for Telecommunications and Information
Exchange Between Roadside and Vehicle Systems – 5 GHz Band DSRC MAC and Physical Layer Specifications
IEEE 802.2 Logical Link (Layer 2) for DSRC 5.9 GHz IEEE P1512.4 Standard for Common Traffic Incident Management Message
Sets for Use in Entities External to Centers
IEEE
IEEE Std 1455-1999 Standard for Message Sets for Vehicle/Roadside Communications
ISO ISO 21210 Networking Services (Layer 3) for DSRC 5.9 GHz ITE TM 1.03 Standard for Functional Level Traffic Management Data
Dictionary ITE TM 2.01 Message Sets for External TMC Communication SAE J2266 Location Referencing Message Specification SAE J2313 On-Board Land Vehicle Mayday Reporting Interface SAE J2354 Message Set for Advanced Traveler Information System (ATIS) SAE J2369 Standard for ATIS Message Sets Delivered Over Reduced
Bandwidth Media SAE J2540 Messages for Handling Strings and Look-Up Tables in ATIS
Standards SAE J2540-1 Radio Data System Phrase Lists SAE J2540-2 International Traveler Information Systems Phrase Lists
SAE
SAE J2540-3 National Names Phrase List
1/31/2008 Bay Region 38 Final Regional ITS Architecture
4.3 Operational Concepts
An operational concept documents each stakeholder’s current and future roles and responsibilities across a range of transportation services, as grouped in the Operational Concepts section of Turbo Architecture, in the operation of the regional ITS. The services covered are:
Arterial Management – The development of signal systems that react to changing traffic conditions and provide coordinated intersection timing over a corridor, an area, or multiple jurisdictions.
Highway Management – The development of systems to monitor freeway (or tollway) traffic flow and roadway conditions, and provide strategies such as ramp metering or lane access control to improve the flow of traffic on the freeway. Includes systems to provide information to travelers on the roadway.
Incident Management – The development of systems to provide rapid and effective response to incidents. Includes systems to detect and verify incidents, along with coordinated agency response to the incidents.
Emergency Management – The development of systems to provide emergency call taking, public safety dispatch, and emergency operations center operations.
Maintenance and Construction Management – The development of systems to manage the maintenance of roadways in the Region, including winter snow and ice clearance. Includes the managing of construction operations.
Transit Management – The development of systems to more efficiently manage fleets of transit vehicles or transit rail. Includes systems to provide transit traveler information both pre-trip and during the trip.
Electronic Payment – The development of electronic fare payment systems for use by transit and other agencies (e.g., parking).
Commercial Vehicle Operations – The development of systems to facilitate the management of commercial vehicles (e.g., electronic clearance).
Traveler Information – The development of systems to provide static and real time transportation information to travelers.
Archived Data Management – The development of systems to collect transportation data for use in non-operational purposes (e.g., planning and research).
Advanced Vehicle Safety – The development of systems to support private sector vehicle safety initiatives (e.g., intersection collision avoidance)
Table 8 identifies the roles and responsibilities of key stakeholders for a range of transportation services.

1/31/2008 Bay Region 39 Final Regional ITS Architecture
Table 8 - Bay Region Stakeholder Roles and Responsibilities
Transportation Service Stakeholder Roles/Responsibilities
Operate and maintain traffic signal systems on MDOT routes not managed by local agencies. Operate network surveillance equipment such as CCTV cameras and field sensors on MDOT routes not managed by local agencies. Provide traffic information reports to regional information service providers.
MDOT
Coordinate traffic information and control with Local Agency TOCs and other MDOT TMCs. Operate traffic signal systems on local routes. Operate network surveillance equipment such as CCTV cameras and field sensors on local routes to facilitate traffic signal operations. Provide traffic information reports to regional information service providers. Provide traffic information to regional agencies including transit, emergency management, maintenance and construction, and the media. Coordinate traffic information and control with MDOT West Michigan TMC and MDOT Bay Region Office. Coordinate traffic information with other local agencies. Coordinate HRI signal adjustments with private rail operators.
Arterial Management
Local Agency
Provide traffic signal preemption for emergency vehicles. Operate network surveillance equipment including CCTV cameras as well as DMS to convey traffic information to travelers on MDOT highway routes. Provide traffic information to regional information service providers.
Highway Management
MDOT
Provide traffic information to regional transportation agencies and the general public through traffic information devices primarily DMS. Perform network surveillance for detection and verification of incidents on MDOT routes. Provide incident information to travelers via traffic information devices on highways (e.g. DMS). Provide incident information to regional emergency responders, including the MSP and local agencies. Responsible for the coordination with other traffic operations centers and emergency management agencies for coordinated incident management. Responsible for the development, coordination, and execution of special traffic management strategies during an evacuation.
Incident Management (Traffic)
MDOT
Coordinate maintenance resources for incident response with MDOT TSC Construction and Maintenance Operations.
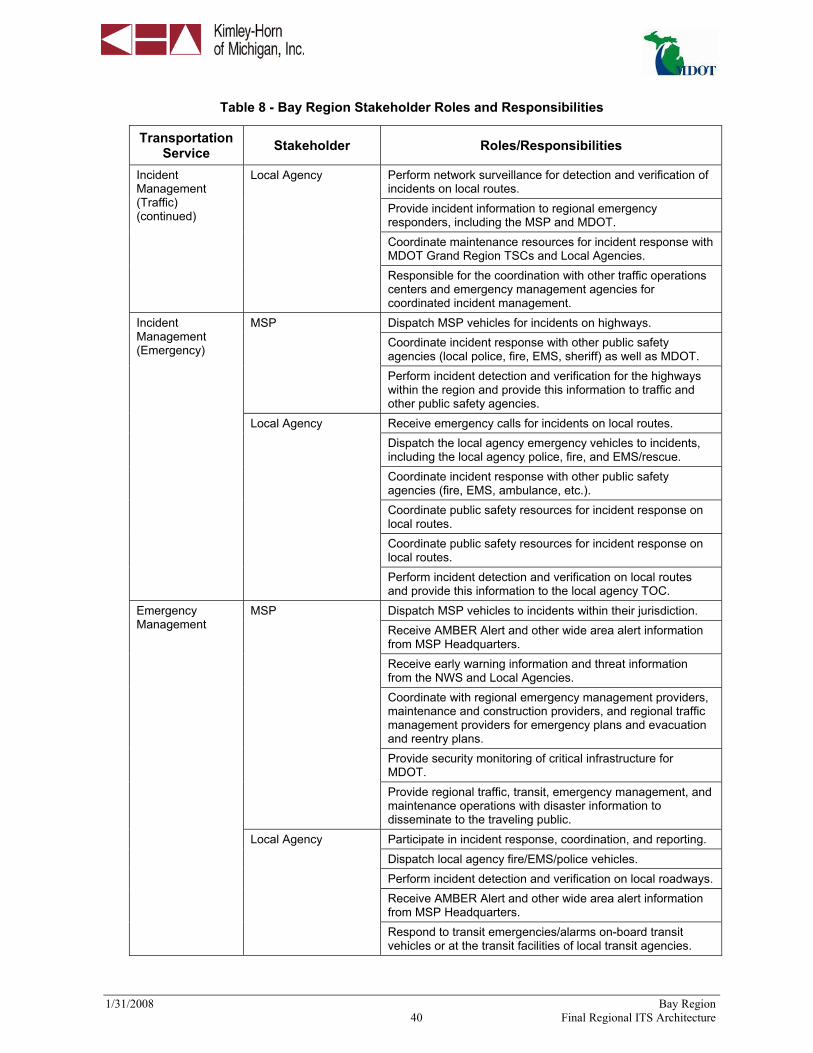
1/31/2008 Bay Region 40 Final Regional ITS Architecture
Table 8 - Bay Region Stakeholder Roles and Responsibilities
Transportation Service Stakeholder Roles/Responsibilities
Perform network surveillance for detection and verification of incidents on local routes. Provide incident information to regional emergency responders, including the MSP and MDOT. Coordinate maintenance resources for incident response with MDOT Grand Region TSCs and Local Agencies.
Incident Management (Traffic) (continued)
Local Agency
Responsible for the coordination with other traffic operations centers and emergency management agencies for coordinated incident management. Dispatch MSP vehicles for incidents on highways. Coordinate incident response with other public safety agencies (local police, fire, EMS, sheriff) as well as MDOT.
MSP
Perform incident detection and verification for the highways within the region and provide this information to traffic and other public safety agencies. Receive emergency calls for incidents on local routes. Dispatch the local agency emergency vehicles to incidents, including the local agency police, fire, and EMS/rescue. Coordinate incident response with other public safety agencies (fire, EMS, ambulance, etc.). Coordinate public safety resources for incident response on local routes. Coordinate public safety resources for incident response on local routes.
Incident Management (Emergency)
Local Agency
Perform incident detection and verification on local routes and provide this information to the local agency TOC. Dispatch MSP vehicles to incidents within their jurisdiction. Receive AMBER Alert and other wide area alert information from MSP Headquarters. Receive early warning information and threat information from the NWS and Local Agencies. Coordinate with regional emergency management providers, maintenance and construction providers, and regional traffic management providers for emergency plans and evacuation and reentry plans. Provide security monitoring of critical infrastructure for MDOT.
MSP
Provide regional traffic, transit, emergency management, and maintenance operations with disaster information to disseminate to the traveling public. Participate in incident response, coordination, and reporting. Dispatch local agency fire/EMS/police vehicles. Perform incident detection and verification on local roadways. Receive AMBER Alert and other wide area alert information from MSP Headquarters.
Emergency Management
Local Agency
Respond to transit emergencies/alarms on-board transit vehicles or at the transit facilities of local transit agencies.

1/31/2008 Bay Region 41 Final Regional ITS Architecture
Table 8 - Bay Region Stakeholder Roles and Responsibilities
Transportation Service Stakeholder Roles/Responsibilities
Receive requests for maintenance resources for incident response from regional emergency management agencies. Support coordinated response to incidents. Responsible for the tracking and dispatch MDOT maintenance vehicles. Receive vehicle location information from MDOT maintenance and construction vehicles. Receive vehicle maintenance conditions from MDOT maintenance and construction vehicle and coordinate fleet management with MDOT equipment repair facility. Collect road weather information with MDOT equipment and distribute it to regional traffic, maintenance, and transit agencies. Provide maintenance of state highways within the region, including pavement maintenance, winter maintenance, and construction activities. Manage work zones on all MDOT maintenance and construction activities, as well as monitor work zone safety with MDOT field devices and vehicles. Coordinate maintenance and construction activities with other regional maintenance and construction agencies. Distribute maintenance and construction plans and work zone information to regional information service providers, regional traffic operations, transit operations, emergency operations, rail operations, and the media.
MDOT
Perform maintenance of ITS field equipment owned by MDOT. Receive a request for maintenance resources for incident response from regional emergency management agencies. Coordinate maintenance resources for incidents with other regional maintenance providers. Receive vehicle location information from local agency DPW vehicles.
Local Agency
Dispatch local agency maintenance vehicles.
Maintenance and Construction Management
Private Operators Provide maintenance of local routes and MDOT facilities (per contract), including pavement maintenance and construction activities. Provide fixed route bus service for Bay Metro Transit System. Provide paratransit bus service for the Bay Metro Transit System. Track and evaluate schedule performance on all Bay Metro Transit Authority fixed route and paratransit vehicles. Provide transit schedule and fare information to the Bay Metro Transit Authority website and private sector traveler information service providers.
Transit Management
Bay Metro Transit Authority
Provide a demand response transit plan from the agency website.
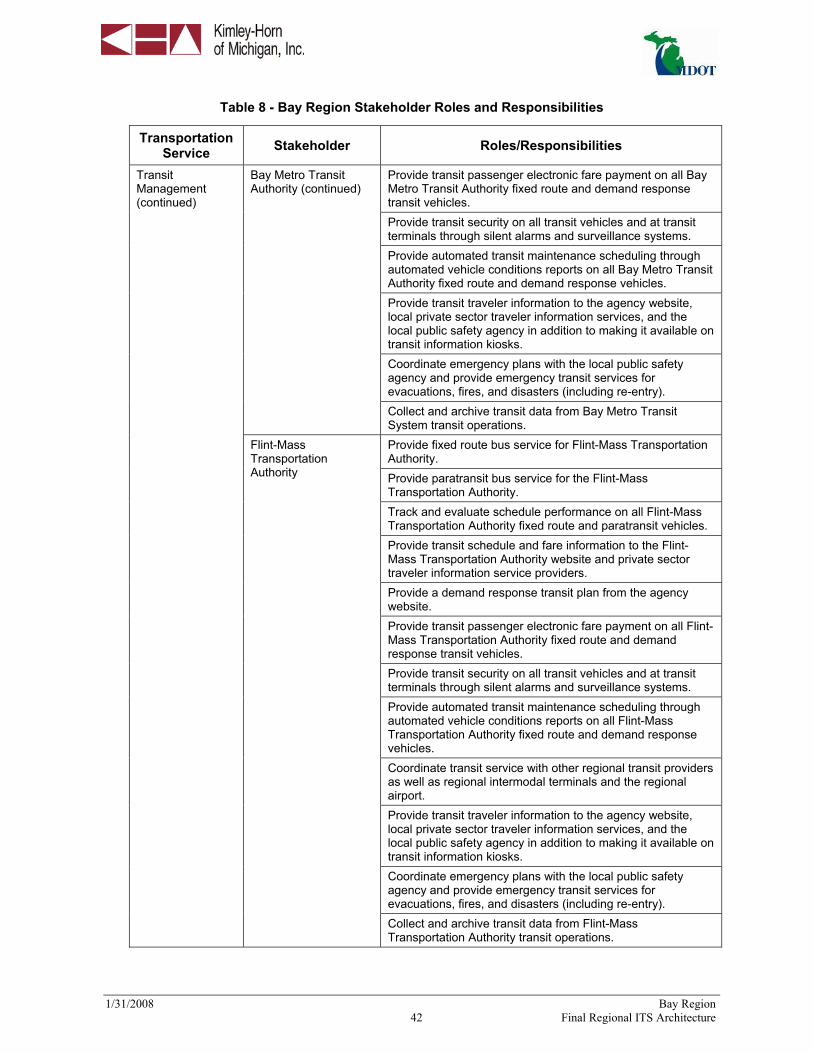
1/31/2008 Bay Region 42 Final Regional ITS Architecture
Table 8 - Bay Region Stakeholder Roles and Responsibilities
Transportation Service Stakeholder Roles/Responsibilities
Provide transit passenger electronic fare payment on all Bay Metro Transit Authority fixed route and demand response transit vehicles. Provide transit security on all transit vehicles and at transit terminals through silent alarms and surveillance systems. Provide automated transit maintenance scheduling through automated vehicle conditions reports on all Bay Metro Transit Authority fixed route and demand response vehicles. Provide transit traveler information to the agency website, local private sector traveler information services, and the local public safety agency in addition to making it available on transit information kiosks. Coordinate emergency plans with the local public safety agency and provide emergency transit services for evacuations, fires, and disasters (including re-entry).
Bay Metro Transit Authority (continued)
Collect and archive transit data from Bay Metro Transit System transit operations. Provide fixed route bus service for Flint-Mass Transportation Authority. Provide paratransit bus service for the Flint-Mass Transportation Authority. Track and evaluate schedule performance on all Flint-Mass Transportation Authority fixed route and paratransit vehicles. Provide transit schedule and fare information to the Flint-Mass Transportation Authority website and private sector traveler information service providers. Provide a demand response transit plan from the agency website. Provide transit passenger electronic fare payment on all Flint-Mass Transportation Authority fixed route and demand response transit vehicles. Provide transit security on all transit vehicles and at transit terminals through silent alarms and surveillance systems. Provide automated transit maintenance scheduling through automated vehicle conditions reports on all Flint-Mass Transportation Authority fixed route and demand response vehicles. Coordinate transit service with other regional transit providers as well as regional intermodal terminals and the regional airport. Provide transit traveler information to the agency website, local private sector traveler information services, and the local public safety agency in addition to making it available on transit information kiosks. Coordinate emergency plans with the local public safety agency and provide emergency transit services for evacuations, fires, and disasters (including re-entry).
Transit Management (continued)
Flint-Mass Transportation Authority
Collect and archive transit data from Flint-Mass Transportation Authority transit operations.

1/31/2008 Bay Region 43 Final Regional ITS Architecture
Table 8 - Bay Region Stakeholder Roles and Responsibilities
Transportation Service Stakeholder Roles/Responsibilities
Provide fixed route bus service for Saginaw Transit Authority Regional Services. Provide paratransit bus service for the Saginaw Transit Authority Regional Services. Track and evaluate schedule performance on all Saginaw Transit Authority Regional Services fixed route and paratransit vehicles. Provide transit schedule and fare information to the Saginaw Transit Authority Regional Services website and private sector traveler information service providers. Provide a demand response transit plan from the agency website. Provide transit passenger electronic fare payment on all Saginaw Transit Authority Regional Services fixed route and demand response transit vehicles. Provide transit security on all transit vehicles and at transit terminals through silent alarms and surveillance systems. Provide automated transit maintenance scheduling through automated vehicle conditions reports on all Saginaw Transit Authority Regional Services fixed route and demand response vehicles. Coordinate transit service with other regional transit providers as well as regional intermodal terminals and the regional airport. Provide transit traveler information to the agency website, local private sector traveler information services, and the local public safety agency in addition to making it available on transit information kiosks. Coordinate emergency plans with the local public safety agency and provide emergency transit services for evacuations, fires, and disasters (including re-entry).
Saginaw Transit Authority Regional Services
Collect and archive transit data from Saginaw Transit Authority Regional Services transit operations. Track and evaluate schedule performance on all Regional Demand Responsive Transit Providers’ demand response vehicles. Provide transit schedule and fare information to the Regional Demand Responsive Transit Providers website and private sector traveler information service providers. Provide demand response bus service for the Regional Demand Responsive Transit Providers. Provide a demand response transit plan from the agency website. Provide transit passenger electronic fare payment on all Regional Demand Responsive Transit Providers’ transit vehicles. Provide transit security on all transit vehicles and at transit terminals through silent alarms and surveillance systems.
Transit Management (continued)
Regional Demand Responsive Transit Providers
Provide automated transit maintenance scheduling through automated vehicle conditions reports on all Regional Demand Responsive Transit Providers’ demand response vehicles.

1/31/2008 Bay Region 44 Final Regional ITS Architecture
Table 8 - Bay Region Stakeholder Roles and Responsibilities
Transportation Service Stakeholder Roles/Responsibilities
Coordinate transit service with other regional transit providers as well as regional intermodal terminals and the regional airport. Coordinate emergency plans with the local public safety agency and provide emergency transit services for evacuations, fires, and disasters (including re-entry).
Transit Management (continued)
Regional Demand Responsive Transit Providers (continued)
Collect and archive transit data from Regional Demand Responsive Transit Providers transit operations. Provide enforcement of regional permits for overheight/overweight or HAZMAT commercial vehicles.
MSP
Provide first response to commercial vehicle incidents and coordinate for HAZMAT conditions/clean-up. Provide automated weigh-in-motion inspections for private fleet operations (both commercial vehicles and rail). Provide regional permits (overheight/overweight and HAZMAT) to private fleet systems. Provide route restriction information to private fleet systems.
Commercial Vehicle Operations
MDOT
Provide permit information to regional emergency management providers and regional enforcement agencies. Collection, processing, storage, and broadcast dissemination for traffic, transit, maintenance and construction, and weather information to travelers via the 511 Traveler Information System. Provide traveler information to private travelers through in vehicle, personal computing devices or kiosks upon request.
MDOT
Provide traveler information to the media. MSP Collect traffic information (road network conditions), work
zone information, travel times, and weather information. Collect traffic information (road network conditions), work zone information, travel times, and weather information.
Traveler Information
Local Agency
Coordinate and share traveler information with all other traveler information providers within the Region. Collect and archive traffic information from regional traffic management providers and centers, emergency information from MSP and local agency police, and transit information from regional transit agencies for planning purposes.
MDOT
Coordinate with MDOT Transportation Planning Division.
Archived Data Management
MSP Collect and archive emergency and incident information from MSP and the region’s emergency responders.

1/31/2008 Bay Region 45 Final Regional ITS Architecture
4.4 Potential Agreements
The Regional ITS Architecture for the Bay Region has identified many agency interfaces, information exchanges, and integration strategies that would be needed to provide the ITS services and systems identified by the stakeholders in the Region. Interfaces and data flows among public and private entities in the Region will require agreements among agencies that establish parameters for sharing agency information to support traffic management, incident management, provide traveler information, and perform other functions identified in the Regional ITS Architecture.
With the implementation of ITS technologies, integrating systems from one or more agencies, and the anticipated level of information exchange identified in the architecture, it is likely that formal agreements between agencies will be needed in the future. These agreements, while perhaps not requiring a financial commitment from agencies in the Region, should outline specific roles, responsibilities, data exchanges, levels of authority, and other facets of regional operations. Some agreements will also outline specific funding responsibilities, where appropriate and applicable.
Agreements should avoid being specific with regards to technology when possible. Technology is likely to change rapidly and changes to technology could require an update of the agreement if the agreement was not technology neutral. Focus of the agreement should be on the responsibilities of the agencies and the high level information that needs to be exchanged. Depending on the type of agreement being used, agencies should be prepared for the process to complete an agreement to take several months to years. Agencies must first reach consensus on what should be in an agreement and then proceed through the approval process. The approval process for formal agreements varies by agency and can often be quite lengthy, so it is recommended that agencies plan ahead to ensure that the agreement does not delay the project.
When implementing an agreement for ITS, it is recommended that as a first step any existing agreements are reviewed to determine whether they can be amended or modified to include the additional requirements that will come with deploying a system. If there are no existing agreements that can be modified or used for ITS implementation, then a new agreement will need to be developed. The formality and type of agreement used is a key consideration. If the arrangement will be in affect for an extended duration or involve any sort of long term maintenance, then written agreements should be used. Often during long term operations, staff may change and a verbal agreement between agency representatives may be forgotten by new staff.
Common agreement types and potential applications include:
Handshake Agreement: Handshake agreements are often used in the early stage of a project. This type of informal agreement depends very much on relationships between agencies and may not be appropriate for long term operations where staff is likely to change.
Memorandum of Understanding (MOU): A MOU demonstrates general consensus or willingness to participate as part of a particular project but is not typically very detailed.
Interagency and Intergovernmental Agreements: These agreements between public agencies can be used for operation, maintenance, or funding of its projects and systems. They can include documentation on the responsibility of each agency, functions they will provide, and liability.
Funding Agreements: Funding agreements document the funding arrangements for ITS projects. At a minimum, funding agreements include a detailed scope, services to be performed, and a detailed project budget.

1/31/2008 Bay Region 46 Final Regional ITS Architecture
Master Agreements: Master agreements include standard contract language for an agency and serve as the main agreement between two entities which guides all business transactions. Use of a master agreement can allow an agency to do business with another agency or private entity without having to go through the often lengthy development of a formal agreement each time.
Table 9 provides a list of existing and potential agreements for the Bay Region based on the interfaces identified in the Regional ITS Architecture. It is important to note that as ITS services and systems are implemented in the Region, part of the planning and review process for those projects should include a review of potential agreements that would be needed for implementation or operations.
Table 9 - Bay Region Potential Agreements
Status Agreement and Agencies Agreement Description
Future Joint Operations/Shared Control Agreements (Public-Public or Public-Private)
These agreements would allow joint operations or control of certain systems and equipment. The agreement should define such items as hours of operation and time of day/day of week when shared control would take effect, circumstances, or incidents when shared control would take effect, notification procedures between the agencies agreeing to shared control arrangements, overriding capabilities of owning agency, etc. Private agencies, such as information service providers that provide traffic reports, could also be part of this agreement.
Future Data Sharing and Usage (Public-Public)
These agreements would define the parameters, guidelines, and policies for inter- and intra-agency ITS data sharing. This data sharing would support regional activities related to traffic management, incident management, traveler information, and other functions. The terms of this agreement should generally address such items as types of data and information to be shared, how the information will be used (traffic incident information to be shared, displayed on web site for travel information, distributed to private media, etc.), and parameters for data format, quality, security.
Future Data Sharing and Usage (Public-Private)
These agreements would define the parameters, guidelines, and policies for private sector (such as the media or other information service providers) use of ITS data. This type of agreement is recommended to define terms of use for broadcasting public-agency information regarding traffic conditions, closures, restrictions, as well as video images. Agreements can also include requirements for the media to ‘source’ the information (i.e., using the providing agency’s logo on all video images broadcast.
Future Mutual Aid Agreements (Public-Public)
Mutual aid agreements often exist as either formal or informal arrangements. They are a routine practice among many public safety and emergency services agencies. Formal mutual aid agreements will become more important as agencies integrate systems and capabilities, particularly automated dispatch and notification. Formalized agreements should be considered as ITS or other electronic data sharing systems are implemented in the Region.

1/31/2008 Bay Region 47 Final Regional ITS Architecture
4.5 Phases of Implementation
The Regional ITS Architecture will be implemented over time through a series of projects led by both public sector and private sector agencies. Key foundation systems will need to be implemented in order to support other systems that have been identified in the Regional ITS Architecture. The deployment of all of the systems required to achieve the final Regional ITS Architecture build out will occur over many years.
A sequence of projects and their respective time frames will be identified in the Bay Regional ITS Deployment Plan. These projects will be sequenced over a 10-year period, with projects identified for deployment in 5- and 10- year timeframes.
Some of the key market packages that will provide the functions for the foundation systems in the Bay Region are listed below. Projects associated with these and other market packages identified for the Region will be included in the Bay Regional ITS Deployment Plan.
Network Surveillance; Maintenance and Construction Vehicle Tracking; Weather Information Processing and Distribution; Surface Street Control; Traffic Information Dissemination; and Transit Vehicle Tracking

1/31/2008 Bay Region 48 Final Regional ITS Architecture
5. USE AND MAINTENANCE PLAN FOR THE REGIONAL ITS ARCHITECTURE
The ITS Architecture developed for the Bay Region addresses the Region’s vision for ITS implementation at the time the plan was developed. Stakeholders invested a considerable amount of effort in the development of the Regional ITS Architecture and Regional ITS Deployment Plan. As the Region grows, needs will change, and, as technology progresses, new ITS opportunities will arise. Shifts in regional needs and focus as well as changes in the National ITS Architecture will necessitate that the Bay Region ITS Architecture be updated to remain a useful resource for the Region.
The following section outlines how the Region and its stakeholders can work with the MDOT ITS Program Office to ensure projects are in conformity and also provide updates as ITS evolves in the region.
5.1 Process for Determining Architecture Conformity
The Bay Regional ITS Architecture and Deployment Plan documents the customized market packages that were developed as part of the ITS architecture process. To satisfy federal requirements and remain eligible to use federal funds, a project must be accurately documented. To document the conformity of an ITS project with the regional architecture, MDOT's ITS Program Office will oversee the development of a regional architecture conformance form to guide project managers through the process. The project managers will be able to coordinate with the ITS Program Office and regional contact for additional assistance and guidance. The steps of the process are as follows:
Identify the ITS components in the project; Identify the corresponding market packages(s) from the Regional ITS Architecture; Locate the component within the market package; Compare the connections to other agencies or elements documented in the ITS architecture as
well as the information flows between them to the connections that will be part of the project; Assess the use of relevant standards; and Document any changes necessary to the ITS Architecture or the project to ensure there is
conformance.
Identifying the ITS Components
ITS components can be fairly apparent in an ITS focused project such as CCTV or DMS deployments, but could also be included in other types of projects. For example, an arterial widening project could include the installation of signal system interconnect, signal upgrades, and the incorporation of the signals in the project limits into the MDOT’s signal system. These are all ITS deployments and should be part of the ITS architecture.
Identifying the Corresponding Market Packages
If a project was included in Table 10 of the Deployment Plan, then the applicable market package(s) for that project are identified in a column. ITS projects are not required to be included in the ITS Deployment Plan in order to be eligible for federal funding; therefore, market packages might need to be identified without the assistance of an ITS Deployment Plan. In that case, the market packages selected and customized for the Bay Region are identified in Table 5 of this document, detailed market package definitions are located in Appendix A, and customized market packages for the Bay Region are included in Appendix B.

1/31/2008 Bay Region 49 Final Regional ITS Architecture
Identifying the Component within the Market Package
The customized market packages for the Bay Region are located in Appendix B. Once the element is located on the market package, the evaluator may determine that the element name should be modified. For example, an element called the Local Agency TOC was included in the architecture, but at the time of deployment, City of Saginaw will more than likely decide to call the center by a specific name. This name change should be documented using the process outlined in Section 1.3.
Evaluating the Connections and Flows
The connections and architecture flows documented in the market package diagrams were selected based on the information available at the time the plan was developed. As the projects are designed, decisions will be made on the system layout that might differ from what is shown in the market package. These changes in the project should be documented in the ITS market packages using the process outlined in Section 1.3.
Relevant Standards
ITS Standards are documented guidelines or rules specifying the interconnections among elements and the characteristics of technologies and products to be used in ITS installations. Standards describe in detail what types of interfaces should exist between ITS components and how the components will exchange information and work together to deliver certain user services. The Bay Regional ITS Architecture highlights the relevant standards based on the region’s needs. These standards should be reviewed as part of this conformity exercise. Where standards can be utilized, they should be noted. Where standards are not or could not be utilized, an explanation of why, also should be noted.
Documenting Required Changes
If any changes are needed to accommodate the project under review, Section 1.3 describes how those changes should be documented. Any changes will be incorporated during the next architecture update. Conformance will be accomplished by documenting how the market package(s) should be modified so that the connections and data flows are consistent with the project.
5.2 Maintenance Process
MDOT’s ITS Program Office will be responsible for leading the maintenance of the Bay Regional ITS Architecture and Deployment Plan in coordination with the regional contact. Maintenance includes modifications to the plan as well as complete updates. Table 10 summarizes the maintenance process agreed upon by stakeholders in the Region.

1/31/2008 Bay Region 50 Final Regional ITS Architecture
Table 10 - Regional ITS Architecture and Deployment Plan Maintenance Summary
Regional ITS Architecture Regional ITS Deployment Plan Maintenance
Details Modification Complete Update Modification Complete
Update Timeframe for Updates As needed Every 5-7 years As needed Every 5-7 years
Scope of Update
Update market packages to
satisfy architecture
conformance requirements of
projects or to document other
changes that impact the ITS
Architecture
Entire ITS Architecture
Update project status and add or remove projects
as needed
Entire ITS Deployment Plan
Lead Agency MDOT ITS Program Office* MDOT ITS Program Office*
Participants Stakeholders impacted by
market package modifications
Entire stakeholder group Entire stakeholder group
Results
Market package or other change(s) documented for next complete
update
Updated Bay Regional ITS Architecture document,
Appendices, and Turbo Architecture
database
Updated project tables
Updated Bay Regional ITS
Deployment Plan document
* Transit related projects will be supported by MDOT’s Bureau of Passenger Transportation
Modifications to the Regional ITS Architecture and Deployment Plan will often be necessitated by ITS projects that are receiving federal funding but do not conform to the Regional ITS Architecture. MDOT’s ITS Program Office will take the lead in working with agencies that receive federal funding for ITS projects and will keep a record of any changes that are needed to the Regional ITS Architecture. Complete updates to the Regional ITS Architecture will occur approximately every five to seven years and will be led by the MDOT’s ITS Program Office with support from the MDOT Bay Region and other key stakeholders. The entire stakeholder group that was engaged to develop this first Regional ITS Architecture will be reconvened for the complete updates.
5.3 Procedure for Submitting ITS Architecture Changes Between Scheduled Updates
Updates to the Bay Regional ITS Architecture will occur on a regular basis as described in Section 1.2 to maintain the architecture as a useful planning tool. Between complete plan updates, smaller modifications will likely be required to accommodate ITS projects in the Region. Section 1.1 contains step by step guidance for determining whether or not a project requires architecture modifications.
For situations where a change is required, an ITS Architecture Maintenance Documentation Form was developed and is included in Appendix E. This form should be completed and submitted to the MDOT ITS Program Office whenever a change to the Regional ITS Architecture or
1/31/2008 Bay Region 51 Final Regional ITS Architecture
Deployment Plan is proposed. Please note that MDOT’s Bureau of Passenger Transportation also should be copied if the project has a transit related component.
The Maintenance Documentation form identifies three levels of modifications. They include:
Level 1 – Basic changes that do not affect the structure of the architecture. Examples include: Changes to stakeholder or element name, element status, or data flow status.
Level 2 – Structural changes that impact only one agency. Examples include: Addition of a new market package or modifications to an existing market package that affects only one agency.
Level 3 – Structural changes that have the potential to impact multiple agencies. Examples include: Addition of a new market package or modifications to an existing market package that involves multiple agencies or incorporation of a new stakeholder into the architecture.
While documenting the proposed change, the project manager completing the change form should coordinate with any of the other agencies that may be impacted by the modification. This communication between agencies will simplify the process of performing a complete plan update. MDOT’s ITS Program Office will review and accept the proposed changes. When a complete update is performed by MDOT’s ITS Program Office, all of the documented changes will be incorporated into the regional ITS architecture. Figure 11 graphically illustrates this process.
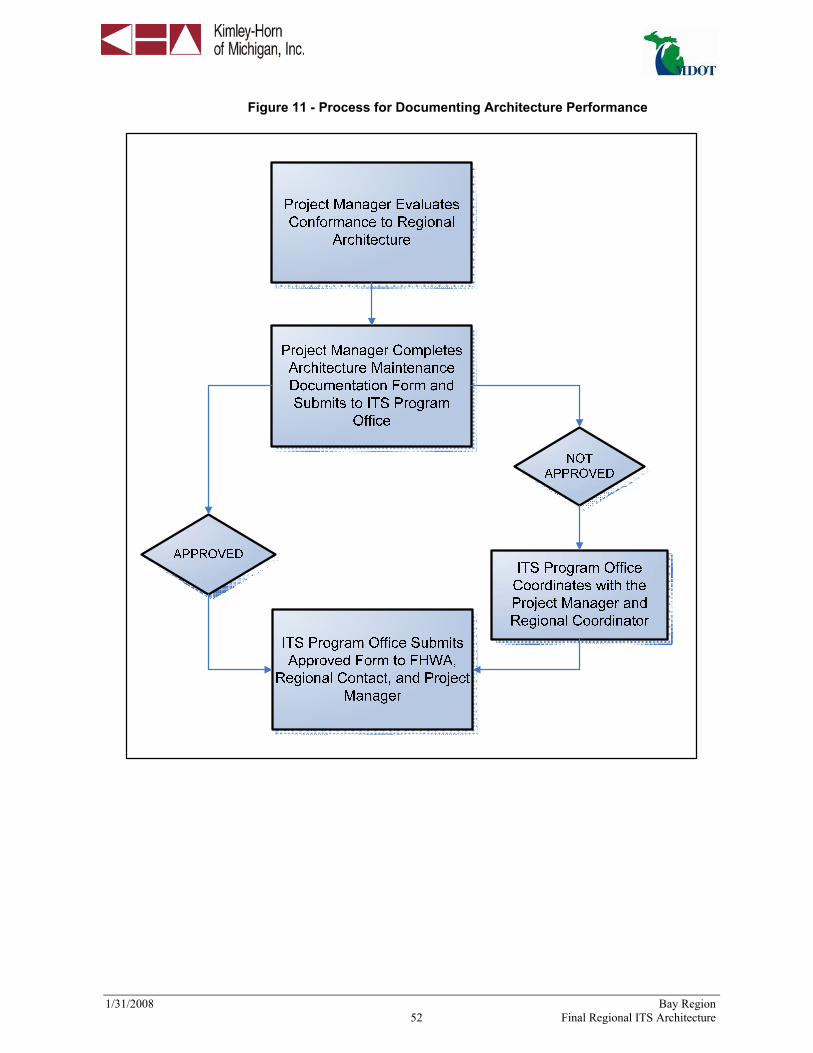
1/31/2008 Bay Region 52 Final Regional ITS Architecture
Figure 11 - Process for Documenting Architecture Performance

APPENDIX A – MARKET PACKAGE DEFINITIONS
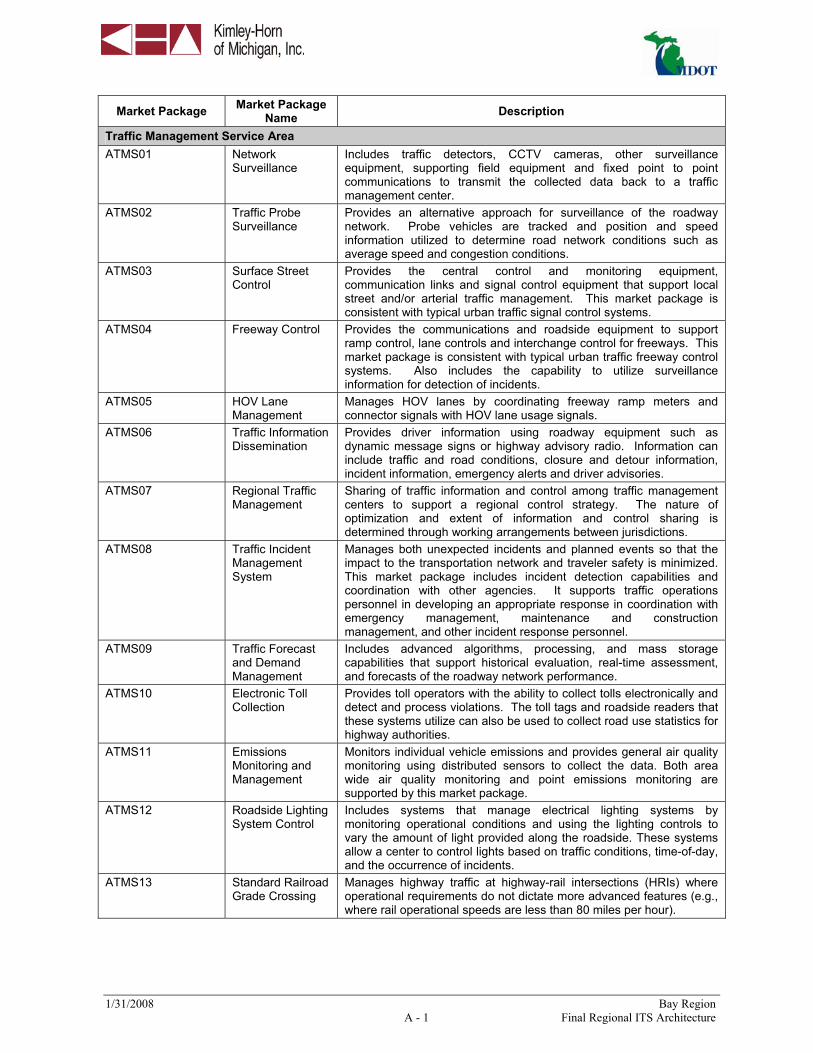
1/31/2008 Bay Region A - 1 Final Regional ITS Architecture
Market Package Market Package Name Description
Traffic Management Service Area ATMS01 Network
Surveillance Includes traffic detectors, CCTV cameras, other surveillance equipment, supporting field equipment and fixed point to point communications to transmit the collected data back to a traffic management center.
ATMS02 Traffic Probe Surveillance
Provides an alternative approach for surveillance of the roadway network. Probe vehicles are tracked and position and speed information utilized to determine road network conditions such as average speed and congestion conditions.
ATMS03 Surface Street Control
Provides the central control and monitoring equipment, communication links and signal control equipment that support local street and/or arterial traffic management. This market package is consistent with typical urban traffic signal control systems.
ATMS04 Freeway Control Provides the communications and roadside equipment to support ramp control, lane controls and interchange control for freeways. This market package is consistent with typical urban traffic freeway control systems. Also includes the capability to utilize surveillance information for detection of incidents.
ATMS05 HOV Lane Management
Manages HOV lanes by coordinating freeway ramp meters and connector signals with HOV lane usage signals.
ATMS06 Traffic Information Dissemination
Provides driver information using roadway equipment such as dynamic message signs or highway advisory radio. Information can include traffic and road conditions, closure and detour information, incident information, emergency alerts and driver advisories.
ATMS07 Regional Traffic Management
Sharing of traffic information and control among traffic management centers to support a regional control strategy. The nature of optimization and extent of information and control sharing is determined through working arrangements between jurisdictions.
ATMS08 Traffic Incident Management System
Manages both unexpected incidents and planned events so that the impact to the transportation network and traveler safety is minimized. This market package includes incident detection capabilities and coordination with other agencies. It supports traffic operations personnel in developing an appropriate response in coordination with emergency management, maintenance and construction management, and other incident response personnel.
ATMS09 Traffic Forecast and Demand Management
Includes advanced algorithms, processing, and mass storage capabilities that support historical evaluation, real-time assessment, and forecasts of the roadway network performance.
ATMS10 Electronic Toll Collection
Provides toll operators with the ability to collect tolls electronically and detect and process violations. The toll tags and roadside readers that these systems utilize can also be used to collect road use statistics for highway authorities.
ATMS11 Emissions Monitoring and Management
Monitors individual vehicle emissions and provides general air quality monitoring using distributed sensors to collect the data. Both area wide air quality monitoring and point emissions monitoring are supported by this market package.
ATMS12 Roadside Lighting System Control
Includes systems that manage electrical lighting systems by monitoring operational conditions and using the lighting controls to vary the amount of light provided along the roadside. These systems allow a center to control lights based on traffic conditions, time-of-day, and the occurrence of incidents.
ATMS13 Standard Railroad Grade Crossing
Manages highway traffic at highway-rail intersections (HRIs) where operational requirements do not dictate more advanced features (e.g., where rail operational speeds are less than 80 miles per hour).

1/31/2008 Bay Region A - 2 Final Regional ITS Architecture
Market Package Market Package Name Description
Traffic Management Service Area (continued) ATMS14 Advanced
Railroad Grade Crossing
Manages highway traffic at highway-rail intersections (HRIs) where operational requirements demand advanced features (e.g., where rail operational speeds are greater than 80 miles per hour).
ATMS15 Railroad Operations Coordination
Provides an additional level of strategic coordination between freight rail operations and traffic management centers. Could include train schedules, maintenance schedules or any other anticipated HRI closures.
ATMS16 Parking Facility Management
Provides enhanced monitoring and management of parking facilities. Market package assists in the management of parking operations, coordinates with transportation authorities, and supports electronic collection of parking fees.
ATMS17 Regional Parking Management
Supports coordination between parking facilities to enable regional parking management strategies.
ATMS18 Reversible Lane Management
Provides for the management of reversible lane facilities and includes the field equipment, physical lane access controls, and associated control electronics.
ATMS19 Speed Monitoring Monitors the speeds of vehicles traveling through a roadway system. Roadside equipment can suggest a safe driving speed.
ATMS20 Drawbridge Management
Supports systems that manage drawbridges at rivers and canals and other multimodal crossings. Includes control devices as well as traveler information systems.
ATMS21 Roadway Closure Management
Closes roadways to vehicular traffic when driving conditions are unsafe, maintenance must be performed, or other scenarios where access to the roadway must be prohibited. Market package covers general road closures applications; specific closure systems that are used at railroad grade crossings, drawbridges, reversible lanes, etc. are covered by other market packages.
Emergency Management Service Area EM01 Emergency Call -
Taking and Dispatch
Provides basic public safety call-taking and dispatch services. Includes emergency vehicle equipment, equipment used to receive and route emergency calls, wireless communications and coordination between emergency management agencies.
EM02 Emergency Routing
Supports automated vehicle location and dynamic routing of emergency vehicles. Traffic information, road conditions and suggested routing information are provided to enhance emergency vehicle routing. Includes dedicated short range communications for local signal preemption and the transmission of alerts to surrounding vehicles.
EM03 Mayday Alarms Support
Allows the user to initiate a request for emergency assistance and enables the emergency management subsystem to locate the user (driver or non-driver), gather information about the incident and determine the appropriate response.
EM04 Roadway Service Patrols
Supports the roadway service patrol vehicles that aid motorists, offering rapid response to minor incidents (flat tire, accidents, out of gas) to minimize disruption to the traffic stream. This market package monitors service patrol vehicle locations and supports vehicle dispatch.
EM05 Transportation Infrastructure Protection
Includes the monitoring of transportation infrastructure (e.g. bridges, tunnels and management centers) for potential threats using sensors, surveillance equipment, barriers and safeguard systems to preclude an incident, control access during and after an incident or mitigate the impact of an incident. Threats can be acts of nature, terrorist attacks or other incidents causing damage to the infrastructure.

1/31/2008 Bay Region A - 3 Final Regional ITS Architecture
Market Package Market Package Name Description
Emergency Management Service Area (continued) EM06 Wide-Area Alert Uses ITS driver and traveler information systems to alert the public in
emergency situations such as child abductions, severe weather, civil emergencies or other situations that pose a threat to life and property.
EM07 Early Warning System
Monitors and detects potential, looming and actual disasters including natural, technological and man-made disasters. The market package monitors alerting and advisory systems, ITS sensors and surveillance systems, field reports, and emergency call-taking systems to identify emergencies and notifies all responding agencies of detected emergencies.
EM08 Disaster Response and Recovery
Enhances the ability of the surface transportation system to respond to and recover from disasters. Supports coordination of emergency response plans, provides enhanced access to the scene and better information about the transportation system in the vicinity of the disaster, and maintains situation awareness.
EM09 Evacuation and Reentry Management
Supports evacuation of the general public from a disaster area and manages subsequent reentry to the disaster area. This market package supports both anticipated, well-planned and orderly evacuations such as for a hurricane, as well as sudden evacuations with little or no time for preparation or public warning such as a terrorist act. Supports coordination of evacuation plans among the federal, state, and local transportation, emergency, and law enforcement agencies that may be involved.
EM10 Disaster Traveler Information
Use of ITS to provide disaster-related traveler information to the general public, including evacuation and reentry information and other information concerning the operation of the transportation system during a disaster.
Maintenance and Construction Management Service Area MC01 Maintenance and
Construction Vehicle and Equipment Tracking
Tracks the location of maintenance and construction vehicles and other equipment to ascertain the progress of their activities.
MC02 Maintenance and Construction Vehicle Maintenance
Performs vehicle maintenance scheduling and manages both routine and corrective maintenance activities. Includes on-board sensors capable of automatically performing diagnostics.
MC03 Road Weather Data Collection
Collects current road weather conditions using data collected from environmental sensors deployed on and about the roadway. The market package may also request and receive qualified data sets from meteorological systems.
MC04 Weather Information Processing and Distribution
Processes and distributes the environmental information collected from the Road Weather Data Collection market package. This market package uses the environmental data to detect environmental hazards such as icy road conditions, high winds, dense fog, etc. so system operators can make decisions on corrective actions to take.
MC05 Roadway Automated Treatment
Automatically treats a roadway section based on environmental or atmospheric conditions. Includes the sensors that detect adverse conditions, automated treatment (such as anti-icing chemicals), and driver information systems.
MC06 Winter Maintenance
Supports winter road maintenance. Monitors environmental conditions and weather forecasts and uses the information to schedule winter maintenance activities.
MC07 Roadway Maintenance and Construction
Supports numerous services for scheduled and unscheduled maintenance and construction on a roadway system or right-of-way. Environmental conditions information is also received from various weather sources to aid in scheduling maintenance and construction activities.
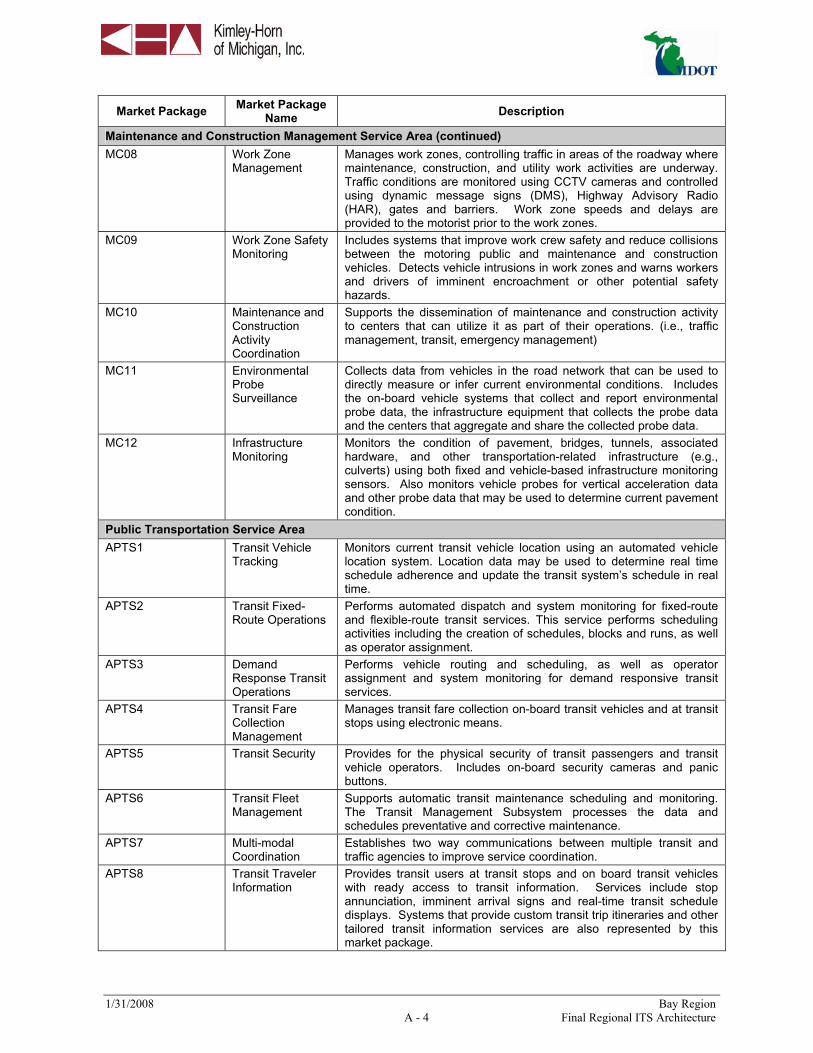
1/31/2008 Bay Region A - 4 Final Regional ITS Architecture
Market Package Market Package Name Description
Maintenance and Construction Management Service Area (continued) MC08 Work Zone
Management Manages work zones, controlling traffic in areas of the roadway where maintenance, construction, and utility work activities are underway. Traffic conditions are monitored using CCTV cameras and controlled using dynamic message signs (DMS), Highway Advisory Radio (HAR), gates and barriers. Work zone speeds and delays are provided to the motorist prior to the work zones.
MC09 Work Zone Safety Monitoring
Includes systems that improve work crew safety and reduce collisions between the motoring public and maintenance and construction vehicles. Detects vehicle intrusions in work zones and warns workers and drivers of imminent encroachment or other potential safety hazards.
MC10 Maintenance and Construction Activity Coordination
Supports the dissemination of maintenance and construction activity to centers that can utilize it as part of their operations. (i.e., traffic management, transit, emergency management)
MC11 Environmental Probe Surveillance
Collects data from vehicles in the road network that can be used to directly measure or infer current environmental conditions. Includes the on-board vehicle systems that collect and report environmental probe data, the infrastructure equipment that collects the probe data and the centers that aggregate and share the collected probe data.
MC12 Infrastructure Monitoring
Monitors the condition of pavement, bridges, tunnels, associated hardware, and other transportation-related infrastructure (e.g., culverts) using both fixed and vehicle-based infrastructure monitoring sensors. Also monitors vehicle probes for vertical acceleration data and other probe data that may be used to determine current pavement condition.
Public Transportation Service Area APTS1 Transit Vehicle
Tracking Monitors current transit vehicle location using an automated vehicle location system. Location data may be used to determine real time schedule adherence and update the transit system’s schedule in real time.
APTS2 Transit Fixed-Route Operations
Performs automated dispatch and system monitoring for fixed-route and flexible-route transit services. This service performs scheduling activities including the creation of schedules, blocks and runs, as well as operator assignment.
APTS3 Demand Response Transit Operations
Performs vehicle routing and scheduling, as well as operator assignment and system monitoring for demand responsive transit services.
APTS4 Transit Fare Collection Management
Manages transit fare collection on-board transit vehicles and at transit stops using electronic means.
APTS5 Transit Security Provides for the physical security of transit passengers and transit vehicle operators. Includes on-board security cameras and panic buttons.
APTS6 Transit Fleet Management
Supports automatic transit maintenance scheduling and monitoring. The Transit Management Subsystem processes the data and schedules preventative and corrective maintenance.
APTS7 Multi-modal Coordination
Establishes two way communications between multiple transit and traffic agencies to improve service coordination.
APTS8 Transit Traveler Information
Provides transit users at transit stops and on board transit vehicles with ready access to transit information. Services include stop annunciation, imminent arrival signs and real-time transit schedule displays. Systems that provide custom transit trip itineraries and other tailored transit information services are also represented by this market package.

1/31/2008 Bay Region A - 5 Final Regional ITS Architecture
Market Package Market Package Name Description
Public Transportation Service Area (continued) APTS9 Transit Signal
Priority Determines the need for transit priority on routes and at certain intersections and requests transit vehicle priority at these locations.
APTS10 Transit Passenger Counting
Counts the number of passengers entering and exiting a transit vehicle using sensors mounted on the vehicle and communicates the collected passenger data back to the management center.
Commercial Vehicle Operations Service Area CVO01 Fleet
Administration Provides the capabilities to manage a fleet of commercial vehicles. Vehicle routing and tracking as well as notification of emergency management of any troublesome route deviations (such as a HAZMAT vehicle) are part of this market package.
CVO02 Freight Administration
Tracks the movement of cargo and monitors the cargo condition.
CVO03 Electronic Clearance
Provides for automatic clearance at roadside check facilities. Allows a good driver/vehicle/carrier to pass roadside facilities at highway speeds using transponders and dedicated short range communications to the roadside.
CVO04 CV Administrative Processes
Provides for electronic application, processing, fee collection, issuance and distribution of CVO credentials and tax filing.
CVO05 International Border Electronic Clearance
Provides for automated clearance at international border crossings.
CVO06 Weigh-In-Motion Provides for high speed weigh-in-motion with or without automated vehicle identification capabilities.
CVO07 Roadside CVO Safety
Provides for automated roadside safety monitoring and reporting. Automates commercial vehicle safety inspections at the roadside check locations.
CVO08 On-board CVO and Freight Safety & Security
Provides for on-board commercial vehicle safety monitoring and reporting as well as roadside support for reading on-board safety data via tags.
CVO09 CVO Fleet Maintenance
Supports maintenance of CVO fleet vehicles with on-board monitoring equipment and automated vehicle location capabilities.
CVO10 HAZMAT Management
Integrates incident management capabilities with commercial vehicle tracking to assure effective treatment of HAZMAT material and incidents.
CVO11 Roadside HAZMAT Security Detection and Mitigation
Provides the capability to detect and classify security sensitive HAZMAT on commercial vehicles using roadside sensing and imaging technology. Credentials information can be accessed to verify if the commercial driver, vehicle and carrier are permitted to transport the identified HAZMAT.
CVO12 CV Driver Security Authentication
Provides the ability for Fleet and Freight Management to detect when an unauthorized commercial vehicle driver attempts to drive a vehicle based on stored identity information. If an unauthorized driver has been detected the commercial vehicle can be disabled.
CVO13 Freight Assignment Tracking
Provides for the planning and tracking of the commercial vehicle, freight equipment and the commercial vehicle driver.
Traveler Information Service Area ATIS1 Broadcast
Traveler Information
Collects traffic conditions, advisories, general public transportation, toll and parking information, incident information, roadway maintenance and construction information, air quality and weather information, and broadly disseminates this information through existing infrastructures (radio, cell phones, etc.).

1/31/2008 Bay Region A - 6 Final Regional ITS Architecture
Market Package Market Package Name Description
Traveler Information Service Area (continued) ATIS2 Interactive
Traveler Information
Provides tailored information in response to a traveler request. The traveler can obtain current information regarding traffic conditions, roadway maintenance and construction, transit services, ride share/ride match, parking management, detours and pricing information.
ATIS3 Autonomous Route Guidance
Using vehicle location and other information, this market package enables route planning and detailed route guidance based on static, stored information.
ATIS4 Dynamic Route Guidance
Offers advanced route planning and guidance that is responsive to current conditions.
ATIS5 ISP Based Trip Planning Route Guidance
Offers the user pre-trip route planning and turn-by-turn route guidance services. Routes may be based on static or real time network conditions.
ATIS6 Transportation Operations Data Sharing
Makes real-time transportation operations data available to transportation system operators so they can manage their individual systems based on an overall view of the regional transportation system.
ATIS7 Yellow Pages and Reservation
Provides yellow pages and reservations services to the user.
ATIS8 Dynamic Ridesharing
Provides dynamic ridesharing/ride matching services to travelers.
ATIS9 In Vehicle Signing Augments regulatory, warning, and informational road signs and signals by providing information directly to drivers through in-vehicle devices. It includes short range communications between roadside equipment and the vehicle and connections to the Traffic Management Subsystem for monitoring and control.
ATIS10 VII Traveler Info Provides location-specific information including travel times, incident information, road conditions, and emergency traveler information to travelers in vehicles using Vehicle Infrastructure Integration (VII).
Archived Data Management Service Area AD1 ITS Data Mart Provides a focused archive that houses data collected and owned by
a single agency or other organization. Focused archive typically covers a single transportation mode and one jurisdiction.
AD2 ITS Data Warehouse
Includes all the data collection and management capabilities of the ITS Data Mart. Adds the functionality to allow collection of data from multiple agencies and data sources across modal and jurisdictional boundaries.
AD3 ITS Virtual Data Warehouse
Provides the same broad access to multimodal, multidimensional data from varied sources as in the ITS Data Warehouse Market Package, but provides this access using enhanced interoperability between physically distributed ITS archives that are each locally managed.
Advanced Vehicle Safety AVSS01 Vehicle Safety
Monitoring Diagnoses critical components of the vehicle and warns the driver of potential dangers. On-board sensors will determine the vehicle’s condition, performance, on-board safety data, and display information.
AVSS02 Driver Safety Monitoring
Determines the driver’s condition, and warns the driver of potential dangers. On-board sensors will determine the driver’s condition, performance, on-board safety data, and display information.
AVSS03 Longitudinal Safety Monitoring
Using safety sensors and collision sensors, it requires on-board sensors to monitor the areas in front of and behind the vehicle and present warnings to the driver about potential hazards.
AVSS04 Lateral Safety Warning
Using safety sensors and collision sensors, it requires on-board sensors to monitor the areas to the sides of the vehicle and present warnings to the driver about potential hazards.

1/31/2008 Bay Region A - 7 Final Regional ITS Architecture
Market Package Market Package Name Description
Advanced Vehicle Safety (continued) AVSS05 Intersection
Safety Warning Determines the probability of a collision in an equipped intersection (either highway-highway or highway-rail) and provide timely warnings to drivers in response to hazardous conditions. Monitors in the roadway infrastructure assess vehicle locations and speeds near an intersection. Using this information, a warning is determined and communicated to the approaching vehicle using a short range communications system. Information can be provided to the driver through the market package ATIS9--In-Vehicle Signing.
AVSS06 Pre-Crash Restraint Deployment
Provides in-vehicle sensors to monitor the vehicle's local environment, determine collision probability and deploy a pre-crash safety system. It will include on-board sensors to measure lateral and longitudinal gaps and together with weather and roadway conditions will determine lateral and longitudinal collision probability. It will have the mechanism to deploy a pre-crash safety system.
AVSS07 Driver Visibility Improvement
Enhances the driver visibility using an enhanced vision system. On-board display hardware is needed
AVSS08 Advanced Vehicle Longitudinal Control
Automates the speed and headway control functions on board the vehicle. It utilizes safety sensors and collision sensors combined with vehicle dynamics processing to control the throttle and brakes. It requires on-board sensors to measure longitudinal gaps and a processor for controlling the vehicle speed.
AVSS09 Advanced Vehicle Lateral Control
Automates the steering control on board the vehicle. It utilizes safety sensors and collision sensors combined with vehicle dynamics processing to control the steering. It requires on-board sensors to measure lane position and lateral deviations and a processor for controlling the vehicle steering.
AVSS10 Intersection Collision Avoidance
Determine the probability of an intersection collision and provides timely warnings to approaching vehicles so that avoidance actions can be taken. This market package builds on the Intersection Collision Warning infrastructure and in-vehicle equipment and adds equipment in the vehicle that can take control of the vehicle in emergency situations.
AVSS11 Automated Highway System
Enables “hands-off” operation of the vehicle on the automated portion of the highway system. Implementation requires lateral lane holding, vehicle speed and steering control, and Automated Highway System check-in and checkout.
AVSS12 Cooperative Vehicle Safety Systems
Enhances the on-board longitudinal and lateral warning stand-alone systems by exchanging messages wirelessly with other surrounding vehicles. Vehicles send out information concerning their location, speed, and direction to any surrounding vehicles. Special messages from approaching emergency vehicles may also be received and processed.

APPENDIX D – STAKEHOLDER DATABASE

Bay RegionStakeholders
First NameOrganization Mailing AddressLast NameWorkshop Attendance
Kick-Off ITS Architecture ITS Deployment Plan Comment Resolution
EngelhardtDaveBay City Area Transportation Study (BCATS) - Bay County
515 Center AvenueBay City MI 48706
LilloJamesBay County Road Commission 2600 East Beaver RoadKawkawlin MI 48631
CardinaliGlennBay Metro Transit 1510 North Johnson StreetBay City MI 48708
SpragueEricBay Metro Transit 1510 North Johnson StreetBay City MI 48708
LaadAnamikaECMPDR (Regional Planning Commission)
3144 Davenport Avenue, Suite 200Saginaw MI 48602
CrothersTimFHWA - HDA-MT 400 Seventh Street, SWWashington DC 20590
HoevelMorrieFHWA - Michigan 315 West Allegan, Suite 201Lansing MI 48933
GregorySharonGenesee County Metropolitan Planning Commission
1101 Beach StreetFlint MI 48502
NordbergJasonGenesee County Metropolitan Planning Commission
1101 Beach Street, Room 223Flint MI 48502
JohnsonKennethGenesee County Road Commission
211 West Oakley StreetFlint MI 48503
MichaelChristinaGenesee County Road Commission
211 West Oakley StreetFlint MI 48503
WoodBonnieGenesee County Road Commission
211 West Oakley StreetFlint MI 48503
WelkeRayGratiot County Road Commission
214 East Center StreetIthaca MI 48847
MaddenChuckLapeer Intermediate School District
690 North Lake Pleasant RoadAttica MI 48412
Wednesday, December 19, 2007 Page 1 of 3Bay Region
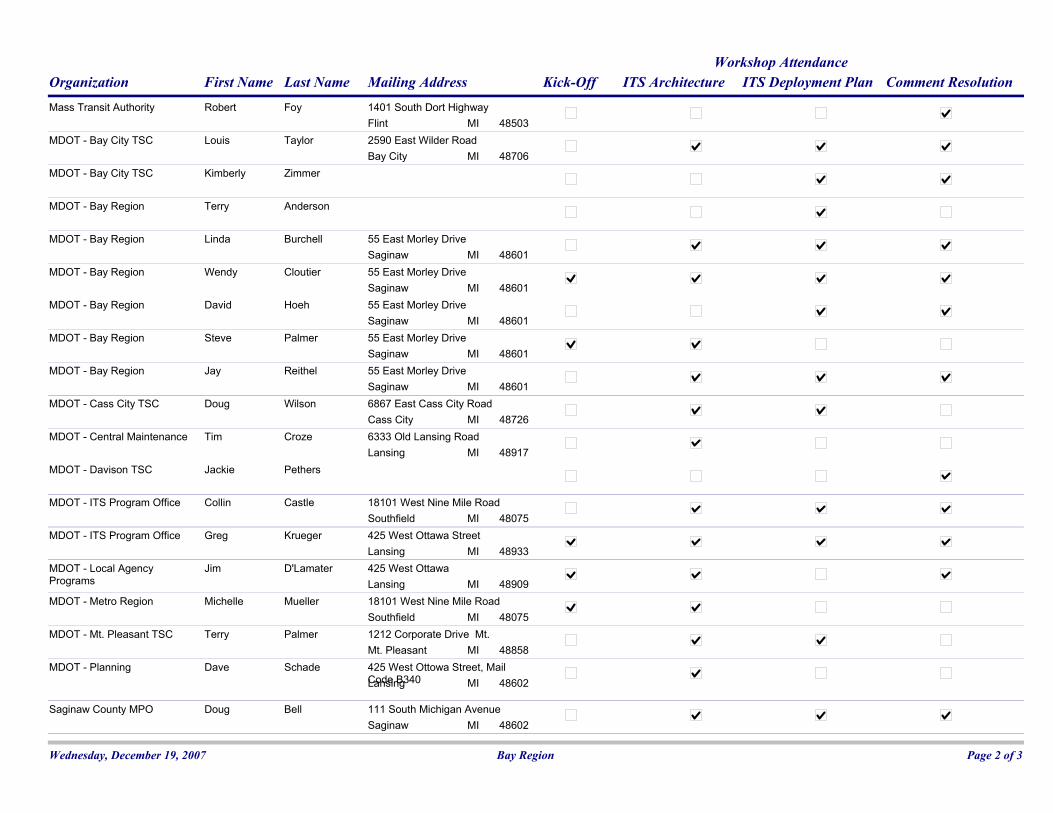
First NameOrganization Mailing AddressLast NameWorkshop Attendance
Kick-Off ITS Architecture ITS Deployment Plan Comment Resolution
FoyRobertMass Transit Authority 1401 South Dort HighwayFlint MI 48503
TaylorLouisMDOT - Bay City TSC 2590 East Wilder RoadBay City MI 48706
ZimmerKimberlyMDOT - Bay City TSC
AndersonTerryMDOT - Bay Region
BurchellLindaMDOT - Bay Region 55 East Morley DriveSaginaw MI 48601
CloutierWendyMDOT - Bay Region 55 East Morley DriveSaginaw MI 48601
HoehDavidMDOT - Bay Region 55 East Morley DriveSaginaw MI 48601
PalmerSteveMDOT - Bay Region 55 East Morley DriveSaginaw MI 48601
ReithelJayMDOT - Bay Region 55 East Morley DriveSaginaw MI 48601
WilsonDougMDOT - Cass City TSC 6867 East Cass City RoadCass City MI 48726
CrozeTimMDOT - Central Maintenance 6333 Old Lansing RoadLansing MI 48917
PethersJackieMDOT - Davison TSC
CastleCollinMDOT - ITS Program Office 18101 West Nine Mile RoadSouthfield MI 48075
KruegerGregMDOT - ITS Program Office 425 West Ottawa StreetLansing MI 48933
D'LamaterJimMDOT - Local Agency Programs
425 West OttawaLansing MI 48909
MuellerMichelleMDOT - Metro Region 18101 West Nine Mile RoadSouthfield MI 48075
PalmerTerryMDOT - Mt. Pleasant TSC 1212 Corporate Drive Mt.Mt. Pleasant MI 48858
SchadeDaveMDOT - Planning 425 West Ottowa Street, Mail Code B340Lansing MI 48602
BellDougSaginaw County MPO 111 South Michigan AvenueSaginaw MI 48602
Wednesday, December 19, 2007 Page 2 of 3Bay Region

First NameOrganization Mailing AddressLast NameWorkshop Attendance
Kick-Off ITS Architecture ITS Deployment Plan Comment Resolution
MillerBillSaginaw County Road Commission
3020 Sheridan Ave.Saginaw MI 48605
GrimaldiPhilSaginaw Metropolitan Area Transportation Study (SMATS) and SCMPC
615 Court StreetSaginaw MI 48602
WrightBillSaginaw Transit Authority Regional Services
301East Genesee STE 500Saginaw MI 48607
ZaweruchaMichelleTuscola County Road Commission
1733 Mertz RoadCaro MI 48723
Wednesday, December 19, 2007 Page 3 of 3Bay Region

APPENDIX E – ARCHITECTURE CONFORMANCE AND MAINTENANCE DOCUMENTATION FORM

Page 1 of 2
Regional ITS Architecture Architecture Conformance and Maintenance Documentation Form
Please complete the following questionnaire to document conformance or changes for the Regional ITS Architecture. Modifications will be made during the next architecture update.
Agency
Agency Contact Person
Street Address
City
State, Zip Code
Telephone
Fax
Project Information
Project Name Project Description Owning Agency Deployment Plan Project Number
MDOT or Local Agency Project Number
MDOT Job Number Control Section Estimated Cost
Conformance to Regional Architecture Region: ______________________
□ This project conforms to the existing Regional ITS Architecture. No changes are required. □ This project does not conform to the existing Regional ITS Architecture. Requested changes are noted in the
next section.
Change Information
Please indicate the type of change: □ Level 1: Basic changes that do not affect the structure of the architecture
Examples include: Changes to stakeholder or element name, element status, or data flow status □ Level 2: Structural changes that impact only one agency
Examples include: Addition of a new market package or modifications to an existing market package that affects only your agency
□ Level 3: Structural changes that have the potential to impact multiple agencies Examples include: Addition of a new market package or modifications to an existing market package that involves multiple agencies, incorporation of a new stakeholder into the architecture

Page 2 of 2
Describe requested change
What, if any, market packages are impacted by the proposed change? Note: If the proposed change involves creating or modifying a market package please attach a sketch of the new or modified market package.
Does the proposed change affect any additional stakeholders?
Has coordination occurred with any impacted stakeholders? Please describe the results.
Approval Information □ Approved by regional contact. __________________________________ _______________
Regional Contact Name Date □ Approved by ITS Program Office. __________________________________ _______________
ITS Program Office Name Date □ Forwarded to FHWA. _______________
Date Please submit change forms to: MDOT – ITS Program Office [email protected] 18101 West Nine Mile Road Southfield, MI 48075
Transit-related projects should also be sent to: MDOT – Bureau of Passenger Transportation and Federal Transit Authority (FTA)

Michigan Department of Transportation Regional ITS Architectures and Deployment Plans
Bay Region
Final Regional ITS Deployment Plan Prepared by: In association with:
January 31, 2008 012578005 Copyright © 2008 by Kimley-Horn and Associates, Inc. All rights reserved.
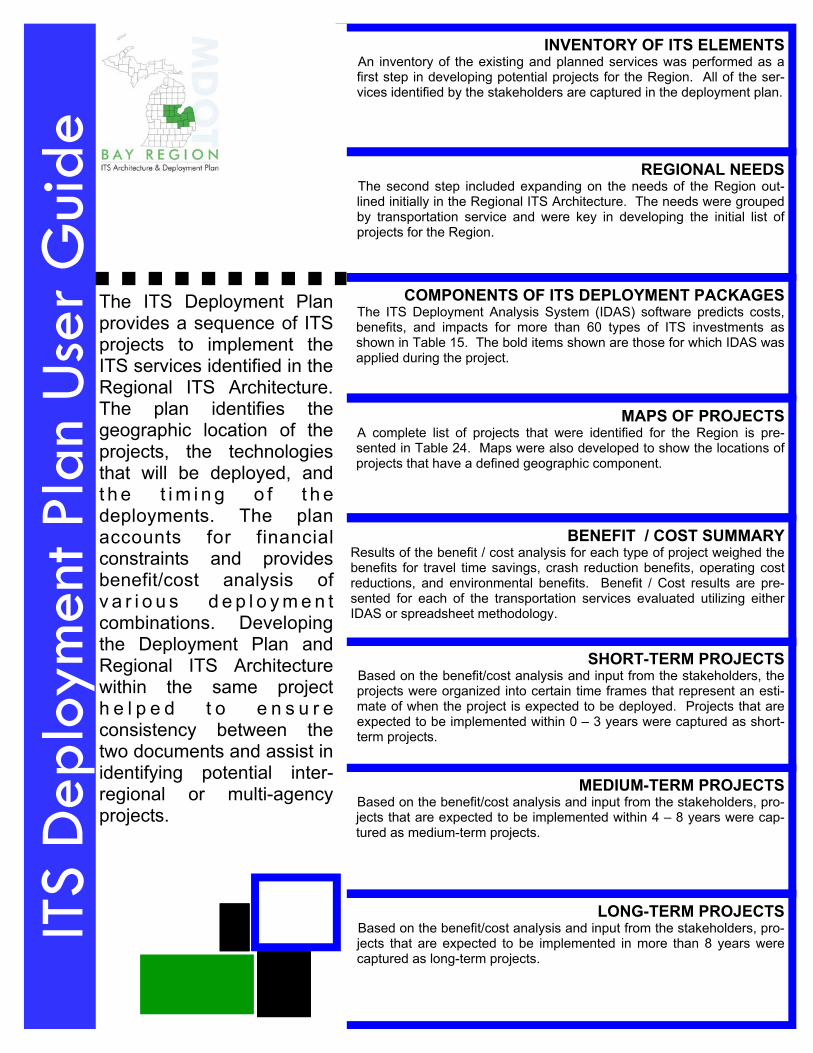
MEDIUM-TERM PROJECTS Based on the benefit/cost analysis and input from the stakeholders, pro-jects that are expected to be implemented within 4 – 8 years were cap-tured as medium-term projects.
SHORT-TERM PROJECTS Based on the benefit/cost analysis and input from the stakeholders, the projects were organized into certain time frames that represent an esti-mate of when the project is expected to be deployed. Projects that are expected to be implemented within 0 – 3 years were captured as short-term projects.
LONG-TERM PROJECTS Based on the benefit/cost analysis and input from the stakeholders, pro-jects that are expected to be implemented in more than 8 years were captured as long-term projects.
BENEFIT / COST SUMMARY Results of the benefit / cost analysis for each type of project weighed the benefits for travel time savings, crash reduction benefits, operating cost reductions, and environmental benefits. Benefit / Cost results are pre-sented for each of the transportation services evaluated utilizing either IDAS or spreadsheet methodology.
MAPS OF PROJECTS A complete list of projects that were identified for the Region is pre-sented in Table 24. Maps were also developed to show the locations of projects that have a defined geographic component.
COMPONENTS OF ITS DEPLOYMENT PACKAGES The ITS Deployment Analysis System (IDAS) software predicts costs, benefits, and impacts for more than 60 types of ITS investments as shown in Table 15. The bold items shown are those for which IDAS was applied during the project.
INVENTORY OF ITS ELEMENTS An inventory of the existing and planned services was performed as a first step in developing potential projects for the Region. All of the ser-vices identified by the stakeholders are captured in the deployment plan.
REGIONAL NEEDS The second step included expanding on the needs of the Region out-lined initially in the Regional ITS Architecture. The needs were grouped by transportation service and were key in developing the initial list of projects for the Region.
The ITS Deployment Plan provides a sequence of ITS projects to implement the ITS services identified in the Regional ITS Architecture. The plan identifies the geographic location of the projects, the technologies that will be deployed, and t h e t i m i n g o f t h e deployments. The plan accounts for financial constraints and provides benefit/cost analysis of v a r i o u s d e p l o y m e n t combinations. Developing the Deployment Plan and Regional ITS Architecture within the same project h e l p e d t o e n s u r e consistency between the two documents and assist in identifying potential inter-regional or multi-agency projects.
ITS
Dep
loym
ent P
lan
Use
r G
uide

TABLE OF CONTENTS FINAL REGIONAL ITS DEPLOYMENT PLAN – BAY REGION
1/31/2008 Bay Region i Final Regional ITS Deployment Plan
1. INTRODUCTION................................................................................................................................ 1 1.1 Project Overview........................................................................................................................ 1 1.2 Bay Region Background............................................................................................................ 2
1.2.1 Safety................................................................................................................................... 10 1.2.2 Public Transportation ......................................................................................................... 10
1.3 Report Summary...................................................................................................................... 11 2. REGIONAL ITS ARCHITECTURE DEVELOPMENT PROCESS ....................................................... 12
2.1 Overview of Study Process...................................................................................................... 12 2.2 Needs Assessment..................................................................................................................... 15
2.2.1 Inventory ............................................................................................................................. 15 2.2.2 Stakeholder Feedback ......................................................................................................... 18 2.2.3 Demand Model Projections................................................................................................. 20
2.3 Definition of Alternatives ........................................................................................................ 21 2.3.1 Alternatives Definition Overview........................................................................................ 21 2.3.2 Alternatives Technology Definition..................................................................................... 21 2.3.3 Deployment Philosophy ...................................................................................................... 22 2.3.4 Deployment Packages ......................................................................................................... 23
2.4 Evaluation of Alternatives....................................................................................................... 33 2.4.1 Evaluation Criteria ............................................................................................................. 33 2.4.2 Technical Evaluation Process............................................................................................. 35
2.4.2.1. IDAS Description ........................................................................................................ 35 2.4.2.2. IDAS Inputs and Default Values................................................................................. 39 2.4.2.3. Estimation of ITS Alternative Costs............................................................................ 43
3. DEPLOYMENT PLAN ...................................................................................................................... 49 3.1 Deployment Plan Projects ....................................................................................................... 49 3.2 Screening Process..................................................................................................................... 53 3.3 Final List of Projects for Analysis .......................................................................................... 54
4. ANALYSIS OF BAY REGION ITS ALTERNATIVES......................................................................... 56 4.1 Project Categorization............................................................................................................. 56 4.2 Results of Benefit/Cost Analysis ............................................................................................. 63
4.2.1 Freeway Management System............................................................................................. 63 4.2.2 Freeway Service Patrols ..................................................................................................... 64 4.2.3 Roadway Weather Information Systems (RWIS) ................................................................. 65 4.2.4 Advanced Public Transportation Systems........................................................................... 65 4.2.5 Smart Work Zones ............................................................................................................... 66 4.2.6 Traffic Signal Improvements ............................................................................................... 68 4.2.7 Drawbridge Management System ....................................................................................... 68
4.3 Summary of Results................................................................................................................. 71 4.4 Project Timeframes ................................................................................................................. 73

TABLE OF CONTENTS FINAL REGIONAL ITS DEPLOYMENT PLAN – BAY REGION
1/31/2008 Bay Region ii Final Regional ITS Deployment Plan
LIST OF FIGURES Figure 1 - Bay Region Study Area ............................................................................................................. 4 Figure 2 - AADT Bay Region .................................................................................................................... 6 Figure 3 - AADT Flint Region ................................................................................................................... 7 Figure 4 - AADT Saginaw Area................................................................................................................. 7 Figure 5 - AADT Bay City Area ................................................................................................................ 8 Figure 6 - AADT Midland Area................................................................................................................. 8 Figure 7 - 2015 Congested Levels.............................................................................................................. 9 Figure 8 - Deployment Study Process Chart ............................................................................................ 13 Figure 9 - Process to Develop and Evaluate ITS Alternatives ................................................................. 14 Figure 10 - IDAS Model Structure........................................................................................................... 38 Figure 11 - IDAS Representation of RWIS Deployment in the Lower Peninsula ................................... 42 Figure 12 - IDAS – ITS Deployment Equipment Details ........................................................................ 47 Figure 13 - ITS Deployment Plan Projects: Bay Region ......................................................................... 58 Figure 14 - ITS Deployment Plan Projects: Genesee County .................................................................. 59 Figure 15 - ITS Deployment Plan Projects: Bay City and Saginaw......................................................... 60 Figure 16 - ITS Deployment Plan Projects: Midland and Mt Pleasant .................................................... 61 Figure 17 - ITS Deployment Plan Projects: Standish and Lapeer............................................................ 62 Figure 18 - Scheduled Work Zones 2008 – 2011..................................................................................... 67 Figure 19 - Drawbridge Management System Physical Architecture ...................................................... 70

TABLE OF CONTENTS FINAL REGIONAL ITS DEPLOYMENT PLAN – BAY REGION
1/31/2008 Bay Region iii Final Regional ITS Deployment Plan
LIST OF TABLES Table 1 - Bay Region Study Area Demographic Data ............................................................................... 5 Table 2 - Routes with AADT Greater than 25,000 .................................................................................... 5 Table 3 - Characteristics of Bay Region Transit Authorities – 2006 ....................................................... 11 Table 4 - Freeway Management Deployment Types ............................................................................... 24 Table 5 - Arterial Management Deployment Types................................................................................. 25 Table 6 - Portable Traffic Management Deployment Types.................................................................... 26 Table 7 - ATIS Deployment Types .......................................................................................................... 27 Table 8 - Incident Management Deployment Types ................................................................................ 28 Table 9 - Advanced Warning and Safety Deployment Types .................................................................. 29 Table 10 - APTS Deployment Types ....................................................................................................... 30 Table 11 - Emergency Vehicle Deployment Types ................................................................................. 30 Table 12 - Advanced Parking Management Deployment Types.............................................................. 31 Table 13 - Roadway Weather Information Deployment Types ............................................................... 32 Table 14 - Advanced In-vehicle Deployment Types................................................................................ 33 Table 15 - ITS Components Assessed in IDAS ....................................................................................... 37 Table 16 - Comparison of Impact Values Used for IDAS Analysis ........................................................ 40 Table 17 - Monetary Values of IDAS Default Parameters....................................................................... 41 Table 18 - Summary Categories for IDAS Benefits................................................................................. 43 Table 19 - Unit Costs................................................................................................................................ 45 Table 20 - Major Components of ITS Deployment Packages.................................................................. 46 Table 21 - Initial List of Deployment Plan Projects................................................................................. 50 Table 22 - Deployment Plan Project Packets ........................................................................................... 54 Table 23 - Final List of Bay Region Deployment Plan Projects .............................................................. 55 Table 24 - Grouping of Projects for IDAS Modeling............................................................................... 57 Table 25 - Bay Region Freeway Management System Cost Savings ...................................................... 64 Table 26 - Freeway Service Patrol Cost Savings ..................................................................................... 64 Table 27 - Road Weather Information System (RWIS) Cost Savings ..................................................... 65 Table 28 - Advanced Public Transportation Systems Cost Savings ........................................................ 66 Table 29 - Smart Work Zone Cost Savings.............................................................................................. 68 Table 30 - Traffic Signal Improvement Cost Savings.............................................................................. 68 Table 31 - Drawbridge Management System Cost Savings ..................................................................... 69 Table 32 - Deployment Packages – Total Benefits .................................................................................. 71 Table 33 - Deployment Packages – Net Benefits ..................................................................................... 71 Table 34 - Annualized Cost...................................................................................................................... 71 Table 35 - Benefit/Cost Ratios ................................................................................................................. 72 Table 36 - Total Capital Costs.................................................................................................................. 72 Table 37 - Annual Operations and Maintenance Costs ............................................................................ 72 Table 38 - Bay Region Short-Term (0 – 3 Years) ITS Deployment Plan Projects .................................. 74 Table 39 - Bay Region Medium-Term (4 – 8 Years) ITS Deployment Plan Projects.............................. 75 Table 40 - Bay Region Long-Term (Over 8 Years) ITS Deployment Plan Projects................................ 76

LIST OF ACRONYMS
1/31/2008 Bay Region iv Final Regional ITS Deployment Plan
AASHTO American Association of State Highway and Transportation Officials
AHS Automated Highway System
AMBER America’s Missing: Broadcast Emergency Response
ANSI American National Standards Institute
ATMS Advanced Traffic Management System
AVL Automated Vehicle Location
AWOS Automated Weather Observing System
CCTV Closed Circuit Television
CJIC Criminal Justice Information Center
CRC County Road Commission
DCM Data Collection and Monitoring
DEM Department of Emergency Management
DMS Dynamic Message Sign
DNR Department of Natural Resources
DPW Department of Public Works
DSRC Dedicated Short Range Communication
EOC Emergency Operations Center
ESS Environmental Sensor Stations
FHWA Federal Highway Administration
FSP Freeway Service Patrol
FTA Federal Transit Administration
HAR Highway Advisory Radio
HAZMAT Hazardous Materials
HRI Highway Rail Intersection
IDAS ITS Deployment Analysis Software
IEEE Institute of Electrical and Electronics Engineers
IMMS Incident Management Message Sets
ISO International Standards Organization
ISP Information Service Provider
ITS Intelligent Transportation System

LIST OF ACRONYMS
1/31/2008 Bay Region v Final Regional ITS Deployment Plan
MAC Medium Access Control
MDT Mobile Data Terminal
MITSC Michigan Intelligent Transportation Systems Center
MOU Memorandum of Understanding
MSP Michigan State Police
NEMA National Emergency Management Association
NOAA National Oceanic and Atmospheric Administration
NTCIP National Transportation Communications for ITS Protocol
NWS National Weather Service
RWIS Roadway Weather Information System
SAE Society of Automotive Engineers
SAFETEA-LU Safe, Accountable, Flexible and Efficient Transportation Equity Act – A Legacy for Users
SDO Standards Development Organization
STMF Simple Transportation Management Framework
TCP/IP Transmission Control Protocol/Internet Protocol
TEA-21 Transportation Equity Act for the 21st Century
TIP Transportation Improvement Program
TMC Transportation Management Center
TOC Traffic Operations Center
TSC Transportation Service Centers
UDP/IP User Datagram Protocol/Internet Protocol
USDOT United States Department of Transportation
VIVDS Vehicle Imaging Video Detection Systems
XML Extensible Mark-up Language

1/31/2008 Bay Region 1 Final Regional ITS Deployment Plan
1. INTRODUCTION
1.1 Project Overview
The Michigan Department of Transportation (MDOT) Bay Region Intelligent Transportation Systems (ITS) Deployment Plan is part of an overall effort to develop a statewide ITS architecture along with a deployment plan for each of MDOT’s seven regions. To date, ITS deployments have been concentrated almost exclusively in the two largest metropolitan areas, Detroit and Grand Rapids. Both systems include a Transportation Management Center (TMC) that utilizes closed circuit television (CCTV) cameras, detection equipment and dynamic message signs (DMS) to manage traffic on regional freeways. Both systems focus on incident management activities and traveler information with the goal of improving the safety and mobility of the traveling public. The Bay Region is in the process of deploying its first major ITS Freeway Management System which will include several DMS and CCTV cameras in the Flint area.
The Flint Mass Transportation Authority (MTA) has been in the process of implementing ITS for some time, including and Automatic Vehicle Location system. The Flint Mass Transportation Authority ITS Implementation Plan (IBI Group, June 2005) presented five year implementation schedule of transit related projects that spanned a deployment period from 2005 through 2009. Since a lot of these projects are either currently in place or being implemented, they are captured as the existing inventory of the region. The “Longer-Term” projects which are not in design or funded are captured in the project list of this Deployment Plan.
While the smaller urban centers and rural areas of Michigan do not experience the levels of recurrent and non-recurrent congestion (incidents) found in the larger cities, there are unmet needs related to traveler safety and mobility that provide opportunities for the strategic application of ITS technologies and concepts. Given the large number of roadway miles in these areas and the very limited capital budget available for improvements, ITS technologies may provide cost-effective ways of meeting these needs. A number of ITS applications were being proposed in these areas to improve service to the traveling public and to improve the overall efficiency of MDOT’s system operations.
While recognizing the potential of ITS applications, MDOT also recognizes that implementing ITS technologies in an ad-hoc manner across the State would not provide the system wide integration required, nor achieve statewide performance requirements, and would not be cost-effective. Coordination of services and communication between regions on program and project investments is a critical requirement for long-term success. Operations, maintenance, and ultimately replacement costs would be increased without this integrated approach. MDOT expects to identify ITS deployment projects in each region that address two major elements:
Development of an ITS architecture in regions where none existed and the updating of the architecture in areas where it existed but was out of date. The program will establish regional architectures for the Superior, Bay, Grand, Southwest, and University Regions and update the existing architectures for the Detroit, Flint and Lansing metropolitan areas. The Federal Transportation Reauthorization bill of 1998 (TEA-21) greatly expanded the eligibility of ITS projects for Federal funding, but also included Section 940, which required that ITS projects eligible for Federal funding be compatible with the National ITS Architecture. The Federal Rule defines the national architecture as “a common framework for ITS interoperability. The National ITS Architecture comprises the logical architecture and physical architecture which satisfy a defined set of user services.” The development of a consistent architecture across the

1/31/2008 Bay Region 2 Final Regional ITS Deployment Plan
State has several benefits. In addition to making ITS type investments eligible for Federal funding, it assures a consistent approach to technology applications across the State. The process also brings a variety of stakeholders together to open a dialogue that discusses issues of common concern and finds common ground on potential strategies to fund and implement the technologies.
Development of Regional Deployment Plans where they do not currently exist. The architecture itself provides a structure that identifies packages of user services and also defines the connections between them. The Deployment Plan is needed to define the geographic location of the projects, the technologies that will be deployed, and the timing of the deployments. Projects are defined in a manner consistent with the planning, programming, design, and implementation processes of MDOT. The Deployment Plan accounts for financial constraints and provides benefit/cost analysis of various deployment combinations. Combining the architecture and Deployment Plans within the same project allows consistency between the two. Consistency in the process across regions facilitates the development of multi-regional projects where appropriate. The product of the Deployment Plan is a set of defined projects with estimated costs and benefits. These projects will then be considered for funding through MDOT’s statewide planning process in rural regions or through the MPO process in the urbanized areas. These regional deployment plans will reflect an understanding of their impact in advancing statewide policies and objectives and agreed to integrated system performance measures and, as such, will support cross regional applications investment programs.
Both of these focused efforts are impacted by a separate project, the development of statewide software specifications for Advanced Traffic Management Systems (ATMS). The software utilized in the Michigan Intelligent Transportation System Center (MITSC) in Detroit dates back to the mid-1990’s and has been in need of replacement for some time. MDOT is making temporary improvements while developing a specification for new software. The West Michigan TMC is currently operating in the Grand Region and additional future TMCs have been identified as part of the ATMS Specifications. These TMCs have been identified in the regional architectures and will also be a part of the statewide architecture and deployment plan. The ATMS project will provide a common platform for all ITS deployments across the state. This will enhance coordination between regions and enable centers to back each other up during off-hours or times of emergency. To this end, a series of stakeholder meetings were held across the state to identify user needs and obtain feedback on how the ATMS software can enhance operational and maintenance activities.
Deployment plans are based on stakeholder feedback, the recently completed MDOT state long range plan, urban area long range plans, review of data on transportation needs and the technical feasibility of various technologies. The regional architectures and the ATMS software specification help to define the development and analysis of ITS investment alternatives.
1.2 Bay Region Background
Michigan DOT’s Bay Region includes 13 counties in eastern Michigan. One out of every eight Michigan residents lives in the Bay Region, which has a population of 1.25 million. The eastern portion of the region includes area known as Michigan’s “thumb” a peninsula bordering Lake Huron and Saginaw Bay. The thumb counties are heavily reliant on agriculture and tourism for their economy. The western portion of the region is defined by the I-75 Corridor running from Oakland County in the south to Bay City in the north. This corridor is heavily urbanized and largely industrial including the urban areas of Flint, Saginaw, Bay City and Midland. The four Counties that include these cities, Genesee, Saginaw, Bay and Midland have a combined

1/31/2008 Bay Region 3 Final Regional ITS Deployment Plan
population of 840,000 or two-thirds of the region’s residents. Population growth has been minimal in the region as whole over the past six years, with a total gain 7,700 residents or about 0.6%. Job losses in the automobile industry have led to population declines in Bay and Saginaw counties, which together lost over 5,500 residents. Population gains were concentrated primarily in the southern end of the corridor in Genesee and Lapeer Counties, which between them recorded a gain of 11,700. This is mainly a result of residents moving north from Oakland County to access less expensive housing in these regions. As industrial jobs in the Flint area have continued to decline, more Genesee County residents have begun commuting to jobs in northern Oakland County. Isabella County, which contains Central Michigan University in Mt. Pleasant, was the other county in the region to record a significant population gain. Isabella County gained 2,500 residents, a 4% increase, between 2000 and 2006.
Estimated regional employment in 2006 was 428,000. Midland County is a major employment draw in the northern portion of the region with over 50,000 employees in the County and only 84,000 residents. The large chemical industry in the County draws employees from both rural areas and industrialized counties to the east. Genesee County on the other hand, has an unusually low ratio of employment to population, reflecting both the loss of auto industry jobs within the County and the increasing number of commuters traveling to Oakland County. Similar patterns are found in the growing bedroom County of Lapeer, as well as some of the “Thumb” counties, who send commuters both south and east to employment centers. Clare County, on the western side of the region is oriented toward Lansing.
I-75 serves as the “Main Street” of the Bay Region. It carries heavy volumes of commuter traffic and commercial traffic between cities in the region as well south into the Detroit metropolitan area. I-75 also serves heavy volumes of traffic between the Detroit area and the resort regions in Northern Michigan. Severe congestion can occur on I-75 on peak summer weekends, causing inconvenience to local residents as well as vacationers. Both Flint and Saginaw are served by Interstate loops off I-75, I-475 in Flint and I-675 in Saginaw. These loop roads provide an excellent opportunity to use ITS technology to “manage” traffic during incidents or times of heavy congestion. Project stakeholders noted often during times of peak congestion on I-75, I-475 and I-675 may be free-flowing. There is currently limited ability, however, to provide information to motorists on the status of alternate routes.
I-69 is the major east-west highway in the southern portion of the region, connecting the Blue Water Bridge at Port Huron with Lansing and eventually I-94. This corridor carries heavy volumes of commercial traffic and along with I-75 is designated a corridor of highest significance. US-23 is a major freeway that connects Flint with rapidly growing areas to the south including Livingston County and the Ann Arbor area. US-10 is a major freeway in the northern portion of the region that connects I-75 with Midland and US-127 to the West. US-127 is a major north-south trunkline in the western portion of the region connecting Lansing to northern Michigan. Two significant arterial trunklines in the southern portion of the region, M-54 and M-24 are experiencing increasing traffic from commuters bound for Oakland County. M-13 is a significant arterial trunkline that provides a parallel route to I-75 in the Flint, Saginaw and Bay City regions. The thumb region does not have limited access highways and is served by a series of two-lane trunkline roads.

1/31/2008 Bay Region 4 Final Regional ITS Deployment Plan
Figure 1 - Bay Region Study Area
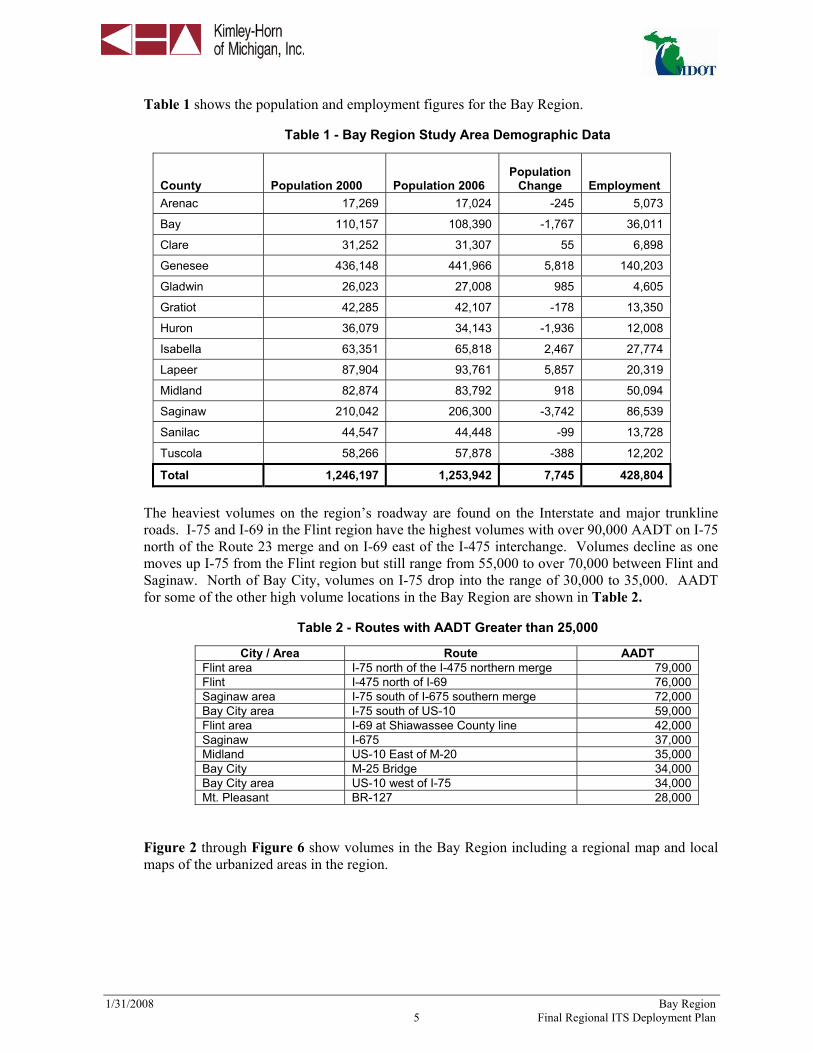
1/31/2008 Bay Region 5 Final Regional ITS Deployment Plan
Table 1 shows the population and employment figures for the Bay Region.
Table 1 - Bay Region Study Area Demographic Data
County Population 2000 Population 2006 Population
Change Employment Arenac 17,269 17,024 -245 5,073
Bay 110,157 108,390 -1,767 36,011
Clare 31,252 31,307 55 6,898
Genesee 436,148 441,966 5,818 140,203
Gladwin 26,023 27,008 985 4,605
Gratiot 42,285 42,107 -178 13,350
Huron 36,079 34,143 -1,936 12,008
Isabella 63,351 65,818 2,467 27,774
Lapeer 87,904 93,761 5,857 20,319
Midland 82,874 83,792 918 50,094
Saginaw 210,042 206,300 -3,742 86,539
Sanilac 44,547 44,448 -99 13,728
Tuscola 58,266 57,878 -388 12,202
Total 1,246,197 1,253,942 7,745 428,804
The heaviest volumes on the region’s roadway are found on the Interstate and major trunkline roads. I-75 and I-69 in the Flint region have the highest volumes with over 90,000 AADT on I-75 north of the Route 23 merge and on I-69 east of the I-475 interchange. Volumes decline as one moves up I-75 from the Flint region but still range from 55,000 to over 70,000 between Flint and Saginaw. North of Bay City, volumes on I-75 drop into the range of 30,000 to 35,000. AADT for some of the other high volume locations in the Bay Region are shown in Table 2.
Table 2 - Routes with AADT Greater than 25,000
City / Area Route AADT Flint area I-75 north of the I-475 northern merge 79,000 Flint I-475 north of I-69 76,000 Saginaw area I-75 south of I-675 southern merge 72,000 Bay City area I-75 south of US-10 59,000 Flint area I-69 at Shiawassee County line 42,000 Saginaw I-675 37,000 Midland US-10 East of M-20 35,000 Bay City M-25 Bridge 34,000 Bay City area US-10 west of I-75 34,000 Mt. Pleasant BR-127 28,000
Figure 2 through Figure 6 show volumes in the Bay Region including a regional map and local maps of the urbanized areas in the region.

1/31/2008 Bay Region 6 Final Regional ITS Deployment Plan
Figure 2 - AADT Bay Region
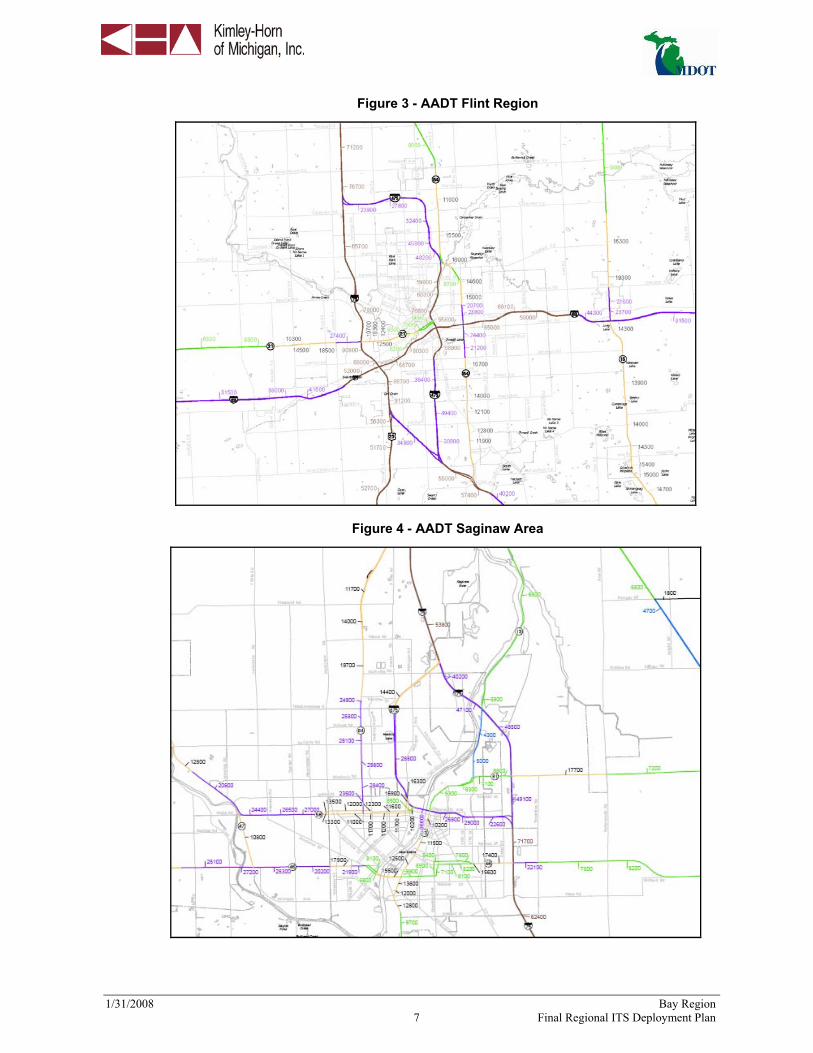
1/31/2008 Bay Region 7 Final Regional ITS Deployment Plan
Figure 3 - AADT Flint Region
Figure 4 - AADT Saginaw Area

1/31/2008 Bay Region 8 Final Regional ITS Deployment Plan
Figure 5 - AADT Bay City Area
Figure 6 - AADT Midland Area
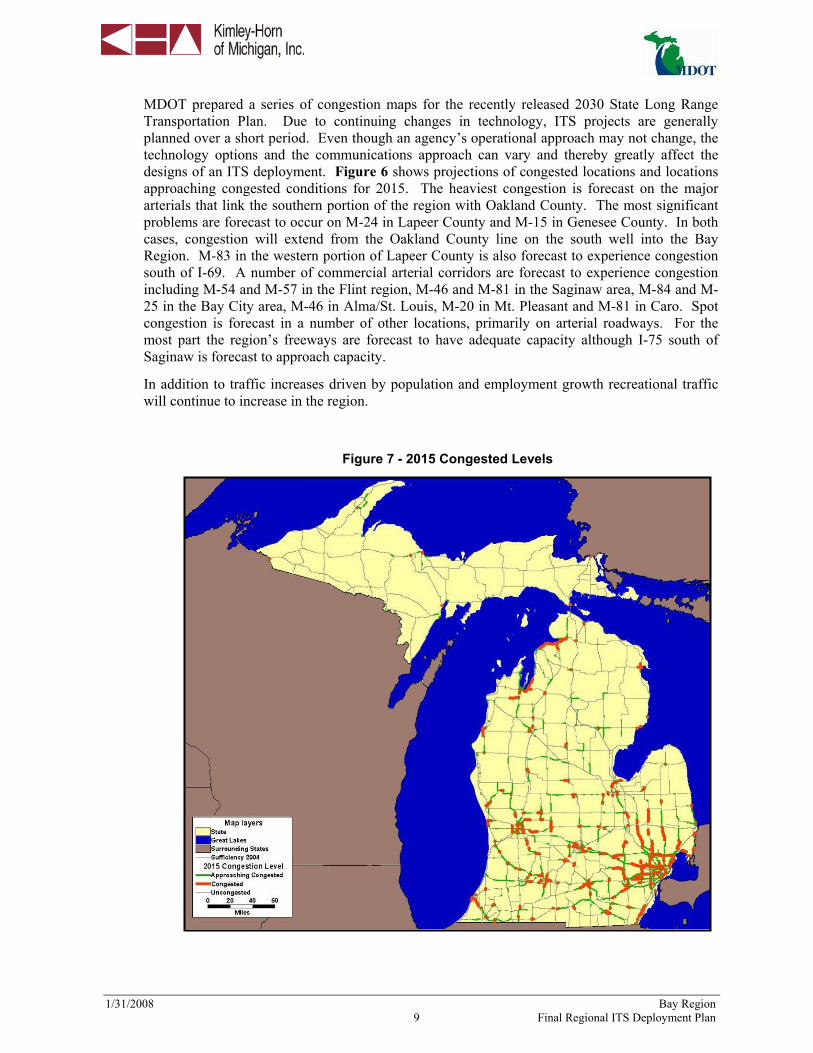
1/31/2008 Bay Region 9 Final Regional ITS Deployment Plan
MDOT prepared a series of congestion maps for the recently released 2030 State Long Range Transportation Plan. Due to continuing changes in technology, ITS projects are generally planned over a short period. Even though an agency’s operational approach may not change, the technology options and the communications approach can vary and thereby greatly affect the designs of an ITS deployment. Figure 6 shows projections of congested locations and locations approaching congested conditions for 2015. The heaviest congestion is forecast on the major arterials that link the southern portion of the region with Oakland County. The most significant problems are forecast to occur on M-24 in Lapeer County and M-15 in Genesee County. In both cases, congestion will extend from the Oakland County line on the south well into the Bay Region. M-83 in the western portion of Lapeer County is also forecast to experience congestion south of I-69. A number of commercial arterial corridors are forecast to experience congestion including M-54 and M-57 in the Flint region, M-46 and M-81 in the Saginaw area, M-84 and M-25 in the Bay City area, M-46 in Alma/St. Louis, M-20 in Mt. Pleasant and M-81 in Caro. Spot congestion is forecast in a number of other locations, primarily on arterial roadways. For the most part the region’s freeways are forecast to have adequate capacity although I-75 south of Saginaw is forecast to approach capacity.
In addition to traffic increases driven by population and employment growth recreational traffic will continue to increase in the region.
Figure 7 - 2015 Congested Levels

1/31/2008 Bay Region 10 Final Regional ITS Deployment Plan
1.2.1 Safety
Safety is another key issue in the region. While lake effect snows are less frequent than in the western and northern portions of the State, heavy snowfall does occur in the region with occasional white out conditions. Pockets of fog in many portions of the region can also create dangerous conditions. Like other areas where suburban growth is spreading into rural areas, lack of roadway lighting, animal hits and higher volumes at rural and suburban at-grade intersections are major safety problems. Heavy peak weekend volumes on I-75, particularly during the winter ski season, can result in major safety problems and related delays when adverse weather occurs. Heavy commercial vehicle volumes in the region on I-75 and I-69 have an impact as well. When commercial vehicle crashes do occur, they frequently result in lane or roadway closures, which in turn results in increased secondary crashes on both freeways and alternate routes.
According to Michigan’s most recent Highway Safety Report, produced by the Governor’s Highway Safety Office, fatalities in the Bay Region increased from 174 in 2004 to 188 in 2005 and then dropped back to 169 in 2006. The drop in 2006 occurred in spite of an increase of 16 fatalities in the two largest Counties of Genesee and Saginaw. This was more than offset by large declines in Bay, Midland and Lapeer Counties, as well as in some of the smaller rural counties. As a result the share of regional fatalities attributable to Genesee and Saginaw Counties increased from 41% in 2005 to 55% in 2006. Alcohol-related crashes are also a concern for the region. The State Highway Plan showed that in 2005 only five counties had HBD (Had Been Drinking) rates for fatal crashes that were higher than the statewide average but four of these were among the larger urban counties; Genesee, Lapeer, Saginaw and Midland.
1.2.2 Public Transportation
Public transportation is an important component of providing transportation service options in the Bay Region. As shown in Table 3, there are 12 transit agencies in the Bay Region, including both regional and County-based systems. Together these systems own just over 600 vehicles and carry 7.8 million passengers per year. The total budget for the 12 agencies was $42 million in 2006. The Flint Mass Transportation Authority system is clearly dominant in the region, carrying 65%, or 5.1 million of the 7.8 million annual transit riders in the region. Due to its high level of ridership, the MTA has a low cost of per passenger of $3.18. As a result its budget at $16 million is only 38% of the regional budget. The MTA has expanded its service in recent years and in addition to local service now carries commuters from the Flint region to employment centers in northern Oakland County. Cost per passenger for the systems outside Flint ranges from $7.33 per passenger to over $19. After Flint, the largest systems are located in the urbanized areas of Bay City and Saginaw. Saginaw carries just over 700,000 passengers per year and Bay City carries just over 600,000. Isabella County Transit, which serves the University town of Mt. Pleasant, is the fourth largest authority with over 350,000 passengers per year.

1/31/2008 Bay Region 11 Final Regional ITS Deployment Plan
Table 3 - Characteristics of Bay Region Transit Authorities – 2006
Agencies Vehicles Population Employees Veh Miles Veh
Hours Passengers Budget Cost/Pass Alma 10 135,000 9 84,665 6,405 51,378 $583,742 $11.36 Bay Metro 62 111,000 91 1,509,326 90,950 616,211 $6,801,498 $11.04 Caro 12 13,381 13 545,167 31,901 159,364 $1,168,388 $7.33 Flint MTA 287 436,141 450 7,366,596 426,053 5,117,379 $16,292,626 $3.18 Gladwin 19 26,389 42 402,293 25,049 95,938 $1,148,864 $11.98 Lapeer 22 25,341 26 523,007 31,167 189,277 $1,485,810 $7.85 Huron 30 34,951 22 712,908 34,100 182,478 $1,356,494 $7.43 Isabella 35 54,624 62 806,716 63,581 351,243 $3,149,100 $8.97 Midland Co 19 37,598 30 852,587 41,506 81,178 $1,553,753 $19.14 Midland City 14 38,053 30 491,428 37,636 160,957 $1,617,945 $10.05 Saginaw 85 140,079 80 919,638 73,784 713,638 $6,002,528 $8.41 Sanilac 13 39,928 15 432,852 18,656 87,663 $975,697 $11.13 Total 608 1,092,485 870 14,647,183 880,788 7,806,704 $42,136,445 $5.40
Source: MDOT Transit Management System, 2007
1.3 Report Summary
MDOT, like many other transportation agencies, is looking for ways to gain greater capacity from existing facilities and to better “manage and operate” the system. As more ITS systems are deployed, more information becomes available about the costs, benefits, and performance characteristics of these systems. This document focuses on the benefits and costs of various ITS deployments as they relate to overall system performance. This enables MDOT to make the most cost-effective use of limited available funds, coordinate ITS investment with normal road and bridge project decisions, and to evaluate ITS on the same footing as other transportation improvements. The tools being applied to this study will permit ITS to be “mainstreamed” into the day-to-day business of MDOT and other transportation agencies. This report presents the general process designed by the MDOT and the Study Team to develop an ITS Deployment Plan for the Bay Region.
The remainder of the report includes the following information:
A description of the study process including: o Overview of Study Process o Needs assessment methodology o Inventory o Stakeholder feedback o Definition of alternatives o Evaluation of alternatives– criteria and process o Bay Region projects for analysis
Findings o Benefit/cost analysis methodology o IDAS model documentation o IDAS results o Description of benefit/cost analysis

1/31/2008 Bay Region 12 Final Regional ITS Deployment Plan
2. REGIONAL ITS ARCHITECTURE DEVELOPMENT PROCESS
2.1 Overview of Study Process
The purpose of the Bay Region ITS Deployment Plan is to identify feasible ITS projects that can meet the needs of the region’s stakeholders and develop a realistic plan to implement them. A key outcome of this process will allow the “mainstreaming” of ITS technologies, concepts and projects into the planning process and the project development process of MDOT and other key planning and transportation agencies in the region. In order to accomplish this objective, the process used to evaluate ITS projects must be compatible with that used to evaluate more traditional transportation projects. For example, ITS projects have been considered as alternatives to major roadway capital investment, or at least as a way to provide temporary relief until major capital investments can go through what is often a lengthy funding and approval process. In order to help make investment decisions, planners and engineers must have the tools and procedures to compare the benefits and costs of ITS investments and their impact on meeting agreed-to system performance goals with those of other projects. This process facilitates activities that will allow MDOT to better manage and indeed operate its transportation system assets and get the most from its transportation investment decisions. The process developed for this project was designed to address this objective. Figure 8 provides a high-level overview of the process used to accomplish the study objectives. The primary feature of this approach is that it follows the process used to plan other types of transportation improvements. Steps included:
Review previous studies and documents including documentation of any existing ITS system and corridor studies which address ITS as a potential solution to transportation problems.
Define the transportation facilities and services to be included in the study. Collect and review planning level data to identify specific system problems. Sources
primarily included statewide and urban area transportation plans, traffic volumes, accident data and travel demand forecasts.
Develop and implement a stakeholder process to help identify transportation system needs and problems, and potential ITS solutions. Extensive meetings were held with a wide range of regional stakeholders.
Define and document transportation system problems and needs based on the information obtained from the above sources.
Develop a process for defining ITS alternatives and a set of alternatives. Conduct a benefit/cost analysis of the proposed alternatives, using the statewide travel
demand model as a basis. The ITS Deployment Analysis System (IDAS), a sketch-planning tool used to estimate the impact of ITS deployments, was used for this purpose.
Develop an implementation plan with funding options as a guide to help decision-makers prioritize ITS deployments.

1/31/2008 Bay Region 13 Final Regional ITS Deployment Plan
Figure 8 - Deployment Study Process Chart
Figure 9 provides a more detailed view of the process used to develop and evaluate ITS alternatives. Inputs used to develop the alternatives are shown in more detail and include:
Output of the regional ITS architecture process; Stakeholder input; and Review of transportation plans and studies for the study area.
Regional needs were identified using these inputs. Subsequently, the needs served as the base for the development of alternatives.

1/31/2008 Bay Region 14 Final Regional ITS Deployment Plan
Figure 9 - Process to Develop and Evaluate ITS Alternatives
Evaluation
ProcessInputs Outputs
Regional ITS Architecture
Regional ITS Architecture
Stakeholder Inputs
Stakeholder Inputs
Transportation Plans and StudiesTransportation
Plans and Studies
Categorize by Stakeholder and Market Package
Categorize by Stakeholder and Market Package
Categorize and Prioritize Stakeholder
Needs
Categorize and Prioritize Stakeholder
Needs
Quantify System Deficiencies
Quantify System Deficiencies
Perceived Deficiencies and Needs
Perceived Deficiencies and Needs
Market PackagesMarket Packages
ITS AlternativesITS Alternatives
Identify Desired ITS Services
Identify Desired ITS Services
Evaluation Criteria
Evaluation Criteria
IDAS Model Runs
IDAS Model Runs
The process shown graphically in the middle box includes four steps.
1. Categorize the output of the Bay Region’s architecture projects by stakeholder and market package. This information is used to help identify ITS-related projects of interest to various stakeholders, and to assure that the ITS plan is compatible with the regional architecture.
2. Categorize and prioritize needs that were identified by stakeholders through meetings, reports and interviews. This information is used to help identify system problems and deficiencies, attitudes toward existing ITS services, and potential applications of ITS.
3. Identify perceived needs and deficiencies in terms of congestion, safety and other criteria.
4. Quantify system deficiencies and problems to the extent possible using the data described above and other data such as traffic volumes, existing and projected volume/capacity ratios and accident data.
The output of this process is used to identify ITS alternatives that address the needs identified. The process of defining and developing ITS alternatives is described in Sections 2.2 and 2.3. The ITS alternatives are then evaluated using the IDAS model. The model provides cost estimates in addition to benefit calculations related to travel time/mobility; accident reduction; fuel and operating cost savings; and air quality.

1/31/2008 Bay Region 15 Final Regional ITS Deployment Plan
2.2 Needs Assessment
This section includes a summary of the needs assessment conducted for the Bay Region Deployment Plan. While the data presented in Section 1 provided a good foundation for analysis, the discussions at the stakeholder meetings provided the critical information focus required to develop alternatives for analysis. The Study Team worked with MDOT to identify a list of key stakeholders, who would provide input to both the architecture and the deployment plan. During the meetings stakeholders were asked to focus on:
Identification and assessment of existing ITS systems;
Perceptions of current transportation system, including system performance and effectiveness;
Existing transportation needs that could be addressed by ITS;
Future needs that could be addressed by ITS;
Problems and opportunities in ITS deployments;
Impact of technology on future ITS deployments; and
Priorities for future ITS deployments.
2.2.1 Inventory
The first step in the needs assessment process was to develop an inventory of existing ITS and ITS-related services in the Bay Region. The needs assessment process was also used to identify agencies that may benefit from ITS solutions. Freeway management deployments in the Bay Region are currently underway including construction of DMS and CCTV cameras in the Flint area. In addition, the Flint MTA has been deploying ITS technology in its system for several years. This section lists existing systems in the Bay Region and their intended purpose. The inventory created from the needs assessment will aid the stakeholders in learning about the operations and available information that is currently used throughout the Bay Region.
Advanced Traffic Management Systems (ATMS) in the Bay Region include:
Several major Freeway Management Systems projects in the region were initiated during the period of this project in 2007. Funding has been committed to complete design and deploy these projects over the next three years:
There is a project underway to place three DMS in the Flint area. One will be located on I-75 NB south of the I-475 interchange; one on I-75 SB north of I-475; and one on I-69 EB west of the I-75/US 23 interchange. The preliminary design for this project is scheduled for completion in the fall of 2007, and the signs are scheduled for construction in 2008. The DMS are intended to facilitate the diversion of north-south traffic between I-75 and I-475. Traffic traveling on I-69 can obtain information on whether I-75 or US 23 is the better route to the south. Tourist traffic is a major market for this information, but it also will be useful to commercial traffic, during incidents, and inclement weather.
A similar system is being designed for the Saginaw region, with two signs located on I-75; one southbound just north of the I-675 junction and one northbound north of M-46. In addition two signs will be placed on the I-675
1/31/2008 Bay Region 16 Final Regional ITS Deployment Plan
Loop, one northbound and one southbound. These signs will help MDOT to address congestion and improve incident response by effectively using the capacity of both I-75 and I-675. The project is scheduled to be bid in September, 2008.
Three DMS are being designed for the Bay City area. One will be located on I-75 northbound south of US-10, one on I-75 southbound north of US-10 and on eastbound US-10, west of Mackinaw Road. These signs can be used to help manage traffic during the many special events that take place in the Bay City area. They can also be used to route northbound recreational traffic to US-10 and US-127 when I-75 experiences an incident or is severely congested. This project is also scheduled to be bid in September 2008.
Four DMS are planned for deployment in the area of the I-75 Connector to US-23 north of Bay City near Standish. Two signs will be located on I-75, one northbound south of the US-23 Connector and one southbound north of M-61. One sign will be located on US-23 north of the Connector and the other on M-13 south of the Connector. These signs will help MDOT manage traffic traveling to or from northern Michigan via I-75 and US-23. This project is scheduled to be bid in September 2009.
Genesee County has a number of agencies implementing coordinated signal systems. Two projects are now underway and two are planned on other congested corridors. Grand Blanc recently finished a project that includes CCTV cameras, detection, and the integration of approximately 12 traffic signals on a corridor that serves approximately 36,000 ADT. Both loop and video detectors are included in the Grand Blanc project. Flint is improving one corridor in 2007 and is planning for the upgrade of 38 traffic signals in the downtown area during the next 2 or 3 years. These corridor improvements are being funded primarily through CMAQ funds, but certain projects are being funded through a mixture of other funds. Two other interconnect signal projects are in Mt. Pleasant on M20 and in Saginaw on M46. Both of these jurisdictions currently have systems with interconnect. There are no signal pre-emption locations currently deployed in the Bay Region and there was very little interest or support for any pre-emption projects during the architecture process.
MDOT has a lane closure report that documents road closures and maintenance activity, but there are no media outlets that assist with disseminating consistent information. Local agencies can request for the MDOT public information officer to attend meetings or provide input. MDOT is talking to possible 511 providers and looking for statewide input on a future system. There will be a request for information (RFI) released shortly looking for response from private companies.
There is an air quality monitoring station on the Zilwaukee Bridge.
There are spot safety problems, usually geometric in nature, on specific ramps. Most of the problems are being addressed with physical improvements to the ramps. The I-69/I-75 interchange has had truck rollovers on some of the tight ramps. MDOT has looked at rollover warning signs on the ramp approaches.
There are several ATR locations in the region. There is no real time reporting from these stations, but data are downloaded after manipulation by the planning group.
1/31/2008 Bay Region 17 Final Regional ITS Deployment Plan
MDOT utilized an intelligent work zones during I-75 construction. Portable DMS were placed north and south of the I-75/I-475 interchange. Devices were used to monitor traffic and to divert traffic during busy periods. In addition to the DMS that are being deployed in this region, MDOT is looking at surveillance through detection and CCTV cameras. This is a relatively new effort and no final decisions have been made regarding further use.
Improving the efficiency and safety of snowplowing and other maintenance activities is a major concern to stakeholders in the Bay Region. The activities underway in this area include:
Genesee County has GPS units operating on some snowplows and maintenance vehicles. MDOT used technology on snowplows that included both AVL and chemical control in the Mt. Pleasant Garage as part of a demonstration project. The project did not provide adequate benefits to the stakeholders.
There is a weigh-in-motion (WIM) station in southern Saginaw County on I-75 where overweight vehicles are a major problem. MDOT has the country’s highest weight limits, but it is hard to say whether the impact is greater on the Interstate system or on local roads. There is discussion with MSP about setting up more mobile WIM stations. These are usually set up in rest areas and are more effective for enforcement purposes.
Incident Management initiatives in the Bay Region include:
Incident management procedures vary depending on the severity and duration of the incident. The current procedure is that MSP will direct traffic during short closures. If the closure is long enough, MDOT will implement a more permanent detour. There is no formal protocol for incident management in the region, but there are emergency management plans between the Genesee County Road Commission, MDOT, and MSP. During a recent incident, I-69 was closed due to a truck explosion and a subsequent bridge closure, which resulted in the implementation of a detour plan.
Advanced Public Transportation System (APTS) initiatives in the Bay Region include:
The Flint MTA is implementing AVL technology on their paratransit vehicles and plans to expand the system to their entire fleet. Additional funds beyond the current earmark will be required for the planned expansion. The TMC is already in place and MTA will be partnering with the Genesee County Road Commission and the City of Flint for information exchange. Other local agencies have signed on with this initiative as well. The information may be useful to a wider audience since buses travel outside of Genesee County, primarily to Oakland County. The AVL system could help to provide traveler information on I-75 beyond the limits of the area currently served by the MITS Center. Both Caro and Saginaw Transit have AVL on their vehicles and Caro has cameras on their vehicles.
The Bay Region has a number of ITS elements and planned system improvements that will provide the basis for a more coordinated system on a regional and statewide level. These are concentrated primarily in the Flint area and there is a high demand for service on both the I-75 corridor north of Flint and the I-69 corridor east of Flint. In addition, the increasing traffic between southern Genesee County and north Oakland County is having a major impact on north-south arterial roadways in the region. The region is still considering its Concept of Operations, and in particular the question of how the growing ITS system will be operated and maintained. ITS technologies have the potential to improve these operations, but should build upon the existing systems and the well supported partnerships between

1/31/2008 Bay Region 18 Final Regional ITS Deployment Plan
MDOT, the public safety agencies, and the local transportation authorities. These partnerships will aid the region to effectively implement programs and technologies that can manage incidents; coordinate incident-related traffic; and improve the coordination of winter maintenance activities.
2.2.2 Stakeholder Feedback
Stakeholder feedback was the major input in identifying transportation needs of the Bay Region. Three different workshops provided contributions to this process. While the first two were specifically geared toward architecture development, they provided an opportunity for stakeholders to identify specific ideas and projects. Stakeholders were asked to identify other interested parties and to respond to ideas developed by the consultant team. The three meetings included:
December 7, 2006 – Architecture Kick-Off Meeting – Saginaw, Michigan
January 18, 2007 – Architecture Development Workshop – Saginaw, Michigan
August 3, 2007 – Deployment Plan Workshop – Saginaw, Michigan
December 5, 2007 – Comment Resolution Workshop – Saginaw, Michigan

1/31/2008 Bay Region 19 Final Regional ITS Deployment Plan
Needs identified in the workshops are summarized below:
Traffic/Incident Management
Saginaw is similar to Flint in that it has I-675 available as an alternate route for I-75. As described above four DMS are deployed in the Saginaw region to support traffic management. This system will be similar to the one being deployed in the Flint region. Control of the DMS is an unresolved issue, as is the best approach for recommending alternate routes and confirming that the information is accurate. In addition to DMS, a need for CCTV in the I-75 corridor has been identified.
MDOT does not usually get information from MSP about incidents and often may not find out when highways are closed. Improved communication with the MSP and local enforcement agencies is a high priority.
There is some discussion and interest for a possible TMC associated with the downtown Flint project. This decision requires further discussion between MDOT and the Genesee County Road Commission.
The I-69/I-75 interchange is major chokepoint. US 24 south of I-69 is a major route that has been expanded and continues to see growing commuter traffic between Southern Genesee and Lapeer with the greater Detroit region. There are signal timing projects being developed on several corridors.
The following locations and corridors were identified as candidates for ITS deployments and/or signal coordination:
There are major tourist season backups at the I-75/US 10 interchange. An upcoming project will extend the merge area, and there are three DMS signs programmed for the area. There also may be a need for monitoring and improved information services.
The corridor consisting of 84/13/25/Wilder in Bay City serves as an alternate to I-75 and experiences congestion.
There are four drawbridges in Bay City that impact traffic and could benefit from improved coordination and traffic management.
M 25 and Trumbull in Bay City experience back-ups from tourist traffic traveling from the Thumb area.
M 46 in Saginaw is a candidate for improved signal coordination.
M 13/US 23 is a parallel route to I-75 and tends to funnel traffic through the Bay City area.
In the Flint area, Miller Road and Linden Road are major commercial corridors with a need for traffic management and incident management. Lennon Road is an alternate to Miller Road, which parallels I-69.
M-54 in the Flint region serves as a natural relief route to I-75.
Incident management coordination is a need in the region. MSP districts do not align with the MDOT districts and this can make it difficult to achieve interagency coordination. Generally, there is a good dialogue, but communication is difficult due to the need to coordinate with multiple districts. There are Safety committee meetings that include the AAA, MSP, County Sheriffs, and others. Some ITS issues could be coordinated through the safety forum.
1/31/2008 Bay Region 20 Final Regional ITS Deployment Plan
Deer hits are big issue on all roads including both expressways and local roads.
Weather is a major issue as there are a number of areas that experience fog, high winds and drifting snow. ITS systems could enable traffic patterns to be modified with advance notice of inclement weather.
Safety is a major issue at rural intersections. There are efforts underway to analyze intersection controls on high-speed rural roads.
The Blue Water Bridge TMC is looking at the expansion of its surveillance cameras.
Maintenance Activities
MDOT does not operate any RWIS in the region for roadway management and maintenance. RWIS is an important need for both winter maintenance and traffic management.
Snowplows on I-75 in Arenac, Bay, and Saginaw Counties currently communicate through voice to make sure plowing activities are coordinated. MDOT put together a winter maintenance workshop to look at maintenance coordination across regions. AVL may provide opportunities to enhance plowing coordination between Counties.
The Midland-Bay City-Saginaw Airport is located in a rural area between the tri-cities, requiring coordination between counties on Airport access snow removal.
Traveler Information
Information directed toward tourist traffic and incident management is a major need on the region’s freeways. There is a need to communicate with motorists on I-75, US 10 (summer), I-69 and US 127. Freight movement is a major concern on I-69.
Construction monitoring and management activities including work zone information are of importance in the region. Maintenance activities at times may close shoulders or lanes and needs to be communicated to the public.
Public Transportation
The three urban transit systems in the Tri-cities area have been connected in terms of routes and transfers. There is a need to look at technology as a way to enhance coordination. The three transit authorities have informal gatherings to discuss issues and can also use the MPO meetings as a forum.
2.2.3 Demand Model Projections
MDOT’s statewide travel demand model was used as the basis for the analysis of benefits and costs for the different ITS alternatives. The model uses average annual daily traffic (AADT). A short time frame, 2010, was selected for the analysis. The model was also used, along with data from the Statewide Long Range Transportation Plan, to identify congested areas.

1/31/2008 Bay Region 21 Final Regional ITS Deployment Plan
2.3 Definition of Alternatives
2.3.1 Alternatives Definition Overview
One of the major challenges in the evaluation of ITS alternatives is the definition of those alternatives. Unlike roadway and public transportation improvements, ITS can include a wide range of technologies, packaged and implemented in different ways. One of the early efforts in this study was the development of a framework for evaluation of ITS alternatives. Several characteristics of ITS alternatives were established early in the process, including:
Timing/Phasing – Like other transportation improvements, ITS options need to be evaluated for a specific point in time, but the deployment can be phased in over a period of years with the most appropriate portion of the recommended solutions implemented to address the most pressing problems, and at the same time setting the technology framework for longer term investments. With limited funding available, projects need to be prioritized for implementation. While 2010 is used for the analysis, the presentation of specific alternatives in this report does not tie them to a specific year. This approach provides flexibility to implement portions of these plans and assess their effectiveness.
Geographic Coverage – Depending on the technology used, ITS alternatives can cover a specific facility, a corridor, or a region. Surveillance and management elements are tied to a specific corridor, while traveler information may be provided over a wide area. It is important that the geographic component of the ITS alternative be clearly defined. Some of the larger projects may be broken into segments and implemented in phases. Clear geographic limits also provide the opportunity to incorporate ITS projects into larger bridge or roadway reconstruction projects. It is also critical that statewide or inter-regional impacts or alternative deployments be considered.
Technology Component – ITS consists of a series of technology deployments that work together to meet safety and congestion-related objectives. It is this component that makes ITS more complex and therefore more difficult to define than physical improvements or additions to roadways or public transportation systems. Also, the level of ITS deployment can vary in intensity. On heavily congested urban freeways, for example, full coverage with cameras and detectors may be desirable. In less congested areas, coverage may be needed only at major interchanges and/or high accident locations. The following section addresses the methodology used to develop conceptual alternatives, and specifically appropriate levels of deployment. This serves not only as documentation for the study, but also as a template for future use by MDOT.
2.3.2 Alternatives Technology Definition
Some of the key concepts in defining ITS alternatives are:
Coverage of ITS Deployment is a collective term that represents the extent of ITS deployment in a region. It accounts for:
Number and length of routes covered;
Number of infrastructure facilities covered (for example, number of traffic signals in an arterial traffic management system);

1/31/2008 Bay Region 22 Final Regional ITS Deployment Plan
The area covered, in the case of systems that have a network-wide impact (i.e. transit CAD and AVL);
Equipment; and
Overall geographical expanse of the ITS deployment including availability of traffic information.
ITS Deployment Intensity indicates the intensity of ITS deployment within the area of coverage which is a function of the quantity and quality of the ITS user services provided. There is no all-inclusive list of parameters that influence the deployment intensity, but typical examples of parameters that represent deployment intensity are:
Spacing of ITS equipment such as CCTV cameras, detectors, DMS;
Number of buses in an APTS that are equipped with CAD/AVL;
The hours of operation of a TMC or ATMS center; and
The hours of operation of an FSP.
Deployment intensity is different from coverage of deployment as it represents the degree of the ITS functionality of a deployment within the coverage area. Therefore, two similar ITS deployments can have the same coverage but differ in their deployment intensities. A typical example would be the case where there are two FSPs that cover the same roadway mileage, but one of them operates only during the peak hours and the other operates from sunrise to sunset. In this case, the deployment intensity of the latter FSP is higher, thereby resulting in a higher functionality than the other FSP.
Conventional ITS Applications collectively include ITS applications and services that have been deployed extensively in different metropolitan and rural areas in the United States, and have been in operation for a significant period of time. ITS applications, technologies and services that are still under development or testing, or those that are yet to achieve widespread market penetration, do not fall under this category. A majority of conventional ITS applications and services are public infrastructure oriented rather than private infrastructure or vehicle oriented. Examples include electronic DMS and surveillance cameras. The capital, deployment, and operating costs of conventional ITS applications and services have mostly been paid for by public agencies, although there are exceptions.
Emerging ITS Applications collectively include ITS applications, technologies, and services that are either in the process of development or testing, and have not achieved significant market penetration or have not been widely deployed in the United States as of date. A majority of emerging ITS applications and services are private infrastructure and vehicle oriented rather than public infrastructure oriented, with the Vehicle Infrastructure Integration (VII) project as a primary example. Private companies are paying many of the capital, deployment and operating costs of emerging ITS applications and services. These technologies will not only result in a shift of some services to the private sector, but will change the way that the transportation and public safety agencies in the public sector do their work. Once an ITS application achieves widespread usage and market penetration, it may be considered as conventional at that point in time.
2.3.3 Deployment Philosophy
One of the major objectives of the project is identifying the optimal level of investment in ITS. The results of the needs analysis indicated that the level and nature of ITS investment

1/31/2008 Bay Region 23 Final Regional ITS Deployment Plan
in the study area should be varied based on several variables. These included traffic volumes, projected congestion, safety and proximity to the existing ITS system.
The concept of deployment intensity is the method used to address these needs. Low-intensity deployments can be viewed as both a way to provide ITS coverage in areas of lesser need where only limited investment is justified, and as a first step toward higher intensity deployment. In this section, major ITS deployments are defined in terms of high and low density. These are flexible definitions and deployments are tailored to the specific system performance expectations of the region. For purposes of display, individual technologies are sorted into several categories. In the architecture section of the report, these broad categories are tied to specific architecture packages.
Freeway Traffic Management;
Arterial Traffic Management;
Portable Traffic Management;
Advanced Traveler Information Systems;
Incident Management Systems;
Advanced Infrastructure Based Warning Systems;
Advanced Public Transportation Systems;
Emergency Vehicle Dynamic Routing Systems;
Parking Management Systems;
Road Weather Information Systems; and
Advanced Vehicle Technology.
2.3.4 Deployment Packages
Core deployments represent the basic ITS services that are likely to be monitored or managed by MDOT. These generally include proven technologies that have been in operation for some time. The amount of deployment, level of monitoring, and the specific services provided on a given portion of the transportation system, depend on whether it is slated for high-intensity or low-intensity deployment.
Freeway Traffic Management
The core grouping of freeway traffic management provides the basic monitoring, traveler assistance, and information feedback mechanisms for highway infrastructure. Together with arterial traffic management, freeway management functions provide the information skeleton on which additional services depend and build.

1/31/2008 Bay Region 24 Final Regional ITS Deployment Plan
Table 4 - Freeway Management Deployment Types
Function High-Intensity Deployment Low-Intensity Deployment Detection 100% roadway coverage
(Loop Detector, Microwave, Radar or Imaging technology) At least one detector on each
segment and ramp, plus additional detectors for long segments
Majority coverage (Loop Detector, Microwave, Radar or Imaging Technology) Detector on each segment
Surveillance/ Verification
100% roadway coverage (Streaming CCTV camera images able to view entire mileage) Fixed cameras at priority
locations; pan/tilt/zoom cameras at non-priority locations
Pan/tilt/zoom camera coverage of all interchanges
Priority coverage Major interchanges and other
priority locations have pan/tilt/zoom camera coverage
Freeway Service Patrol
Dedicated service to specific routes during peak periods
Deployed only during busiest travel days; applies primarily to recreational routes.
Highway Advisory Radio (HAR)
100% reception coverage No need for HAR in high-intensity deployment, due to frequent DMS units
Announcement signs upon entering or leaving low-intensity coverage area
Will include roadway weather information where available
Dynamic Message Signs (DMS)
Approaching every interchange, at critical decision-making locations
On both surface road approaches to interchange (allowing sufficient time to change route)
At major regional decision points For specific safety warnings.
Cell phone probes for reporting travel times
Reporting of travel times using cell phone probes on all roads where service is available and traffic volumes provide an adequate sample
Reporting of travel time using cell phone probes on major trunkline routes
Arterial Traffic Management
Arterial traffic management caters to the unique needs of high-volume surface streets. Deployments must address additional delay and safety concerns, resulting from the presence of signalized intersections and railroad grade crossings. Implementation of formalized incident management strategies require that excess traffic resulting from freeway incidents or construction information be accommodated. Information must be provided to both agency personnel and the public on arterial conditions, and where possible, signal timing be adaptable to major change in traffic flow. Both high and low-intensity deployments have been identified for the Bay Region, particularly in the I-75 corridor where major arterials can provide relief to freeway congestion during incidents or periods of peak demand.
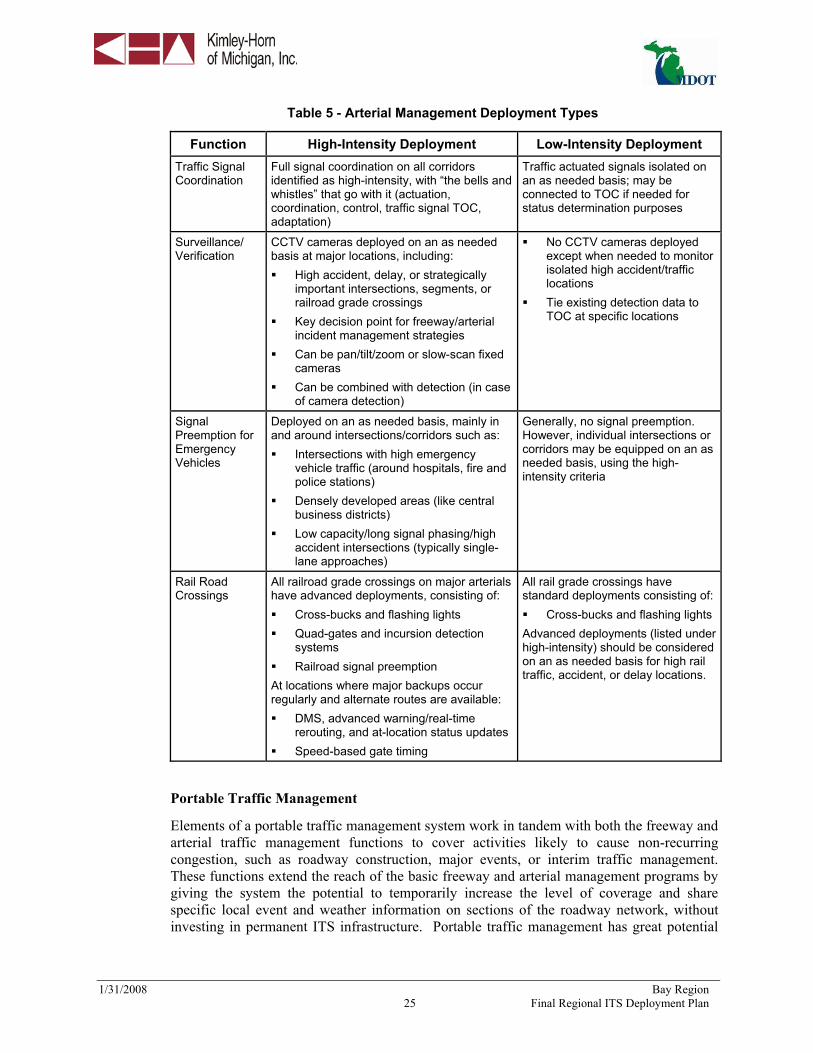
1/31/2008 Bay Region 25 Final Regional ITS Deployment Plan
Table 5 - Arterial Management Deployment Types
Function High-Intensity Deployment Low-Intensity Deployment Traffic Signal Coordination
Full signal coordination on all corridors identified as high-intensity, with “the bells and whistles” that go with it (actuation, coordination, control, traffic signal TOC, adaptation)
Traffic actuated signals isolated on an as needed basis; may be connected to TOC if needed for status determination purposes
Surveillance/ Verification
CCTV cameras deployed on an as needed basis at major locations, including: High accident, delay, or strategically
important intersections, segments, or railroad grade crossings
Key decision point for freeway/arterial incident management strategies
Can be pan/tilt/zoom or slow-scan fixed cameras
Can be combined with detection (in case of camera detection)
No CCTV cameras deployed except when needed to monitor isolated high accident/traffic locations
Tie existing detection data to TOC at specific locations
Signal Preemption for Emergency Vehicles
Deployed on an as needed basis, mainly in and around intersections/corridors such as: Intersections with high emergency
vehicle traffic (around hospitals, fire and police stations)
Densely developed areas (like central business districts)
Low capacity/long signal phasing/high accident intersections (typically single-lane approaches)
Generally, no signal preemption. However, individual intersections or corridors may be equipped on an as needed basis, using the high-intensity criteria
Rail Road Crossings
All railroad grade crossings on major arterials have advanced deployments, consisting of: Cross-bucks and flashing lights Quad-gates and incursion detection
systems Railroad signal preemption
At locations where major backups occur regularly and alternate routes are available: DMS, advanced warning/real-time
rerouting, and at-location status updates Speed-based gate timing
All rail grade crossings have standard deployments consisting of: Cross-bucks and flashing lights
Advanced deployments (listed under high-intensity) should be considered on an as needed basis for high rail traffic, accident, or delay locations.
Portable Traffic Management
Elements of a portable traffic management system work in tandem with both the freeway and arterial traffic management functions to cover activities likely to cause non-recurring congestion, such as roadway construction, major events, or interim traffic management. These functions extend the reach of the basic freeway and arterial management programs by giving the system the potential to temporarily increase the level of coverage and share specific local event and weather information on sections of the roadway network, without investing in permanent ITS infrastructure. Portable traffic management has great potential

1/31/2008 Bay Region 26 Final Regional ITS Deployment Plan
for the Bay Region since there is heavy recreational traffic volumes during the peak construction season and in a number of cases there are alternate routes available.
Table 6 - Portable Traffic Management Deployment Types
Function High-Intensity Deployment Low-Intensity Deployment Portable detection Portable detection and information
equipment at construction sites along freeways and major trunklines, including: Portable DMS Detection equipment approaching
and within the impacted zone
Portable DMS with remote connection to TMC providing advanced warning of activity Depending on length of impacted roadway and duration of activity, portable detectors may be installed to track impact
Portable DMS Direct wireless communication between field equipment and TMC Wireless communication between detectors and DMS with pre programmed advance information
Advanced Traveler Information Systems (ATIS)
ATIS can be accomplished through public/private partnerships. Many agencies contract their ATIS function to a private contractor. MDOT, through the MITS Center, has participated in private partnerships. The private sector has, to date, shown interest primarily in major urban areas with high levels of congestion. Decisions regarding high- and low-intensity deployment require assumptions about what services a private provider would be willing to offer, policies that a public agency could use to encourage particular service, and actions that a public agency should take to support full information provision. Some of the in-vehicle technologies being explored may enable traffic information to be obtained and disseminated to a larger number of rural roads.

1/31/2008 Bay Region 27 Final Regional ITS Deployment Plan
Table 7 - ATIS Deployment Types
Function High-Intensity Deployment Low-Intensity Deployment Cellular phones, Pagers, Handheld devices
Complete broadcast coverage
Complete interactive, route-planning capabilities
Partial broadcast coverage Complete interactive, route-
planning capabilities, within coverage
Emphasis on real-time regional route choice information (for long-distance/intercity travelers)
Internet Network Coverage for all portions of system where information is available Route-planning services for
metropolitan areas focused more on disaggregated/ localized information
Availability of real-time TMC CCTV camera feeds and speed data
Network Coverage concentrated on major routes Route-planning services for
outlying areas focused on regional information
Kiosks Multimodal and public
transportation only Broadcast (static TV
screens and terminals) and interactive
Linked to TMC or other sources of transportation information Deployed at high pedestrian traffic facilities, on an as needed basis including major multi/modal terminals (airports, park-and-ride lots, rail stations, transit transfer points) and major commercial centers (office complexes, shopping centers, universities, public parking garages)
Displays static information on construction activity and/or transit routes. Deployed at similar locations to high intensity, but at fewer locations.
511 travel information service
Complete Coverage Coverage confined to major, high-intensity routes
Incident Management – Freeway/Arterial Integration
Functions in this grouping are used to implement a defined incident management plan, to respond to major accidents or natural disasters. The functions help the designated relief arterials to accommodate increased traffic that has been rerouted off of impacted freeway segments. In high-intensity applications, active management of both freeway and arterial corridors is provided. In low-intensity applications, information is provided but proactive management of the arterial system is not. This was noted by stakeholders as an important need for the Bay Region, particularly in the I-75 and I-69 corridors.

1/31/2008 Bay Region 28 Final Regional ITS Deployment Plan
Table 8 - Incident Management Deployment Types
Function High-Intensity Deployment Low-Intensity Deployment Incident freeway-arterial signal coordination
For freeway-alternate arterial pairs identified in a regional incident management plan. Arterial signals along alternate
corridor able to adjust for shifting traffic pattern
Can be either manual control between freeway TMC and signal coordination center, or seamless sensor-automated control
For freeway-alternate arterial pairs identified in a regional incident management plan. Information provided on freeway
through DMS Traffic monitored on parallel arterials
but no proactive management
Alternate route guidance (Trailblazer)
“Trailblazer” or similar dynamic route guidance signs deployed at all potential decision points along alternate arterial corridor
“Trailblazer” signs not deployed but portable DMS may be used in certain situations
Advanced Infrastructure-Based Warning and Safety
These include additional deployments that are generally deployed on an as needed basis at or in advance of roadway locations where potential safety hazards exist. They consist of detection, surveillance and/or information display systems that are deployed on the roadway or roadside. Based upon the characteristics of individual vehicles detected (for example, vehicles classification, and vehicle speed), these systems can trigger warning messages about potential safety hazards. These are different from advanced in-vehicle systems, in that, they are deployed on the roadway or roadside, and they are monitored and controlled by public agencies. These systems may be deployed in isolated areas where the core ITS infrastructure deployment is not very intensive, or may be deployed to supplement the core deployments. Since these are limited deployments tied to a single location, there is no explicit difference identified between high-intensity and low-intensity deployments.
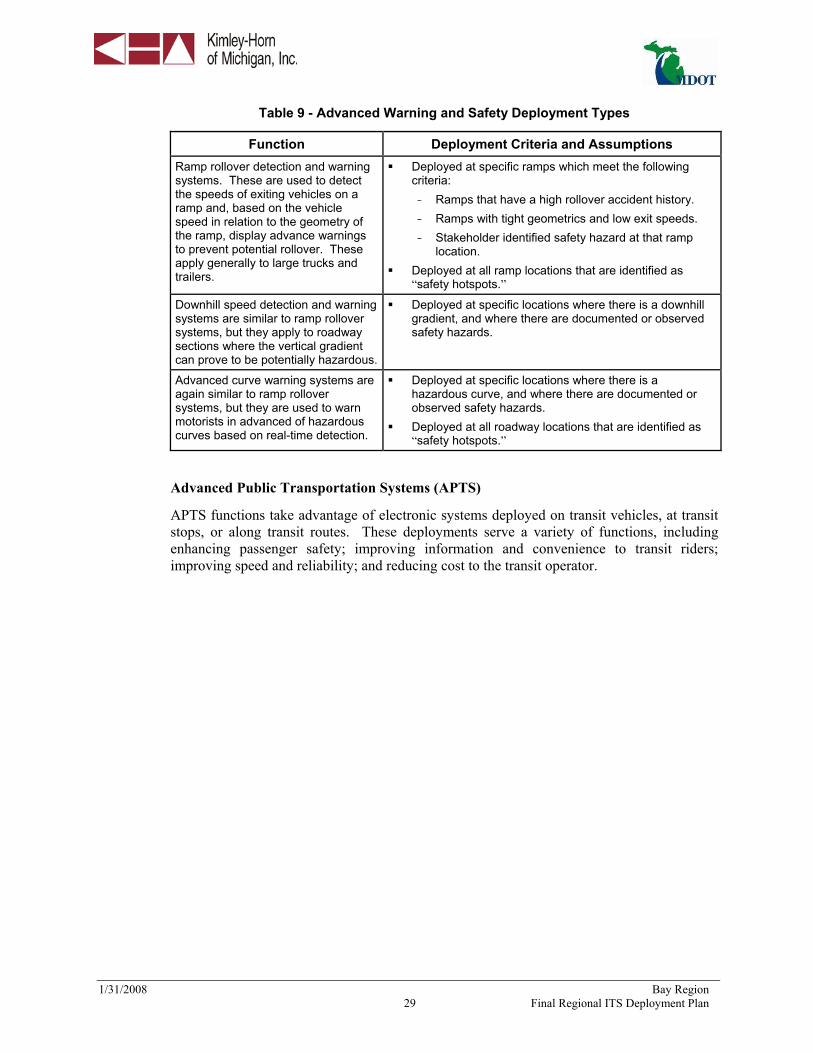
1/31/2008 Bay Region 29 Final Regional ITS Deployment Plan
Table 9 - Advanced Warning and Safety Deployment Types
Function Deployment Criteria and Assumptions Ramp rollover detection and warning systems. These are used to detect the speeds of exiting vehicles on a ramp and, based on the vehicle speed in relation to the geometry of the ramp, display advance warnings to prevent potential rollover. These apply generally to large trucks and trailers.
Deployed at specific ramps which meet the following criteria: - Ramps that have a high rollover accident history. - Ramps with tight geometrics and low exit speeds. - Stakeholder identified safety hazard at that ramp
location. Deployed at all ramp locations that are identified as
“safety hotspots.”
Downhill speed detection and warning systems are similar to ramp rollover systems, but they apply to roadway sections where the vertical gradient can prove to be potentially hazardous.
Deployed at specific locations where there is a downhill gradient, and where there are documented or observed safety hazards.
Advanced curve warning systems are again similar to ramp rollover systems, but they are used to warn motorists in advanced of hazardous curves based on real-time detection.
Deployed at specific locations where there is a hazardous curve, and where there are documented or observed safety hazards.
Deployed at all roadway locations that are identified as “safety hotspots.”
Advanced Public Transportation Systems (APTS)
APTS functions take advantage of electronic systems deployed on transit vehicles, at transit stops, or along transit routes. These deployments serve a variety of functions, including enhancing passenger safety; improving information and convenience to transit riders; improving speed and reliability; and reducing cost to the transit operator.

1/31/2008 Bay Region 30 Final Regional ITS Deployment Plan
Table 10 - APTS Deployment Types
Function High-Intensity Deployment Low-Intensity Deployment Electronic fare payment
Fare card and readers deployed throughout system, can be connected to park-and-ride payment system or used to pay for other goods and services (Smart card)
Fare card and readers deployed throughout system
Automatic Vehicle Location (AVL)
All transit vehicles equipped with AVL. Vehicle locations monitored by central transit monitoring center. Communication links provided so that data can be used for traffic management system.
AVL used only on most heavily traveled routes or in largest divisions. Vehicle locations monitored by central transit monitoring center.
Transit safety systems
All transit vehicles equipped with incident monitors. Incidents detected by central transit monitoring center.
Incident monitors provided on new transit vehicles, or vehicles serving specific routes. Incidents detected by central transit monitoring center.
Advanced routing for demand responsive transit
Para-transit routing controlled in real-time by central AVL enhanced dispatching. Communication links provided so that data can be used for traffic management system
Para-transit routing controlled in real-time by central AVL enhanced dispatching. May be limited to certain routes and services.
Advanced transit vehicle monitoring/ maintenance
All transit vehicles equipped with vehicle status/driver condition monitors. Vehicle status monitored by central transit monitoring center.
Vehicle status/driver condition monitors limited to certain routes and services. Vehicle status monitored by central transit monitoring center.
Enhanced transit information
Real-time vehicle location and time to arrival provided both at stops and in-vehicle
Real-time vehicle location and time to arrival provided at a limited number of high-volume stops
Emergency/Service Vehicle Dynamic Routing
Functions in this grouping take advantage of AVL equipment and the availability of real-time traffic information to improve the dispatching – and hence arrival time, utilization, and level of service – of service and emergency vehicles. Since this technology would be applied to all vehicles in a fleet, or division, there is no distinction made between high-intensity and low-intensity deployment.
Table 11 - Emergency Vehicle Deployment Types
Function Deployment Emergency and service vehicle AVL
All emergency and service vehicles equipped with AVL devices.
Computer aided real-time dispatch
Vehicle location and status monitored to provide optimum real-time dispatching
Parking Management Systems
In areas with pronounced peaks in demand for parking such as central business districts, park and ride facilities, universities, major medical centers, and sporting and entertainment venues, ITS technologies can provide information on parking cost and availability. Functions in this group help reduce congestion and delay associated with finding or paying

1/31/2008 Bay Region 31 Final Regional ITS Deployment Plan
for a parking space. It is anticipated that these systems will be implemented primarily through local authorities, financial institutions, and the private sector.
Table 12 - Advanced Parking Management Deployment Types
Function High-Intensity Deployment Low-Intensity Deployment Parking garage status monitoring
All participating garages equipped with occupancy sensors/vehicle counters to determine number and location of available spaces
Participating garages keep track of parking occupancy through sensors or other means and report to local control center
Regional parking availability information
Real-time information on parking status provided through varying channels: To dedicated parking
management DMS at major local decision points
Over Internet for pre-trip planning purposes
To in-vehicle information systems (if available)
Information provided regarding parking availability is static or based on historic data through means similar to those in high-intensity deployment Information delivery mechanisms similar to those used in high-intensity deployment
Automated payment
All participating garages equipped with electronic payment tag readers. Optional service for equipped
vehicles
Same as high-intensity deployment
Weather and Road Condition Monitoring/Management
Road condition monitoring and management functions help traffic managers detect potential weather-related problems and take appropriate measures to minimize the risks to travelers. One of the major benefits is improved efficiency in winter maintenance. This includes both more efficient deployment of resources based on localized weather condition information and tracking and subsequent analysis of materials usage. These functions can be most useful on isolated roadway segments (where weather conditions are not reported as intensively, and response time and cost is greater), or segments with a history of weather-related accidents. In the Bay Region, as in much of Michigan, conditions can vary dramatically within a limited area. Weather can have a major impact on the heavy volumes of recreational traffic including both winter storms during ski season and heavy thunderstorms during peak summer season.
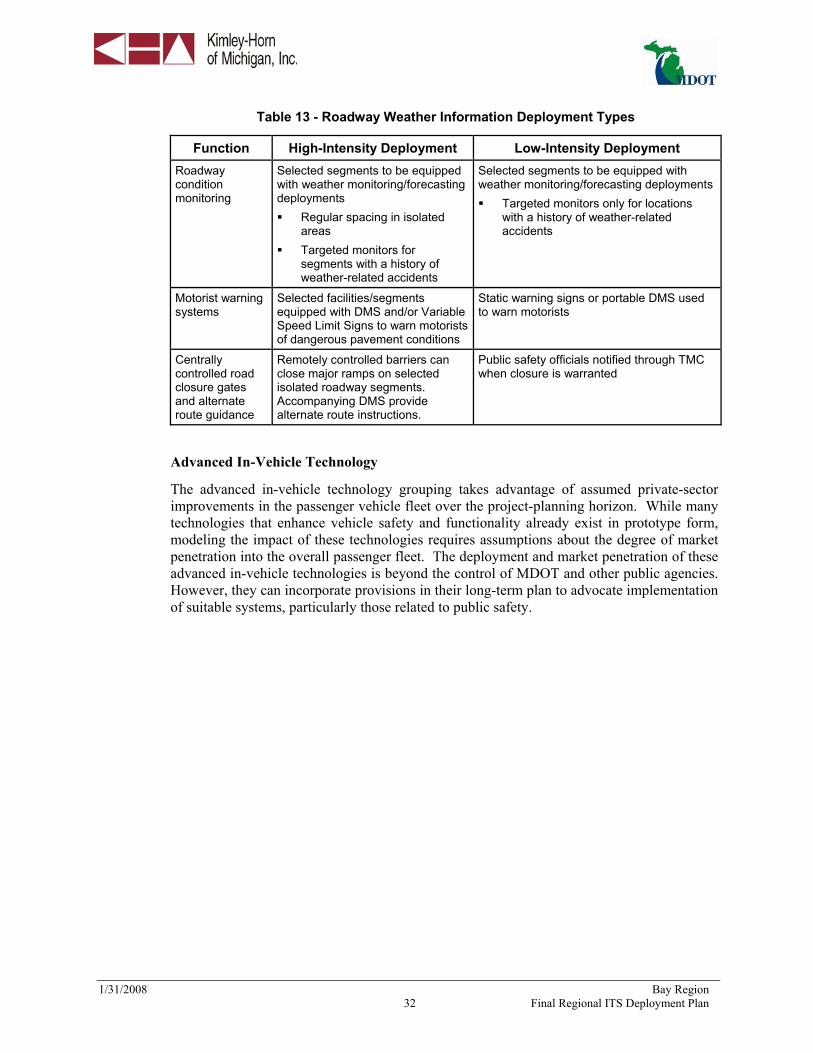
1/31/2008 Bay Region 32 Final Regional ITS Deployment Plan
Table 13 - Roadway Weather Information Deployment Types
Function High-Intensity Deployment Low-Intensity Deployment Roadway condition monitoring
Selected segments to be equipped with weather monitoring/forecasting deployments Regular spacing in isolated
areas Targeted monitors for
segments with a history of weather-related accidents
Selected segments to be equipped with weather monitoring/forecasting deployments Targeted monitors only for locations
with a history of weather-related accidents
Motorist warning systems
Selected facilities/segments equipped with DMS and/or Variable Speed Limit Signs to warn motorists of dangerous pavement conditions
Static warning signs or portable DMS used to warn motorists
Centrally controlled road closure gates and alternate route guidance
Remotely controlled barriers can close major ramps on selected isolated roadway segments. Accompanying DMS provide alternate route instructions.
Public safety officials notified through TMC when closure is warranted
Advanced In-Vehicle Technology
The advanced in-vehicle technology grouping takes advantage of assumed private-sector improvements in the passenger vehicle fleet over the project-planning horizon. While many technologies that enhance vehicle safety and functionality already exist in prototype form, modeling the impact of these technologies requires assumptions about the degree of market penetration into the overall passenger fleet. The deployment and market penetration of these advanced in-vehicle technologies is beyond the control of MDOT and other public agencies. However, they can incorporate provisions in their long-term plan to advocate implementation of suitable systems, particularly those related to public safety.

1/31/2008 Bay Region 33 Final Regional ITS Deployment Plan
Table 14 - Advanced In-vehicle Deployment Types
Function Deployment In-vehicle traveler information devices. (In the long term in-vehicles information may begin to phase-out traditional roadside information systems such as DMS or road signs.)
In-vehicle safety warnings to detect hazardous roadway/pavement conditions
Enhanced driver vision to enhance the driver’s view of the roadway, or potential obstacles
Driver condition monitoring to detect the driver’s ability to operate the vehicle safely
Collision avoidance systems to prevent longitudinal, lateral, and roadway departure collisions
In-vehicle mayday systems that either deploy automatically in case of an accident, or can be used to automatically notify public safety or emergency response agencies at the push of a button
Information collected by the public sector for traffic management can help support in-vehicle travel information services provided by private firms
Mayday system connected to public safety and transportation agencies can help to expedite response
2.4 Evaluation of Alternatives
2.4.1 Evaluation Criteria
Evaluation of the alternatives is based on several criteria, including:
Local Stakeholder Input
An understanding of local requirements and performance expectations is critical to the evaluation of alternatives. As documented earlier in this section, an extensive stakeholder process was used to help identify needs, define projects, and determine priorities. The process in the Bay Region was effective in bringing in a wide range of stakeholders, although participation from some sectors, such as public transportation, was limited. Through a series of Traffic and Road Condition Information – This is a critical need for the region. I-75 is the major north-south highway in the region and experiences heavy congestion during peak recreational weekends. Flint (I-475) and Saginaw (I-675) both have loop roads that can provide relief if information can be given to motorists. DMS signs have been programmed that will serve both the Flint and Saginaw areas, as well as Bay City and the I-75/US-23 Connector near Standish. There are also north-south arterial roads that can be used for relief in case of major incidents. Since many recreational trips have some discretion in their timing, dissemination of I-75 corridor conditions into the Detroit area and points south could enable people to adjust their trip times or take an alternate route. Some initial deployments are currently underway in the Flint region. I-69 carries heavy volumes of commercial traffic to and from the Blue Water Bridge. Major incidents are frequent, and while alternate routes are limited, information can be very helpful in this corridor as well. Technologies that help clear incidents and provide information on traffic conditions and alternative routes, particularly during peak recreational season, is

1/31/2008 Bay Region 34 Final Regional ITS Deployment Plan
considered a high priority need. A variety of informational services have been identified to let the public know of dangerous road conditions and unexpected delays. Many of these options build upon existing services. Better information on construction activity and resulting traffic backups is also noted as a major need.
Safety – Winter weather in the region is severe and can vary dramatically within a relatively small area. Improved weather information is considered essential to provide faster clearance of snow and ice, and to provide motorists with more detailed information on roadway weather conditions. A need for anti-icing systems and possibly hazard warnings has been noted for some locations.
Arterial Traffic Flow – There a number of commercial arterials in the region that could benefit from signal upgrades. Several arterial roadways in the southern portion of the region are experiencing great pressure as a result of increased commuter traffic between growing residential areas in southern Genesee County and growing employment centers in northern Oakland County. M-15, M-24 and M-83 are all projected to experience increasing congestion as this trend continues. ITS and operational improvements are an important part of a mitigation strategy.
Winter maintenance – The majority of MDOT’s regional maintenance budget is spent during the winter. Most MDOT roads are cleared by County Road Commissions and there is a need for better real-time coordination between MDOT and County maintenance crews. Improved information on pavement conditions is also considered a high priority.
Compatibility with MDOT Programs and Projects
One of MDOT’s objectives in developing regional ITS architectures and deployment plans was to provide a common framework across the State. In addition, projects will need to be compatible with the statewide ATMS software that is being developed under a separate contract. MDOT wants to assure that systems developed at the regional level are compatible with statewide requirements. There is also a need to coordinate projects between regions. Seasonal congestion on I-75 and US-127, for example, can impact both the Bay and the North Regions. Technologies and deployment intensity across the corridor should be similar in all regions.
With a limited budget available, projects that can be implemented as part of the overall capital program may receive a higher priority for implementation. These projects can be implemented more cost-effectively and possibly take advantage of other funding sources.
The budget of the ITS statewide program will have a major impact on project implementation. With a current budget of $12 million per year, initial capital costs as well as long term operation and maintenance requirements will have a major impact on feasibility. Larger projects will need to be phased in over a period of time, meaning that interim deployments should be able to show some benefit on their own.
Benefit/Cost Analysis
Using the IDAS model benefits and costs for various ITS deployments, “packages” have been developed. Detailed evaluation criteria include:
Benefits, including:
- Impacts on recurring and non-recurring congestion (mobility savings and travel time reliability savings);
1/31/2008 Bay Region 35 Final Regional ITS Deployment Plan
- Safety (accident reduction);
- Operating costs (fuel and operating savings); and
- Emissions reductions.
Life-cycle costs, including capital and operating and maintenance (O&M) costs for both public and private sectors.
2.4.2 Technical Evaluation Process
This section describes the methodology used to conduct this technical evaluation which included several objectives:
To quantitatively assess the benefits and costs of each alternative;
To refine alternatives based on benefit-cost analysis;
To develop viable projects for implementation; and
To provide guidance on deployment decisions.
The tools used also provide information that can be used to:
Estimate implementation timeframe and resource requirements; and
Documentation for transition into design and implementation.
2.4.2.1. IDAS Description
The most important quantitative tool used in the evaluation was the ITS Deployment Analysis System (IDAS). This software package was used to conduct the benefit-cost analysis of identified ITS improvements. IDAS is a sketch-planning software and analysis methodology developed by Cambridge Systematics for the Federal Highway Administration (FHWA).
IDAS was developed to assist state, regional, and local agencies in integrating ITS into the transportation planning process. Planners and others can use IDAS to calculate relative costs and benefits of ITS investments. IDAS currently predicts costs, benefits, and impacts for more than 60 types of ITS investments that are shown in Table 15. These ITS components can be deployed in combination or isolation.
In order to be consistent with current transportation planning processes, IDAS operates as a post-processor to travel demand models used by Metropolitan Planning Organizations (MPO) and by state DOTs. IDAS, although a sketch-planning tool, can implement the modal split and/or traffic assignment steps associated with a traditional planning model. These are key steps in estimating the changes in modal, route, and temporal decisions of travelers resulting from ITS technologies.
The bold items shown on Table 15 are those for which IDAS was applied during the project. Other projects, such as Advanced Vehicle Control and Safety Systems, are being developed at the statewide level as part of the VII program, but could not be analyzed with IDAS at the region al level. The 2010 MDOT Statewide Travel Demand model served as the basis for this analysis.
1/31/2008 Bay Region 36 Final Regional ITS Deployment Plan
The set of impacts evaluated by IDAS included changes in user mobility, travel time/speed, travel time reliability, fuel costs, operating costs, accident costs, emissions, and noise. The performance of selected ITS options can be viewed by market sector, facility type, and district. The district function was used in this project to produce data for the study area sectors. Given the diverse types of performance measures that may be impacted by ITS and the desirability of providing a comprehensive analysis tool, IDAS is comprised of five different analysis modules as shown in Figure 10.

1/31/2008 Bay Region 37 Final Regional ITS Deployment Plan
Table 15 - ITS Components Assessed in IDAS
1. Arterial Traffic Management Systems Isolated Traffic Actuated Signals Preset Corridor Signal Coordination Actuated Corridor Signal Coordination Central Control Signal Coordination Emergency Vehicle Signal Priority Transit Vehicle Signal Priority
2. Freeway Management Systems
Preset Ramp Metering Traffic Actuated Ramp Metering Centrally Controlled Ramp Metering
3. Advanced Public Transit Systems
Fixed Route Transit – Automated Scheduling System
Fixed Route Transit – Automated Vehicle Location
Fixed Route Transit – Combination of Automated Scheduling System and Automated Vehicle Location
Fixed Route Transit – Security Systems Paratransit – Automated Scheduling System Paratransit – Automated Vehicle Location Paratransit – Combination of Automated
Scheduling System and Automated Vehicle Location
4. Incident Management Systems
Incident Detection/Verification Incident Response/Management Combination of Incident
Detection/Verification/Response/Management
5. Electronic Payment Collection Systems
Electronic Transit Fare Payment Basic Electronic Toll Collection
6. Railroad Grade Crossing Monitors
Railroad Grade Crossing Monitors 7. Emergency Management Services
Emergency Vehicle Control Service Emergency Vehicle Automated Vehicle
Location In-Vehicle Mayday System
8. Regional Multimodal Traveler Information Systems
Highway Advisory Radio Freeway Dynamic Message Sign Transit Dynamic Message Sign Telephone-Based Multimodal Traveler
Information System Web/Internet-Based Multimodal Traveler
Information System Kiosk with Multimodal Traveler Information Kiosk with Transit-Only Traveler Information Handheld Personal Device – Traveler
Information Only Handheld Personal Device – Traveler
Information with Centralized Route Guidance In-Vehicle – Traveler Information Only In-Vehicle – Traveler Information with
Centralized Route Guidance 9. Commercial Vehicle Operations
Electronic Screening Weigh-in-Motion Electronic Clearance – Credentials Electronic Clearance – Safety Inspection Combination Electronic Screening and
Clearance Safety Information Exchange On-Board Safety Monitoring Electronic Roadside Safety Inspection Hazardous Materials Incident Response
10. Advanced Vehicle Control and Safety Systems
Motorist Warning – Ramp Rollover Motorist Warning – Downhill Speed Longitudinal Collision Avoidance Lateral Collision Avoidance Intersection Collision Avoidance Vision Enhancement for Crashes Safety Readiness
11. Supporting Deployments
Traffic Management Center Transit Management Center Emergency Management Center Traffic Surveillance – CCTV Traffic Surveillance – Loop Detector System Traffic Surveillance – Probe System Basic Vehicle Communication Roadway Loop Detector Roadway Weather Information System Drawbridge Management System Parking Management System

1/31/2008 Bay Region 38 Final Regional ITS Deployment Plan
Figure 10 - IDAS Model Structure
Benefits Module
• IDAS control alternative assignment • Mode choice • Temporal choice • Induced/foregone demand
• IDAS ITS option assignment • Mode choice • Temporal choice • Induced/foregone demand
Travel Time/Throughput
Environment
Safety
D Traditional benefit measures D Non-traditional benefit measures
User Input
Alternatives Generator 4
Alternatives Comparison Module
Cost Module
Outputs
• Performance measures • Cost/benefit analysis • Sensitivity analysis • Ranking of ITS options • Risk analysis • Plots of link volumes
and speeds
6
7
5
5.2
5.3
5.4
Input/Output Interface 3
Travel Demand Model Data
Benefit Valuation
Travel Time Reliability 5.5

1/31/2008 Bay Region 39 Final Regional ITS Deployment Plan
2.4.2.2. IDAS Inputs and Default Values
For this evaluation, data outputs were obtained from the statewide travel demand model to use as inputs into the IDAS model. The model data included both network files and travel demand files (trip tables) representing daily volumes for 2010. Only highway facilities, including automobile and truck trips, were evaluated using the models.
Other parameters, such as baseline travel time skims (zone to zone), turn prohibitors, volume-delay curves, in- and out-of-vehicle travel times, and vehicle occupancies from the model were incorporated into IDAS.
IDAS estimates the impacts of the various ITS deployments by drawing on a database of default impacts for each separate ITS component. These defaults were developed by assembling and analyzing observed impacts and evaluation results for similar deployments across the United States.
The default impacts form the basis for the estimation of impacts on traffic, such as travel time and speed, in the IDAS software. The project team used a combination of default values and values developed for the Southeast Michigan ITS Deployment Study conducted from 2000 to 2002. That study included a commuter survey of both the Detroit and Lansing regions that helped to refine the national parameters. In general, a conservative approach to estimation of benefits was taken. In some cases, the national default values were used for this analysis, while in others, default values produced very high impact estimates. Modifications were made based on Michigan specific data. Table 16 presents the adjusted impact values used for the MDOT system benefits evaluation as compared to the IDAS national default values.

1/31/2008 Bay Region 40 Final Regional ITS Deployment Plan
Table 16 - Comparison of Impact Values Used for IDAS Analysis
Deployment Benefit Parameter Reduction in incident duration 20%
Reduction in fuel consumption 1%
Freeway Service Patrols
Reduction in fatality rate 1%
Traffic Signal Progression
Capacity improvement on impacted links 11%
Applied to only days with more than 1” of snow
27
Reduction in travel time 3%
Reduction in crashes 10%
Roadway Weather Information Systems
Reduction in winter maintenance costs 7% without AVL 10% with AVL
Amount of time useful information is displayed
10%
Percent of travelers responding to information
28%
Time saved per traveler 11 minutes
Smart Work Zones
Additional travel time impacts from rerouting of traffic due to work zone capacity reductions
Impacts dependent on
specific roadway volumes and
alternative routes
Benefits only during boating season May through September
150 days
Amount of time useful information is displayed
1% (Long openings and
malfunctions in open position)
Percent of travelers responding to information
75%
Drawbridge Management System
Time saved per traveler 5 minutes
Benefits only during peak recreational seasons
120 days
Amount of time useful information is displayed
10%
Percent of travelers responding to information
28%
Traverse City Regional Parking System
Time saved per traveler 3 minutes
APTS CAD and AVL
Operating Cost Savings 5%
Crash reduction -0.5% in all categories
Automated Weigh-in-Motion Stations
Travel time savings 2 minutes for commercial vehicles

1/31/2008 Bay Region 41 Final Regional ITS Deployment Plan
Table 17 includes the monetized values of the benefit parameters used in this analysis. The parameters were developed by FHWA in 1995 and have been inflated to 2010 using a 3% annual inflation rate. The one exception was the price of fuel, which significantly exceeded the 3% inflation rate. This cost was raised to $3/gallon.
Table 17 - Monetary Values of IDAS Default Parameters
Benefit Parameters
Parameter Values
Number of travel days in a year 247
Year of $ values 2010
Inflation Rate 3%
Value of In-vehicle time $15.00
Value of In-vehicle time (commercial) $26.42
Value of Out-of-vehicle time (commercial) $26.49
Value of time multiplier for Emergency Vehicle 30.0
Value of Out-of-vehicle time $26.49
Value of reduced delay time $45.03 Fuel Costs (gallon) $3.00
Emissions Costs ($/ton)
HC/ROG $2,763.83
NOX $5,812.78
CO $6,058.94
PM10 $17,240.47
CO2 $5.55
SO2 $5.55 GW $0.00
Internal Fatality $3,610,430.58
Injury $79,082.43
Property damage $4,399.70
External Fatality $637,133.89
Injury $13,956.27
Property damage $775.87
Non-Fuel operating costs ($/mile) $0.10
Noise Damage Costs ($/mile) $0.0011
Other mileage based ($/mile) $0.00
Other non-mileage based ($/mile) $0.00
Accident Costs
Cost of winter Maintenance ($/mile) $2,000.00
Figure 11 shows how individual elements of the ITS systems are deployed on links of the network in IDAS. In this case, some of the proposed RWIS stations for the Lower Peninsula are shown. It should be noted that these are conceptual
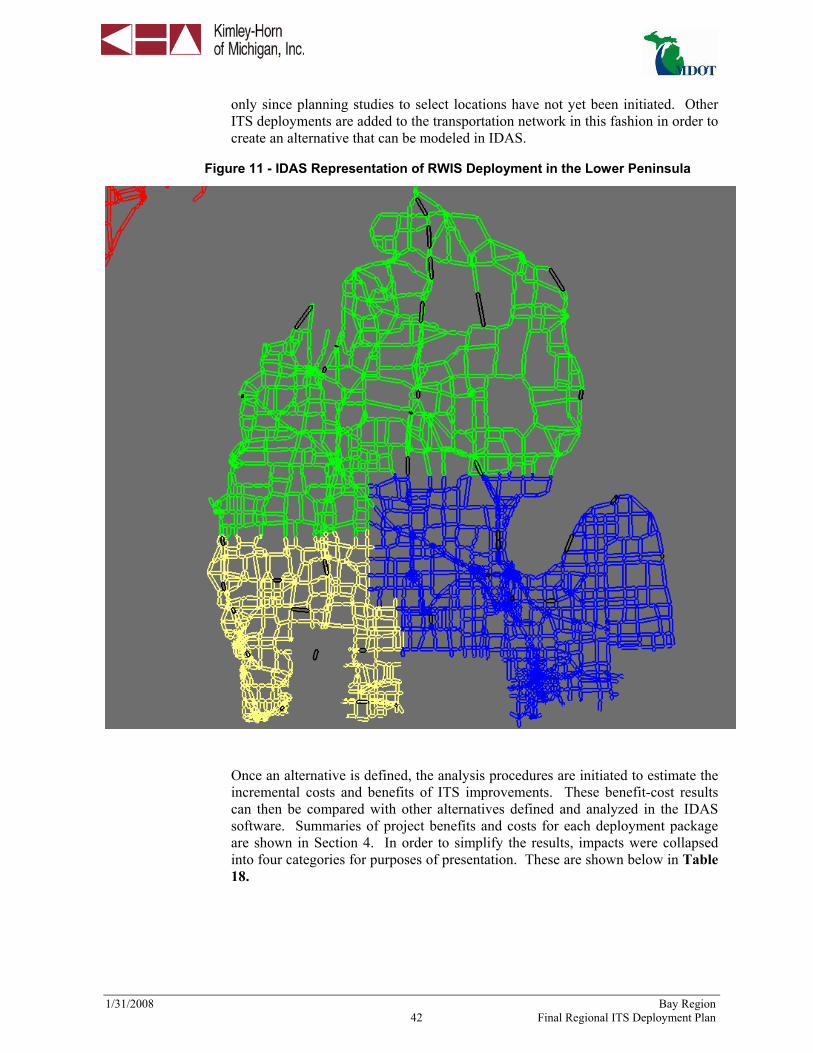
1/31/2008 Bay Region 42 Final Regional ITS Deployment Plan
only since planning studies to select locations have not yet been initiated. Other ITS deployments are added to the transportation network in this fashion in order to create an alternative that can be modeled in IDAS.
Figure 11 - IDAS Representation of RWIS Deployment in the Lower Peninsula
Once an alternative is defined, the analysis procedures are initiated to estimate the incremental costs and benefits of ITS improvements. These benefit-cost results can then be compared with other alternatives defined and analyzed in the IDAS software. Summaries of project benefits and costs for each deployment package are shown in Section 4. In order to simplify the results, impacts were collapsed into four categories for purposes of presentation. These are shown below in Table 18.

1/31/2008 Bay Region 43 Final Regional ITS Deployment Plan
Table 18 - Summary Categories for IDAS Benefits
Summary Category IDAS Subcategories Included Travel Time Savings Change in User Mobility
Change in User Travel Time In-vehicle travel time Out-of-vehicle travel time Travel time reliability
Fuel/Operating Cost Savings Change in Costs Paid by Users Fuel Costs Non-fuel operating costs
Accident Reduction Change in Costs Paid by Users Accident Costs (Internal Only)
Change in External Costs Accident Costs (External Only)
Air Quality/Environmental Change in External Costs Emissions
- HC/ROG - NOx - CO - PM10 - CO2 - Global Warming
Noise Other Mileage-based External Costs Other Trip-Based External Costs
2.4.2.3. Estimation of ITS Alternative Costs
Development of cost estimates for the various ITS alternatives required full consideration of the unique characteristics and requirements of ITS strategies that impact the costs, funding, and implementation of improvements. Planning of ITS improvements requires an increased effort on operational planning that is not generally considered in planning for traditional transportation infrastructure projects. ITS strategies typically require that a greater proportion of resources be expended for ongoing O&M activities than do traditional improvements. A “rule of thumb” based on general experience is that annual operations and maintenance expenditures are about 15-20 percent of the original capital cost. However, this figure can vary depending on the size and complexity of the operation. A lower percentage may indicate that there is a lack of investment that will require premature replacement of equipment. The replacement cycles of equipment also must be carefully considered as ITS equipment does not have as long a life cycle as traditional transportation agency assets. Failure to account for these continuing costs and funding responsibilities may result in future shortfalls in funding, personnel, or resources.
IDAS software can generate default values for a wide range of cost elements, in a manner similar to that used to calculate benefits. For this project, however, two
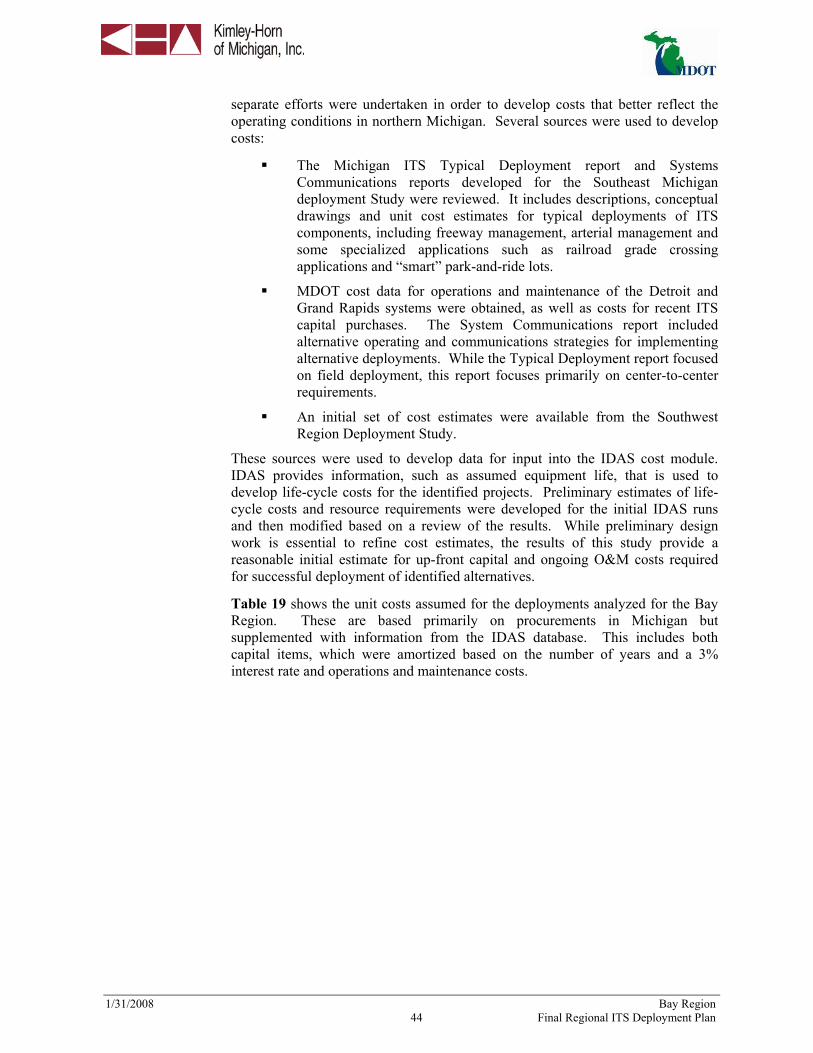
1/31/2008 Bay Region 44 Final Regional ITS Deployment Plan
separate efforts were undertaken in order to develop costs that better reflect the operating conditions in northern Michigan. Several sources were used to develop costs:
The Michigan ITS Typical Deployment report and Systems Communications reports developed for the Southeast Michigan deployment Study were reviewed. It includes descriptions, conceptual drawings and unit cost estimates for typical deployments of ITS components, including freeway management, arterial management and some specialized applications such as railroad grade crossing applications and “smart” park-and-ride lots.
MDOT cost data for operations and maintenance of the Detroit and Grand Rapids systems were obtained, as well as costs for recent ITS capital purchases. The System Communications report included alternative operating and communications strategies for implementing alternative deployments. While the Typical Deployment report focused on field deployment, this report focuses primarily on center-to-center requirements.
An initial set of cost estimates were available from the Southwest Region Deployment Study.
These sources were used to develop data for input into the IDAS cost module. IDAS provides information, such as assumed equipment life, that is used to develop life-cycle costs for the identified projects. Preliminary estimates of life-cycle costs and resource requirements were developed for the initial IDAS runs and then modified based on a review of the results. While preliminary design work is essential to refine cost estimates, the results of this study provide a reasonable initial estimate for up-front capital and ongoing O&M costs required for successful deployment of identified alternatives.
Table 19 shows the unit costs assumed for the deployments analyzed for the Bay Region. These are based primarily on procurements in Michigan but supplemented with information from the IDAS database. This includes both capital items, which were amortized based on the number of years and a 3% interest rate and operations and maintenance costs.

1/31/2008 Bay Region 45 Final Regional ITS Deployment Plan
Table 19 - Unit Costs
Units Years (1) Description Unit Price Ea 10 ITS Cabinet (Ground Mounted) $15,000.00 Ea 10 Microwave Vehicle Detection System (MVDS) $25,000.00 Ea 5 Midblock Detector $15,000.00 Ea 10 CCTV Camera $45,000.00 Ea 10 CCTV Camera with MVDS $55,000.00 Ea 20 Dynamic Message Sign (DMS) $180,000.00 Yr Annual Communications for DMS $500.00 Mi 30 Fiber Optic Backbone $175,000.00 Ea 30 Wireless Communications Link - Unlicensed (5 miles or less) $12,000.00 Ea 30 Wireless Communications Link - Licensed Backhaul $150,000.00 Ea 30 Wireless Communications Tower (200') $250,000.00 Ea 30 Retrofitted 800MHz Radio Tower $50,000.00 Ea 20 Highway Advisory Radio Site $50,000.00 Ea 10 Highway Advisory Sign w/ Flashing Beacon $14,000.00 LS 10 Highway Advisory System Software $74,000.00 LS 10 Highway Advisory Radio Central Equipment $5,000.00 LS 10 Highway Advisory Software Integration $50,000.00 LS 10 ATMS Software Set-up $25,000.00 Ea 10 Refurbish Existing Network Surveillance Systems $150,000.00 Ea 25 Basic Drawbridge Management System $550,000.00 Ea 25 Advanced Drawbridge Management System $1,450,000.00 Ea 20 Local Parking Management System $825,000.00 Ea Annual Operation of Parking Management System $125,000.00 LS Lump sum Maintenance of Traffic (less than 7 signals) $11,000.00 LS Lump sum Maintenance of Traffic (7 or more signals) $16,000.00 Ea 15 Wireless Interconnect for Master Intersection $11,000.00 Ea 15 Wireless Interconnect for Slave Intersection $5,000.00 Ea 15 Replacement of Signal Controller $5,000.00 Ea Annual Full Time Freeway Service Patrol Driver $62,400.00 Ea Annual Full Time Freeway Service Patrol Supervisor $83,200.00 Ea 5 Freeway Service Patrol Vehicle $62,400.00 Ea Annual Weekend Only Freeway Service Patrol Driver $18,000.00 Ea Annual Weekend Only Freeway Service Patrol Supervisor $24,000.00 Ea 10 RWIS Control System $25,000.00 Ea 10 ITS Control System $40,000.00 Ea 15 Reduced Power RWIS ESS $68,000.00 Ea 15 Basic RWIS ESS $78,000.00 Ea 15 Enhanced RWIS ESS $116,500.00 Ea 10 Anti-Icing System $150,000.00 Ea Annual Annual Maintenance and Replacement Costs per RWIS ESS $8,000.00 Ea Annual Annual Training and Operational Costs per RWIS ESS $700.00 Ea Annual Annual Maintenance Costs per Anti-Icing System $6,500.00 Ea Annual Annual Cost of Telephone Connection $500.00 Ea Annual Annual Training and Operational Costs for TMC $500,000.00 Ea Annual Smart Work Zone Mobilization $100,000.00 Ea Annual Monthly rental of equipment $20,000.00 Ea 1 TMC: Level II New facility $500,000.00 Ea 1 TMC: 1/2 of Level II New facility $250,000.00 Ea 5 AVL System for regional transit vehicles $500 Ea 5 System Interface $10,000 Ea 10 Computer Hardware $15,000 Ea 10 System Software $815,000 Ea Annual CCTV maintenance $2,250 Ea Annual DMS maintenance $4,500
(1) This column shows the assumed annual life of each component.
These components were combined in order to form the deployment packages analyzed for the project. The deployment combinations are shown in Table 20

1/31/2008 Bay Region 46 Final Regional ITS Deployment Plan
with the different cost components. Detailed results of the benefit/cost evaluation are shown in Section 4.
Table 20 - Major Components of ITS Deployment Packages
Qty DEPLOYMENT PACKAGES AND EQUIPMENT Freeway Management System
48 Midblock Detector 24 CCTV Camera 7 Dynamic Message Sign (DMS) 7 Communications for DMS 24 Annual CCTV maintenance 7 Annual DMS maintenance 9 Wireless Communications Link - Licensed Backhaul 30 Wireless Communications Tower (200') 1 ATMS Software Set-up
0.5 Annual Training and Operational Costs for TMC 1 TMC: Level I Modify existing facility (may be expansion of MITSC)
Drawbridge Management System – Downtown Bay City 1 Advanced Drawbridge Management System 1 Operation of Advanced Drawbridge Management System
Traffic Signal Improvements 32 ITS Cabinet (Ground Mounted) 1 Maintenance of Traffic (less than 7 signals) 3 Maintenance of Traffic (7 or more signals) 4 Wireless Interconnect for Master Intersection 28 Wireless Interconnect for Slave Intersection 32 Annual Signal Operation Cost
Smart Work Zones 7 Smart Work Zone Mobilization 42 Monthly rental of equipment
Freeway Service Patrols 6 Freeway Service Patrol Vehicle 6 Weekend Only Freeway Service Patrol Driver 1 Weekend Only Freeway Service Patrol Supervisor
Roadway Weather Information System 1 RWIS Control System 5 Reduced Power RWIS ESS 10 Basic RWIS ESS 4 Enhanced RWIS ESS 1 Enhanced RWIS ESS for flood warning with DMS 20 Annual Maintenance and Replacement Costs per RWIS ESS 20 Annual Training and Operational Costs per RWIS ESS 4 Small DMS for Flood Warning 20 Annual Cost of Telephone Connection 65 AVL Units 1 AVL Hardware 1 AVL Software 65 Operating cost per unit 13 800 MHz Radios

1/31/2008 Bay Region 47 Final Regional ITS Deployment Plan
Once alternatives are evaluated in IDAS, the software produces several cost-related outputs that are valuable in refining the alternatives and developing an implementation plan:
Inventory of ITS equipment needed to deploy the identified alternatives;
Identification of potential cost-sharing opportunities where ITS equipment may be shared between two different deployments.
Summary of the capital and ongoing O&M costs of the planned ITS improvements for the public and private sectors;
Forecast of the life-cycle stream of costs for the improvement on a year-by-year basis; and
Estimate of the average annual cost for each individual improvement and for all improvements.
The inventory of equipment needed will be produced by the IDAS software for each improvement specified by the model user. Figure 12 shows a sample inventory of some of the equipment necessary to deploy an incident detection system. This inventory is based on ITS equipment packages required in the ITS National Architecture to deploy the various improvements; use of the same ITS equipment as in the National ITS Architecture guarantees compatibility of the plan with the Architecture. After initial review of the inventory developed by IDAS and the costs incurred in the development of the existing ITS system, packages and deployments were modified.
Figure 12 - IDAS – ITS Deployment Equipment Details
Based on the agreed-upon list of ITS equipment for the preferred alternative(s), a detailed breakout of the life-cycle costs was estimated using IDAS and presented in the IDAS reports as year-by-year breakouts of anticipated costs. This stream of costs includes the up-front capital costs necessary for deployment, the equipment

1/31/2008 Bay Region 48 Final Regional ITS Deployment Plan
replacement costs necessary to replace obsolete equipment in later years, and the continuing O&M costs necessary to operate the improvements.
The stream of life-cycle costs for the various improvements is used as the basis of the average annual cost figure in IDAS. This average annual cost figure was used for comparison with the average annual benefits figure calculated by the model to provide a benefit-cost ratio for the alternative.
1/31/2008 Bay Region 49 Final Regional ITS Deployment Plan
3. DEPLOYMENT PLAN
3.1 Deployment Plan Projects
Developing the initial list of projects to study within the Deployment Plan began, as noted earlier, with the Architecture itself. Based on the input from the Bay Region and its stakeholders, a number of ITS services and associated Market Packages were identified. Translating those services and Market Packages into projects is the first step of the deployment plan. This translation was done initially at a functional level by the Study Team and that initial list is presented in Table 21 below. This table contains the following elements:
The Architecture category the project falls under; A brief project description; A relative cost estimate for that type of project; Some of the benefits of that project; Relevant Market Package from the Architecture; and The Market Package’s Regional priority.
This initial list however, is only the first step in developing projects to study in the Deployment Plan. The next step involved a screening process which would eliminate projects that were not appropriate for the scope of the Deployment Plan. The screening process would also, through stakeholder input, develop detailed projects which could then be analyzed and ranked against each other.

1/31/2008 Bay Region 50 Final Regional ITS Deployment Plan
Table 21 - Initial List of Deployment Plan Projects
Market Package Regional Priority Category Project Cost Benefit Parameters Relevant Market Package HIGH Maintenance and
Construction Management
RWIS System
$$ − Weather-related crashes
− Winter maintenance costs
− Some linked to DMS for spot problems
− Cameras assumed at all locations
MC03 – Road Weather Data Collection
MC04 – Weather Information Processing and Distribution
HIGH ATMS Network Surveillance $$ − Reduced incident response time
− Reduced incident-related delays
− Reduced secondary crashes
ATMS01 – Network Surveillance
MEDIUM ATMS Drawbridge Management System
$$
Per − Reduced delays
− Improved travel time reliability
ATMS20 – Drawbridge Management
MEDIUM ATMS Real-Time Speed Detection and Monitoring
$ − Reduced crashes from more effective speed reduction
− Reduced operating costs for data collection
ATMS19 – Speed Monitoring
LOW Emergency Management
Roadway Service Patrols on Major Corridors
$$ − Faster incident response times
− Reduced secondary crashes
− Reduced fatalities due to faster response
− Reduced delays
EM04 – Roadway Service Patrols
MEDIUM Maintenance and Construction Management
Anti-Icing Installations Connected to RWIS
$$ − Reduced crash rate
− Reduced incident-related delays
− Reduced operating cost
MC05 – Roadway Automated Treatment
MEDIUM Traveler Information Web Site Information
$$$ − Reduced delays
− Improved travel time reliability
ATIS2 – Interactive Traveler Information
MEDIUM Traveler Information 511
$$$ − Reduced delays
− Improved travel time reliability
ATIS2 – Interactive Traveler Information

1/31/2008 Bay Region 51 Final Regional ITS Deployment Plan
Table 21 - Initial List of Deployment Plan Projects
Market Package Regional Priority Category Project Cost Benefit Parameters Relevant Market Package N/A ATMS and
Construction and Maintenance
Roadway Closure Management System and
$ − Reduced frequency of roadway closures
− Reduced accidents related to closures
− Reduced delay related to closures
ATIS1 – Broadcast Traveler Information
HIGH Maintenance and Construction Management
Smart Work Zone and Work Zone Management Systems
$$ − Work zone location and duration
− Reduced work zone related delays
− Reduced work zone-related crashes
MC09 – Work Zone Safety Monitoring
HIGH Construction and Maintenance
Maintenance Tracking using GPS for Maintenance Vehicles and Snowplows
$$$ − Reduced response time for maintenance crews
− Reduced winter maintenance costs
− Reduced Weather-related crashes
MC01 – Maintenance and Construction Vehicle and Equipment Tracking
HIGH Emergency Management
Emergency Signal Preemption
$
per − Number of locations
− Approximate traffic volumes
EM02 – Emergency Routing
HIGH Advanced Transit Management System
AVL systems $$$ − Increased ridership
− Reduced schedule delays
− Reduction in operating cost per hour/unanticipated overtime costs
APTS – Transit Vehicle Tracking
HIGH Commercial Vehicle Operations (non-MDOT)
Weigh-in-Motion Stations $
per − Reduced enforcement cost CVO06 – Weigh-in-Motion
HIGH Emergency Management
Vehicle Tracking for MSP, Local Public Safety, and Maintenance Vehicles
$$$ − Reduced incident response times
− Reduced operating costs
EM02 – Emergency Routing
HIGH Emergency Management
Common Radios $$$ - Reduced incident response times
- Reduced incident related traffic delays
- Reduced operating cost (from more efficient deployment of resources)
EM01 – Emergency Call-Taking and Dispatch

1/31/2008 Bay Region 52 Final Regional ITS Deployment Plan
Table 21 - Initial List of Deployment Plan Projects
Market Package Regional Priority Category Project Cost Benefit Parameters Relevant Market Package HIGH ATMS Sharing of CCTV Video
Feeds $$$ − Reduced incident response times
− Reduced incident related traffic delays
− Reduced operating cost (from more efficient deployment of resources)
ATMS06 – Traffic Information Dissemination
HIGH Advanced Transit Management System
CCTV and Panic Buttons for Security
$$ − Possible ridership increase APTS5 – Transit Security
MEDIUM Advanced Transit Management System
Electronic Fare Payment $$$ − Reduced fare collection costs
− Possible operating cost reductions due to more efficient operation (faster boarding times)
APTS4 – Transit Passenger and Fare Management
N/A N/A Frost Tube Monitoring System
$ − Improved safety
− Reduced maintenance burden
N/A
N/A Advanced Transit Management System
DMS with Real-Time Buss Schedule Information
$$ − Improve ridership experience APTS8 – Transit Traveler Information
LOW N/A Kiosks with Fare and Traveler Information $$ − Improve ridership experience ATIS1 – Traveler Information
Low ATMS Local Parking System Management
$$ − Increased parking revenue and operating costs
− Reduction in excess VMT due to circulating traffic
ATMS16 – Parking Facility Management
MEDIUM Emergency Management
Evacuation and Disaster Traveler Information System
$$ − Improved information and management of large scale evacuations
EM02 – Emergency Routing

1/31/2008 Bay Region 53 Final Regional ITS Deployment Plan
3.2 Screening Process
The projects that were initially derived from the Regional Architecture and presented in Table 21 represent all of the potential projects that are discussed in the Architecture. Some of these projects are not appropriate for the scope of the Deployment Plan, so a screening process was developed to narrow the focus of the types of projects as well as develop regionally specific projects. This screening process is the subject of this section.
Thirty-four projects were initially derived from the Architecture. Of these projects, five were eliminated from consideration from this plan for either lacking viable benefits data, being redundant, or overlapping other project functions. The projects eliminated were:
Tracking CV Contents, CV Central Permitting Systems, Roadside Equipment for Automated Highway System, Intersection Collision Avoidance Systems, and Data Archive for Traffic, Incident, and Weather Data.
In order to develop regionally specific projects with project limits and specific deployments, the 25 remaining projects were then grouped into eleven project packets. These project packets were based on real-world deployment functionality and designed to illustrate how these individual projects would be deployed together in order to achieve the desired benefits. For example, DMS signs would typically not be deployed to provide traveler information without detection or CCTV cameras, which would ensure the traveler information is accurate and timely. The final list of these project packets is presented in Table 22. The table includes primary as well as secondary deployments. The secondary deployments were meant to represent project components that would not necessarily be needed to achieve the packets base functionality, but could be added to augment and improve its functionality.
The initial list of 25 projects as well as the eleven project packets were presented to the Bay Region stakeholders in a Deployment Plan Workshop held on August 3, 2007. At this meeting, the stakeholders were asked for their input in ranking the project packets. A pair-wise comparison exercise was utilized to solicit their opinions and the results are presented in Table 22 in order of their priority.
The stakeholders were also broken out into three break-out groups around three key functional areas:
Weather and Maintenance Commercial Vehicle Operations and Transit Traffic Incident Management and Freeway Management
During these break-out sessions, stakeholders worked with the Study Team and developed regionally specific projects; including project limits as well as locations of key field devices. This effort resulted in the final list of projects which would be used in the deployment plan analysis outlined above. These projects are presented in Section 3.3.

1/31/2008 Bay Region 54 Final Regional ITS Deployment Plan
Table 22 - Deployment Plan Project Packets
Project Packet Project Traffic Management Packet Network Surveillance
Real-Time Speed Detection and Monitoring
Roadway Service Patrols on Major Corridors
Emergency Signal Preemption
Common Radios
Sharing of CCTV Video Feeds
Roadway Closure Management System
Evacuation and Disaster Traveler Information System
RWIS Packet RWIS
Surveillance (CCTV)
Frost Tubes
Anti-Icing Installations Connected to RWIS
Work Zone/Construction Packet Roadway Closure Management System
Smart Work Zone and Work Zone Management Systems
Winter Maintenance Vehicles Packet Maintenance Tracking using GPS for Maintenance Vehicles and Snowplows
Anti-Icing Installations Connected to RWIS
Common Radios
Vehicle Tracking for MSP, Local Public Safety, and Maintenance Vehicles
Bridge Packet Drawbridge Management System
Arterial Packet Emergency Signal Preemption
Traveler Information Packet 511
Web Site Information
Transit Packet AVL
CCTV and Panic Buttons for Security
Electronic Fare Payment
Kiosks with Fare and Traveler Information
DMS with Real-Time Bus Schedule
Maintenance Vehicles Packet Vehicle Tracking for MSP, Local Public Safety, and Maintenance Vehicles
Common Radios
WIM Packet Weigh-in-Motion Stations
Parking Local Parking System Management
3.3 Final List of Projects for Analysis
The final list of projects presented in Table 23 was developed by the stakeholders during the Deployment Plan Workshop. These are the projects which will be analyzed with the IDAS model for the Bay Region Deployment Plan and ultimately combined into a statewide ITS Investment Plan. Table 23 provides short descriptions of each project; denotes each project with a unique

1/31/2008 Bay Region 55 Final Regional ITS Deployment Plan
project identifier so it can be easily referenced; and identifies whether the project occurs on a Corridor of significance or has any anticipated economic development impact.
Table 23 - Final List of Bay Region Deployment Plan Projects
Project # Name Description
Corridor of Significance
(y/n)
Economic Development Impact (y/n)
BRITS – 001 I-75 surveillance and detection project
9 CCTV on I-75 corridor.
BRITS – 002 US-127 surveillance and detection project
One DMS located north of Clare, 5 CCTV in corridor
BRITS – 003 CCTV project at M 13 at Pinconning (north of Bay City).
CCTV project at M 13 at Pinconning (north of Bay City).
BRITS – 004 Common radio project Common radios (assume MDOT purchases one radio per county)
BRITS – 005 Common radio II (assume MDOT equips 5 vehicles per county with AVL)
BRITS – 006 RWIS (25) RWIS deployment as outlined in MDOT plan
BRITS – 007 CCTV project at M 10 in downtown Midland.
2 CCTV cameras at either end of US-10, BR-10 loop
BRITS – 008 Flood detection system I-75 in downtown Saginaw. (assume stand alone (road flooded when beacons flashing with communications back to TMC of the condition))
BRITS – 009 I-75 surveillance and detection project from Flint to Saginaw
10 CCTV and detection along I-75, Possible addition of up to six DMS in the future
BRITS – 010 Drawbridge system at Bay City on M-25 and other drawbridges
(4) CCTV and (3) DMS and communications
BRITS – 011 Freeway Service Patrols Peak season weekends and holidays along I-75, I-475, I-675, I-69, US-127 and US-10 between I-75 and US-127
BRITS – 012 AVL Install AVL on fixed route buses in Flint, Saginaw, Bay City and Midland.
BRITS – 013 Smart Work Zone Deployment
Deploy smart work zones on trunklines with lane or shoulder closures due to construction
BRITS – 014 Traffic Signal System Improvements
Corridor signal improvements in Mt. Pleasant, Midland, Saginaw and Bay City
BRITS – 015* MTA Deployments Advanced Traveler Information through a web site and Kiosks
BRITS – 016* MTA Deployments Maintenance Software and On-board diagnostics
BRITS – 017* MTA Deployments Automated Fare Collection BRITS – 018* MTA Deployments Back-up Emergency Center BRITS – 019* MTA Deployments Collision Avoidance
Technology
*Projects Taken from the MTA ITS Implementation Plan, June 2005

1/31/2008 Bay Region 56 Final Regional ITS Deployment Plan
4. ANALYSIS OF BAY REGION ITS ALTERNATIVES
4.1 Project Categorization
A total of fifteen ITS deployments in the Bay Region were identified for further analysis in Table 23. For purposes of evaluating benefits and costs, these projects must be combined into implementation packages that form a logical system. CCTV cameras, for example, are considered part of a Traffic Management System but do not inherently provide benefits. There must be staff in place to watch them, interpret what they see and disseminate information to those who can make use of it. Users may include incident responders, transportation agency personnel or the general public. Accurate representation of benefits and costs requires that various elements be modeled together as a system. The deletion of one key element may reduce or eliminate the benefits, but that element in and of itself, may not produce benefits.
There are also a number of deployments that support multiple functions and projects. For example, the RWIS system supports both traffic management and winter maintenance. As a result the 800 MHz radios and maintenance vehicle AVL systems designed to support maintenance activities are included in this category. The operation of the IDAS model was documented in Section 2, along with the benefit parameters and cost assumptions. The benefit summaries below have been developed for the Bay Region and modeled by category.
It should also be noted that in the initial runs, entire systems were combined across the region. Based on review of the plan by stakeholders, these runs may be modified to test the addition or removal of specific deployments. Table 24 shows the how the deployments have been grouped for IDAS analysis.

1/31/2008 Bay Region 57 Final Regional ITS Deployment Plan
Table 24 - Grouping of Projects for IDAS Modeling
Project # Name Description Comments Traffic and Freeway Management Systems BRITS – 001 I-75 surveillance and
detection project 9 CCTV on I-75 corridor.
BRITS – 002 US-127 surveillance and detection project
One DMS located north of Clare, 5 CCTV in corridor
BRITS – 003 CCTV project at M 13 at Pinconning (north of Bay City).
CCTV project at M 13 at Pinconning (north of Bay City).
BRITS – 007 Midland CCTV project 2 CCTV cameras at either end of US-10, BR-10 loop
BRITS – 009 I-75 surveillance and detection project from Flint to Saginaw
10 CCTV and detection along I-75 Part of system in process of deployment including 3 DMS
Freeway Service Patrols BRITS – 011* Freeway Service
Patrols Peak season weekends and holidays along I-75, I-475, I-675, I-69, US-127 and US-10 between I-75 and US-127
Operating Center is unknown at this time.
Road Weather Information Systems and Related Improvements BRITS – 006* RWIS (25) RWIS deployment as outlined in
MDOT plan
BRITS – 004* Common radio project
Common radios (assume MDOT purchases one radio per county)
BRITS – 005* Common radio II (assume MDOT equips 5 vehicles per county with AVL)
BRITS – 008 Flood detection system
I-75 in downtown Saginaw. (assume stand alone (road flooded when beacons flashing with communications back to TMC of the condition))
Advanced Public Transportation Systems BRITS – 012* AVL Install AVL on fixed route buses in
Flint, Saginaw, Bay City and Midland. AVL/CAD already in place for Flint paratransit vehicles
BRITS – 015* MTA Deployments Advanced Traveler Information through a web site and Kiosks
BRITS – 016* MTA Deployments Maintenance Software and On-board diagnostics
BRITS – 017* MTA Deployments Automated Fare Collection BRITS – 018* MTA Deployments Back-up Emergency Center BRITS – 019* MTA Deployments Collision Avoidance Technology Smart Work Zones BRITS – 013 Smart Work Zone
Deployment Deploy smart work zones on trunklines with lane or shoulder closures due to construction
2007 construction season activities used to estimate benefits
Traffic Signal Improvements BRITS – 014 Traffic Signal System
Improvements Corridor signal improvements in Mt. Pleasant, Midland, Saginaw and Bay City
Drawbridge Management System BRITS – 010 Drawbridge system at
Bay City on M-25 and other drawbridges
(4) CCTV and (3) DMS and communications
Identify possible delays due to bridge openings and transmit information via DMS
*Denotes projects that are not shown on the Bay Region Deployment Plan Maps.
Figure 13 shows the location of the projects that have a defined geographic component. Projects shown in Table 24 with an “*” are not included on Figure 13 because they are either region wide projects or do not have a specific location determined at this time.

1/31/2008 Bay Region 58 Final Regional ITS Deployment Plan
Figure 13 - ITS Deployment Plan Projects: Bay Region

1/31/2008 Bay Region 59 Final Regional ITS Deployment Plan
Figure 14 - ITS Deployment Plan Projects: Genesee County

1/31/2008 Bay Region 60 Final Regional ITS Deployment Plan
Figure 15 - ITS Deployment Plan Projects: Bay City and Saginaw

1/31/2008 Bay Region 61 Final Regional ITS Deployment Plan
Figure 16 - ITS Deployment Plan Projects: Midland and Mt Pleasant
1/31/2008 Bay Region 62 Final Regional ITS Deployment Plan
Figure 17 - ITS Deployment Plan Projects: Standish and Lapeer
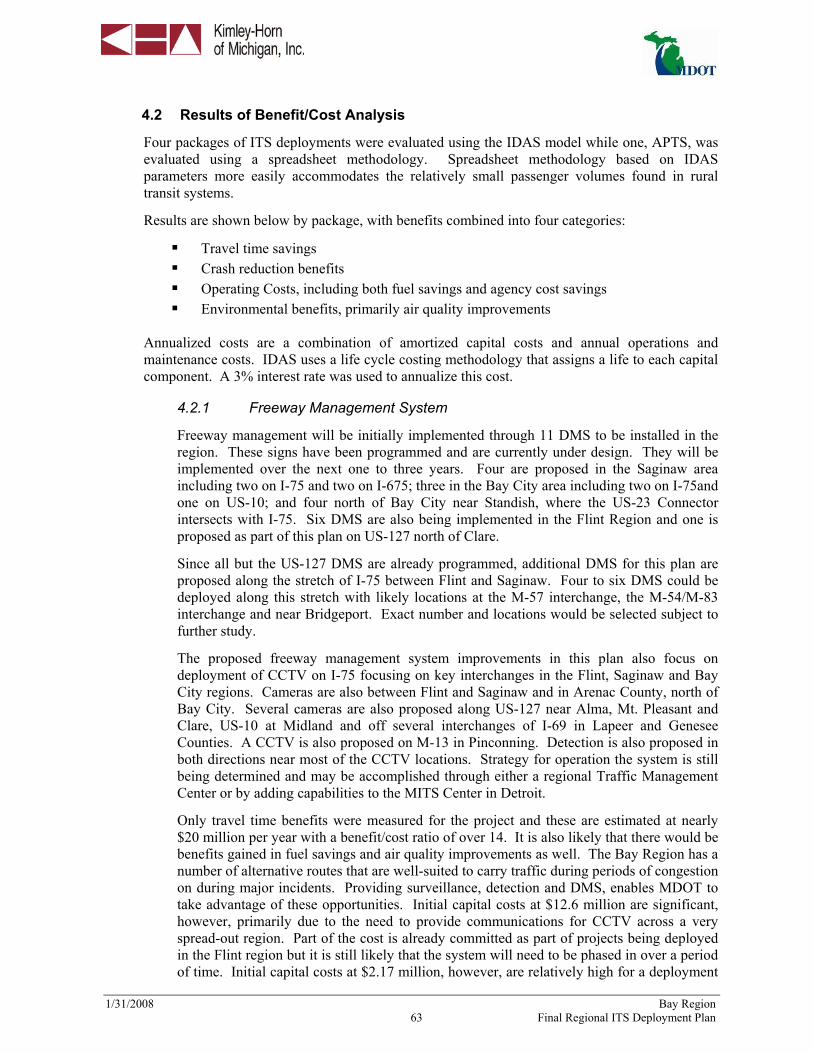
1/31/2008 Bay Region 63 Final Regional ITS Deployment Plan
4.2 Results of Benefit/Cost Analysis
Four packages of ITS deployments were evaluated using the IDAS model while one, APTS, was evaluated using a spreadsheet methodology. Spreadsheet methodology based on IDAS parameters more easily accommodates the relatively small passenger volumes found in rural transit systems.
Results are shown below by package, with benefits combined into four categories:
Travel time savings Crash reduction benefits Operating Costs, including both fuel savings and agency cost savings Environmental benefits, primarily air quality improvements
Annualized costs are a combination of amortized capital costs and annual operations and maintenance costs. IDAS uses a life cycle costing methodology that assigns a life to each capital component. A 3% interest rate was used to annualize this cost.
4.2.1 Freeway Management System
Freeway management will be initially implemented through 11 DMS to be installed in the region. These signs have been programmed and are currently under design. They will be implemented over the next one to three years. Four are proposed in the Saginaw area including two on I-75 and two on I-675; three in the Bay City area including two on I-75and one on US-10; and four north of Bay City near Standish, where the US-23 Connector intersects with I-75. Six DMS are also being implemented in the Flint Region and one is proposed as part of this plan on US-127 north of Clare.
Since all but the US-127 DMS are already programmed, additional DMS for this plan are proposed along the stretch of I-75 between Flint and Saginaw. Four to six DMS could be deployed along this stretch with likely locations at the M-57 interchange, the M-54/M-83 interchange and near Bridgeport. Exact number and locations would be selected subject to further study.
The proposed freeway management system improvements in this plan also focus on deployment of CCTV on I-75 focusing on key interchanges in the Flint, Saginaw and Bay City regions. Cameras are also between Flint and Saginaw and in Arenac County, north of Bay City. Several cameras are also proposed along US-127 near Alma, Mt. Pleasant and Clare, US-10 at Midland and off several interchanges of I-69 in Lapeer and Genesee Counties. A CCTV is also proposed on M-13 in Pinconning. Detection is also proposed in both directions near most of the CCTV locations. Strategy for operation the system is still being determined and may be accomplished through either a regional Traffic Management Center or by adding capabilities to the MITS Center in Detroit.
Only travel time benefits were measured for the project and these are estimated at nearly $20 million per year with a benefit/cost ratio of over 14. It is also likely that there would be benefits gained in fuel savings and air quality improvements as well. The Bay Region has a number of alternative routes that are well-suited to carry traffic during periods of congestion on during major incidents. Providing surveillance, detection and DMS, enables MDOT to take advantage of these opportunities. Initial capital costs at $12.6 million are significant, however, primarily due to the need to provide communications for CCTV across a very spread-out region. Part of the cost is already committed as part of projects being deployed in the Flint region but it is still likely that the system will need to be phased in over a period of time. Initial capital costs at $2.17 million, however, are relatively high for a deployment

1/31/2008 Bay Region 64 Final Regional ITS Deployment Plan
that serves a single location Table 25 summarizes the overall annual cost savings associated with the Bay Region Freeway Management system.
Table 25 - Bay Region Freeway Management System Cost Savings
Benefits and Costs Monetary Values Travel Time Savings $19,990,866 Crash Reduction $0 Operating Costs $0 Emissions $0
Total Annual Benefits $19,990,866 Annualized Cost $1,392,199 Net Benefits $18,598,667 Benefit/Cost Ratio 14.36 Capital Cost $12,605,000 Annual O&M cost $350,000
4.2.2 Freeway Service Patrols
Freeway Service Patrols (FSP) were identified as an alternative to help clear incidents during peak periods with operation primarily during peak recreational weekends. FSP’s were proposed on major freeway routes through the region including I-75, US-127, I-69 and US-10. FSP’s would only be in place during peak weekends in the summer, fall and possibly winter. Forty-two days of operation were assumed. The FSP’s have a positive level of net benefits and a benefit/cost ratio of about 4.5. Benefits are concentrated primarily in fuel cost savings with some benefit in crash reduction and travel time savings. Capital and operating costs are relatively modest. It was noted during the stakeholder process that Michigan State Police increases the frequency of their patrols these roads during peak recreational periods. This analysis does not account for the fact that the FSP’s may be redundant to that service thus lowering the benefit/cost ratio. It should be noted that FSP would take advantage of the large investment in CCTV cameras and detection equipment shown under the Freeway Management System. Table 26 summarizes the overall annual cost savings associated with Freeway Service Patrols.
Table 26 - Freeway Service Patrol Cost Savings
Benefits and Costs Monetary Values Travel Time Savings $250,338 Crash Reduction $193,619 Operating Costs $667,441 Emissions $0 Total Annual Benefits $1,111,398 Annualized Cost $249,384 Net Benefits $862,014 Benefit/Cost Ratio 4.46 Capital Cost $405,600 Annual O&M cost $139,657
(1) DMS, CCTV, Detection, TMC

1/31/2008 Bay Region 65 Final Regional ITS Deployment Plan
4.2.3 Roadway Weather Information Systems (RWIS)
The proposed RWIS would include 20 Environmental Sensor Stations (ESS) to be installed around the region. One would be expanded to include a flood warning system on I-75 in Saginaw. Exact locations will ultimately be determined by a study to be conducted in the future. For purposes of the Deployment Plan, ESS installations were spread across the region, focusing on major trunkline roads. Initially, benefits were calculated only for the days when snow exceeds one inch. Using an average of NWS data from several cities in the region, this figure is estimated at 15 days per year. An additional 20% was added for days where snow is less than one inch. RWIS will also be helpful during periods of heavy rain and fog, and may have some benefits for summer as well as winter maintenance. RWIS is also an important supporting deployment for the proposed Traffic Management System. Net benefits are approximately $2.9 million while the benefit/cost ratio is just under 7. Benefits are primarily from crash reduction and travel time savings with some additional savings from reduced winter maintenance cost. Capital cost of the proposed system is just over $2 million. Annual snowfalls are less in the Bay Region than in the North and Superior Regions, which have more days of heavy snowfall. This results in a lower savings in operating costs. Table 27 summarizes the overall annual cost savings associated with RWIS deployment.
Table 27 - Road Weather Information System (RWIS) Cost Savings
Benefits and Costs Monetary Values Travel Time Savings $2,289,695 Crash Reduction $968,513 Operating Costs $94,442 Emissions $0 Total Annual Benefits $3,352,651 Annualized Cost $482,404 Net Benefits $2,870,247 Benefit/Cost Ratio 6.95 Capital Cost $2,060,000 Annual O&M cost $256,000
4.2.4 Advanced Public Transportation Systems
Table 28 summarizes the overall annual cost savings associated with APTS. Stakeholders indicated that the larger transit authorities in the region, Flint, Bay Metro (Bay City), Midland City and Saginaw, could achieve operating costs through implementation of AVL systems. These four systems carry roughly 6.6 million out of a total of 7.8 million annual passengers in the region. Flint has already equipped its paratransit vehicles with AVL technology and is planning to extend this service its fixed route vehicles pending available funding. Real-time tracking of these vehicles could help to improve the efficiency of real-time operation and provide an archive of data that could be used to adjust schedules and routes. A need was also identified for CCTV on certain bus routes to improve security. There is not adequate data to support a benefit/cost analysis for this deployment so only the AVL deployment is analyzed.
The benefit/cost ratio of the proposed AVL deployment is just under three with net benefits of approximately $665,000. Cost of implementation is estimated at approximately $1 million. All benefits are categorized as operating cost savings, although in reality there may be a mix of both operating cost savings and travel time savings.

1/31/2008 Bay Region 66 Final Regional ITS Deployment Plan
Table 28 - Advanced Public Transportation Systems Cost Savings
Benefits and Costs Monetary Values Travel Time Savings $0 Crash Reduction $0 Operating Costs $1,010,000 Emissions $0 Total Annual Benefits $1,010,000 Annualized Cost $345,000 Net Benefits $665,000 Benefit/Cost Ratio 2.93 Capital Cost $1,030,000 Annual O&M cost $205,000
4.2.5 Smart Work Zones
Smart Work Zones use ITS technology to monitor work zones and approaches. CCTV cameras, detectors, and DMS are part of these systems, which are often offered by vendors as packages. Information from the Smart Work Zone can be sent to TMCs and websites for broader dissemination. Motorists may save time by taking an alternate route to avoid the work zone. They may also change their departure time or make a stop if there is a backup in a work zone. The Freeway Management System will support the Smart Work Zone program by allowing information to be disseminated to a wider audience. Work zone activity has a major impact on Bay Region since much construction activity takes place during the peak recreational season. While Smart Work Zones are considered part of the regional ITS Plan, they are not proposed to be part of the ITS program itself. Funding should be provided through the relevant construction contracts and the work zone equipment supplied by the construction contractor. Contract requirements should provide for the information to be made available to the TMC on a real-time basis.
Smart work zones were analyzed by modeling all 2007 MDOT Bay Region construction projects that involved either lane or shoulder closures on trunkline routes. These projects are shown in Figure 18. Reduced capacities were calculated and run through the IDAS model. Time savings came from two sources, more efficient flow of traffic through the work zone and use of faster alternative routes to avoid areas where capacity was reduced. The travel time savings were significant but were somewhat offset by increases in crash-related costs and fuel costs. This negative crash rate impact occurs due to shifting of traffic from higher functional class to lower functional class roadways which have higher crash rates per vehicle mile. Use of these roads may also result in a slightly higher rate of fuel consumption. A small environmental benefit is achieved. Overall, both net benefits and the benefit/cost ratio are very high. It is important to note these benefits are measured against the delays that would occur with construction activity without smart work zones. They do not entirely offset the impacts of the work zones. For this project, it was assumed that equipment would not be provided by MDOT but would be provided by contractors through construction contracts. As a result these were categorized entirely as operations and maintenance cost rather than capital. Table 29 summarizes the overall costs savings associated with the Smart Work Zone deployments.

1/31/2008 Bay Region 67 Final Regional ITS Deployment Plan
Figure 18 - Scheduled Work Zones 2008 – 2011

1/31/2008 Bay Region 68 Final Regional ITS Deployment Plan
Table 29 - Smart Work Zone Cost Savings
Benefits and Costs Monetary Values Travel Time Savings $26,129,878 Crash Reduction ($2,536,999)Operating Costs ($540,293)Emissions $244,690
Total Annual Benefits $23,297,275 Annualized Cost $1,857,636 Net Benefits $21,439,639 Benefit/Cost Ratio 12.54Capital Cost# $0 Annual O&M cost $1,857,636
# It is assumed that all equipment will be leased
4.2.6 Traffic Signal Improvements
A need for traffic signal upgrades was identified along several major arterials in the region including BR-127 in Mt. Pleasant, M46 in Saginaw, M25 in Bay City and Midland and M-13 in Bay City. Most of these corridors include multiple signals and significant commercial development. Approximately 32 intersections were identified for improvement. Although there are positive benefits in all categories they do not exceed the annualized cost of the improvements. It is important to note, however, that replacement of old equipment may be required out of necessity. Table 30 summarizes the benefits and costs from proposed traffic signal improvement projects.
Table 30 - Traffic Signal Improvement Cost Savings
Benefits and Costs Monetary Values Travel Time Savings $37,939 Crash Reduction $4,153 Operating Costs $50,377 Emissions $44,753
Total Annual Benefits $137,222 Annualized Cost $162,552 Net Benefits ($25,330) Benefit/Cost Ratio 0.84 Capital Cost $723,000 Annual O&M cost $64,000
4.2.7 Drawbridge Management System
A drawbridge management system has been proposed for downtown Bay City to provide traffic updates on the openings at four drawbridges located in downtown Bay City; Truman Parkway, Vermont Avenue/Liberty Bridge, M-25 and M-84. A map of the system is shown in Figure 15. Detection and CCTV would be provided to monitor traffic conditions during openings and provide motorists with alternate paths when available. Eight DMS would be placed at key decision points prior to bridge approaches to inform motorists of conditions.

1/31/2008 Bay Region 69 Final Regional ITS Deployment Plan
It is estimated that the system will provide approximately $1,500,000 in net benefits with a benefit/cost ratio of 3. The density of DMS will enable the system to be used a traffic management system for Bay City and surrounding townships. The capital cost is high relative to some of the other proposed deployments, at $2.5 million.
Table 31 - Drawbridge Management System Cost Savings
Benefits and Costs Monetary Values Travel Time Savings $1,531,995 Crash Reduction $0 Operating Costs $0 Emissions $0
Total Annual Benefits $1,531,995 Annualized Cost $477,685 Net Benefits $1,054,310 Benefit/Cost Ratio 3.21 Capital Cost $2,530,000 Annual O&M cost $203,000

1/31/2008 Bay Region 70 Final Regional ITS Deployment Plan
Figure 19 - Drawbridge Management System Physical Architecture

1/31/2008 Bay Region 71 Final Regional ITS Deployment Plan
4.3 Summary of Results
Table 32 through Table 37 show the comparison of benefits and costs between different ITS packages. It is important to note that these results represent only one portion of the criteria that will be used by MDOT to select projects for implementation. Other considerations include eligibility of various funding sources; compatibility with the priorities of MDOT’s ITS program as well the agency’s overall program priorities; ability to incorporate in major construction projects; and compatibility with other regions’ investment strategies. The benefit and cost data, however, provide useful guidance into which investments provide the best return.
Table 32 - Deployment Packages – Total Benefits
Deployment Package Total Benefits Smart Work Zones $23,297,275 Freeway/Traffic Management Systems $19,990,866 Road Weather Information Systems $3,352,651 Drawbridge Management Systems $1,531,995 Freeway Service Patrols $1,111,398 Advanced Public Transportation Systems $1,010,000 Traffic Signal Improvements $137,222 TOTAL $50,431,406
Table 33 - Deployment Packages – Net Benefits
Deployment Package Net Benefits Smart Work Zones $21,439,639 Freeway/Traffic Management Systems $18,598,667 Road Weather Information Systems $2,870,247 Drawbridge Management Systems $1,054,310 Freeway Service Patrols $862,014 Advanced Public Transportation Systems $665,000 Traffic Signal Improvements ($25,330) TOTAL $45,464,547
Table 34 - Annualized Cost
Deployment Package Annualized Cost Smart Work Zones $1,857,636 Freeway/Traffic Management Systems $1,392,199 Road Weather Information Systems $482,204 Drawbridge Management Systems $477,685 Advanced Public Transportation Systems $345,000 Freeway Service Patrols $249,384 Traffic Signal Improvements $162,552 TOTAL $4,966,660

1/31/2008 Bay Region 72 Final Regional ITS Deployment Plan
Table 35 - Benefit/Cost Ratios
Deployment Package Benefit/Cost
Ratios Freeway/Traffic Management Systems 14.36 Smart Work Zones 12.54 Road Weather Information Systems 6.95 Freeway Service Patrols 4.46 Drawbridge Management Systems 3.21 Advanced Public Transportation Systems 2.93 Traffic Signal Improvements 0.84 TOTAL
Table 36 - Total Capital Costs
Deployment Package Capital Costs Freeway/Traffic Management Systems $12,605,000 Drawbridge Management Systems $2,530,000 Road Weather Information Systems $2,060,000 Advanced Public Transportation Systems $1,030,000 Traffic Signal Improvements $723,000 Freeway Service Patrols $405,600 Smart Work Zones * $0 TOTAL $19,353,600
* O&M incorporated into Traffic Management System
Table 37 - Annual Operations and Maintenance Costs
Deployment Package O&M Costs Smart Work Zones * $1,857,636 Freeway/Traffic Management Systems $350,000 Road Weather Information Systems $256,000 Advanced Public Transportation Systems $205,000 Drawbridge Management Systems $203,000 Freeway Service Patrols $139,657 Traffic Signal Improvements $64,000 TOTAL $3,075,293
* O&M incorporated into Traffic Management System
There are several major components to the Bay Region ITS Deployment Plan. The Freeway Management System and Smart Work Zone projects have the highest level of benefits, while RWIS shows significant benefits as well. All of these projects combine to provide an improved ability to manage the system and provide motorists better information with which to make more informed trip departure and routing choices. These projects account for most of the costs, as well as the benefits and they have the best benefit/cost ratios as well. The question of operating responsibility and control is still being addressed in the Bay Region and the final decision will have an impact on capital and operating cost. Most of the other projects, including freeway service patrols, transit system and AVL and traffic signal systems show limited benefits and lower benefit/cost ratios. It should be noted that traffic signals may be in need of upgrade due to

1/31/2008 Bay Region 73 Final Regional ITS Deployment Plan
age, and that if such upgrades are necessary some travel time benefits will result. The drawbridge management system proposed for Bay City shows positive benefits, but within a localized area.
4.4 Project Timeframes
Project priorities will be set by MDOT based on a number of factors, of which benefit/cost analysis is only one. Other criteria include availability of funding, funding eligibility of proposed projects, geographic scope of project benefits and the feasibility of phasing projects into place over time. While benefits may be similar between different projects, some projects may offer more immediate relief to a problem. An assessment of emerging technologies is another key consideration. Certain deployments may show high benefits, but at a substantial capital cost. MDOT, through its work on the VII program and other technology initiatives, is a national leader in looking ahead to emerging technologies. If there is likelihood that a specific technology can be replaced by something more cost-effective during its life cycle, agencies may prefer to forego large investment and instead use a temporary solution that will not preclude the emerging technology.
Based on the analysis conducted for this report and the input from the stakeholders, the following project implementation plan is identified for near-term, medium term, and long term deployments. For the purposes of this assessment, short-term deployments are anticipated to be implemented within 0-3 years; medium term in 4 to 8 years; and long-term deployments are expected to occur in more than 8 years.

1/31/2008 Bay Region 74 Final Regional ITS Deployment Plan
Table 38 - Bay Region Short-Term (0 – 3 Years) ITS Deployment Plan Projects
Short-Term Deployments Components Comments Traffic Management System − Deployment of additional CCTV
and DMS, completing the Flint area system
− Deployment of elements along I-75 in the Saginaw and Bay City areas and near the US-23 Connector.
− Operational responsibility for the TMS needs to be decided in order to expedite these deployments
Smart Work Zones − Adequate capacity to cover all trunkline construction with lane and shoulder closings within 3 years. Initial focus on summer construction on recreational routes
− Project shows very high positive impact in terms of both net benefits and benefit/cost ratio
− Benefits are realized quickly after implementation
Road Weather Information Systems − First phase deployment with roughly 5-10 ESS at high priority locations
− Implement flood warning system in Saginaw as part of early phase deployment
− Distribution of common radios − Initial phase of AVL deployment
on winter maintenance vehicles, probably in larger contract counties
− A study is needed to identify proposed locations for ESS. Since no preliminary work has been done to date, the number proposed may change. A two-phase implementation is assumed here although this will depend on the outcome of the study
− Expanding the 800MHz radio system to winter maintenance vehicles was a priority for stakeholders
Advanced Public Transportation System
− Initiate implementation of AVL on fixed route buses in Flint
− AVL infrastructure exists from paratransit system implementation
− With high level of transit service, information can be used for traffic management purposes

1/31/2008 Bay Region 75 Final Regional ITS Deployment Plan
Table 39 - Bay Region Medium-Term (4 – 8 Years) ITS Deployment Plan Projects
Medium Term Deployments Components Comments Freeway/Traffic Management System
− Completion of all CCTV, detector and DMS deployments in the I-75 corridor including I-75 between Flint and Saginaw.
− Deployment of CCTV and detectors along I-69 outside of Flint region
Drawbridge Management System − Implementation of Traffic Management System at drawbridges in Bay City
− Planning for system should begin during short-term phase with implementation in 4 to 8 year time frame
− Concept of operations is needed to finalize system requirements and understand how system should tie in with regional traffic management systems
Road Weather Information System − Second (final) phase implementation of RWIS with 10-15 ESS implemented
− Timing and specific sites to be determined
− Reassessment of second phase will occur following first phase deployment
Traffic Signal Systems − Projects to be determined by
need for equipment replacement − Since travel time benefits of
proposed traffic signal systems are small, deployment should be based on age and condition of assets
Advanced Public Transportation System
− Evaluate feasibility of AVL system implementation in Saginaw, Midland, and Bay City. Initiate implementation where benefit appears greatest
− Technology advances may improve cost-effectiveness
Freeway Service Patrols − Conduct assessment and if warranted, test concept on I-75 to determine effectiveness

1/31/2008 Bay Region 76 Final Regional ITS Deployment Plan
Table 40 - Bay Region Long-Term (Over 8 Years) ITS Deployment Plan Projects
Long- Term Deployments Components Comments Freeway/Traffic Management System
− Build out of Freeway/Traffic management system, including deployments on US-127 and other deployments off Interstate system
− Identify additional needs generated by growth in southern portion of the region
Traffic Signal Systems − Projects to be determined by need for equipment replacement
− Since travel time benefits of proposed traffic signal systems are small, deployment should be based on age and condition of assets
Advanced Public Transportation System
− Implementation decision for Saginaw, Midland, and Bay City decision to be based on assessment conducted in medium term as well as any implementation occurring during that time.
− Technology advances may improve cost-effectiveness.
Freeway Service Patrols − Consider for implementation depending on traffic conditions and test conducted in medium term