interacting effects of climate change and habitat ...centaur.reading.ac.uk/47799/3/manuscript final...
TRANSCRIPT

Interacting effects of climate change and habitat fragmentation on droughtsensitive butterflies Article
Accepted Version
Oliver, T. H., Marshall, H. H., Morecroft, M. D., Brereton, T., Prudhomme, C. and Huntingford, C. (2015) Interacting effects of climate change and habitat fragmentation on droughtsensitive butterflies. Nature Climate Change, 5 (10). pp. 941945. ISSN 1758678X doi: https://doi.org/10.1038/nclimate2746 Available at http://centaur.reading.ac.uk/47799/
It is advisable to refer to the publisher’s version if you intend to cite from the work. See Guidance on citing .Published version at: http://dx.doi.org/10.1038/nclimate2746
To link to this article DOI: http://dx.doi.org/10.1038/nclimate2746
Publisher: Nature Publishing Group
All outputs in CentAUR are protected by Intellectual Property Rights law, including copyright law. Copyright and IPR is retained by the creators or other copyright holders. Terms and conditions for use of this material are defined in the End User Agreement .
www.reading.ac.uk/centaur

CentAUR
Central Archive at the University of Reading
Reading’s research outputs online

1
Interacting effects of climate change and habitat
fragmentation on drought-sensitive butterflies
Tom H. Oliver1,2*, Harry H. Marshall3, Mike D. Morecroft4, Tom Brereton5, Christel
Prudhomme2, Chris Huntingford2
1 University of Reading, Whiteknights, PO Box 217, Reading, Berkshire RG6 6AH, UK
2 NERC Centre for Ecology and Hydrology, Wallingford, Oxfordshire, OX10 8BB, U.K.
3 University of Exeter, Penryn Campus, Penryn, Cornwall, TR10 9FE
4Natural England, Foundry House,3 Millsands, Riverside Exchange, Sheffield, S3 8NH
5 Butterfly Conservation, Manor Yard, East Lulworth, Wareham, Dorset, BH20 5QP, UK.
* Author for correspondence: Tom H. Oliver, E: [email protected];
2
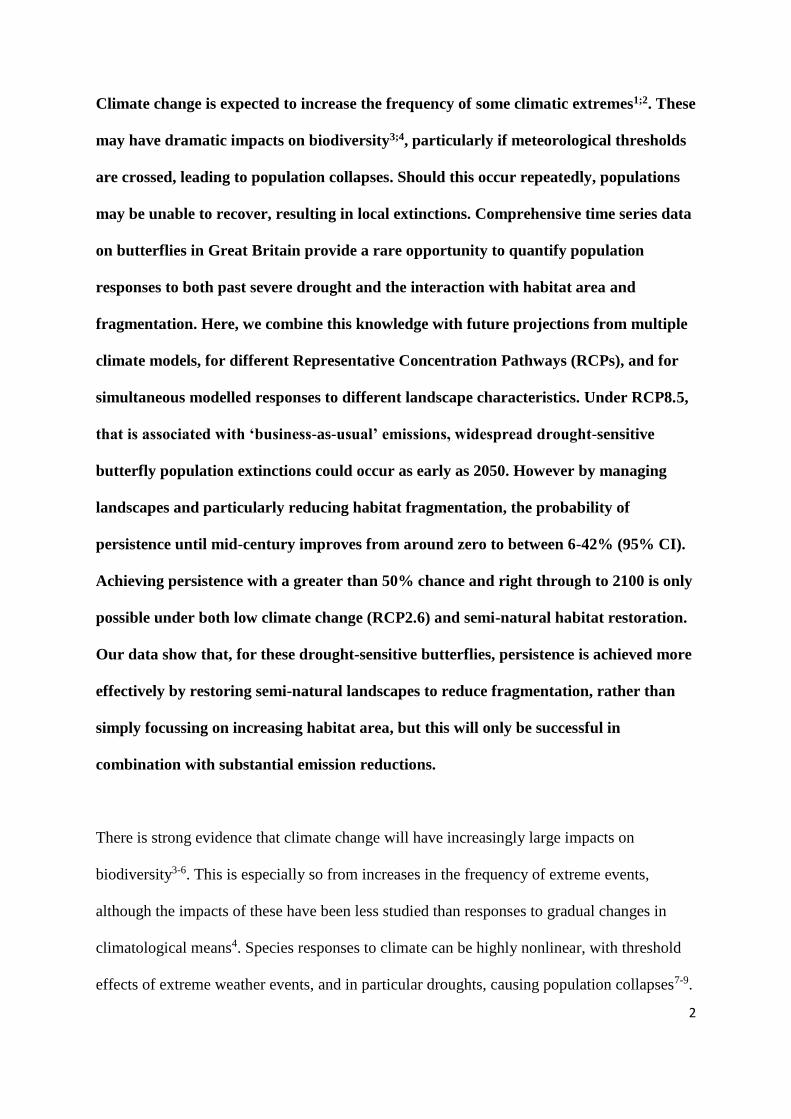
Climate change is expected to increase the frequency of some climatic extremes1;2. These
may have dramatic impacts on biodiversity3;4, particularly if meteorological thresholds
are crossed, leading to population collapses. Should this occur repeatedly, populations
may be unable to recover, resulting in local extinctions. Comprehensive time series data
on butterflies in Great Britain provide a rare opportunity to quantify population
responses to both past severe drought and the interaction with habitat area and
fragmentation. Here, we combine this knowledge with future projections from multiple
climate models, for different Representative Concentration Pathways (RCPs), and for
simultaneous modelled responses to different landscape characteristics. Under RCP8.5,
that is associated with ‘business-as-usual’ emissions, widespread drought-sensitive
butterfly population extinctions could occur as early as 2050. However by managing
landscapes and particularly reducing habitat fragmentation, the probability of
persistence until mid-century improves from around zero to between 6-42% (95% CI).
Achieving persistence with a greater than 50% chance and right through to 2100 is only
possible under both low climate change (RCP2.6) and semi-natural habitat restoration.
Our data show that, for these drought-sensitive butterflies, persistence is achieved more
effectively by restoring semi-natural landscapes to reduce fragmentation, rather than
simply focussing on increasing habitat area, but this will only be successful in
combination with substantial emission reductions.
There is strong evidence that climate change will have increasingly large impacts on
biodiversity3-6. This is especially so from increases in the frequency of extreme events,
although the impacts of these have been less studied than responses to gradual changes in
climatological means4. Species responses to climate can be highly nonlinear, with threshold
effects of extreme weather events, and in particular droughts, causing population collapses7-9.

3
Depending on recovery times relative to event frequency, repeat events may mean that
ultimately populations are unable to recover fully from each subsequent collapse, thereby
leading to local extinction. However, interactions with landscape characteristics provide
potential opportunities for climate change adaptation. Habitat restorations may reduce the
degree of population collapse in response to extreme events and additionally aid recovery10.
Although evidence of the existence of these land use-climate interactions is emerging3;10;11,
there has been no quantitative assessment of their effectiveness under future climate change.
Such evidence is critical to aid decision making in the context of safeguarding climate-
sensitive species.
Here we use extensive long-term butterfly population data from 129 sites of the UK
Butterfly Monitoring Scheme (UKBMS) to assess historical responses of 28 species to an
extreme drought event in 199512;13. This was the most arid summer since records began in
1776, measured using an April-September aridity index13. Although butterflies are generally
regarded as warmth-loving species, extreme hot and dry periods, can drastically reduce
population sizes through direct heat stress to larvae, or through declines in host-plant quality
and quantity arising from soil moisture deficits14-17. The UKBMS data in combination with
satellite-derived land cover data18 allow characterisation of how area and configuration of
Semi-Natural Habitat (SNH) in surrounding landscapes modify species responses to drought.
We identify six drought sensitive butterfly species (Fig. 1) as those that had negative
relationships between interannual growth rate and annual aridity and which exhibited major
population collapses following the 1995 drought (see Supplementary Methods &
Supplementary Fig. 1). For these populations, we assess recovery rate as the slope of
population change in the subsequent four years. We use multispecies mixed effects models
fitted to all species data19, with control variables which account for spatial variation in
drought intensity, density dependent population growth rates, and non-independence of data

4
within sites and species. We find that both response parameters, characterising size of
population collapse and recovery rate, are associated with habitat area and fragmentation in
3km radii around monitoring site. Of particular note is that larger extents of SNH in
landscapes are associated with lower population collapses in response to drought, whilst
reduced habitat fragmentation (lower ‘edginess’ of SNH) is associated with faster butterfly
recovery (Table 1, Supplementary Fig.2). Larger areas of contiguous habitat contain a greater
amount and diversity of host and nectar resources and microclimatic conditions11;20 and are
also less impacted by edge effects (i.e. moisture deficits towards woodland edges) during
drought periods21;22. Additionally, reduced habitat fragmentation may also allow ‘rescue
effects’ through improved connectivity from nearby populations23.
Extremes of very hot and dry periods are projected by many climate models to
increase in response to raised levels of atmospheric greenhouse gas concentrations1-3. To
assess such future drought likelihoods, the CMIP5 database24 provides a comprehensive
repository of climate projections with a broad set of contemporary Global Climate Models
(GCMs) and for four RCP scenarios25. The largest increases in atmospheric greenhouse gases
are for RCP8.5, corresponding to a radiative forcing of approximately 8.5 Wm-2 for year
2100. Sometimes referred to as a “business-as-usual” scenario, this corresponds to major on-
going emissions throughout the 21st Century, with little abatement26. The smallest change is
with RCP2.6, (stabilisation at 2.6 Wm-2), which for many climate models is associated with
an eventual warming since pre-industrial times of approximately two degrees Celsius. We
extract monthly temperature and precipitation data for the complete set of available GCM
simulations for a point representative of central England and corresponding to 100% land
cover for each GCM. These data are used to calculate a 6-month summer aridity index
(hereafter aridity)13 for each model year from 1860-2100, which captures the combined
5
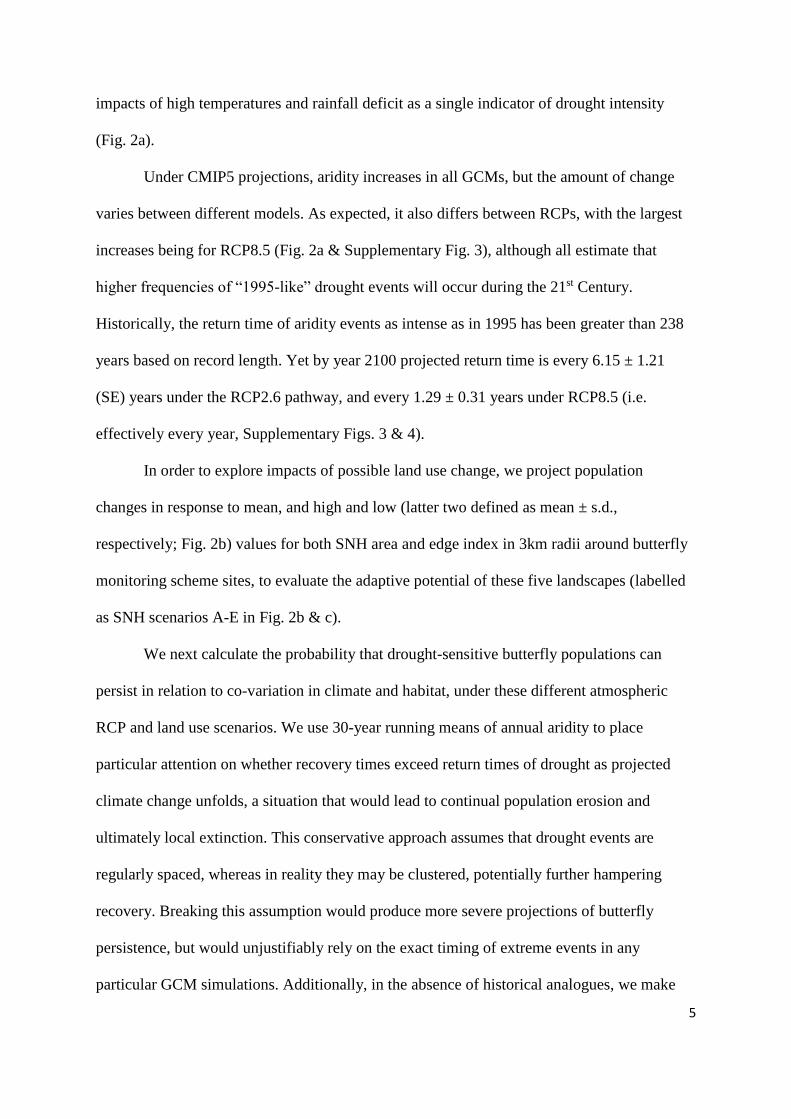
impacts of high temperatures and rainfall deficit as a single indicator of drought intensity
(Fig. 2a).
Under CMIP5 projections, aridity increases in all GCMs, but the amount of change
varies between different models. As expected, it also differs between RCPs, with the largest
increases being for RCP8.5 (Fig. 2a & Supplementary Fig. 3), although all estimate that
higher frequencies of “1995-like” drought events will occur during the 21st Century.
Historically, the return time of aridity events as intense as in 1995 has been greater than 238
years based on record length. Yet by year 2100 projected return time is every 6.15 ± 1.21
(SE) years under the RCP2.6 pathway, and every 1.29 ± 0.31 years under RCP8.5 (i.e.
effectively every year, Supplementary Figs. 3 & 4).
In order to explore impacts of possible land use change, we project population
changes in response to mean, and high and low (latter two defined as mean ± s.d.,
respectively; Fig. 2b) values for both SNH area and edge index in 3km radii around butterfly
monitoring scheme sites, to evaluate the adaptive potential of these five landscapes (labelled
as SNH scenarios A-E in Fig. 2b & c).
We next calculate the probability that drought-sensitive butterfly populations can
persist in relation to co-variation in climate and habitat, under these different atmospheric
RCP and land use scenarios. We use 30-year running means of annual aridity to place
particular attention on whether recovery times exceed return times of drought as projected
climate change unfolds, a situation that would lead to continual population erosion and
ultimately local extinction. This conservative approach assumes that drought events are
regularly spaced, whereas in reality they may be clustered, potentially further hampering
recovery. Breaking this assumption would produce more severe projections of butterfly
persistence, but would unjustifiably rely on the exact timing of extreme events in any
particular GCM simulations. Additionally, in the absence of historical analogues, we make

6
the conservative assumption that all future droughts will have the same impact as the 1995
event, even though they may be more severe in terms of aridity (Supplementary Fig. 3);
whilst there may also be negative impacts of drought events of lower magnitude than 1995
(Supplementary Fig. 1). We incorporate uncertainty between climate models by considering
under what proportion of GCMs, in each RCP, butterfly populations would be likely to
persist (i.e. where recovery time is less than drought return time), thereby providing a
probabilistic estimate. Uncertainty in butterfly recovery times is captured by using our
confidence intervals on the multispecies model parameters to calculate upper and lower
recovery times for each landscape.
Our forward projections show that the probability of butterfly population persistence
varies strongly with both atmospheric forcing levels and land use scenario (Fig. 3). We find
that no level of landscape management explored would allow successful climate change
adaptation and persistence under RCP8.5: widespread local population extinctions will occur
by 2100, and as early as 2050 for highly fragmented landscapes (Fig. 3c & d) including the
current average situation around monitoring sites (Fig. 3e). The most favourable of the
considered landscapes has the highest SNH area and lowest fragmentation and under RCP2.6
achieves a 50% probability of population persistence (95 percent confidence range: 29-64%)
by 2050 (Fig. 3a). Higher population persistence is predicted under the low fragmentation but
low SNH total area scenario (Fig. 3b) than the average fragmentation and SNH total area
scenario (Fig. 3e). Therefore, contrary to recent current thinking27, this shows that it is more
important that habitat creation is targeted to reduce fragmentation than solely to maximise
area. Further SNH fragmentation (e.g. under landscape management aimed to satisfy food
and energy security) would result in very low probabilities of butterfly persistence (i.e. under
30% by 2050) under all mitigation strategies (Fig. 3c & d).

7
Across the long-running butterfly monitoring sites studied, landscapes in 3km radius
tend to have slightly higher total SNH area than the national average, but this SNH tends to
be more fragmented (Fig. 2b). This reflects these monitoring sites being generally located in
large SNH patches but also placed in intensive agricultural landscapes of Southern Britain
(Supplementary Fig. 5). Therefore the average national landscape is most likely nearer that of
SNH scenario B, for which Fig. 3b indicates will harbour populations that are slightly more
robust in the face of climate change. However, even accounting for this, to ensure future
persistence in such landscapes still requires emissions trajectories falling strongly away from
“business-as-usual”. Under SNH scenario B, and RCP2.6, persistence probabilities are
between 14-50% (95% CI) by in the latter half of the century, with other scenarios
significantly lower (Fig. 3b).
Our empirical models and subsequent projections demonstrate the significant
interacting impacts of land use and extreme drought on butterfly populations. It is possible
that microevolution of drought tolerance could mitigate some future impacts. Whilst there are
examples where evolution in response to climate change can occur rapidly28, there are also a
number of recognised mechanisms why it may often not occur11;29. This is especially the case
when populations are smaller, as are British populations in light of historical declines30.
There are also upper limits on physiological tolerance to drought, as evidenced by the
absence of butterflies from high aridity locations in Europe17. Therefore, we believe that
microevolutionary rescue over the next four decades is unlikely, and that landscape
management offers the best solution to preventing extinctions.
Our analysis is the first to consider alternative outcomes of coincident changes in the
frequency of extreme events and land use. The focus has been on drought-sensitive
butterflies, and for Southern Britain, although our methods are applicable elsewhere and with
monitoring data for other species. As time evolves, more severe drought events will occur,

8
and on-going maintenance of species monitoring datasets will allow analysis of such extreme
events, including impacts on species not currently identified as drought-sensitive. From these,
we will be able to assess the extent to which our derived model parameters defining butterfly
population responses may experience any modulation through other stochastic environmental
factors, such as interactions with other species. From the current study, however, we provide
strong evidence of the potential for climate change adaptation measures, in particular the
unexpected importance of reducing SNH fragmentation, to delay responses to increased
drought frequency under climate change. A targeted approach to using land efficiently offers
the potential to maximise conservation benefits with the minimum impact on other land uses
such as food and energy production. However, to ensure persistence of drought sensitive
species through the entire 21st Century, then a combination of major emissions reductions, for
instance in line with scenario RCP2.6, along with significant reductions in habitat
fragmentation are required.

9
References
1 Seneviratne, S.I., Donat, M.G., Mueller, B., and Alexander, L.V., No pause in the
increase of hot temperature extremes. Nature Clim. Change 4, 161 (2014).
2 Cai, W. et al., Increasing frequency of extreme El Nino events due to greenhouse
warming. Nature Clim. Change 4, 111 (2014).
3 Settele, J. et al., Terrestrial and inland water systems. in Climate Change 2014:
Impacts, Adaptation, and Vulnerability. Part A: Global and Sectoral Aspects.
Contribution of Working Group II to the Fifth Assessment Report of the
Intergovernmental Panel on Climate Change edited by C.B. Field et al. (Cambridge
University Press, Cambridge, United Kingdom and New York, NY, USA, 2014), pp.
271.
4 Jentsch, A., Kreyling, J., and Beierkuhnlein, C., A new generation of climate-change
experiments: events, not trends. Front. Ecol. Env. 5, 365 (2007).
5 Bellard, C. et al., Impacts of climate change on future biodiversity. Ecol. Lett. 15, 365
(2012).
6 Thuiller, W. et al., Consequences of climate change on the tree of life in Europe.
Nature 470 (2011).
7 Jiguet, F., Brotons, L., and Devictor, V., Community responses to extreme climatic
conditions. Curr. Zool. 57, 406 (2011).
8 Jiguet, F. et al., Thermal range predicts bird population resilience to extreme high
temperatures. Ecol. Lett. 9, 1321 (2006).
9 Easterling, D.R. et al., Climate Extremes: Observations, Modeling, and Impacts.
Science 289, 2068 (2000).

10
10 Oliver, T.H. and Morecroft, M.D., Interactions between climate change and land use
change on biodiversity: attribution problems, risks, and opportunities. Wiley
Interdisciplinary Reviews: Climate Change 5, 317 (2014).
11 Hof, C., Levinsky, I., Araújo, M.B., and Rahbek, C., Rethinking species' ability to
cope with rapid climate change. Glob. Ch. Biol. 17, 2987 (2011).
12 Morecroft, M.D. et al., Effects of drought on contrasting insect and plant species in
the UK in the mid-1990s. Glob. Ecol. Biogeogr. 11, 7 (2002).
13 Marsh, T., Cole, G., and Wilby, R., Major droughts in England and Wales, 1800–
2006. Weather 62, 87 (2007).
14 Talloen, W., Dyck, H.V., and Lens, L., The cost of melanisation: butterfly wing
colouration under environmental stress. Evolution 58, 360 (2004).
15 WallisDeVries, M.F., Baxter, W., and Van Vliet, A.J.H., Beyond climate envelopes:
effects of weather on regional population trends in butterflies. Oecologia 167, 559
(2011).
16 Gutbrodt, B., Mody, K., and Dorn, S., Drought changes plant chemistry and causes
contrasting responses in lepidopteran herbivores. Oikos 120, 1732 (2011).
17 Settele, J. et al., Climatic Risk Atlas of European Butterflies. (Pensoft Publishers,
Sofia, 2008).
18 Fuller, R.M., Smith, G.M., Hill, R.A., and Thomson, A.G., The UK Land Cover Map
2000: Construction of a parcel-based vector map from satellite images. Cartographic
Journal 39, 15 (2002).
19 Bolker, B.M. et al., Generalized linear mixed models: a practical guide for ecology
and evolution. Trends Ecol. Evol. 24, 127 (2008).
20 Oliver, T. et al., Heterogeneous landscapes promote population stability. Ecol. Lett.
13, 473 (2010).

11
21 Herbst, M. et al., Edge effects and forest water use: A field study in a mixed
deciduous woodland. For. Ecol. Man. 250, 176 (2007).
22 Morecroft, M.D., Taylor, M.E., and Oliver, H.R., Air and soil microclimates of
deciduous woodland compared to an open site. Agr. For. Meteor. 90, 141 (1998).
23 Hanski, I., Metapopulation Ecology. (Oxford University Press, Oxford, 1999).
24 Taylor, K.E., Stouffer, R.J., and Meehl, G.A., An Overview of CMIP5 and the
Experiment Design. Bull. Am. Meteorol. Soc. 93, 485 (2011).
25 van Vuuren, D. et al., The representative concentration pathways: an overview. Clim.
Change 109, 5 (2011).
26 Sanford, T., Frumhoff, P.C., Luers, A., and Gulledge, J., The climate policy narrative
for a dangerously warming world. Nature Clim. Change 4, 164 (2014).
27 Hodgson, J.A., Moilanen, A., Wintle, B.A., and Thomas, C.D., Habitat area, quality
and connectivity: striking the balance for efficient conservation. J. Appl. Ecol. 48, 148
(2011).
28 van Asch, M. et al., Evolutionary response of the egg hatching date of a herbivorous
insect under climate change. Nature Clim. Change 3, 244 (2013).
29 Etterson, J.R. and Shaw, R.G., Constraint to adaptive evolution in response to global
warming. Science 294, 151 (2001).
30 Fox, J.A. et al., The State of the UK's Butterflies 2011. (Butterfly Conservation and
the Centre for Ecology and Hydrology, Wareham, Dorset, 2011).

12
Methods
Climate and habitat data
The aridity index was calculated as the weighted sum of the standardised April-October
temperature average and precipitation totals as in Marsh et al.31. Observed aridity index was
derived from the updated Central England Temperature32 and England and Wales Rainfall33
monthly series, obtained from the UK Met Office. Projected aridity indices were derived
from 2-m air temperature and total precipitation monthly fields, obtained from the CMIP5
project (Extended Data Table 1). All aridity index series use the same reference period (1860-
2005) for standardisation. To avoid bias due to the unequal number of ensemble members
associated with each GCM, each GCM aridity index was calculated from the ensemble mean
standardised temperature and precipitation time series for that GCM.
Semi-natural habitat was assessed as all land cover types besides urban, suburban, arable,
improved grassland and saltwater from LCM 200034, a UK national land cover map derived
from satellite earth observation, in 3km radii around UKBMS monitoring sites. Preliminary
analyses and previous work suggest that landscape structure at this spatial scale has strong
impacts on butterfly population dynamics35;36. Configuration metrics were calculated using
the program FRAGSTATS37. Three metrics were selected which reflect complementary
aspects of fragmentation and potentially mediate butterfly responses to drought36: mean ‘edge
index’ (a standardised measure of area-perimeter ratio or ‘edginess’, where for each separate
SNH patch the actual perimeter is expressed relative to the minimum possible perimeter for a
patch of that size and the mean taken across all patches), mean nearest neighbour distance
between habitat patches and patch density (number of patches per m2).
Attribution of drought impacts on butterfly species

13
We used data from the UK butterfly monitoring scheme (http://www.ukbms.org/) for which
annual indices of abundance at each monitoring site have been calculated38. Species needed
to fulfil three criteria in order to be categorised as especially drought-sensitive. First, a
significant majority of monitoring sites should show population declines following the
drought relative to expected values in 1996 from a six-year local population trajectory (e.g.
Fig. 1a & b; assessed using a Wilcoxon signed ranks test). Second, a significant majority of
monitoring sites should also show significant population declines relative to the year
immediately preceding the drought. Finally, across all years that sites were monitored the
species should show a significant negative relationship between interannual growth rates and
annual summer aridity index. Interannual growth rates were calculated as log(Nt/Nt-1), where
N is the population density in year t. This was then used as a response variable in a linear
mixed effects regression against annual aridity index in year t with Site as a random effect in
order to account for multiple observations at each monitoring site. These three tests resulted
in just over one-fifth of UK species identified as drought sensitive under our criteria
(Extended Data Fig. 1).
We analysed the effect of semi-natural habitat (SNH) on degree of population
collapse from the 1995 drought event and subsequent recovery31, following methods used by
Oliver et al.36 and explained here. For each species at each monitoring site, the degree of
population change in response to the 1995 drought was measured by the difference between
the observed and expected population count in 1996 (from a six-year linear population trend;
Fig. 1a). This method accounts for long term population trajectory, which is important
because long term species declines39 could lead to false attribution of drought impacts if only
change from the preceding years count is considered. A six-year period was chosen to assess
the population trajectory because preliminary analysis suggested that this time period
maximised statistical power by balancing accurate assessment of pre-drought population

14
trends with higher sample size for sites included in the analysis36. Also in preliminary
analyses, we tested for effects of density dependence on interannual growth rates (regression
of log(Nt/Nt-1) versus Nt-1, where N is population density in year t )40. We found 43% of the
population time series showed evidence of density dependence (at p<0.05). However, in an
analysis comparing linear and quadratic models to explain population trends over the six year
period (i.e. regression of Nt on year), we found that linear models produced the best fit to
population trends (for 92% of time series). Therefore, although density dependence may be
an important regulatory demographic process for these butterfly species, over the time
periods and range of densities on our sites, and relative to other factors (e.g. weather and
habitat quality), there is little evidence of curvature in population trends expected under a
strong influence of density dependence. For all species and sites with population declines
following the drought, recovery was assessed as the linear population trend in the subsequent
four years (Fig. 1a), chosen to balance assessment of the population growth phase
immediately following population collapse balanced with obtaining a reliable trend
estimate36. In models predicting recovery rates, extent of population collapse and starting
population size following collapse were also included as covariates to account for density
dependence in growth rates.
Butterfly drought responses in relation to habitat fragmentation
To data from all monitoring sites, and for all six drought-sensitive butterfly species, we fitted
one linear mixed-effects model (LMM) investigating the predictors of population collapse
from drought (difference between observed and expected count) and one LMM investigating
the predictors of population recovery (rate of population increase following decline in 1995
or 1996). The model exploring the predictors of population collapse included expected
population size and a measure of each site’s drought intensity (1995 aridity index from

15
nearest 5km cell) as control explanatory variables. All models exploring the predictors of
recovery rates included the size of the initial population decline and population size
immediately after the drought as control explanatory variables. In addition to these control
variables, each of these models included four fixed effects characterising SNH: total SNH
area and the three FRAGSTATS metrics described above. Each model also included site and
species as random intercepts to control for repeated measures from the same site and the
same species. All habitat variables were standardised to have a mean of zero and standard
deviation of one (i.e. by subtracting the mean and dividing by standard deviation). Model
checking confirmed the residuals from each mixed model containing all variables were
normally distributed and had constant variance. To find the minimum adequate model the
least significant habitat variable was sequentially dropped until no more could be dropped
without losing a significant amount of explanatory power, determined by using a χ2 test to
compare the model residual variances41. This resulted in only SNH area and edge index in the
final models for population collapse and recovery respectively (see main text). Analyses were
conducted using the program R and lme4 package42;43.
Estimating butterfly recovery times
We used the coefficients from the minimum adequate models for butterfly population
collapse and recovery to calculate the average expected butterfly recovery time under the five
different SNH scenarios (Fig. 2b & c). Recovery time was calculated as the degree of
population collapse to drought (expected minus observed population count following the
drought event) divided by the post-drought population recovery rate (change in population
count per year). To parameterise the models we used the mean expected population size,
observed population size and site aridity index across all species and sites, along with either
‘high’ (mean + s.d. across all sites), ‘low’ (mean - s.d. across all sites) or mean values for

16
SNH area and edge index. These produced predicted population recovery times under five
SNH scenarios, e.g. high area and high edge index (main text and Fig. 2). We incorporated
uncertainty by repeating these calculations using 95% confidence intervals for coefficients to
calculate the upper of lower uncertainty bounds on recovery times. Recovery times were then
considered in relation to the time-varying drought return time under the four different RCPs.
Uncertainty across GCMs was accounted for by expressing the percentage of climate
projections in which populations would persist (where average recovery times were less than
drought return times).
References for Methods
31 Marsh, T., Cole, G., and Wilby, R., Major droughts in England and Wales, 1800–
2006. Weather 62, 87 (2007).
32 Manley, G., Central England temperatures: monthly means 1659 to 1973. Q. J. R.
Meteorol. Soc. 100, 389 (1974).
33 Alexander, L.V. and Jones, P.D., Updated Precipitation Series for the U.K. and
Discussion of Recent Extremes. Atmospheric Science Letters 1, 142 (2001).
34 Fuller, R.M., Smith, G.M., Hill, R.A., and Thomson, A.G., The UK Land Cover Map
2000: Construction of a parcel-based vector map from satellite images. Cartographic
Journal 39, 15 (2002).
35 Oliver, T. et al., Heterogeneous landscapes promote population stability. Ecol. Lett.
13, 473 (2010).
36 Oliver, T.H., Brereton, T., and Roy, D.B., Population resilience to an extreme drought
is influenced by habitat area and fragmentation in the local landscape. Ecography 36,
579 (2013).

17
37 McGarigal, K., Cushman, S.A., Neel, M.C., and Ene, E., FRAGSTATS: Spatial
Pattern Analysis Program for Categorical Maps. Computer software program
produced by the authors at the University of Massachusetts, Amherst. Available at the
following web site: www.umass.edu/landeco/research/fragstats/fragstats.html.
(2002).
38 Rothery, P. and Roy, D.B., Application of generalized additive models to butterfly
transect count data. J. Appl. Stat. 28, 897 (2001).
39 Fox, J.A. et al., The State of the UK's Butterflies 2011. (Butterfly Conservation and
the Centre for Ecology and Hydrology, Wareham, Dorset, 2011).
40 Schtickzelle, N. and Baguette, M., Metapopulation viability analysis of the bog
fritillary butterfly using RAMAS/GIS. Oikos 104, 277 (2004).
41 Crawley, M.J., The R Book. Second Edition. (John Wiley and Sons, Chichester, UK,
2012).
42 R Core Team, R: A language and environment for statistical computing. R
Foundation for Statistical Computing, Vienna, Austria. (http://www.R-project.org/,
2013).
43 Bates, D., Maechler, M., Bolker, B., and Walker, S., lme4: Linear mixed-effects
models using Eigen and S4. R package version 1.0-4. (http://CRAN.R-
project.org/package=lme4, 2013).

18
Acknowledgements: This research was partly funded by Natural England Project ref. 24802
and partly by NERC CEH national capability funding. We thank Andrew Crowe from the UK
Food and Environment Research Agency for calculating habitat configuration metrics and
Simon Duffield for help in establishing the project. The UKBMS is funded by funded by a
multi-agency consortium led by Defra, and including CCW, JNCC, FC, NE, NERC, NIEA,
SNH.
Author Contributions: THO conceived the study with input from MM; CP and CH analysed
climate data; HHM and THO analysed butterfly responses to habitat and climate; all authors
interpreted results and contributed to writing the manuscript.
Author information: Correspondence and requests for materials should be addressed to
[email protected]. The authors confirm they have no competing financial interests.

19
Figure Legends
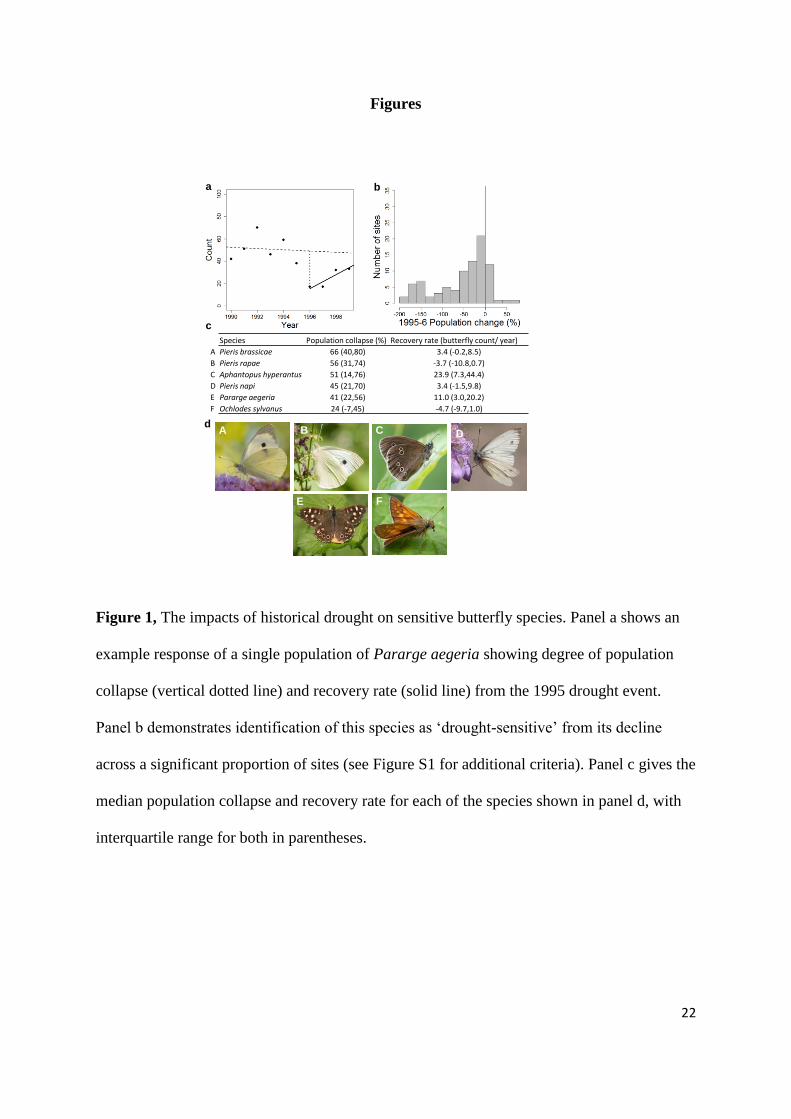
Figure 1, The impacts of historical drought on sensitive butterfly species. Panel a shows
an example response of a single population of Pararge aegeria showing degree of population
collapse (vertical dotted line) and recovery rate (solid line) from the 1995 drought event.
Panel b demonstrates identification of this species as ‘drought-sensitive’ from its decline
across a significant proportion of sites (see Figure S1 for additional criteria). Panel c gives the
median population collapse and recovery rate for each of the species shown in panel d, with
interquartile range for both in parentheses.
Figure 2, Scenarios of land use change and aridity in a future climate. Panel (a) shows
projected changes in annual aridity index for central England under different RCP emissions
scenarios from 17 CMIP5 global circulation models. Observed data from the UK Met Office
are shown as black points with a 5 year moving average trend line. Aridity in 1995 is shown
by the dashed horizontal line. Panel (b) shows semi-natural habitat (SNH) metrics in 3km
radii around the 129 butterfly monitoring scheme sites analysed (open black circles and
contours showing probability density surface, with vertical and horizontal lines showing ±SD
from the mean). The lettered intersections (“A”-“D”) refer to the habitat scenarios for which
we modelled butterfly persistence under future climate projections, along with the current
mean habitat (“E”). Also in panel (b), the black points and coloured probability density
surface show the ‘average’ English landscape from SNH metrics in 3km radii around 2443
stratified randomised samples across lowland England. Panel (c) shows four butterfly
monitoring sites which exemplify the SNH characteristics one standard deviation away from
the monitoring site means corresponding to the labelled intersections “A”-“D” in panel (b).

20
Figure 3, Combined effects of climate change and habitat. The percentage of GCMs for
which butterfly persistence occurs; that is where return time of severe drought events is
longer than the recovery time of the average butterfly population in a 30-year moving
window, under four semi-natural habitat scenarios, with lettering matching scenarios in Fig.
2: panel (a)- high area and low edge index; (b)- low area and edge index; (c)-high area and
edge index; (d)- low area and high edge index; (e)- current mean around monitoring sites.
Lines within each plot show the predictions under two RCP extreme emissions pathways
(RCP26 in blue, RCP85 in red, with 95% confidence intervals as shaded envelopes). Results
from intermediate RCP pathways RCP4.5 (orange) and RCP6.0 (black) are also incorporated
on the right hand side bars which show the probability of persistence with maximum ±95%
CI between 2050 and 2100 (i.e. between 30-year window midpoints 2065-2085).

21
Tables
Table 1, Variable coefficients from minimum adequate mixed effects models relating
butterfly population collapse and recovery from drought to SNH habitat characteristics.
Models include all six drought species identified as particularly drought-sensitive (see main
text). Control variables were also included in the models (see Supplementary Methods for
details). T-values in bold indicate significant effects (at p<0.05).
Model Response variable Explanatory variable Coefficient SE t
1 Population collapse Intercept -0.36 13.70 -0.03
1 Population collapse Expected abundance from long
term trajectory (control) 0.40 0.02 20.39
1 Population collapse Site aridity (control) 0.57 3.00 0.19
1 Population collapse SNH area -10.44 3.45 -3.02
2 Recovery rate Intercept 7.08 5.98 1.18
2 Recovery rate Population collapse from
drought (control) 0.03 0.02 1.79
2 Recovery rate Starting population size after
collapse (control) -0.05 0.02 -3.00
2 Recovery rate SNH edge index -3.65 1.55 -2.36
22
Figures
Figure 1, The impacts of historical drought on sensitive butterfly species. Panel a shows an
example response of a single population of Pararge aegeria showing degree of population
collapse (vertical dotted line) and recovery rate (solid line) from the 1995 drought event.
Panel b demonstrates identification of this species as ‘drought-sensitive’ from its decline
across a significant proportion of sites (see Figure S1 for additional criteria). Panel c gives the
median population collapse and recovery rate for each of the species shown in panel d, with
interquartile range for both in parentheses.
a
F E
A D B
b
c
d C
Species Population collapse (%) Recovery rate (butterfly count/ year)
A Pieris brassicae 66 (40,80) 3.4 (-0.2,8.5)
B Pieris rapae 56 (31,74) -3.7 (-10.8,0.7)
C Aphantopus hyperantus 51 (14,76) 23.9 (7.3,44.4)
D Pieris napi 45 (21,70) 3.4 (-1.5,9.8)
E Pararge aegeria 41 (22,56) 11.0 (3.0,20.2)
F Ochlodes sylvanus 24 (-7,45) -4.7 (-9.7,1.0)

23
Figure 2, Scenarios of land use change and aridity in a future climate. Panel (a) shows projected changes in annual aridity index for central
England under different RCP emissions scenarios from 17 CMIP5 global circulation models. Observed data from the UK Met Office are shown
as black points with a 5 year moving average trend line. Aridity in 1995 is shown by the dashed horizontal line. Panel (b) shows semi-natural
habitat (SNH) metrics in 3km radii around the 129 butterfly monitoring scheme sites analysed (open black circles and contours showing
probability density surface, with vertical and horizontal lines showing ±SD from the mean). The lettered intersections (“A”-“D”) refer to the
habitat scenarios for which we modelled butterfly persistence under future climate projections, along with the current mean habitat (“E”). Also in
panel (b), the black points and coloured probability density surface show the ‘average’ English landscape from SNH metrics in 3km radii around
\ A C
B D
a b c

24
2443 stratified randomised samples across lowland England. Panel (c) shows four butterfly monitoring sites which exemplify the SNH
characteristics one standard deviation away from the monitoring site means corresponding to the labelled intersections “A”-“D” in panel (b).

25
Figure 3, Combined effects of climate change and habitat. The percentage of GCMs for
which butterfly persistence occurs; that is where return time of severe drought events is
longer than the recovery time of the average butterfly population in a 30-year moving
window, under four semi-natural habitat scenarios, with lettering matching scenarios in Fig.
2: panel (a)- high area and low edge index; (b)- low area and edge index; (c)-high area and
edge index; (d)- low area and high edge index; (e)- current mean around monitoring sites.
Lines within each plot show the predictions under two RCP extreme emissions pathways

26
(RCP26 in blue, RCP85 in red, with 95% confidence intervals as shaded envelopes). Results
from intermediate RCP pathways RCP4.5 (orange) and RCP6.0 (black) are also incorporated
on the right hand side bars which show the probability of persistence with maximum ±95%
CI between 2050 and 2100 (i.e. between 30-year window midpoints 2065-2085).