interaction draft - university of toronto t-space · keywords: tunneling, ground movements,...
TRANSCRIPT

Draft
JOINTED PIPELINE RESPONSE TO TUNNELING INDUCED
GROUND DEFORMATION
Journal: Canadian Geotechnical Journal
Manuscript ID cgj-2016-0054.R1
Manuscript Type: Article
Date Submitted by the Author: 20-Jun-2016
Complete List of Authors: Wham, Brad; Cornell University, Civil and Environmental Engineering Argyrou, Christina; Cornell University, Civil and Environmental Engineering O'Rourke, Thomas; Cornell University
Keyword: pipelines, ductile iron, cast iron, tunneling ground movements, soil-pipeline interaction
https://mc06.manuscriptcentral.com/cgj-pubs
Canadian Geotechnical Journal

Draft
1
JOINTED PIPELINE RESPONSE TO TUNNELING INDUCED
GROUND DEFORMATION
Brad P. Wham, Christina Argyrou, Thomas D. O’Rourke
Affiliation and address:
Postdoctoral Associate, 266a Hollister Hall, Cornell University, Ithaca, NY 14853,
Graduate Research Assistant, 267 Hollister Hall, Cornell University, Ithaca, NY 14853,
Professor, 323 Hollister Hall, Cornell University, Ithaca, NY 14853, [email protected]
Corresponding Author:
Brad P. Wham
266a Hollister Hall, Cornell University, Ithaca, NY 14853
Email: [email protected]
Page 1 of 48
https://mc06.manuscriptcentral.com/cgj-pubs
Canadian Geotechnical Journal

Draft
2
ABSTRACT
This paper focuses on the effect of tunneling induced ground deformation on the response of
jointed cast iron and ductile iron pipelines that 1) cross the settlement profile perpendicular to the
tunnel centerline, and 2) connect through 90° tees with a pipeline parallel to the tunnel
centerline. The modeling involves 2D finite element analyses that account for coupled forces
both parallel and perpendicular to the pipeline, and incorporates the results of large-scale
laboratory tests to characterize the joints. Pipeline response is quantified with respect to joint
rotation and pullout at various leakage levels as well as the allowable tensile strain. The paper
describes soil displacements induced by a 6.1-m (20-ft) diameter tunnel in clay and sand. Joint
rotations and maximum tensile strains for pipelines in sand exceed those in clay by up to three
for the same geometric conditions. Cast iron pipelines crossing the tunnel centerline are most
vulnerable to leakage from joint rotation; ductile iron pipelines have sufficient capacity against
joint leakage in all cases studied. Cast iron pipelines that connect with 90° tees are highly
vulnerable to leakage from pullout due to lateral soil movement. Guidance is provided for risk
assessment, design, and utility operations.
Keywords: tunneling, ground movements, pipelines, cast iron, ductile iron, soil-structure
interaction
Page 2 of 48
https://mc06.manuscriptcentral.com/cgj-pubs
Canadian Geotechnical Journal

Draft
3
Introduction
Substantial research has been performed on the characterization of ground movements caused
by tunneling (Peck 1969; O’Reilly and New 1982; Mair and Taylor 1997; Marshall et al. 2012)
and the influence of such movements on the response of underground pipelines (Attewell et al.
1986; Klar et al. 2005; Vorster et al. 2005; Klar et al. 2008; Wang et al. 2011). This paper
expands on previous research by examining how jointed pipelines respond to tunneling induced
vertical and horizontal soil movements, using the most recent research findings on the
performance of ductile iron (DI) and cast iron (CI) pipelines. Ductile iron pipelines with push-on
joints are widely used in current practice, whereas CI pipelines were used extensively in the past,
and represent a large fraction of the current pipeline inventory of many water and some gas
distribution networks.
This paper begins with an assessment of the limit states for the onset of leakage in DI and CI
joints. The finite element (FE) modeling for soil/pipeline interaction is described next, with a
discussion of how soil reaction normal and parallel to the longitudinal pipe axis is simulated and
coupled with the rotation and pullout of the pipeline joints. Modeling of distributed vertical and
horizontal soil movements caused by tunneling in clay and sand are described. The analytical
results from FE soil/pipeline interaction simulations are presented and discussed for two cases
involving jointed pipelines perpendicular to the tunnel centerline axis that (1) extend well
beyond the width of the settlement profile and (2) connect through 90° tees with a pipeline
parallel to the tunnel centerline axis. The analytical results are summarized for nominal 150-mm
and 300-mm (6 and 12-in.)-diameter pipelines. Pipelines with diameters ≤ 300 mm (12 in.)
comprise 99% of gas distribution pipelines in the U.S. (PHMSA 2015) and a large portion of
water distribution systems. For example, approximately 90% of the water distribution system
Page 3 of 48
https://mc06.manuscriptcentral.com/cgj-pubs
Canadian Geotechnical Journal

Draft
4
operated by the Los Angeles Department of Water and Power involves pipe diameters ≤ 300 mm
(12 in.) (Davis 2015). Recommendations are made for the identification of pipeline conditions at
highest risk of leakage, modes of pipeline failure, and sensitivity of pipeline response to
tunneling movements in clay and sand.
Cast Iron Pipelines
Cast iron pipelines in gas and water distribution systems were installed primarily between
1870 and 1960 (Taki and O’Rourke 1984). Pipe installed between 1870 and 1930 was
manufactured predominantly by vertical pit casting to produce nominal 3.66-m (12-ft) pipe
lengths; most CI pipe after 1930 was manufactured by centrifugal casting of nominal 5.50-m
(18-ft) lengths.
Allowable tensile strain limits for CI pipe of 0.0005 – 0.0006 (500µε – 600µε) have been
adopted in the Massachusetts Administrative Code, 220 CMR 113 (Massachusetts Administrative
Code 2006) and waivers to 16 NYCRR, Part 255.757 (New York Administrative Code 2006)
based on extensive investigations of CI pipe properties (Harris and O’Rourke 1983; Taki and
O’Rourke 1984). Furthermore, numerous field tests show that a residual maximum tensile strain
of 250µε develops in response to pipeline installation, backfilling, and subsequent traffic loads
(O’Rourke and Kumbhojkar 1984; Stewart et al. 1989). When the allowable and residual
maximum strains are combined, the resulting strain is less than one-fourth the average failure
strain that was measured in pit cast iron tensile test specimens taken from pipelines after 50 to 80
years in the field (Taki and O’Rourke 1984). A lower limit of 500 µε is appropriate for
centrifugal CI pipe, which in some instances may be vulnerable to stress crack corrosion (Taki
Page 4 of 48
https://mc06.manuscriptcentral.com/cgj-pubs
Canadian Geotechnical Journal

Draft
5
and O’Rourke 1984). The upper limit of 600µε used in this work is applicable for pit cast iron
pipe, which is representative of the majority of CI pipelines in current service.
Tensile test data for CI pipe from Johnson (1890), Schlick and Moore (1936), and Taki and
O’Rourke (1984) show a range of CI modulus from 75.8 to 128 GPa (11,000 to 18,500 ksi). A
secant modulus, E, of 75.8 GPa (11,000 ksi), which is strain compatible with both the allowable
and the combined allowable and residual maximum tensile strain, is used in this study (Wham
2016).
Axial Force vs. Displacement of CI Joints
Figure 1 shows a profile view of a typical CI joint, which connects the spigot and bell ends of
adjoining pipes. The annular space between the spigot and bell is packed with hemp or jute yarn
and predominantly lead or cement caulking. Prior (1935) indicates that the lead caulking depth is
typically 57 mm (2.25 in.), while Attewell et al. (1986) report depths of 44 to 57 mm (1.75 to 2.5
in.), depending on diameter. This work focuses on CI joints with lead caulking and soft hemp or
jute, typical of most water and some gas distribution pipelines. Such joints are less resistant to
pullout and more flexible in rotation than cement-caulked joints and joints in gas mains where
the yarn is often impregnated with hardened hydrocarbons (Harris and O’Rourke 1983).
The relationship between joint pullout force at first slip, Fj,slip; CI-lead adhesion, CA; and joint
geometry is
, os L AJ slipF D d Cπ= ( 1 )
where Dos is the outer spigot diameter and dL is the lead caulking depth as illustrated in Fig. 1.
Page 5 of 48
https://mc06.manuscriptcentral.com/cgj-pubs
Canadian Geotechnical Journal

Draft
6
Through Eqn. 1 the CA corresponding to first leakage was calculated from the results of 15
pullout tests under internal water pressure ranging from 140 to 2500 kPa (20 to 360 psi) on
specimens of lead caulked CI joints ranging from 150 to 1500 mm (6 to 60 in.) in nominal
diameter (Prior 1935), as well as two similar specimens of nominal 300-mm (12-in.)-diameter CI
joints tested under nitrogen pressure of 2.0 kPa (0.29 psi) (O’Rourke et al. 1996). All tests were
conducted for a lead caulking depth of approximately 57 mm (2.25 in.). Detailed information
about the joint pullout tests and tabulation of experimental data is provided by Wham (2016).
Figure 2 shows a cumulative frequency plot of the CA data and a cumulative probability
curve, developed from the mean and standard deviation of the data. The Lilliefors (1967)
goodness of fit test shows that a normal distribution is verified at the 5% significance level, and
thus is a suitable fit of the data.
Figure 3 shows the normalized force vs. displacement plots for five typical pullout tests,
including two with internal gas pressure and three with internal water pressure. The measured
axial force is normalized with respect to the pullout force at first leakage. Due to limitations of
measuring methods used by Prior (1935), initial joint stiffness data at displacements less than
0.79 mm (0.031 in.) are not reliable. The O’Rourke et al. (1996) pull-out tests offer the most
detailed data available for assessing initial joint stiffness and provide the basis for the idealized
axial pullout curve shown as a dashed line in the figure. A well-defined break in the slope of
these curves occurs at 0.51 mm (0.02 in.), after which there is variation in the normalized force
vs. displacement relationships.
The inset diagram in the figure shows an expanded view of the normalized force vs. axial
displacement plots at low levels of movement. There is a clear transition to a flatter slope at
Page 6 of 48
https://mc06.manuscriptcentral.com/cgj-pubs
Canadian Geotechnical Journal

Draft
7
about 0.50 mm (0.02 in.). This displacement occurs at the onset of leakage and corresponds to a
notable change in the rate at which resistance is mobilized against pullout. This slip between the
lead and CI surface generates leakage paths. As discussed by O’Rourke et al. (1996), continued
deformation of lead caulking can actually close off leakage paths after initial leakage. Thus, slip
at the onset of leakage can be identified at 0.50 mm, but a clear and consistent trend in leakage
with additional pullout cannot be quantified with the current experimental evidence.
Moment vs. Rotation of CI Joints
Harris and O’Rourke (1983) explored the relationship among moment, rotation, and leakage
with four point load tests of CI joints with nominal diameters of 100, 150, and 200 mm (6, 4, and
8 in.) under nitrogen pressures of 3.0 kPa (0.43 psi) consistent with the operation of low pressure
gas mains. These joints were sampled from the field after 50-80 years of operation. Figure 4
presents the data from 19 tests on lead-caulked pit CI joints expressed as leakage vs. joint
rotation for 10% through 90% exceedance limits. Each plot represents the leakage at which a
particular percentage of the test specimens exceeds the leakage rate shown. The total number of
specimens at each stage of testing is plotted with respect to rotation. As the rotation increased,
some tests were discontinued because pipes fractured or loads exceeded safety limits adopted for
the tests, thereby reducing the number of specimens.
The onset of leakage occurs at approximately 0.2°, with maximum leakage at approximately
0.5°. There was actually a decline in leakage at all exceedance levels after 0.5°. Leakage
eventually increased at large rotations exceeding 3-4° (not shown in the figure) in those joints
that did not fail. No pipe failures were observed until about 0.5°, after which there was an
increase in the number of failures as rotation increased.
Page 7 of 48
https://mc06.manuscriptcentral.com/cgj-pubs
Canadian Geotechnical Journal

Draft
8
O’Rourke and Trautmann (1980) proposed an equation for the moment at first slip between
the lead and CI surface, MJ,slip, in which CA, dL, and Dos are as defined for Eqn. 1, as follows
2
,3
8J slip os A LM D C dπ= ( 2 )
Using Eqn. 2 with the mean CA from Fig. 2 and dL = 57 mm (2.25 in.), normalized moment
vs. rotation plots were developed from four bending tests on nominal 500-mm (20-in.)-diameter
CI joints with no internal pressure (Prior 1935) and nominal 150-mm (6-in.)-diameter CI joints
under 3 kPa (0.43 psi) gas pressure (Harris and O’Rourke 1983). The plots are shown in Fig. 5
in which the measured bending moment is normalized with respect to the moment at first
leakage, calculated with Eqn. 2. In Fig. 5(a) a change in the normalized moment vs. rotation
plots can be identified at about 0.2°. Both O’Rourke and Trautmann (1980) and Rajani and
Abdel-Akher (2013) attribute this change in slope to deformation of the lead caulking, related to
first slip between the lead and CI surface, that generates leakage.
Figure 5(b) is an expanded view of the normalized moment vs. rotation plots to 0.6° rotation.
The rotation, corresponding to a prominent slope reduction in the plots, varies between 0.1 and
0.4°. Initial joint stiffness for the generalized curves is given by k1 = Mj,slip/θ1 where Mj,slip is
calculated from Eqn. 2 assuming a mean CA and dL = 57 mm (2.25 in.), and θ1 = 0.2° where θ1 is
the rotation at first slip. As recommended by Rajani and Abdel-Akher (2013), beyond 0.2° of
rotation the initial joint stiffness is reduced by 75% for diameters less than 400 mm (16 in.), and
65% for larger diameters. Based on the available test data, a third change at 1.0° was adopted to
reduce the slope of the curve to 12% and 20% of the initial stiffness for 150 and 500-mm (6 and
20-in.)-diameter joints, respectively.
Page 8 of 48
https://mc06.manuscriptcentral.com/cgj-pubs
Canadian Geotechnical Journal

Draft
9
Ductile Iron Pipelines
Ductile iron pipe in U.S. practice conforms to the ANSI/AWWA C151/A21.51 standard
(AWWA 2009). Typical stress vs. strain data from direct tension tests on pipe specimens of
commercial grade DI are reported by Wham and O’Rourke (2015) and used in this work. The
average ultimate strength of 460 MPa (66.7 ksi), yield strength of 311 MPa (45.1 ksi), strain at
failure of 10.4%, and average elastic modulus of 186,000 MPa (27,000 ksi) obtained from those
tests exceed minimum standard requirements.
The DI pipelines most frequently used in water distribution systems are equipped with push-
on joints for ease of installation. A typical 150-mm (6-in.) DI joint, which connects the spigot
and bell ends of adjoining pipes, is shown in Fig. 6. An elastomeric gasket provides a watertight
seal. As illustrated in the figure, the maximum joint rotation before metal to metal contact, or
metal binding, is nominally 5° when the spigot is inserted into the full depth of the bell.
Wham and O’Rourke (2015) developed a relationship among leakage, rotation, and moment
at various levels of axial displacement from the results of 22 tests on DI joints with a nominal
diameter of 150 mm (6 in.) under 380 kPa (55 psi) of internal water pressure. The relationship at
first leakage is shown in Fig. 7 as normalized joint rotation (rotation divided by rotation at metal
binding, 5°) vs. normalized pullout (axial displacement from the position of a fully inserted
spigot divided by the maximum pullout, 51 mm (2 in.)). The experimental results are plotted for
two combinations of normalized rotation and pullout at which there is metal binding and first
leakage. Simplified, approximate limit states for metal binding and leakage are shown by the
continuous and dashed lines, respectively.
The dashed line represents the pressure boundary for DI joints included in this study. Any
combination of normalized rotation and pullout on and above this line coincides with joint
Page 9 of 48
https://mc06.manuscriptcentral.com/cgj-pubs
Canadian Geotechnical Journal

Draft
10
leakage. Wham and O’Rourke (2015) show that the pressure boundary is independent of load
path and can be used for many different conditions of evolving rotation and pullout associated
with complex ground deformation patterns.
Although Fig. 7 is presented in terms of normalizing parameters, it is not intended for the 150
mm (6 in.) joint pressure boundary to be used for all DI pipe diameters and commercially
available configurations. Additional experimental testing or 3D FE analysis, as outlined by
Wham and O’Rourke (2015), is needed to establish larger diameter joint response to
combinations of joint pullout and rotation.
Soil Pipeline Interaction Model
Analytical models for underground pipeline response to tunneling induced ground movements
have been developed and calibrated by centrifuge tests for continuous and jointed pipelines,
applying linear equivalent and elastoplastic formulations for soil-pipe interaction (Klar et al.
2005; Vorster et al. 2005; Klar et al. 2007; Klar et al. 2008; Klar and Marshall 2015). Models
developed by Marshall et al. (2010) account for changes in soil stiffness arising from out-of-
plane shear strains in combination with those at the pipe level, and provide the best predictions
of pipe bending moment compared to centrifuge test results.
An alternative approach was adopted in this work following the procedures recommended for
analyzing pipeline response to earthquake induced ground deformation (ASCE 1984; Honegger
and Nyman 2004; O’Rourke et al. 2008). A detailed description of this methodology for
characterizing soil-pipe force vs. displacement relationships in sand is provided in this special
issue by Jung et al. (2016).
Page 10 of 48
https://mc06.manuscriptcentral.com/cgj-pubs
Canadian Geotechnical Journal

Draft
11
Figure 8 illustrates the basic concept of the modeling process for a continuous pipeline in
which the pipe is modeled as a beam, often with both nonlinear material and geometric
properties. Although only bi-linear relationships are presented in the figure, soil-pipe
interactions orthogonal and parallel to the pipeline longitudinal axis can be modeled by linear,
multi-linear, or nonlinear relationships derived from full-scale laboratory tests of soil-pipe
interaction (O’Rourke 2010; Jung et al. 2013a and b). For example, Jung, et al. (2016) explain
how soil-pipe force vs displacement in sand can be modeled as bilinear and nonlinear
relationships, using a rectangular hyperbola to represent nonlinear conditions. The primary
advantage of this approach is that the characterization of nonlinear soil-pipe interaction is based
on the measured performance of real pipe under burial conditions that replicate those in the field.
Moreover, the method is expanded in this work to account for the fully coupled interaction
between soil forces normal and parallel to the longitudinal axis of the pipeline as well as the
axial force vs. displacement and moment vs. rotation relationships of CI and DI joints previously
discussed. Thus, the methodology is comprehensive and, although it does not account for soil
continuity that is captured by other well-known approaches (Klar et al. 2005; Vorster et al. 2005),
its versatility and fidelity to real soil-pipe interaction and pipe joint behavior in the field have
substantial merit.
Figure 9 presents a schematic of the enhanced soil-pipeline interaction model with pipe
elements, joints, and connection to a 90° pipeline tee. The tee is simulated by a single node with
known boundary conditions. Displacements representing vertical and lateral soil movements
caused by tunneling are conveyed to the nodes at the far sides of the soil spring elements, thus
simulating soil interaction with the pipe. Pipeline joints are modeled by rotational and axial
relationships developed from large-scale laboratory tests. The transverse spring stiffness is set to
Page 11 of 48
https://mc06.manuscriptcentral.com/cgj-pubs
Canadian Geotechnical Journal

Draft
12
a very high value, which simulates contact and transfer of shear force between the spigot and
bell.
The modeling approach is readily implemented in commercially available FE software. In
this work the general purpose FE software ABAQUS (2014) was used for 2D FE modeling in
which the pipeline is represented by beam elements (type b33) and the soil resistance normal to
the pipeline axis by nonlinear springs (type spring2). The springs are connected to the pipeline
with uniaxial gap elements (type gapuni) that transfer forces parallel and perpendicular to their
axes only when the corresponding normal springs carry compressive forces. This is achieved by
allowing separation of the gap elements when tensile normal forces are activated in response to
load relaxation and separation between soil and pipe.
The force per unit distance transferred through the gap element parallel to the pipeline
longitudinal axis is controlled by the Coulomb friction law so it is proportional to the normal
force acting on the pipeline at each level of deformation. As an initial step, the displacements
required to activate the normal forces for at-rest conditions are imposed on the transverse
springs. With this adjustment, longitudinal frictional forces are activated to reflect at-rest
conditions in the absence of normal forces triggered by relative soil displacement normal to the
pipeline longitudinal axis. During simulation, incremental parallel and normal soil movements
are applied simultaneously at the longitudinal and transverse spring nodes on each side of the
pipeline elements.
Page 12 of 48
https://mc06.manuscriptcentral.com/cgj-pubs
Canadian Geotechnical Journal

Draft
13
Ground Movement Characterization
The settlement profile caused by tunneling under greenfield conditions in undrained clay,
where the soil exhibits constant volume deformation, has been shown by numerous investigators
(Peck 1969; O’Reilly and New 1982; Mair and Taylor 1997) to match a Gaussian curve of the
form
2
,max 2( ) exp
2v v
z
yS y S
i
−=
( 3 )
for which Sv(y) is settlement at distance y from the centerline, Sv,max is maximum centerline
settlement, and iz is horizontal distance from the tunnel centerline to the inflection point of the
Gaussian curve at a depth zo above the tunnel centerline, as illustrated in Fig. 10. The value of
i = Kzo, where K is an empirical constant related to ground conditions.
To account for decreasing i with depth, Mair et al. (1993) proposed an equation that was
expressed by Marshall et al. (2012) as
/ )( /
1
(
/
)t
p
s p
t
i z z z
z z
KK
∂ ∂
−
+=
( 4 )
where the trough width parameter is defined relative to K at the surface, Ks; the slope of i in
relation to depth, ∂i/∂z; distance from the ground surface to depth of interest, zp; and distance
from the ground surface to the depth of the tunnel axis, zt. Mair et al. (1993) recommended
Ks = 0.5 and ∂i/∂z = -0.325 for clays, while Mair and Taylor (1997) show that Ks ranges typically
from 0.25 to 0.45 for sands and gravels based on field measurements.
To conform to constant volume deformation, the magnitude of horizontal ground movement,
Sh, is commonly expressed by the following relationship
Page 13 of 48
https://mc06.manuscriptcentral.com/cgj-pubs
Canadian Geotechnical Journal

Draft
14
h v
R
yS S
z=
( 5 )
where y is the horizontal distance from tunnel centerline and zR is the distance from the depth of
interest to the radial focal point of ground movement vectors. The maximum horizontal
displacement, Sh,max, occurs at the settlement trough inflection point, iz, as illustrated in Figure
10.
To characterize ground movement in undrained clay, O’Reilly and New (1982) set zR = zo,
which implies that vectors of ground movement are directed toward the tunnel axis. The few
available case studies that provide reliable measurements of Sh indicate that the focal point of the
ground vectors varies, and for constant volume conditions, may be below the tunnel axis
(Cording, 1991; Hong and Bae 1995).
O’Reilly and New (1982) show by integration of Eqn. 3 that Sv,max=Vls/(iz√2π) where Vls is
the volume of the settlement profile per unit advance. Combining this relationship with Eqns. 3
and 5 provides expressions representing the vertical, Sv(y,z), and horizontal, Sh(y,z), components
of ground displacement across the transverse cross-section of the tunnel, as follows
2
2( , ) exp
22
lsv
zz
V yS y z
ii π
−=
( 6 )
2
2( , ) exp
22
lsh
R zz
Vy yS y z
z ii π
−=
( 7 )
Field measurements and centrifuge test results (Lake et al. 1996; Mair and Taylor 1997;
Osman et al. 2006) confirm that the Gaussian settlement profile is well represented for tunneling
in clays. Because of constant volume deformation in clay, the short-term settlement profile
volume, Vls, remains equal to volume loss at the tunnel. A notable exception pertains to
Page 14 of 48
https://mc06.manuscriptcentral.com/cgj-pubs
Canadian Geotechnical Journal

Draft
15
consolidation-induced volume loss caused by increased effective stresses resulting from long-
term drainage into the tunnel (Lake et al. 1996; Mair and Taylor 1997).
Tunneling induced volume losses in sand are considerably more complex than those in clay.
Field measurements (Cording and Hansmire 1975; Cording 1991) and centrifuge test results
(Marshall 2009; Marshall et al. 2012, and Zhou 2014) show that volume changes in sand are
influenced by depth, tunnel depth relative to diameter, volume loss at the tunnel, and soil density.
In contrast to clay, the assumption of constant volume loss in sands will underestimate volume
loss near the ground surface when loss in the tunnel is less than 1% and overestimate when
tunnel volume loss exceeds 2-3% (Marshall et al. 2012; Zhou 2014).
Selection of Vertical and Lateral Displacement Profiles
This paper concentrates on pipeline response to tunneling induced settlement and lateral
displacement transverse to the tunnel centerline. Mair and Taylor (1997) note that the
longitudinal settlement trough along a tunnel centerline in clay can be estimated with a
cumulative probability curve where the maximum settlement is the same as that in the transverse
settlement trough. Cording (1991) reports that the average slopes of both the longitudinal and
transverse settlement troughs were approximately equal for tunnels driven in the sand and gravel
terrace deposits of Washington, DC. Lake et al. (1992) report that the maximum slope,
curvatures, and horizontal strains for the longitudinal settlement profiles are significantly less
than those values for the transverse settlement trough as calculated for tunnels in many different
soil conditions.
Page 15 of 48
https://mc06.manuscriptcentral.com/cgj-pubs
Canadian Geotechnical Journal

Draft
16
On the basis of these observations, the most severe conditions of soil-pipeline interaction are
likely to be along the transverse settlement profile, with ground movement effects equal to or
less than those in the transverse section for all other pipeline orientations with respect to the
tunnel centerline. This generalization is corroborated by Lake et al. (1992), who note that the
transverse trough will usually represent the highest risk of damage to a structure.
In this work transverse settlement and lateral displacement profiles were selected to represent
relatively high levels of ground deformation for tunnels with a low soil cover to tunnel diameter
ratio, C/D, which is defined as the distance from ground surface to tunnel crown divided by the
excavated tunnel diameter. Soil movement profiles were chosen for C/D = 1.15 and a 6.1 m (20
ft) tunnel diameter in clay and sand, consistent in size to a rapid transit tunnel. A pipeline depth,
zp, of 0.9 m (36 in.) was chosen to represent typical burial conditions for pressurized pipelines
with Dp ≤ 300 mm (12 in.). The intention is to subject CI and DI pipelines to relatively high
levels of deformation to guide design and risk assessment and help identify potential difficulties.
Settlement and horizontal displacement profiles consistent with Eqns. 6 and 7 were used
along the pipeline, where i = Kzo and K = 0.5 in clay, and K = 0.28 in sand (Mair et al. 1993;
Marshall 2012). Tunnel volume loss in clay was limited to 5% of the tunnel cross-section as a
practical upper bound. Tunnel volume loss in sand was limited to 3% to avoid conditions that
promote concentrated settlement near the centerline and deviation from a Gaussian settlement
distribution (Cording 1991; Marshall et al. 2012). Centrifuge test results for medium to dense
sand (Marshall et al. 2012; Zhou 2014) show that surface and tunnel level volume losses are
relatively close when tunnel losses are less than 3%.
Page 16 of 48
https://mc06.manuscriptcentral.com/cgj-pubs
Canadian Geotechnical Journal
Draft
17
The focus of this work is on detailed modeling of pipeline and soil-pipeline interaction with
estimates of vertical and horizontal movement suitable for practical use. Alternative
mathematical formulations have been proposed for modeling the distribution of tunneling
induced settlement (Vorster et al. 2005; Marshall et al. 2012), but an evaluation of these
expressions is beyond current scope.
Pipeline Crossing the Width of the Settlement Profile
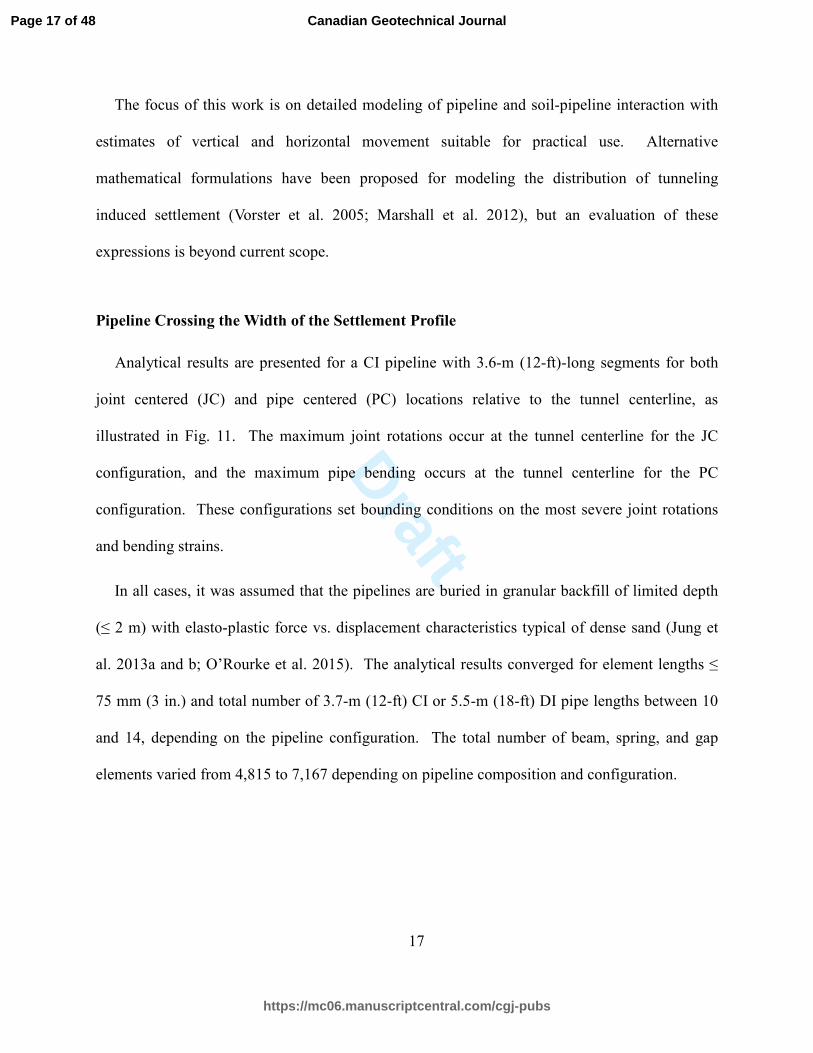
Analytical results are presented for a CI pipeline with 3.6-m (12-ft)-long segments for both
joint centered (JC) and pipe centered (PC) locations relative to the tunnel centerline, as
illustrated in Fig. 11. The maximum joint rotations occur at the tunnel centerline for the JC
configuration, and the maximum pipe bending occurs at the tunnel centerline for the PC
configuration. These configurations set bounding conditions on the most severe joint rotations
and bending strains.
In all cases, it was assumed that the pipelines are buried in granular backfill of limited depth
(≤ 2 m) with elasto-plastic force vs. displacement characteristics typical of dense sand (Jung et
al. 2013a and b; O’Rourke et al. 2015). The analytical results converged for element lengths ≤
75 mm (3 in.) and total number of 3.7-m (12-ft) CI or 5.5-m (18-ft) DI pipe lengths between 10
and 14, depending on the pipeline configuration. The total number of beam, spring, and gap
elements varied from 4,815 to 7,167 depending on pipeline composition and configuration.
Page 17 of 48
https://mc06.manuscriptcentral.com/cgj-pubs
Canadian Geotechnical Journal

Draft
18
Cast Iron Pipelines in Clay
In Figs. 12(a), (c), and (d) and Fig. 12(b) the maximum joint rotation and tensile strain,
respectively, are plotted relative to the centerline settlement, Sv,max, in clay. The maximum
tensile strain was determined from the addition of the axial and bending strains at all locations
along the pipeline.
Figure 12(a) shows maximum joint rotation vs. centerline settlement for 150-mm (6-in) and
300-mm (12-in.)-diameter pipelines with JC and PC configurations. For a given settlement and
pipe diameter, the maximum joint rotation for a JC configuration always exceeds that for a PC
configuration. For the same settlement, the rotations of the 300-mm-diamter pipelines more than
double those of the 150-mm-diameter pipelines. The initiation of joint leakage at 0.2° rotation in
150-mm-diamter pipelines occurs between 100 and 125 mm (4 and 5 in.) of centerline
settlement. Joint leakage initiation in 300-mm-diameter pipelines occurs between 50 and 75 mm
(2 and 3 in.) of centerline settlement. Only the 300-mm-diameter JC pipeline exceeds the 0.5°
maximum leakage threshold.
Figure 12(b) shows the maximum tensile strain vs. centerline settlement. In all cases the
tensile strains are below the allowable limit. Similarly, the pullout displacement in all cases is
below the axial movement associated with initial joint leakage. Typical pullout displacements
are shown for CI pipelines in sand under the next heading.
Figure 12(c) demonstrates the sensitivity of joint rotation to the modulus of the CI pipe. As
the modulus increases from 76 to 128 GPa (11,000 to 18,500 ksi), the maximum joint rotation
increases for the same Sv,max. Figure 12(b) shows little change in tensile strain in the 150-mm-
diameter pipeline for a given settlement, reflecting nearly constant bending moment for the range
Page 18 of 48
https://mc06.manuscriptcentral.com/cgj-pubs
Canadian Geotechnical Journal

Draft
19
of E pertaining to pit and centrifugally cast iron. For small strains, the pipe curvature κ = M/EI
where M, E, and I are the moment, modulus, and moment of inertia of the pipe. Since M does
not change with E, the curvature, κ, decreases as E increases. Less pipe curvature results in
increased joint rotation, as illustrated in the figure.
Figure 12(d) shows maximum joint rotation vs. centerline settlement for a 150-mm-diameter
pipeline with a JC configuration. The different plots correspond to the mean as well as the 10%,
and 90% exceedance levels, associated with the normal cumulative distribution of CI-lead
adhesion, CA, plotted in Fig. 2. For a given level of settlement, the strongest and stiffest joints
with 90% exceedance levels for CA reduce rotation by about one third relative to the weakest
joints with 10% exceedance levels. The figure also shows the rotations for joints with no
rotational stiffness, thus setting an upper bound for rotation. The moment mobilized in CI joints
reduces rotation to about half the value associated with zero-moment, or pinned, connections.
Cast Iron Pipelines in Sand
Figure 13 shows plots similar to those in Fig. 12 for CI pipelines in sand. Tunneling in sand
results in a narrower settlement profile with i = 2.6 m (8.5 ft), nearly one-half i = 4.73 m (15.5 ft)
for clay. As expected for a narrower settlement profile, CI joint rotations are larger than those for
the same centerline settlement in clay for similar size pipe and joint configuration (i.e., JC and
PC conditions). Figure 13(a) shows that, for a given settlement and pipe diameter, the maximum
joint rotation for a JC configuration always exceeds that for a PC configuration. The same trend
is shown in Fig. 12. Of particular note, the centerline settlements decrease for limit state
rotations of 0.2° and 0.5°. The centerline settlements, which trigger maximum leakage at 0.5°,
Page 19 of 48
https://mc06.manuscriptcentral.com/cgj-pubs
Canadian Geotechnical Journal
Draft
20
are as low as 30 and 60 mm (1.2 and 2.4 in.) for 300-mm and 150-mm-diameter pipelines,
respectively.
Figure 13(b) shows the maximum tensile strains vs. centerline settlement. Consistent with the
trends in Fig. 12, maximum tensile strains are larger than those for the same centerline
settlements in clay for similar size pipe and joint configurations. The allowable tensile strain of
600µε is exceeded for PC configurations at approximately 55 and 60 mm (2.2 and 2.5 in.)
centerline settlement for 150-mm and 300-mm-diameter pipelines, respectively. Similar to the
results for clay, the pullout displacements in all cases are below the axial movement associated
with initial joint leakage, and are not plotted in the figure.
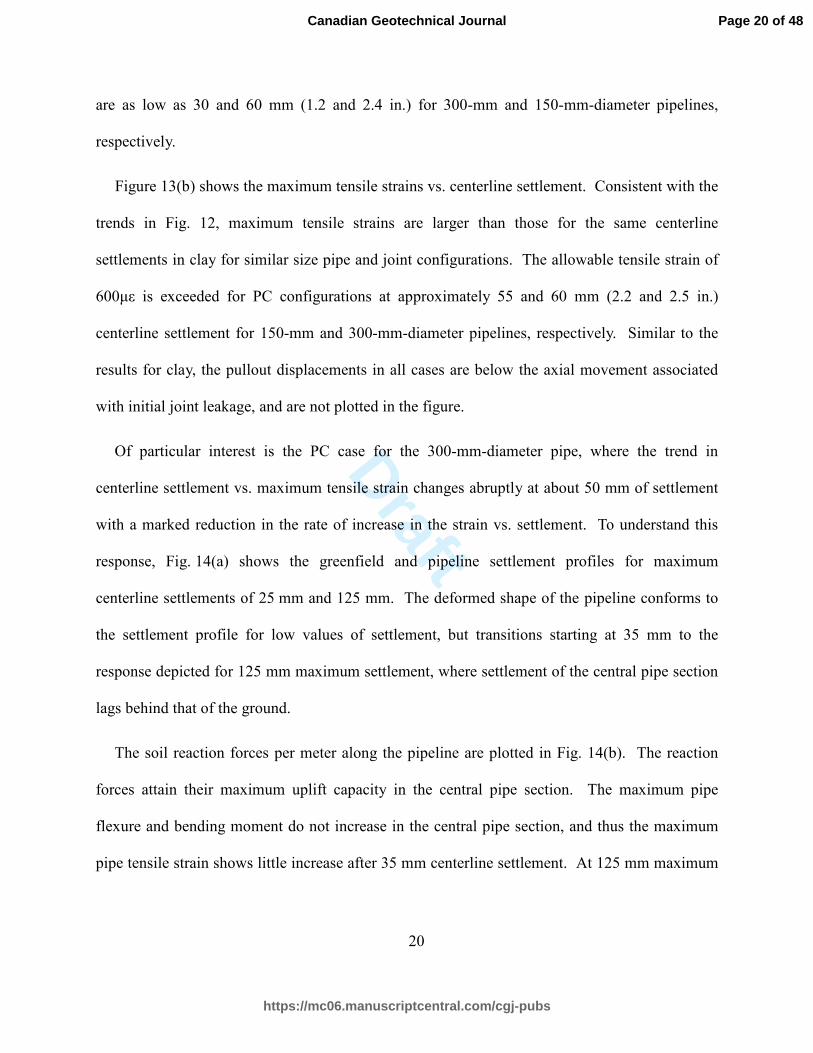
Of particular interest is the PC case for the 300-mm-diameter pipe, where the trend in
centerline settlement vs. maximum tensile strain changes abruptly at about 50 mm of settlement
with a marked reduction in the rate of increase in the strain vs. settlement. To understand this
response, Fig. 14(a) shows the greenfield and pipeline settlement profiles for maximum
centerline settlements of 25 mm and 125 mm. The deformed shape of the pipeline conforms to
the settlement profile for low values of settlement, but transitions starting at 35 mm to the
response depicted for 125 mm maximum settlement, where settlement of the central pipe section
lags behind that of the ground.
The soil reaction forces per meter along the pipeline are plotted in Fig. 14(b). The reaction
forces attain their maximum uplift capacity in the central pipe section. The maximum pipe
flexure and bending moment do not increase in the central pipe section, and thus the maximum
pipe tensile strain shows little increase after 35 mm centerline settlement. At 125 mm maximum
Page 20 of 48
https://mc06.manuscriptcentral.com/cgj-pubs
Canadian Geotechnical Journal

Draft
21
settlement, the uplift reaction attains its maximum value at the second pipeline joint from the
centerline, where upward deformation and joint rotation occur.
As shown in Fig. 14(c), the maximum tensile strain in the central pipe section increases from
a maximum settlement of 25 mm to 125mm, but the rate of increase is reduced after 35 mm
centerline settlement due to the relatively constant soil reaction force/m on the central pipe
section. The tensile strains increase outside the inflection point of the settlement profile, where
concave curvatures of the pipeline and settlement profile are increasing. At 125 mm of
centerline settlement the tensile strains inside and outside the inflection point are nearly equal.
At larger centerline settlement the maximum tensile strain occurs outside the inflection point.
Ductile Iron Pipeline in Sand
Figure 15 presents the maximum joint rotations and tensile strains for 150-mm-diameter DI
pipelines in sand vs. centerline settlements. Given the high capacity for rotation, high yield
strength, and ductility of DI pipelines, the more severe ground deformation associated with sand
was selected for analysis. Three joint configurations were evaluated, including JC, PC, and an
intermediate case where the DI joint is offset one quarter of the 5.5-m (18-ft) pipe length from
the tunnel centerline.
In all cases, joint rotations are well under the limits for metal binding and far less than the
rotational capacity at first leakage. The maximum joint pullout (not shown) was less than 5 mm
(0.2 in.), well below the 50 mm (2 in.) allowable pullout for joint leakage. Likewise, the tensile
strains are well below the 3500µε associated with the yield stress of DI pipe (ASTM 2015). For
Page 21 of 48
https://mc06.manuscriptcentral.com/cgj-pubs
Canadian Geotechnical Journal

Draft
22
the 125-mm maximum settlement, the maximum bending strain is less than the 1500µε
proportional limit of DI (maximum strain for constant E).
Pipelines with Tees
Figure 16 shows a transverse cross-section of a tunnel and settlement profile affecting a
branch pipeline connected through a 90° tee to another pipeline parallel to the longitudinal axis
of the tunnel. A plan view of the tee and interconnecting parallel and branch pipelines is also
shown.
Figure 17 presents a simplified 3D view of the tee. A concrete thrust clock is often placed
adjacent to the tee to resist unbalanced force from internal water pressure. For CI pipelines and
tees the thrust block resistance and torque combined from the two joints connecting with the
parallel pipeline will resist the overturning moment at the joint induced by differential settlement
of the branch pipeline. As discussed by Wham (2016) the tee tends to settle without rotation for
both CI and DI pipelines and tees. Thus, no rotation of the tee was assumed in the FE
simulations.
Cast Iron Tees
By extracting the maximum pullouts, rotations, and tensile strains from multiple simulations
of tunneling movement effects on tees at different distances with respect to the tunnel centerline,
the centerline settlements associated with joint pullout and rotational limits were identified and
plotted with respect to tee location from the centerline in Figs. 18(a) and (b) for tunneling in clay
and sand, respectively. Following a similar approach, the centerline settlements required to
develop the allowable CI tensile strain are plotted in Fig. 19.
Page 22 of 48
https://mc06.manuscriptcentral.com/cgj-pubs
Canadian Geotechnical Journal

Draft
23
In Figs. 18(a) and (b) a range of 0.5 to 1.0 mm (0.02 to 0.04 in.) is used to bracket the axial
slip at first leakage. For both clay and sand, the CI tees are susceptible to pullout-related leakage
at low centerline settlements of approximately 10-15 mm (0.4-0.6 in.) when the tee is located
between horizontal distances of 0.5i to 2i from the tunnel centerline. Low settlements of about
15 mm (0.6 in.) are associated with rotation at first leakage in sand when the tee is located a
horizontal distance i from the tunnel centerline. For all cases in Figure 19 the centerline
settlements required to exceed the allowable CI tensile strain are well above those that exceed
the pullout and rotational limit states.
Figure 18 shows high susceptibility to leakage from pullout when CI tees are located between
0.5i and 2i from the tunnel centerline. The maximum tunnel settlements associated with the
initiation of leakage are sufficiently low that tee locations anywhere within the settlement trough
(≅2.5i) should be regarded as highly vulnerable to tunneling induced movement.
Ductile Iron Tees
To explore the susceptibility of DI tees to pullout, the analytical results for maximum pullout
at 120-mm (4.8-in.) of centerline settlement is plotted with respect to tee location in Fig. 20. The
tee location is expressed in terms of horizontal distance from the tunnel centerline normalized by
i for clay and sand. Both an unrestrained tee and a tee restrained from pullout at its connection
with a 150-mm-diameter branch pipeline were modeled.
Figure 20 shows that maximum pullout occurs when the tee is at or near the inflection point, i,
in all cases simulated. At all tee locations the maximum pullout is slightly higher in sand than
clay. The largest pullouts occur for restrained tees at the next joint of the branch pipeline.
Page 23 of 48
https://mc06.manuscriptcentral.com/cgj-pubs
Canadian Geotechnical Journal

Draft
24
Restraining the tee from pullout actually reduces the degrees of freedom available in the branch
pipeline to accommodate lateral ground movement. Thus, more separation is induced in the
branch pipeline joints for a restrained vs. an unrestrained tee.
All analytical results for DI tees were examined for combined joint pullout and rotation and
compared with the metal binding and pressure boundaries presented in Fig. 7. Although some
limited cases show pullout on the order of 70 to 80% of push-on joint pullout capacity, all
combinations of pullout and rotation were below both the metal binding and pressure boundaries
in Fig. 7.
Conclusions
The response of jointed CI and DI pipelines to tunneling induced ground deformation is
evaluated for pipelines that 1) cross the width of settlement profile perpendicular to the tunnel
centerline, and 2) connect through 90° tees with a pipeline parallel to the tunnel centerline. The
modeling involves 2D finite element analyses that account rigorously for coupled forces both
parallel and perpendicular to the pipeline, and incorporates the results of large-scale laboratory
tests to characterize the axial force vs. displacement and moment vs. rotation relationships of DI
and CI joints commonly encountered in practice. Tunneling induced soil displacement profiles
were modeled for a 6.1-m (20-ft)-diameter tunnel in clay and another in sand with a cover to
depth ratio, C/D, of 1.15 affecting 150-mm and 300-mm (6 and 12-in.)-diameter CI and DI
pipelines.
The research findings reported herein are directly applicable to CI and DI pipelines with
nominal diameters less than or equal to 300 mm (12 in.), which covers over 90% of water
distribution and 99% of gas distribution pipelines in the U.S. General results from the research
Page 24 of 48
https://mc06.manuscriptcentral.com/cgj-pubs
Canadian Geotechnical Journal

Draft
25
can be used to guide risk assessment, design, and utility operations for pipelines as large as 600
mm (24 in.) in nominal diameter.
With respect to jointed CI and DI pipeline performance, the principal observations and
conclusions are
• The limit states for first leakage in lead-caulked CI joints are related to measured
deformation, or slip, between the lead and CI surfaces within the joints at 0.5 mm (0.02
in.) of axial pullout and approximately 0.2° of joint rotation. Moment vs. rotation test
results for 100-mm, 150-mm, and 200-mm (4-in., 6-in. and 8-in,)-diameter lead-caulked
CI joints taken from the field after 50 to 80 years of operation show that leakage under
typical operating pressure peaks initially at about 0.5° rotation and declines thereafter
until leakage again increases at rotations in the range of 3 to 4°.
• Equations for evaluating the CI pullout force and moment at first leakage are provided,
which are related to the CI-lead adhesion, CA. Data for CA from large-scale pullout tests
are shown to follow a normal distribution, thus allowing for the quantification of
uncertainty in pullout force and moment to initiate leakage.
• The CI joints display complex behavior in which additional slip and creep of the lead can
close off leakage paths that are reopened with further increase in deformation. Thus, the
slip and rotation at incipient leakage can be identified, but a clear and consistent trend in
leakage after its initiation cannot be quantified with the available experimental evidence.
For jointed CI and DI pipelines that extend beyond the width of the settlement profile, the
principal observations and conclusions drawn from the analytical results are:
Page 25 of 48
https://mc06.manuscriptcentral.com/cgj-pubs
Canadian Geotechnical Journal

Draft
26
• Pipeline response evaluated in this work corroborates the findings of many other
investigators (Attewell et al. 1986; Klar et al. 2005; Wang et al. 2011) that both joint
rotations and pipe strains are sensitive to i, the horizontal distance from the tunnel
centerline to the inflection point of the settlement trough. Moreover, since i tends to be
smaller in sands relative to clays for the same tunnel diameter and depth, pipelines will be
more vulnerable in sands for the same centerline settlement, tunnel diameter, and depth
conditions. This work, although focused on limited tunnel size and depth considerations,
helps to quantify pipeline and tee response to i by using detailed full-scale test data and
modeling of CI and DI limit states. Additional investigation of pipeline response to
variations in i and other ground movement parameters, using the pipeline limit states in
this work, is recommended.
• The response to tunneling in sand is accompanied by joint rotations and maximum tensile
strains that exceed those in clay by a factor as high as two to three for the same centerline
settlement and pipe diameter. This difference is related to the narrower settlement profile
and smaller i in sand that generate larger differential settlements and curvatures.
• For the tunneling conditions examined in this work, CI joint rotation at first leakage in
clay occurs between 50 and 120 mm (2.0 and 4.8 in.) of centerline settlement, and
depends on both the pipe diameter and location of the joints with respect to tunnel
centerline. For sand the threshold of incipient leakage is exceeded at centerline
settlements on the order of 25 mm (1 in.).
Page 26 of 48
https://mc06.manuscriptcentral.com/cgj-pubs
Canadian Geotechnical Journal

Draft
27
• Allowable tensile strain levels for pit cast iron pipe were not exceeded for centerline
settlements in clay as high as 120 mm (4.8 in.), but were exceeded at centerline
settlements in sand of approximately 50-100 mm (2-4 in.).
• For DI pipelines joint rotations were well under the limits for metal binding and far less
than the rotational capacity at first leakage. Joint pullout was minimal, and maximum
tensile strains were below yield conditions.
For jointed pipelines, which connect through 90° tees with a pipeline parallel to the tunnel,
the principal observations and conclusions are:
• The susceptibility to leakage from pullout when CI tees are located between 0.5i and 2i
from the tunnel centerline (where i is the location of the settlement profile inflection
point) is sufficiently low that tee locations within the settlement trough (≅ 2.5i) should be
regarded as highly vulnerable to the effects of tunneling.
• The largest pullouts for DI pipelines with unrestrained and restrained tees occur at a
distance close to the inflection point, i, from the tunnel centerline. Moreover, the largest
pullouts occur for restrained tees. Restraining the tee from pullout actually reduces the
degrees of freedom available in the branch pipeline to accommodate lateral soil
movement.
• Although DI pipelines have substantially higher capacity against leakage than CI
pipelines at tees, some cases examined in this work show pullout on the order of 70 to
80% of push-on joint pullout capacity. Given the absence of pullout resistance in push-
on joints, tees should always be checked as a potential risk with respect to tunneling
induced ground deformation.
Page 27 of 48
https://mc06.manuscriptcentral.com/cgj-pubs
Canadian Geotechnical Journal

Draft
28
The observations and conclusions apply for CI and DI pipelines without significant corrosion
and material defects. The effects of corrosion and defects are beyond the scope of this work, but
should always be considered when evaluating pipeline performance in the field.
Page 28 of 48
https://mc06.manuscriptcentral.com/cgj-pubs
Canadian Geotechnical Journal

Draft
29
REFERENCES
ABAQUS 6.13. 2014. [Computer software]. Providence, RI, ABAQUS.
ASCE. 1984. Guidelines for the seismic design of oil and gas pipeline systems. Committee on
Gas and Liquid Fuel Lifelines, American Society of Civil Engineers: Reston, VA.
ASTM. 2015. “Standard test methods for tension testing of metallic material.” E8/E8M-15a,
West Conshohocken, PA.
Attewell, P. B., Yeates, J., and Selby, A. R. 1986. Soil movements induced by tunnelling and
their effects on pipelines and structures, Chapman & Hall, New York.
AWWA. 2009. “Ductile iron pipe, centrifugally cast, for water.” American Water Works
Association Standard: ANSI/AWWA C151/A21.51-09, Denver, CO.
Bouziou, D. 2015. Earthquake-induced ground deformation effects on buried pipelines. PhD
Thesis. Cornel University, Ithaca, NY.
Cording, E. J. and Hansmire, W. H. 1975. “Displacements around soft ground tunnels.” General
Report 5th Pan American Conference on Soil Mechanics and Foundation Engineering,
Buenos Aires, Session IV 571-632.
Cording, E. J. 1991. “Control of ground movements around tunnels in soil.” Proc. 9th Pan-
American Conf. Soil Mech. Found. Engng, Valparaiso, 2195–2244.
Davis, C. 2015. Resilience Manager, Los Angeles Department of Water and Power, personal
communication.
Harris, C. W., and O’Rourke, T. D. 1983. “Response of jointed cast iron pipelines to parallel
trench construction.” Geotechnical Engineering Rep. 83-5, School of Civil and
Environmental Engineering, Cornell Univ., Ithaca, NY.
Page 29 of 48
https://mc06.manuscriptcentral.com/cgj-pubs
Canadian Geotechnical Journal

Draft
30
Honegger, D. and Nyman, D. J. 2004. Guidelines for the Seismic Design and Assessment of
Natural Gas and Liquid Hydrocarbon Pipelines. Pipeline Research Council
International; Catalog No. L51927.
Hong, S. W. and Bae, G. J. 1995. “Ground movements associated with subway tunnelling in
Korea.” Proc. Underground Construction in Soft Ground. Rotterdam: AA Balkema,
229-232.
Johnson, J. B. 1890. “Cast-iron-strength, resilience, tests and specifications.” Trans. Am. Soc.
Civil Eng., XXII(1), 91–120.
Jung, J.K., O’Rourke, T.D., and Argyrou, C. 2016. “Multi-directional force-displacement
response of underground pipe in sand”, Can. Geotech. J. Special Issue on Pipeline
Geotechnics.
Jung, J. K., O’Rourke, T. D., and Olson, N. A. 2013a. “Uplift soil–pipe interaction in granular
soil.” Can. Geotech. J. 50(7), 744-753.
Jung, J. K., O’Rourke, T. D., and Olson, N. A. 2013b. “Lateral soil-pipe interaction in dry and
partially saturated sand.” J. of Geotech. Geoenviron. Engng ASCE. 139(12), 2028-
2036.
Klar, A. and Marshall, A. M. 2015. “Linear elastic tunnel pipeline interaction: the existence and
consequence of volume loss equality.” Géotechnique. 65(9), 788-792.
Klar, A., Vorster, T. E. B., Soga, K. and Mair, R. J. 2005. “Soil–pipe interaction due to
tunnelling: comparison between Winkler and elastic continuum solutions.”
Géotechnique. 55(6), 461–466.
Klar. A., Vorster, T.E.B., Soga, K., and Mair, R.J. 2007 “Elastoplastic solution for soil-pipe-
tunnel interaction”, J. Geotech. Geoenviron. Engng 133(7), 782–792.
Klar, A., Marshall, A. M., Soga, K. and Mair, R. J. 2008. “Tunneling effects on jointed
pipelines.” Can. Geotech. J., 45(1), 131–139.
Page 30 of 48
https://mc06.manuscriptcentral.com/cgj-pubs
Canadian Geotechnical Journal

Draft
31
Lake, L. M., Rankin, W. J., and Hawley, J. 1996. Prediction and effects of ground movements
caused by tunnelling in soft ground beneath urban areas. CIRIA.
Lilliefors, H. W. 1967. “On the Kolmogorov-Smirnov test for normality with mean and variance
unknown.” Journal of the American Statistical Association, 62(318), 399-402.
Mair, R. J., Taylor, R. N. and Bracegirdle, A. 1993. Subsurface settlement profiles above tunnels
in clays.” Géotechnique. 43(2), 315-320.
Mair, R. J. and Taylor, R. N. 1997. Bored tunnelling in the urban environment. Proc. 14th Int.
Conf. Soil Mech. Found. Engng, Hamburg, 4, 2353–2385.
Marshall, A. 2009. Tunnelling in sand and its effect on pipelines and piles. PhD Thesis,
Engineering Department, University of Cambridge, UK.
Marshall, A., Klar, A., and Mair, R. 2010. “Tunneling beneath buried pipes: view of soil strain
and its effects on pipeline behavior.” J. Geotech. Geoenviron. Engng 136(12), 1664-
1672.
Marshall, A., Farrell, R., Klar, A., and Mair, R. 2012. “Tunnels in sands: the effect of size, depth
and volume loss on Greenfield displacements.” Géotechnique. 62(5), 385–399.
Massachusetts Administrative Code, Public Utilities. 2006. Title 220, Section 113.
New York Administrative Code, Public Services. 2006. Title 16, Section 255.757.
O’Reilly, M. P. and New, B. M. 1982. “Settlements above tunnels in the United Kingdom: their
magnitude and prediction.” Proc. Tunnelling ’82, Brighton, 173–181.
O’Rourke, T. D. 2010. “Geohazards and large geographically distributed systems.” 2009
Rankine Lecture. Géotechnique. 60(7), 503-543.
O’Rourke, T. D., Jezerski, J. M., Olson, N. A., Bonneau, A. L., Palmer, M. C., Stewart, H. E.,
O’Rourke, M. J., and Abdoun T. 2008. “Geotechnics of pipeline system response to
Page 31 of 48
https://mc06.manuscriptcentral.com/cgj-pubs
Canadian Geotechnical Journal

Draft
32
earthquakes.” Geotech. Earthquake Engng. and Soil Dynamics IV (GEESD),
Sacramento, CA.
O’Rourke, T. D., Jung, J. K. and Argyrou, C. 2015. “Underground infrastructure response to
earthquake-induced ground deformation.” Proc. 6th Int. Conf. on Earthquake Geotech.
Eng. Christchurch.
O'Rourke, T. D. and Kumbhojkar, A. S. 1984. Field Testing of Cast Iron Pipeline Response to
Shallow Trench Construction. Cornell University.
O’Rourke, T. D., Netravali, A. N., Pendharkar, S. M., Toprak, S., Tonkinson, A., and Chaudhuri,
D. 1996. “Evaluating service life of anaerobic joint sealing products and techniques.”
Final Rep. 96/0318, Gas Research Institute, Chicago.
O’Rourke, T. D., and Trautmann, C. H. 1980. “Analytical modeling of buried pipeline response
to permanent earthquake displacements.” Rep. 80-4, School of Civil and Environmental
Engineering, Cornell Univ., Ithaca, NY.
Osman, A. S., Mair, R. J., and Bolton, M. D. 2006. “On the kinematics of 2D tunnel collapse in
undrained clay.” Géotechnique. 56(9), 585-595.
Peck, R. B. 1969. “Deep excavations and tunnelling in soft ground.” Proc. 7th Int. Conf. Soil
Mech. Found. Engng., Mexico City, 225–290.
Pipeline Safety and Hazardous Materials Administration [PHMSA]. 2015. Data and Statistics
http://www.phmsa.dot.gov/pipeline/library/data-stats (accessed 30 Nov. 2015).
Prior, J. C. 1935. Investigation of bell and spigot joints in cast-iron water pipes. Part I-Pullout
strength. Part II-Bell strength. Part III-Harness strength, College of Engineering, Ohio
State Univ., Columbus, OI.
Rajani, B. and Abdel-Akher, A. 2013. “Performance of cast-iron-pipe bell-spigot joints subjected
to overburden pressure and ground movement.” J. Pipeline Syst. Eng. Pract. ASCE
4(2), 98-114.
Page 32 of 48
https://mc06.manuscriptcentral.com/cgj-pubs
Canadian Geotechnical Journal

Draft
33
Schlick, W. J. and Moore, B. A. 1936. “Strength and elastic properties of cast iron in tension,
compression, flexure, and combined tension and flexure,” Bulletin 127, Iowa
Engineering Experiment Station, Ames, IA.
Stewart, H. E., O’Rourke, B. J., O’Rourke, T. D., and New, B. M. 1989. “Evaluation of cast iron
pipeline response at excavation crossings.” Geotechnical Engineering Rep. 89-1,
School of Civil and Environmental Engineering, Cornell Univ., Ithaca, NY.
Taki, H., and O’Rourke, T. D. 1984. “Factors affecting the performance of cast iron pipe.”
Geotechnical Engineering Rep. 84-1, School of Civil and Environmental Engineering,
Cornell Univ., Ithaca, NY.
Vorster, T. E. B., Klar, A., Soga, K. and Mair, R. J. 2005. “Estimating the effects of tunneling on
existing pipelines.” J. Geotech. Geoenviron. Engng 131(11), 1399–1410.
Wang, Y., Shi, J., and Ng, C. W. W. 2011. “Numerical modeling of tunneling effect on buried
pipelines.” Can. Geotech. J., 48(7), 1125-1137.
Wham, B. P. 2016. Jointed pipeline response to large ground movements. PhD Thesis. School of
Civil and Environmental Engineering, Cornell University, Ithaca, NY.
Wham, B. P. and O’Rourke, T. D. 2015. “Jointed pipeline response to large ground
deformation.” J. Pipeline Syst. Eng. Pract., 04015009.
Zhou, B. 2014. Tunelling-induced ground displacements in sand. PhD Thesis, Department of
Engineering, University of Nottingham, Nottingham, UK.
Page 33 of 48
https://mc06.manuscriptcentral.com/cgj-pubs
Canadian Geotechnical Journal

Draft
34
LIST OF FIGURES
Figure 1. Cross-section of a typical CI joint
Figure 2. Cumulative frequency plot of CI-lead adhesion at first leakage in CI joints
Figure 3. Normalized joint pullout force vs. axial displacement for lead-caulked CI joints
Figure 4. Sample size and leakage rate exceedance levels for 100, 150, and 200-mm (4, 6, and 8-in.)
diameter CI joint specimens (adapted from Harris and O’Rourke 1983)
Figure 5. (a) Normalized moment-rotation relationships for 150 and 500-mm (6 and 20-in.) diameter
CI joints and (b) expanded view of rotation at first slip
Figure 6. Typical 150-mm (6-in.) DI Joint cross-section with 5° rotation
Figure 7. Pressure boundary for leakage of 150-mm (6-in.) diameter DI joint as a function of
normalized joint rotation and axial displacement (adapted from Wham and O’Rourke 2015)
Figure 8. (a) Schematic of FE model and (b) bilinear force vs. displacement relationships at pipe-soil
interface based on the elasto-plastic models recommended by ASCE (1984) and Honegger
and Nyman (2004) [after Bouziou 2015]
Figure 9. Schematic of enhanced 2D FE model including tee joint
Figure 10. Transverse view of tunnel with settlement and horizontal movement distributions at depth of
pipeline
Figure 11. Illustration of joint centered and pipe centered pipeline configurations
Figure 12. Continuous jointed CI pipeline results for clay settlement profile: (a) maximum joint
rotation, (b) maximum tensile strain, (c) 150-mm (6-in.) joint rotation with varying CI
modulus, and (d) maximum joint rotation for JC 150-mm (6-in.) with varying CI-lead
adhesion, CA
Figure 13. Maximum (a) joint rotation and (b) tensile strain along continuous jointed CI pipeline for
joint centered and pipe centered configurations in sand settlement profile
Page 34 of 48
https://mc06.manuscriptcentral.com/cgj-pubs
Canadian Geotechnical Journal

Draft
35
Figure 14. Continuous jointed 300 mm CI pipe (a) vertical displacement, (b) soil pressure, and (c)
maximum tensile strain vs. distance from tunnel centerline at vertical displacements of 25
and 125 mm (1 and 5 in.) in sand
Figure 15. Maximum (a) joint rotation and (b) tensile strain results of 150-mm (6-in.) continuous DI
pipe for joint and pipe centered configurations in sand profile
Figure 16. Illustration of tunnel cross-section, settlement trough and parallel pipeline with tee
connection
Figure 17. 3D illustration of typical CI tee joint
Figure 18. Centerline settlement in clay and sand associated with exceeding CI tee pullout and
rotational limits as a function of tee location from the tunnel centerline
Figure 19. Centerline settlement in clay and sand associated with exceeding the allowable CI tensile
strain as a function of tee location from the tunnel centerline
Figure 20. Maximum DI joint pullout in clay and sand as a function of normalized tee location
Page 35 of 48
https://mc06.manuscriptcentral.com/cgj-pubs
Canadian Geotechnical Journal

Draft
35
FIGURES
Figure 1. Cross-section of a typical CI joint
Figure 2. Cumulative frequency plot of CI-lead adhesion at first leakage in CI joints
0.0 0.7 1.4 2.1 2.8 3.5
0
10
20
30
40
50
60
70
80
90
100
0 0.1 0.2 0.3 0.4 0.5
(MPa)
Cu
mm
ula
triv
e F
req
uen
cy
Lead-Caulk Adhesion at First Slip, CA (ksi)
Experimental
Results
Cummulative
Distribution
= 1.63 MPa
(0.236 ksi)
σ = 0.49 MPa
(0.071 ksi)
n = 17
Page 36 of 48
https://mc06.manuscriptcentral.com/cgj-pubs
Canadian Geotechnical Journal

Draft
36
Figure 3. Normalized joint pullout force vs. axial displacement for lead-caulked CI joints
Figure 4. Sample size and leakage rate exceedance levels for 100, 150, and 200-mm (4, 6, and 8-in.)
diameter CI joint specimens (adapted from Harris and O’Rourke 1983)
0
3
6
9
12
15
18
21
24
0.0
0.5
1.0
1.5
2.0
2.5
3.0
3.5
4.0
0 0.5 1 1.5 2 2.5
Nu
mb
er o
f S
amp
les
Lea
kag
e (c
m3/s
)
Joint Rotation (degrees)
10% Exceedance
25% Exceedance
50% Exceedance
60% Exceedance
75% Exceedance
90% Exceedance
Number of Tests
Page 37 of 48
https://mc06.manuscriptcentral.com/cgj-pubs
Canadian Geotechnical Journal

Draft
37
(a) (b)
Figure 5. (a) Normalized moment-rotation relationships for 150 and 500-mm (6 and 20-in.) diameter CI
joints and (b) expanded view of rotation at first slip
Figure 6. Typical 150-mm (6-in.) DI Joint cross-section with 5° rotation
Page 38 of 48
https://mc06.manuscriptcentral.com/cgj-pubs
Canadian Geotechnical Journal

Draft
38
Figure 7. Pressure boundary for leakage of 150-mm (6-in.) diameter DI joint as a function of normalized
joint rotation and axial displacement (adapted from Wham and O’Rourke 2015)
Page 39 of 48
https://mc06.manuscriptcentral.com/cgj-pubs
Canadian Geotechnical Journal

Draft
39
Figure 8. (a) Schematic of FE model and (b) bilinear force vs. displacement relationships at pipe-soil
interface based on the elasto-plastic models recommended by ASCE (1984) and Honegger and
Nyman (2004) [after Bouziou 2015]
Figure 9. Schematic of enhanced 2D FE model including tee joint
(a)
(b)
Force
Displacement
2
zf-
2
zδ-1
zδ
1
zf
Displacement
Force
fy
-fy
-δy
δy
Force
fx
-fx
-δx
Displacementδx
DETAIL A
Lined Joint
35mm 3.5m
DETAIL A
Lined Joint
Legend:
Pipe Element
Soil pipe interface
represented by
spring-slider
Node for input of
soil displacement
Axial pipe joint represented by
spring - slider
z
xy
DETAIL A
Lined Joint
35mm3.5mDETAIL A
Lined JointLegend:
Pipe Element
Soilpipeinterface representedby spring-slider
Node for input of soil displacement
Axial pipe joint represented by spring -slider
DETAIL A
Lined Joint
35mm3.5mDETAIL A
Lined JointLegend:
Pipe Element
Soilpipeinterface representedby spring-slider
Node for input of soil displacement
Axial pipe joint represented by spring -slider
DETAIL A
Lined Joint
35mm3.5mDETAIL A
Lined JointLegend:
Pipe Element
Soilpipeinterface representedby spring-slider
Node for input of soil displacement
Axial pipe joint represented by spring -slider
DETAIL A
Lined Joint
35mm3.5mDETAIL A
Lined JointLegend:
Pipe Element
Soilpipeinterface representedby spring-slider
Node for input of soil displacement
Axial pipe joint represented by spring -slider
DETAIL A
Lined Joint
35mm3.5mDETAIL A
Lined JointLegend:
Pipe Element
Soilpipeinterface representedby spring-slider
Node for input of soil displacement
Axial pipe joint represented by spring -slider
DETAIL A
Lined Joint
35mm 3.5m
DETAIL A
Lined Joint
Legend:
Pipe Element
Soil pipe interface
represented by
spring-slider
Node for input of
soil displacement
Axial pipe joint represented by
spring - slider
DETAIL A
Lined Joint
35mm 3.5m
DETAIL A
Lined Joint
Legend:
Pipe Element
Soil pipe interface
represented by
spring-slider
Node for input of
soil displacement
Axial pipe joint represented by
spring - slider
DETAIL A
Lined Joint
35mm 3.5m
DETAIL A
Lined Joint
Legend:
Pipe Element
Soil pipe interface
represented by
spring-slider
Node for input of
soil displacement
Axial pipe joint represented by
spring - slider
DETAIL A
Lined Jo
int
35mm
3.5m
DETAIL A
Lined Jo
int
Legen
d:Pipe Elem
ent
Soilpipe
interfac
e
repres
ented
by
sprin
g-slider
Node for i
nput of
soil d
isplac
emen
t
Axial pipe j
oint repres
ented
by
sprin
g -slider
DETAIL A
Lined Joint
35mm
3.5m
DETAIL A
Lined Joint
Legend:
Pipe Element
Soilpipeinterface
represented
by
spring-slider
Node for input of
soil displacement
Axial pipe joint represented by
spring -slider
DE
TA
IL A
Lin
ed Jo
int
35
mm
3.5
m
DE
TA
IL A
Lin
ed Jo
int
Leg
end
:
Pip
e Elem
ent
So
ilp
ipe
interface
represen
tedb
y
sprin
g-slid
er
No
de fo
r inp
ut o
f
soil d
isplacem
ent
Ax
ial pip
e join
t represen
ted b
y
sprin
g -
slider
DETAIL A
Lined Joint
35mm
3.5m
DETAIL A
Lined Joint
Legend:
Pipe Element
Soilpipeinterface
represented
by
spring-slider
Node for input of
soil displacement
Axial pipe joint represented by
spring -slider
DE
TA
IL A
Lin
ed Jo
int
35
mm
3.5
m
DE
TA
IL A
Lin
ed Jo
int
Leg
end
:
Pip
e Elem
ent
So
ilp
ipe
interface
represen
tedb
y
sprin
g-slid
er
No
de fo
r inp
ut o
f
soil d
isplacem
ent
Ax
ial pip
e join
t represen
ted b
y
sprin
g -
slider
Kx
Kx
Kx
Ky
Ky
Ky
2
z
1
z K,K2
z
1
z K,K
2
z
1
z K,K
DETAIL A
Lined Joint
35mm3.5mDETAIL A
Lined JointLegend:
Pipe Element
Soilpipeinterface representedby spring-slider
Node for input of soil displacement
Axial pipe joint represented by spring -slider
Legend DETAIL A
Lined Joint
35mm 3.5m
DETAIL A
Lined Joint
Legend:
Pipe Element
Soil pipe interface
represented by
spring-slider
Node for input of
soil displacement
Axial pipe joint represented by
spring - slider
DETAIL A
Lined Joint
35mm 3.5m
DETAIL A
Lined Joint
Legend:
Pipe Element
Soil pipe interface
represented by
spring-slider
Node for input of
soil displacement
Axial pipe joint represented by
spring - slider
Pipe element
Soil-pipeline
interaction
spring element
Soil
displacement
input node
1:K2
z
1:K1
z
Ky:1
Kx:1
Sh
Sv
θt
Tee
Tee joint
Pipe nodeGround Displacement
Pipe Joint Soil Springs/ Gap Element
Page 40 of 48
https://mc06.manuscriptcentral.com/cgj-pubs
Canadian Geotechnical Journal

Draft
40
Figure 10. Transverse view of tunnel with settlement and horizontal movement distributions at depth of
pipeline
Figure 11. Illustration of joint centered and pipe centered pipeline configurations
CL
z
y
(y = 0)
Tunnel
(not to scale)
Tunnel Volume Loss, Vlt
Sv,max
izSettlement Profile, Sv
Soil Volume Loss, Vls
Sh,max
Horizontal Displacement Profile, Sh
Dt
zp
ztC
Surface (z = 0)
zo
Pipe Centered Configuration (PC)
CL
Tunnel
(not to scale)
Joint Centered Configuration (JC)Settlement
Profile, Sv
Page 41 of 48
https://mc06.manuscriptcentral.com/cgj-pubs
Canadian Geotechnical Journal

Draft
41
(a) (b)
(c) (d)
Figure 12. Continuous jointed CI pipeline results for clay settlement profile: (a) maximum joint
rotation, (b) maximum tensile strain, (c) 150-mm (6-in.) joint rotation with varying CI
modulus, and (d) maximum joint rotation for JC 150-mm (6-in.) with varying CI-lead
adhesion, CA
Page 42 of 48
https://mc06.manuscriptcentral.com/cgj-pubs
Canadian Geotechnical Journal

Draft
42
(a) (b)
Figure 13. Maximum (a) joint rotation and (b) tensile strain along continuous jointed CI pipeline for
joint centered and pipe centered configurations in sand settlement profile
Page 43 of 48
https://mc06.manuscriptcentral.com/cgj-pubs
Canadian Geotechnical Journal

Draft
43
Figure 14. Continuous jointed 300 mm CI pipe (a) vertical displacement, (b) soil pressure, and (c)
maximum tensile strain vs. distance from tunnel centerline at vertical displacements of 25 and
125 mm (1 and 5 in.) in sand
Page 44 of 48
https://mc06.manuscriptcentral.com/cgj-pubs
Canadian Geotechnical Journal

Draft
44
(a) (b)
Figure 15. Maximum (a) joint rotation and (b) tensile strain results of 150-mm (6-in.) continuous DI pipe
for joint and pipe centered configurations in sand profile
Figure 16. Illustration of tunnel cross-section, settlement trough and parallel pipeline with tee connection
Profile View
Parallel Pipeline
Branch Pipeline
Tee Joint
Dt
zp
zt
CSv,max
CL
iz
z
y
Tunnel Volume Loss, Vlt
(y = 0)
Surface (z = 0)
Settlement Trough, Sv,z
zoSoil Volume Loss, Vls
Tunnel
(not to scale)
yp
Vector of pipeline displacement
Parallel Pipeline
Branch Pipeline (with joint)
Vectors of pipeline movement due to Tunneling
Tee connection
Pullout and rotation at linkage
Plan View
CL
yp(y = 0)
Tunnel
Page 45 of 48
https://mc06.manuscriptcentral.com/cgj-pubs
Canadian Geotechnical Journal

Draft
45
Figure 17. 3D illustration of typical CI tee joint
Branch Tee Joint
Parallel Pipeline
Branch Pipeline
Thrust Block (if present)
Parallel Pipeline Joint
Overturning Moment, Mj,slipTorsional
Resistance, Tj,slip
Page 46 of 48
https://mc06.manuscriptcentral.com/cgj-pubs
Canadian Geotechnical Journal

Draft
46
Figure 18. Centerline settlement in clay and sand associated with exceeding CI tee pullout and rotational
limits as a function of tee location from the tunnel centerline
Figure 19. Centerline settlement in clay and sand associated with exceeding the allowable CI tensile
strain as a function of tee location from the tunnel centerline
Page 47 of 48
https://mc06.manuscriptcentral.com/cgj-pubs
Canadian Geotechnical Journal

Draft
47
Figure 20. Maximum DI joint pullout in clay and sand as a function of normalized tee location
0
0.4
0.8
1.2
1.6
2
0
10
20
30
40
50
0 0.5 1 1.5 2 2.5 3
(in
.)
Max
imu
m J
oin
t P
ull
ou
t (m
m)
Normalized Tee Distance from Centerline, y/i
Clay- Unrestrained tee Sand- Unrestrained Tee
Clay - Restrained tee Sand - Restrained Tee
150-mm (6-in.)
DI Pipe with Tee
Page 48 of 48
https://mc06.manuscriptcentral.com/cgj-pubs
Canadian Geotechnical Journal