interaction of cocoa powder with intestinal microbiota
TRANSCRIPT

Louisiana State UniversityLSU Digital Commons
LSU Master's Theses Graduate School
10-31-2017
Interaction of Cocoa Powder with IntestinalMicrobiotaMartha M. Escoto SabillonLouisiana State University and Agricultural and Mechanical College, [email protected]
Follow this and additional works at: https://digitalcommons.lsu.edu/gradschool_theses
Part of the Food Microbiology Commons, Food Processing Commons, and the GenomicsCommons
This Thesis is brought to you for free and open access by the Graduate School at LSU Digital Commons. It has been accepted for inclusion in LSUMaster's Theses by an authorized graduate school editor of LSU Digital Commons. For more information, please contact [email protected].
Recommended CitationEscoto Sabillon, Martha M., "Interaction of Cocoa Powder with Intestinal Microbiota" (2017). LSU Master's Theses. 4332.https://digitalcommons.lsu.edu/gradschool_theses/4332

INTERACTION OF COCOA POWDER WITH INTESTINAL MICROBIOTA
A Thesis
Submitted to the Graduate Faculty of the Louisiana State University and
Agricultural and Mechanical College in partial fulfillment of the
requirements for the degree of Master of Science
in
The School of Nutrition and Food Sciences
by
Martha Marina Escoto Sabillón B.S., Zamorano Pan-American Agricultural School, Honduras, 2014
December 2017

ii
ACKNOWLEDGEMENTS First of all, I am grateful to God Almighty for all the blessings and love, and for giving me
the strength and wisdom needed to accomplish this important goal in my life. He put me in the
correct place and time for showing me that with Him I am able to do everything.
Likewise, I would like to express my gratitude to my major professor, Dr. Marlene Janes,
for all her support, patience, guidance and dedication. Thank you for sharing your knowledge, for
being an example of human being, and inspiring me to an upper professional level. I would also
like to thank my excellent committee members Dr. Wenqing Xu and Dr. Michael Kennan for their
support and time spent sharing their knowledge and experience according to my research. Also,
thanks to the Hershey´s Company® for providing the necessary cocoa powder sample for running
the project.
My sincere gratitude to Dr. William B. Richardson, LSU Vice President for Agriculture
and Dean of the College of Agriculture for his comprehension, support, advice, and financial
support throughout these 2 years, without his help I would not be where I am.
Thanks as well to everyone in the School of Nutrition and Food Sciences who contributed
to my project. Special thanks to my lab mate Mr. José Brandao for his teaching and help in the
laboratory work, for encouraging me when I felt lost and stayed by my side as a friend; your hard
work always inspires me to be better. Thanks to Mr. Zuyin Li for all his time helping me running
the samples. Also, thanks to Ms. Lesly Estrada and my lab mate Ms. Katheryn Parraga for helping
me in the laboratory work. Special thanks to Mr. Kenneth Carabante, Ms. Susan Karimiha, Mrs.
Evelyn Watts, Mr. Vondel Reyes, Mr. Marco Toc, Ms. Azariah Amador, Ms. Stephanie Vásquez,
Ms. Claudia Castañeda, Ms. Jennifer Mineros, Ms. Carmen Velásquez, Ms. Johana Coronel, Ms.
Janny Mendoza, Ms. Silvia Murillo, and Mr. Ryan Ardoin for their contribution with the analyses

iii
and guidance during the investigation. Special thanks to my future husband, Matthew Norton, for
his support, patience, and trust during long hours of work. To my friends for always being
supportive and cheering me up in difficult moments; I do appreciate your friendship. Thanks to
the Zamorano Agricultural Society (ZAS) members for all the good times shared, for their support
and friendship.
My complete appreciation to my family in Honduras who have supported me emotionally
and whom I felt close despite the distance; thanks for their love, caring and support. To my friends
Patricia Reed, Pablo Vargas, Franklin Bonilla, Marisol Orellana, Anna Borjas, Emilio Gutierrez,
Helen Huggins, and Nell Ginn for being like a family during my time in Baton Rouge; thanks for
their love, friendship, and support.
Last but not least, this accomplishment is dedicated to Mr. Warren Huggins, my parents,
Marta Sabillón and Tulio Escoto, and my sister Karol Escoto who inspired me to be a better human
being. To Mrs. María de los Angeles Tróchez, Mr. Tulio Escoto Matamoros, Mrs. María Dávila
and Mr. Ildelfonso Sabillón, who I know they are cheering and blessing my future path from
heaven.

iv
TABLE OF CONTENTS ACKNOWLEDGEMENTS ............................................................................................................ ii LIST OF TABLES ......................................................................................................................... vi LIST OF FIGURES ...................................................................................................................... vii ABSTRACT ................................................................................................................................. viii CHAPTER 1. INTRODUCTION ................................................................................................... 1 CHAPTER 2. LITERATURE REVIEW ........................................................................................ 4 2.1 Cocoa .................................................................................................................................... 4
2.1.1 Processing Cocoa Powder ............................................................................................. 5 2.1.2 Cocoa Powder Composition ......................................................................................... 6 2.1.3 Benefits of Cocoa ......................................................................................................... 7 2.1.4 Consumption and Income in the USA .......................................................................... 7
2.2 Gastro-Intestinal Tract .......................................................................................................... 8 2.3 Digestive System ................................................................................................................ 12
2.3.1 Fermentation in the Digestive System ........................................................................ 14 2.3.2 Bacteria related with Fermentation ............................................................................. 16
2.3.2.2 Lactobacillus spp. ................................................................................................. 17 2.3.2.3 Bacteroides spp. ................................................................................................... 17 2.3.2.4 Roseburia spp ...................................................................................................... 18
2.4 Probiotic and Prebiotic ....................................................................................................... 18 2.5 In vitro vs. In vivo Digestion ............................................................................................. 20 2.6 Gut microbiota and human microbiome ............................................................................. 21 2.7 Analyzing the Gastro-Intestinal(GI) Microbiota ................................................................ 25
2.7.1 Next-Generation Sequencing Method: Illumina ......................................................... 26 CHAPTER 3. MATERIALS AND METHODS .......................................................................... 28 3.1 Samples collection .............................................................................................................. 28
3.1.1 Cocoa Powder Samples .............................................................................................. 28 3.1.2 Fecal Samples ............................................................................................................. 28
3.2 Color Analyzes ................................................................................................................... 29 3.3 pH measurement ................................................................................................................. 29 3.4 Cocoa sample pre-digestion ............................................................................................... 29 3.5 Cocoa sample fermentation ................................................................................................ 30 3.6 Nucleic Acid Extraction and sequencing ........................................................................... 31
3.6.1 DNA Extraction .......................................................................................................... 31 3.6.2 Sequencing .................................................................................................................. 32 3.6.3 Bioinformatics ............................................................................................................ 32 3.6.4 Phylogenetic analysis .................................................................................................. 33
3.7 Data Analysis ..................................................................................................................... 33 3.7.1 Color and pH analysis ................................................................................................. 33
3.7.2 Alpha and beta diversity statistical analysis ............................................................... 33

v
CHAPTER 4. RESULTS AND DISCUSSION ............................................................................ 35 4.1 Color analysis ..................................................................................................................... 35 4.2 Gut microbiota .................................................................................................................... 36 4.3 pH ....................................................................................................................................... 47 CHAPTER 5. SUMMARY AND CONCLUSIONS .................................................................... 49 REFERENCES ............................................................................................................................. 51 APPENDIX A. Cocoa samples appearance. ................................................................................. 59 APPENDIX B. The pH change of cocoa samples when fermented in an in-vitro digestive model system. .......................................................................................................................................... 60 APPENDIX C. Complete metagenome – phylotype tree of all samples during the entire experiment..................................................................................................................................... 61 APPENDIX D. Complete metagenome – phylotype tree of control sample at 0 and 24 hours. .. 62 APPENDIX E. Complete metagenome – phylotype tree of D-11-B sample at 0 and 24 hours. .. 64 APPENDIX F. Complete metagenome – phylotype tree of D-11-S sample at 0 and 24 hours. ... 66 APPENDIX G. Complete metagenome – phylotype tree of the natural sample at 0 and 24 hours........................................................................................................................................................ 68 APPENDIX H. Complete metagenome – phylotype tree of lavado sample at 0 and 24 hours. ... 70 APPENDIX I. Complete metagenome – phylotype tree of shells sample at 0 and 24 hours. ...... 72 VITA ............................................................................................................................................. 74
vi
LIST OF TABLES Table 1. Human GI Tract Segments with dimensions and the corresponding microbial density..10 Table 2. Description of predominant bacterial phyla in the human body. .................................... 25 Table 3. Description of the cocoa powder samples from the Hershey´s Company®. .................. 28 Table 4. Characteristics of the cocoa samples in color and pH before the digestion and then fermentation. ................................................................................................................................. 35 Table 5. Comparison of sequence amount estimation of the 16S rRNA gene libraries at 97% similarity from the Illumina sequencing analysis before trimming and quality filtering. ............ 37 Table 6. Comparison of relative abundance of phylum level between the control and samples during the fermentation time. ........................................................................................................ 39 Table 7. The pH change of cocoa samples when fermented in an in-vitro digestive model system........................................................................................................................................................ 48

vii
LIST OF FIGURES
Figure 1. Compositional differences in the microbiome by anatomical site . .............................. 11
Figure 2. Ecological representation of microbial communities: alpha diversity. ......................... 38
Figure 3. Estimated predominant genera present in samples. ....................................................... 41
Figure 4. Dual hierarchal dendrogram evaluation of the taxonomic classification data. ............. 45
Figure 5. Coordinate analysis plot generated based upon the weighted UniFrac distance matrix........................................................................................................................................................ 47
viii
ABSTRACT
Cocoa is the fully fermented and dried seed of the cacao tree (Theobroma cacao L.) which
has prebiotic properties, due to their high concentration of polyphenols. Therefore, the ingestion
of cocoa could cause changes in the proportions of the intestinal microbiota that can influence the
intestinal immune response. The objective of this study was to determine the effect of alkalization
process of the cocoa bean in the diversity of the gut microbiota. The samples were “lavado”
unprocessed cocoa powder, “natural” unprocessed cocoa powder, “D-11-S” as alkalized cocoa
powder, “D-11-B” heavily alkalized cocoa powder, and raw cocoa “shells” and a control of fecal
matter. The cocoa powders are rich in polyphenols and anthocyanins that are pH sensitive
exhibiting different colors as their structure changes. Analyses of pH and color correlated to
microbial diversity can help understanding for which forms of polyphenols and anthocyanins will
be more active. To analyze the samples a digestion was conducted by simulating the human
digestion system in vitro, with five samples and one control (fecal samples without cocoa).
Microbial diversity and composition were analyzed with Illumina HiSeq with methods
via bTEFAP® DNA analysis. Segments of the bacterial genome were amplified with the 515F and
806R primers specific for the universal Eubacterial 16S rRNA gene. Final operational taxonomic
units (OTUs) were taxonomically classified using BLASTn against a database derived from
GreenGenes/RDP/NCBI. Monte Carlo simulation was performed to detect features with
significant differences. Firmicutes, Proteobacteria, and Bacteroidetes were the most predominant
phyla in samples comprising >96% of all sequences (p<0.05). Overall, alkalization process did

ix
affect the diversity of the gut microbiota, but the effect was not consistent for only alkalinized
cocoa. The reduction of Firmicutes and Bacteriodetes (F:B) by natural cocoa and D-11-B affected
the diversity of the gut microbiota promoting a normal stable variety of OTUs. These data suggest
that cocoa powder consumption aids in the prevalence of a beneficial microbiota in the human gut.

1
CHAPTER 1. INTRODUCTION
Cocoa beans originate as seeds in fruit pods of the Theobroma cacao tree. Raw cocoa has
an astringent unpleasant taste and for this to be consumed it has to be fermented, dried, and then
roasted to obtain the characteristic “cocoa” taste and flavor. The fermentation process takes place
in the pulp, where microbiological activity in the pulp leads to the initiation of various biochemical
processes important for taste and flavor, which takes place inside the beans (Watson et al., 2013).
The use of cocoa and cocoa-derived products has continued through the earliest centuries, and
several studies have attributed it to beneficial and curative effects (Ackar et al., 2013).
Cocoa powder is an important ingredient for plenty of foods, beverages and
confectioneries. It is used in significant volumes in the manufacture of syrups and coatings, but
also in non-confectionary food usages like baking, beverages, flavorings, and icing. Out of the
total of U.S. imports in cocoa bean-related ingredients, 37% corresponds to cocoa powder (USDA,
2001). For 2004 in the United States there was more than 130 million pounds of cocoa powder
consumed. Statistics of total importations by North America for the year 2010 were around
505,000 tons of cocoa powder, with 84% of the tons belonging to the Unites States (Sarris, 2003).
Recent studies suggest the consumption of cocoa powder in regard to the potential health
benefits may be related to it being a prebiotic. Non-digestible nutritional food ingredients such as
dietary fiber that are fermented and known as a prebiotic increase the beneficial bacterial loads in
the colon (Ramachandran & Baojun, 2015). The carbohydrates in cocoa powder are generally
dietary fiber, which form complexes with polyphenols that are fermented by microorganisms in
the human colon providing health beneficial compounds to the host. These polyphenols in cacao
are flavonoids, substances that have the ability to remove free radicals, chelate metals and other

2
pro-oxidative compounds. The constant consumption of a food rich in flavanols has the potential
to support gut health by the ability to exert a nutritional pressure that favors some types of bacteria
over others (Tremaroli & Backhed, 2012).
The major steps contributing to the development of these benefits and the characteristics
of color and flavor in the cocoa and chocolate are the fermentation, roasting, alkalization, and an
agitation process called conching. Subsequently, after the fermentation in the cacao seeds, the
seeds are dehulled and roasted at 100-150°C. The roasted cocoa beans are generally transformed
from a solid phase to a suspension called cocoa liquor, which contains cocoa butter and nonfat
fines (Kamphuis, 2009). Afterward, the liquor is mechanically pressed to extract the cocoa butter
and creating a solid cake, which is ground into small particles and this is known as cocoa powder.
Commonly, cocoa powder holds a residual of cocoa butter from about 10-12%. The highest
percentages of the chocolate flavors and polyphenol antioxidants reside in the cocoa powder
(Miller et al., 2008).
Products from cacao such as the chocolate liquor and the cocoa powder can be modified
by a process called “Dutching” or alkalization. In this process, the liquor or cocoa are generally
washed with a sodium or potassium carbonate solution which darkens the cocoa ingredients.
Likewise, it might change the flavor by reducing bitterness and increasing the dispersibility of
cocoa powder (Beckett, 2009; World Cocoa Foundation, 2012). The alkali-treated powders are
mostly used in the non-confectionery manufacture. For the production of chocolate confectionery,
there are some large brands of dark chocolate that used the alkalized powder and liquor as sub-
ingredients (Wollgast and Anklam, 2000).
The main issue for the Dutching process is that phytonutrients, polyphenols, and flavanols,
may be reduced, modified or destroyed at an alkaline pH. In 2000, a U.S. patent showed that only
3
19% of the total amount of procyanidins remain in the alkali-treated cocoa powder (Kelly, 2000).
In a study done by Gu and collaborators (2006), they compared three commercially prepared
untreated cocoa powders to two commercially prepared alkalized cocoa powders demonstrating
that the alkalized cocoa powders had 78% fewer flavanols. Last but not least, a study simulating
the alkaline conditions of the colon, stated that catechin, epicatechin, or procyanidin dimers were
degraded at a pH of 7.4 after 24 hours, and by 100% after 4 hours at a pH of 9.0 (Zhu et al., 2002).
Despite this information that alkali cocoa powder destroys flavanols, very few data exist on the
fermentation of alkali cocoa powder and the effect on the microbiome.
The objective of this study was to determine the effect of varying degrees of alkali
processing on the diversity of the gut microbiota and the fermentation of cocoa by human colonic
microbiota. This thesis is divided into five chapters, where the first is a brief introduction and
justification of this study. The second and third chapters comprise a literature review and explain
materials and methods, respectively. The fourth chapter describes the results and discussion. A
summary and conclusions are contained in the fifth chapter. After the references section, the
appendices include additional materials used in this study. The vita of the author is also provided.
4
CHAPTER 2. LITERATURE REVIEW
2.1 Cocoa
Cocoa traces have been found in Mesoamerica and date back to 2000 B.C. The use of cocoa
and cocoa-derived products has continued back through the earliest centuries, and several studies
have attributed its beneficial and curative effects (Ackar et al., 2013). Cocoa beans originate as
seeds in fruit pods of the Theobroma cacao or “Fruit of the Gods” tree. The beans were used as a
commercial trading currency by the Mayas, Olmecs, Toltec, and Aztec people of Mexico and
Central America as observed in Columbus’s voyages (ICE Futures U.S., 2007). Cocoa tree farms
are in tropical environments within 15-20º of latitude from the equator. Cocoa is a sensitive and
delicate crop, with proper care, at the fifth-year cocoa trees begin to yield pods at high production
levels (Baptista, 2009).
Farmers begin to harvest the ripe pods using long-handled steel tools. Pods are collected
and split with a sturdy stick removing all the beans inside. Each pod of cacao contains
approximately 30 to 45 beans embedded in a mucilaginous pulp. This pulp is rich in glucose,
fructose, and sucrose. Raw cocoa has an astringent unpleasant taste and for this reason, to be
consumed, it needs to be fermented, dried, and roasted to obtain the characteristic “cocoa” taste
and flavor. To make a pound of chocolate 400 beans are approximately required (World Cocoa
Foundation, 2012; Watson et. al 2013).
Cocoa fresh seeds are packed and typically fermented in boxes or heaped in piles covered
with mats or banana leaves. The fermentation process takes place in the pulp that surrounds the
beans. The pulp heats up for three to seven days, where microbiological activity leads to the
initiation of various biochemical processes important for taste and flavor, which takes place inside
5
the beans. After, the beans are dried in the sun or by solar dryers for several days they are
transported to processing facilities (Miller et al., 2008; World Cocoa Foundation, 2012).
2.1.1 Processing Cocoa Powder
For further processing cocoa beans must be cleaned and inspected to remove non-cocoa
particles; and this removal is done by sieving, magnets, or combined with cleaning steps. After
this, the cleaned beans are deshelled. Proper removal of the shell is a prerequisite of a good quality
product since it does not contribute to the flavor of the final product. Ideally, the shell should
separate perfectly leaving the nib, which is the inside of the cocoa bean, almost intact. In some
cases, the shell around the bean cannot be removed easily and companies usually separate it by a
swing-hammer type of breaker. After breaking, the shells and nib are divided by winnowing and
unbroken beans are returned for reprocessing.
Roasting matures the flavor in the beans from the prior processes, fermentation, and drying.
The beans are roasted at temperatures ranging between 100-150ºC (230-284ºF). Once the beans
were roasted, the nib is ground into a suspension. The heat generated during this process causes
the cocoa butter in the nib to melt, changing phase to “cocoa liquor”. The cocoa liquor is poured
into hydraulic presses that separate liquor into cocoa butter and cocoa cakes. The solid cocoa cake
is then ground into the common product known as cocoa powder. Cocoa powder normally holds a
residual of 10 to 12% of cocoa butter, but including mainly nonfat cocoa solids. The cocoa powder
maintains the common chocolate flavor and the polyphenol antioxidants are present.
The alkalization step process, also known as Dutching, introduces specific flavors and is
predominantly used for the production of cocoa powder. In this process, the nibs are normally
treated with an alkaline solution such as sodium or potassium carbonate and water. Depending
upon the cocoa beans, the percentage of alkaline solution, time, and temperature it will result in a
6
change in flavor, color, and pH. The pH of the non-alkalized cocoa cake can also be increased by
adding dry alkali, resulting in a higher pH powder after pulverizing but, produce less effects in
color (Beckett, 2009; World Cocoa Foundation, 2012). Natural cocoa powders have an extractable
pH of 5.3-5.8. Alkalized cocoa powders are grouped into lightly treated (pH 6.50-7.20), medium-
treated (pH 7.21-7.60), and heavily treated (pH 7.61 and higher) (Miller et al., 2008).
In 2008, Miller et al. discussed that a main concern of the Dutch process was that the
components of the cocoa, such as polyphenols and flavanols may be modified or destroyed at
alkaline pH. A study conducted by Gu and collaborators compared commercial natural cocoa
powder to alkalized cocoa powder and found the processed powder had 78% fewer flavanols (Gu
et al., 2006). Finally, a study simulating an in vitro digestion revealed that the cocoa components
are pH-dependent. A comparison of pH 5.0 versus pH 9.0, showed that the stability of all four
compounds, epicatechin-(4â-8)-epicatechin (Dimer B2) and epicatechin-(4â- 6)-epicatechin
(Dimer B5) was greater at lower pH than the stability at higher pH (Zhu et al., 2002).
2.1.2 Cocoa Powder Composition
Cocoa powder is high in palmitic and stearic saturated fats, but is low in cholesterol and
sodium. Also, the powder is a source of protein, potassium, and zinc, a very good source of dietary
fiber, iron, magnesium, phosphorus, copper, and manganese (Illanep, 2005). Usually cocoa
powder ended up containing 10-12% of residual cocoa butter is considered as being a “nonfat”
cocoa solid. The nonfat cocoa solids refer to the brown particulate material of the seed. The major
steps contributing to the development of these benefits and the characteristic of color and flavor in
the cocoa and chocolate are the fermentation, roasting, alkalization, and conching. Subsequently,
after the roasting, alkalization of cocoa beans is generally applied to develop organoleptic and
7
technological qualities of cocoa powder (Kamphuis, 2009). The process of alkalization is done by
washing the cocoa with potassium carbonate solution that neutralized or changed cocoa acidity,
making changes in the pH (Wollgast & Anklam, 2000).
2.1.3 Benefits of Cocoa
Recent research has shown that cocoa and chocolate consumption is associated with several
health benefits such as prevention of cancer, cardiovascular and neurodegenerative diseases,
diabetes, obesity, and slowing of aging - attributed to the content of polyphenols (Miller et al.,
2008; Martín and Ramos, 2016). Cocoa is a rich source of polyphenols compounds, especially
flavanols. Procyanidins, oligomers of flavanols, like catechin and epicatechin, constitute the
majority of the cacao bean and is one of the more concentrated sources. Epicatechin is the most
abundant monomeric flavanol in cocoa, representing 35% of the total phenolic content (Wollgast
and Anklam, 2000).
The constant consumption of a food rich in flavanols has the potential to support gut health
by the ability to exert a nutritional pressure that favors some bacteria growth. The carbohydrates
in cocoa are generally dietary fiber that form complexes with polyphenols. These complexes may
be fermented by microorganisms in the human colon providing health benefits to the host
(Tremaroli & Backhed, 2012). However, the remaining number of polyphenols in the cocoa
powder will directly depend on the methods used in the cocoa beans processing.
2.1.4 Consumption and Income in the USA
North America is considered the world's second largest cocoa consuming area and is likely
to grow by 3.6 percent per annum and reach 703,000 tons (Sarris, 2003). Out of the total from U.S.
imports of cocoa bean-related products including the chocolate liquor, cocoa butter, and chocolate
paste, 37% represents cocoa powder (USDA, 2001). In 2004 in the United States of America

8
people consumed more than 130 million pounds of cocoa powder (Miller et al., 2008). FAO
projected consumption for 2010 in the U.S. was on an average of 634,000 tons. North American
total importations for 2010 statistics were around 505,000 tons, including 424,000 tons to the
Unites States, decreasing their growth rate of importations by -0.2% (Sarris, 2003).
According to a World Cocoa Foundation (WCF) publication in 2014 consumers have
thousands of different ways to taste chocolate, estimating a consumption of more than 3 million
tons of cocoa beans annually. The demand for post-processing cocoa powder and cake measured
in nominal dollar value of imports is $781,154. (World Cocoa Foundation, 2012).
2.2 Gastro-Intestinal Tract
The human gastrointestinal (GI) tract is a complex biological system. The GI tract consists
of oral cavity, pharynx, esophagus, stomach, small intestine, large intestine, rectum, and anus, with
the combination of bacteria, archaea, yeast, filamentous fungi and protozoans constitute the
digestive system (Rajilić-Stojanović et al., 2007; Maukonen and Saarela, 2015). The human
gastrointestinal tract is bacteria-free before birth. During birth, infants have direct contact with
mother’s skin, vagina, feces, and the environment, developing a faster bacteria proliferation in the
infant’s gastrointestinal system than the caesarean babies (Morelli, 2008). However, in adults, the
pooled microbial population in the human body exceeds 1014 microbial cells, which is greater than
the number of human cells.
The adult human GI tract is constituted by all three domains of life: bacteria, archaea, and
eukarya. Bacteria living in the human gut achieve the highest cell densities recorded for any
ecosystem. In all 98% of the species that live in the gastrointestinal tract belong basically to few
bacterial phyla; Firmicutes, Actinobacteria, Proteobacteria, and Bacteriodetes. Despite the fact that

9
the bacterial phyla community in the GI tract is diverse, only eight of the 55 known bacterial phyla
have been identified, and of these, 5 are infrequent (Gerritsen et al., 2011; Bäckhed et al., 2016).
The different types of bacterial populations in the GI tract will depend on the environmental
conditions (temperature, pH, redox potential, water activity (Aw), salinity, light, and atmospheric
composition) of the different anatomical sites (Table 1.). Each microorganism plays a role in the
digestion and absorption of intestinal contents during the passage throughout the GI tract. The
human oral cavity has the second largest population of bacteria (approximately 1010/ml; more than
500 bacterial species); being the major inhabitant of the most microbial divisions that is colonized
by Firmicutes, Bacteroidetes, Proteobacteria, Fusobacteria, Actinobacteria, and Cyanobacteria
(Maukonen and Saarela, 2015) (Figure 1).
In the stomach, the bacterial population reduces due to the high acidity and digestive
enzymes. The stomach becomes a barrier restricting access of bacteria from the outside
environment to the rest of the GI tract. The bacteria that get to the stomach cavity are attached to
gastric epithelial or are present in mucus. The most predominant bacteria in the stomach are gram
positive and the micro-organism gram-negative aerobic, Helicobacter pylori (Tlaskalová-
Hogenová et al., 2004).
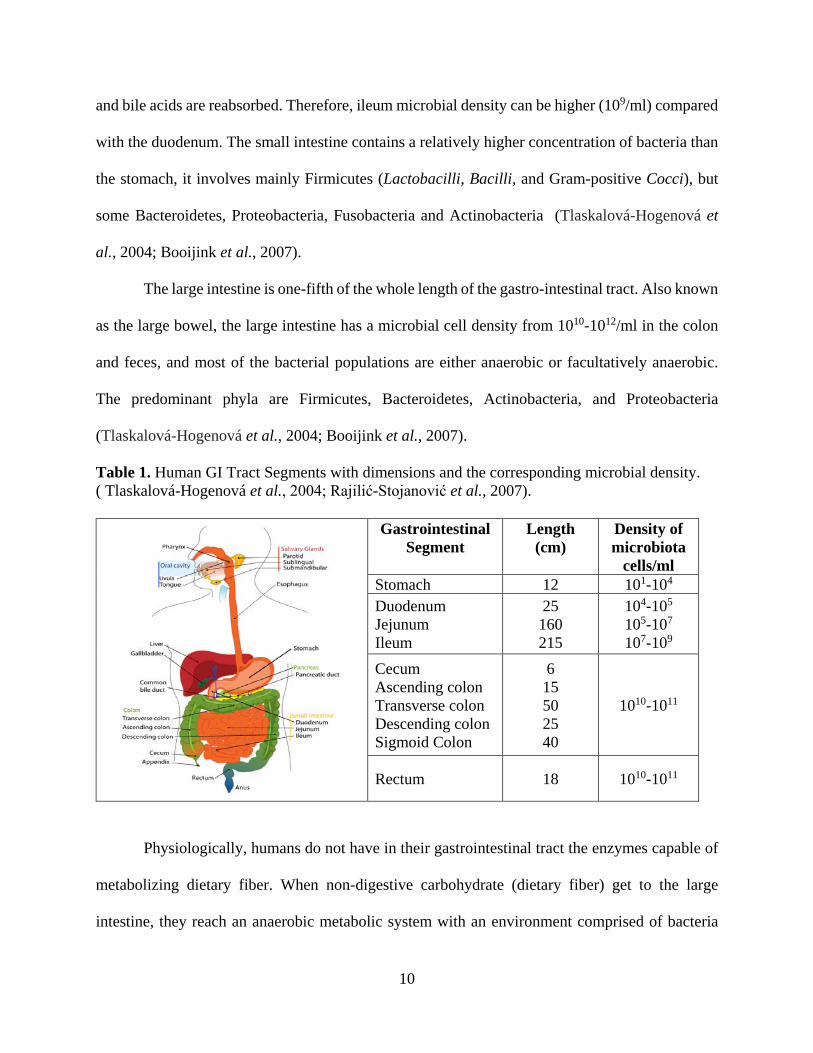
The small intestine is divided into three parts. The duodenum, mostly known as the first
and shortest part of the small intestine, is the part of the GI tract where most of the host enzymatic
digestion of food occurs. The microbial density increases along the gastrointestinal tract; in the
stomach and duodenum there is an increase from 101-104/ml, respectively. The remaining two
parts of the small intestine, jejunum and ileum have a microbial density from 105-109/ml. The
conditions in the ileum are more favorable for microbial growth, for example, the pH is less acidic
10
and bile acids are reabsorbed. Therefore, ileum microbial density can be higher (109/ml) compared
with the duodenum. The small intestine contains a relatively higher concentration of bacteria than
the stomach, it involves mainly Firmicutes (Lactobacilli, Bacilli, and Gram-positive Cocci), but
some Bacteroidetes, Proteobacteria, Fusobacteria and Actinobacteria (Tlaskalová-Hogenová et
al., 2004; Booijink et al., 2007).
The large intestine is one-fifth of the whole length of the gastro-intestinal tract. Also known
as the large bowel, the large intestine has a microbial cell density from 1010-1012/ml in the colon
and feces, and most of the bacterial populations are either anaerobic or facultatively anaerobic.
The predominant phyla are Firmicutes, Bacteroidetes, Actinobacteria, and Proteobacteria
(Tlaskalová-Hogenová et al., 2004; Booijink et al., 2007).
Table 1. Human GI Tract Segments with dimensions and the corresponding microbial density. ( Tlaskalová-Hogenová et al., 2004; Rajilić-Stojanović et al., 2007).
Gastrointestinal Segment
Length (cm)
Density of microbiota
cells/ml Stomach 12 101-104
Duodenum Jejunum Ileum
25 160 215
104-105
105-107
107-109 Cecum Ascending colon Transverse colon Descending colon Sigmoid Colon
6 15 50 25 40
1010-1011
Rectum 18 1010-1011
Physiologically, humans do not have in their gastrointestinal tract the enzymes capable of
metabolizing dietary fiber. When non-digestive carbohydrate (dietary fiber) get to the large
intestine, they reach an anaerobic metabolic system with an environment comprised of bacteria

11
which contain enzymes that ferment fermentable fiber and the products are often bioavailable to
the host (Louis et al., 2007). The large bowel is a fermentation vessel that harbors the majority of
our gut microorganisms. These microbiota generate by-products that can be utilized by the host
and improve the host’s health with the production of energy, nutrients, and the protection against
diseases (Bäckhed et al., 2016).
Figure 1. Compositional differences in the microbiome by anatomical site (Cho and Blaser, 2012). The presence (+) or absence (-) of H. pylori, can lead to permanent and marked perturbations in the community composition.
12
2.3 Digestive System
The digestive system is the most multipart and complex biological system in animals and
in all of life. The four main regions of the digestive system are the oral cavity, stomach, small
intestine and large intestine. The digestion process begins in the mouth. During the oral phase of
digestion, a mechanical breakdown of food structure begins. At the same time, food will mix with
saliva, α amylase hydrolysis will then occur, and finally, bolus formation occurs prior to
swallowing (Woolnough et al., 2008).
The second segment of digestion is the gastric phase, which takes place in the stomach. It
is within the confines of the stomach acids confined where the hydrolysis of protein and fat occurs.
Protein digestion is initiated by pepsin and hydrochloric acid resulting in peptide formation; half
portion of the protein leave the stomach in smaller peptides. Carbohydrate digestion began by
salivary amylase stops as the amylase is denatured, and lipid digestion occurs with gastric lipase.
The third phase of the digestive system is the ileal phase, the food in the small intestine
will be hydrolyzed. Protein and peptide passing from the stomach are further hydrolyzed by
pancreatic enzymes such as trypsin, chymotrypsin, elastase, and the aminopeptidases, and
carboxypeptidase. Dissolved peptidases will finally contribute to be hydrolyzed prior to absorption
of free amino acids and smaller peptides. The absorption of amino acids will occur principally in
the proximal jejunum (Grimble and Silk, 1989). The hydrolysis of carbohydrates is produced by
pancreatic amylase in the lumen of the small intestine. The carbohydrates will be digested to
maltose, dextrins, and limit dextrins. Dextrins are degraded to maltose by amylase, isomaltase
degrades limit dextrins to glucose as it can digest alpha 1-4 and alpha 1-6 glycosidic bonds, and

13
amylase degrades maltose to glucose. Lactase digests lactose to the monosaccharides glucose and
galactose, and sucrase digests sucrose to the monosaccharides glucose and fructose (Boisen &
Eggum, 1991).
Lipid hydrolysis is catalyzed in the small intestine by three enzymes such as pancreatic
lipase, carboxylic ester hydrolase, phospholipase, and a co-enzyme called colipase. Pancreatic
lipase splits triacylglycerols into monoacylglycerols and fatty acids; the carboxylic ester hydrolase
breaks down carboxylic esters, and phospholipase hydrolyzes fatty acids in the 2-position of
glycerol-phospholipid. The presence of bile salts improved the activity of pancreatic lipase and it
increased the absorption of long-chain fatty acids and monoacylglycerols. The amino acids,
peptides, monosaccharides, and digested fatty acids are absorbed mainly in the jejunum (Boisen
& Eggum, 1991). The small intestine percentage of fat digestion and absorption is 98%, the
remaining 2% of undigested fat, proteins, and carbohydrates are transferred to the large intestine
(Saunders & Sillery, 1988).
The internal microbiota of the large intestine is directly involved with the fermentation
process of proteins and carbohydrates. In the large intestine is recovered from 10-20 % of nitrogen
from protein, which is attributed to the microflora (Gerritsen et al., 2011). Protein (Mucin) and
dietary carbohydrates (fermentable fiber, oligosaccharides, and Inulin) are further broken down by
bacterial enzymes. Since undigested fatty acids cannot be fermented by bacterial enzymes during
the passage through the large intestine, lipids are marginally influenced. The by-products of the
dietary fiber and protein fermentation are short-chain fatty acids (SCFA) and a variety of gases.
Humans absorb the SCFA and they have a variety of roles in the body and butyrate is the major
energy source for colonocytes (Boisen & Eggum, 1991).
14
2.3.1 Fermentation in the Digestive System
By means of digestive enzymes, complex food components are able to be absorbed and
used throughout the body. Many dietary fiber because of their structure are not digested in the
upper GI tract. However, dietary fiber are fermented in the large intestine, also called the colon,
containing an exceedingly complex society of microflora. The fermentation of these carbohydrates
depend on the microbes available, the non-digested substrate present, the enzymes produced and
most important the anaerobic conditions (Duncan et al., 2002; Valeur and Berstad, 2010).
The fermentation process of dietary fiber (non-digested carbohydrate), SCFAs and gasses
such as carbon dioxide, hydrogen, and methane, are produced in the colon where there is an
anaerobic condition (Cherbut, 2002). Carbohydrate fermentation in the colon is known for
maintaining a host homeostasis, it exerts an influence on host physiology through nutritional,
regulatory, and immune-modulatory properties. The end products of this fermentation are the
SCFAs acting as signals for the regulation of virulence genes in enteric pathogens. Additionally,
SCFAs prevent the growth of pathogens by decreasing the luminal pH and stimulate intestinal
motility (Lin et al., 2014).
The major short-chain fatty acid (SCFA) that are formed by microbial fermentation are
acetate, propionate, and butyrate; the acetate is metabolized by the muscle, butyrate by the colonic
epithelium, and propionate by the liver. SCFA can promote large intestine functions, which include
modulation of colonic motility, promotion of visceral blood flow, providing an additional amount
of energy, and prevention of the overgrowth of potential pathogens in the lumen. In some studies,
typical ratios in feces of SCFA are around 3:1:1 acetate-propionate-butyrate (Cummings and
Macfarlane, 1997; Duncan et al., 2002; Sato et al., 2008).

15
Acetate is the major SCFA produced by the colonic microflora. Acetate is not metabolized
in the colon because it is rapidly absorbed after its production and transported to the liver. Residual
acetate is used further by the colonic microbiota and converted into butyrate. The major benefits
of acetate are that it acts as an energy substrate for muscles, is essential for cholesterol synthesis
in the body, and also has been shown that it suppress harmful bacteria (Cummings and Macfarlane,
1997; Hijova and Chmelarova 2007).
Propionate is the primary precursor for gluconeogenesis and may inhibit lipogenesis and
protein synthesis (Louis et al., 2007). Propionate inhibits the synthesis of fatty acids in the liver
and is also involved in the control of hepatic cholesterol synthesis. It helps to lower plasma
cholesterol concentrations by inhibiting hepatic cholesterol-genesis through colonic fermentation.
In recent research the production of propionate is associated to obesity and could be considered an
important factor that contributes to gain weight (Schwiertz et al., 2009).
Butyrate is the major energy source for epithelial cells of colonic mucosa and stimulates
cells proliferation, particularly the distal colon (Cummings, 1981; Sato et al., 2008). It was
reported that butyrate gives protection against cancer and ulcerative colitis by blocking the
absorption of carcinogenic substances and making the colon less susceptible to DNA damage
(Kushkevych, 2014). In addition, the absorption of calcium (Ca) increased because butyrate helps
in the maintenance of a healthy epithelium (Gibson and Mccartney, 1993; Asp et al., 1996).
Butyrate has the ability to maintain a normal colonocyte phenotype, a characteristic that can
contribute to reducing the risk of colorectal cancer (Encarnação et al., 2015).
16
2.3.2 Bacteria related with Fermentation
During the fermentation process of dietary fiber, the bacteria will attach to starch molecules
especially Bacteroides thetaiotaomicron, Bifidobacterium longum and some Lactobacillus spp.
(Bird et al., 2000; Louis et al., 2007; Xu et al., 2017). However, Bacteroides spp, Lactobacillus
spp. and Bifidobacterium spp. do not produce butyrate as a final product from dietary fiber. The
end fermentation products for Bacteroides spp. are acetate, propionate, and succinate. Lactate and
acetate are produced by Bifidobacterium spp. and Lactobacillus spp. when fermenting dietary
fiber. Therefore, these bacterial species stick to the surface of starch molecules and ferment dietary
fiber into intermediate products that are converted by other species to butyrate (Duncan et al.,
2004; Louis et al., 2007).
The genera Coprococcus spp. and Roseburia spp. and the species Faecalibacterium
prausnitzii produce butyrate from acetate (Duncan et al., 2002). However, butyrate was also an
end product of fermentation produced by lactate utilizing microorganisms of human feces (Duncan
et al., 2004). Also, the species Eubacterium limosum has the ability to convert lactate into acetate
and butyrate, but it has to be with the presence of Bifidobacterium longum. Studies have shown
that the majority of butyrate-producing isolates are related to the Clostridium coccoides-
Eubacterium rectale group (Sato et al., 2008).
2.3.2.1 Bifidobacterium spp.
Bifidobacterium spp. are classified under the phylum Actinobacteria. This genus is a gram-
positive, nonmotile, strictly anaerobic branched rod that contributes to the lactate formation in the
human colon. Bifidobacterium genus is the third most abundant in the human intestine after the
genera Bacteroides and Eubacterium, making up 6% of total fecal bacteria (Matsuki et al., 2004;
Sato et al., 2008). Bifidobacterium spp. can be used as a probiotic since it improves the digestion,
17
absorption, and helps the immune system. The use of Bifidobacterium spp. helps to lower the side-
effects of antibiotic therapy. Also, it brings protection against enteric pathogens, putrefactive
substances, and is involved in the reduction of cholesterol levels and anti-tumoral activity (Leahy
et al., 2005).
2.3.2.2 Lactobacillus spp.
The genus Lactobacillus spp. belongs to the phylum Firmicutes. Lactobacillus is a gram-
positive rod-shaped non-spore forming bacteria belonging to lactic acid bacteria (LAB) category.
The major acid during fermentation of sugars is lactic acid; it also produces acetic, succinic, and
formic acids in lower amounts. Lactobacillus strains can grow under aerobic conditions, as well
as anaerobic conditions in the colon (Reid, 1999). This genus helps to reduce the permeability in
the intestinal mucosal preventing pathogen adhesion by producing biosurfactants. For the strain of
Lactobacillus fermentum there is evidence of reduced adhesion and competitive exclusion of
pathogenic Escherichia coli, Listeria monocytogenes, Shigella sonnei, and Salmonella
typhimurium in in-vitro and in-vivo studies (Brown et al., 1997)
2.3.2.3 Bacteroides spp.
The Bacteroides spp. genus is part of the Bacteroidetes phyla. Bacteroides genera are
strictly anaerobic Gram-negative, and a dominant bacillus bacterial group in the human GI tract.
Bacteroides spp. could break down a wide variety of indigestible dietary carbohydrates by
producing acetate and succinate as the main metabolic products. This organism starts its
fermentation by attaching to starch molecules. Bacteroides grows quickly after the introduction of
prebiotics such as a dietary fiber (Wang and Gibson, 1993; Brown et al., 1997). The
18
Firmicutes/Bacteroidetes ratio increases with age that is from birth to adulthood and is further
altered with advanced age. The highest diversity of genus Bacteroides could be seen in an elderly
population compared to younger populations (Mariat et al., 2009).
2.3.2.4 Roseburia spp.
Roseburia spp. is classified under the phylum Firmicutes. This genus is gram-positive, and
are strictly anaerobic bacteria that inhabit the human colon. Roseburia spp. produce butyric acid
from acetate. When the presence of Roseburia spp. in the human colon is increased it will be
associated with weight loss and reduced glucose intolerance (Wiele et al., 2011).
2.4 Probiotic and Prebiotic
Probiotic is a term defined as single or mixed cultures of live microorganisms that when
consumed live in adequate numbers confer a health benefit to the host improving the original
microflora balance (Fuller, 1989; Stanton et al., 2001). These live organisms are present in dairy
products, salami, sauerkraut, fermented cereals, and other plant-based food. They can be protected
in their way through the gastric system and stimulated in the colon. Products that are labeled as
probiotics have to be consistent with certain parameters such as there should be food products in
addition to microorganisms; the concentration of microbes should be sufficient to cause a health
effect; and they have to be generally recognized as safe status (GRAS) (Cani & Delzenne, 2007).
The main probiotic microorganisms are in the genera of Lactobacillus, Bifidobacterium,
and certain strains of Enterococcus and Saccharomyces spp. Some of the species include
Lactobacillus plantarum, Lactobacillus delbrüecki, Lactobacillus bulgaricus, Bifidobacterium
(B.) breve, B. longum, B. bifidum, and Streptococcus thermophilus. The gram-negative Escherichia
coli strain Nissle 1917, various lactic acid producing Lactobacillus strains, and a number of other
bifidobacterial species and strains represent the main microorganisms classified as probiotic

19
agents. Additionally, the butyrate producer, Roseburia genus, and the mucin-degrading bacterium,
Akkermansia muciniphila, has also been reported as probiotics. Some of the beneficial effects of
the probiotics are that they have been shown to have: enhanced the immune response, and
increased the ability to digest food and alleviate many common digestive disorders such as
constipation, diarrhea, and irritable bowel syndrome (IBS) (Lin et al., 2014).
A non-digestible food ingredient, mostly oligosaccharides, that is beneficial to the host by
stimulating the growth and/or activity of one or a limited number of bacteria in the colon is what
we know as prebiotic; a term related to dietary fiber (Gibson & Roberfroid 1995). Fiber can be
classified into three main categories which are dietary, functional, and total fiber. Dietary fiber
includes non-digestible carbohydrates and lignin that are intrinsic and intact in plants. Functional
fiber includes isolated, non-digestible carbohydrates that have beneficial physiological effects in
humans; and total fiber is a combination of both (Cani et al., 2004; Wang et al., 2004; Falony et
al., 2006; Topping & Clifton, 2001).
Dietary fiber which increase the beneficial bacterial loads in the large intestine are known
as prebiotic. Cocoa is considered as a prebiotic (Ramachandran et al 2015). The carbohydrates in
cocoa powder are generally dietary fiber, which form complexes with polyphenols that are
fermented by microorganisms in the human colon providing health benefit(s) to the host. These
polyphenols in cacao are flavonoids, substances that have the ability of remove free radicals,
chelate metals and others pro-oxidative compound. The constant consumption of a food rich in
flavanol has the potential to support gut health by the ability to exert a nutritional pressure that
favors some bacteria (Tremaroli & Backhed, 2012).
20
Synbiotics are defined as probiotic bacteria plus complex carbohydrates as prebiotics.
When use combination of live probiotics with specific prebiotics as a symbiotic, that combination
will help for the survivability of probiotics. Prebiotics provides a specific substrate which required
for probiotic bacterial growth; from this combination, the host is getting benefits from both,
probiotics and prebiotics (de Vrese et al., 2001; Schrezenmeir & de Vrese, 2001).
2.5 In vitro vs. In vivo Digestion
Developing in vitro digestibility techniques, it is logical to simulate one step incubations
with pepsin or other proteases such as trypsin, papain, rennin, or more steps occurring at the in
vivo conditions. In vivo determinations are time-consuming and costly, therefore much
determination has been dedicated to the development of in vitro procedures. The in vitro technique
will vary between experiment to experiment, making a design on which specific enzymes are
necessary. The enzymes selected will be either to obtain the highest digestibility values or the
measurement of the initial rate of hydrolysis. In both techniques, in vivo or in vitro, the enzymes
used should have specificities similar to those present in the human digestive tract. In general,
there are some key requirements for the development of in vitro digestibility assays: matching in
vivo enzymes in presence, sequence, enzyme:substrate ratios standardizing enzyme activities and
specificities; controlling co-enzymes and co-factors, pH and temperature; separating digested from
undigested material while considering the inhibition of end products of digestion; and agreeing for
the effects of sample size, particle size and particle size distribution (Boisen & Eggum, 1991).
Other methods have simulated gastric and intestinal digestion using a 2-stage in vitro
digestion. The 2-stage digestion begins involving a pepsin-hydrogen chloride mixture
neutralization and then digested with pancreatin, trypsin or intestinal fluid. The pancreatin is
21
suggested for solubilizing the potential digestible nutrients. However, amylase activity in
pancreatin can become limited for starch degradation, while fat needs an addition of bile salts. The
degradation of dietary fiber can be done only by the presence of microbial enzymes. Therefore, it
can be simulated by rumen fluid, caecal fluid, fecal extract, or an appropriate enzyme complex of
microbial carbohydrases (Ferguson et al., 1990).
Overall, there has been good agreement between these in vitro results and in vivo rat true
fecal nitrogen digestibility. In vitro digestion technique has the capacity to give useful information
of an in vivo amino acid and protein digestibility for humans. An in vitro method to measure the
extent of digestion of protein must be precise, rapid, cheap, simple, vigorous, adjustable and
relevant to the processes of digestion, absorption, and metabolism.
The complex in vitro methods including the computer controlled models of the digestive
tract are more precise at mimicking the processes of digestion and absorption. Although, it might
be too expensive and time consuming, but are useful tools for expanding the understanding of
digestion processes. Despite the complexity of digestion, all these methods require an independent
validation with in vivo data from the target species or an adequate animal model (Butts et al.,
2012).
2.6 Gut microbiota and human microbiome
Gut microbiota is also known formerly as the “the normal flora”, which are the microbial
organisms that constitute the microbiome. The flora composition in a community can vary
considerably between environmental sites, among host niches and between health and diseases
(Cho and Blaser, 2012). The microbiota in the gut can contribute to the development of healthy
22
environments within the intestinal tract by suppressing colonization of pathogenic organisms; this
is called the state of “normobiosis”. Normobiosis is fundamental for normal gut homeostasis and
ideal development of the host (Lin et al., 2014).
Microbiota composition differences exist across body sites and each human lifespan (Cho
and Blaser, 2012). Before birth, the human gut is essentially sterile, but immediately after birth, it
becomes a natural reservoir for an ample number of microorganism’s species (Forsythe et al.,
2010; Petersen & Round, 2014). Lactobacilli is the pioneer microbial community in a baby’s
gastrointestinal tract corresponding to the concentration of lactic acid bacteria (LAB) producing
in the mother’s vagina and milk. As a result for the presence of this bacteria is a well prepare
gastrointestinal tract for subsequent microbial successions until microbial maturity is reached
(Palmer et al., 2007).
This “symbiotic ecosystem” is complex but with the largest conglomeration of
microorganisms in the lumen and outside mucus layer of the colon (Gareau et al., 2016). Our gut
microbiota aids to increase the thickness of the villi in the bowel wall and exhibits fast epithelial
cell turnover (Leser and Mollbak, 2009). It contributes to the host nutrition by enhancing the
efficacy of energy intake from ingested food, synthesis of essential vitamins, and the fermentation
of dietary fiber and dietary proteins. It also affects a broad range of physiological properties of the
human host, controlling the energy balance, pH, the development of the human immune system,
stimulating the gut motility, and protection against pathogens. When is an imbalance of the
intestinal microbiota there can incline individuals to a variety of diseases such as inflammatory
bowel diseases (IBD), allergies, and obesity (Urokawa et al., 2007; Delzenne et al., 2011).

23
Microbiomes naturally consist of environmental or biological niches holding complex
communities of microbes. The totality genes information and the milieu of resident microbes living
and interacting within and on humans are referred to as the human microbiome (Cho and Blaser,
2012; Johnson and Versalovic, 2012). In adults, the microbial community in the human body
exceeds 100 trillion microbial cells, which are about 10 times more than the total of the human
cells. The microbiome can also be known as a “superorganism” because it is made up of the human
cells and the complex ecosystem of the microbes. Hence the human genes are naturally mixed with
trillions of microbes which colonized in our bodies. Of course, microbes do not colonize the gut
only, but they are present on everybody surface that comes into contact with the environment. The
microbiome is impacted by and impacts three potential causal determinants: the host, the agent,
and the environment. Therefore, the composition of the microbiome differs by every human
anatomical site (Bäckhed et al., 2005; Urokawa et al., 2007; Johnson and Versalovic, 2012;
Hanson and Weinstock, 2016)(Figure 1).
The isolation of human genes from the microbe genes is impossible. Likewise, microbiome
will be out of reach of in-depth scientific inquiry by culture-based method because of the short
range of different taxonomy through this method. However, recent technological approaches such
as DNA sequencing and computational methods (“next-generation” sequencing) have been used
to analyze bacterial communities using the 16 rRNA gene for phylogenetic analysis. Metagenome
is the term applied to the complex interactions of the human genome with the microbial genome.
Using these methods will give a deeper understanding of the commensal residents, beneficial
bacteria, and the contribution to human health. (Turnbaugh et al., 2006; Hattori and Taylor, 2009;
Hanson and Weinstock, 2016).

24
Human-associated microbial communities likely play a significant role in host nutrition,
development of immunity, and protection from diverse pathogens. The human body contains
plenty different sites colonized by bacteria communities during newborn and childhood
development and throughout the lifetime of each individual (Johnson and Versalovic, 2012). In
adults, the gastrointestinal (GI) tract harbors a vast majority of microbiota achieving the highest
cell densities recorded for any ecosystem. Even though the bacterial community in the GI tract is
extremely diverse; the majority of 98% species live in gastrointestinal tract belongs to the few
bacterial divisions or phyla. Those bacterial phyla are namely Firmicutes (64%), Bacteroidetes
(23%), Proteobacteria (8%), and Actinobacteria (3%). The divisions that dominate are
Bacteroides (Bacteroides genera) and Firmicutes (Clostridium and Eubacterium genera), each
contains around 30% of the microbes in feces and the mucus covering the intestinal epithelium
(Bäckhed et al., 2005; Hattori & Taylor, 2009) (Table 2.).
The remaining species belong to minor taxonomic features that are secondary to the
majority. As described in Bäckhed and coworkers 2005, the adult human GI contains other than
bacteria the two remaining domains of life, archaea, and eukarya. The major archaeal communities
found and studied in the human gut are Methanobrevibacter smithii, Methanosphaera stadtmanae,
and Methanobrevibacter ruminantium. The main eukaryote fungi in the human intestine are
Candida, Aspergillus and Penicillium. Also, in fecal human samples have been identified more
than 1200 viral genotypes. (Rajilic-Stojanovic et al., 2007; Hattori & Taylor, 2009).
25
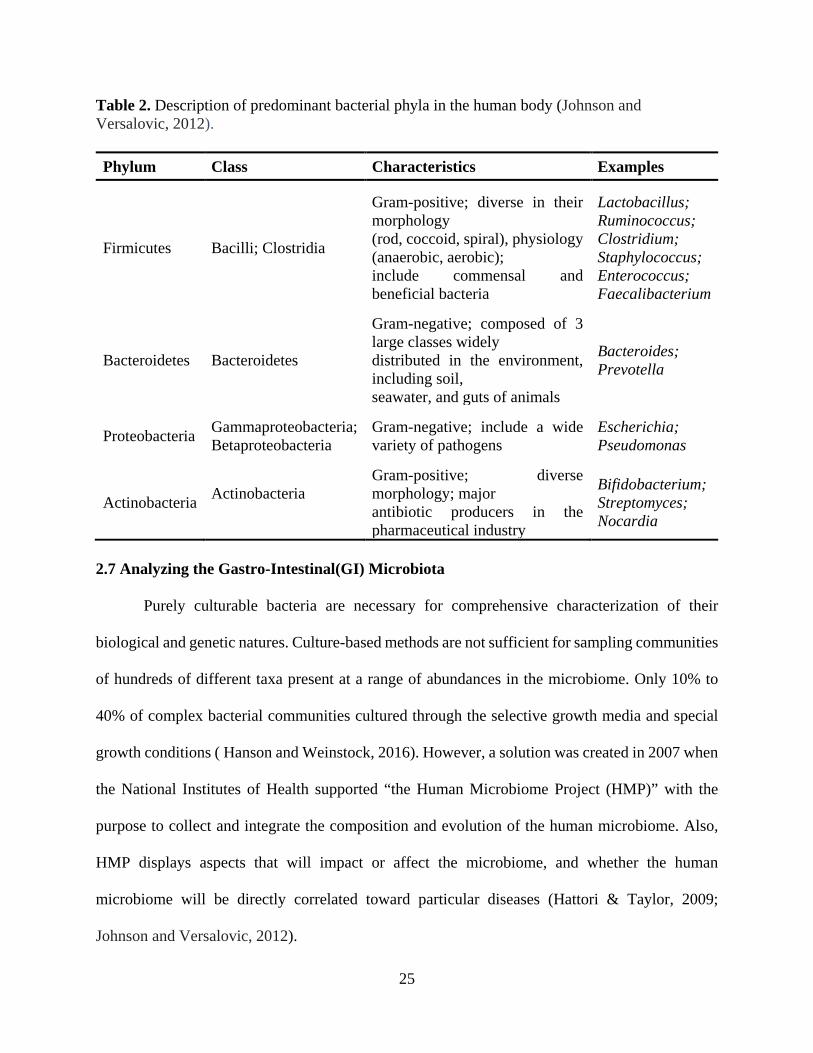
Table 2. Description of predominant bacterial phyla in the human body (Johnson and Versalovic, 2012).
Phylum Class Characteristics Examples
Firmicutes Bacilli; Clostridia
Gram-positive; diverse in their morphology (rod, coccoid, spiral), physiology (anaerobic, aerobic); include commensal and beneficial bacteria
Lactobacillus; Ruminococcus; Clostridium; Staphylococcus; Enterococcus; Faecalibacterium
Bacteroidetes Bacteroidetes
Gram-negative; composed of 3 large classes widely distributed in the environment, including soil, seawater, and guts of animals
Bacteroides; Prevotella
Proteobacteria Gammaproteobacteria; Betaproteobacteria
Gram-negative; include a wide variety of pathogens
Escherichia; Pseudomonas
Actinobacteria Actinobacteria Gram-positive; diverse morphology; major antibiotic producers in the pharmaceutical industry
Bifidobacterium; Streptomyces; Nocardia
2.7 Analyzing the Gastro-Intestinal(GI) Microbiota
Purely culturable bacteria are necessary for comprehensive characterization of their
biological and genetic natures. Culture-based methods are not sufficient for sampling communities
of hundreds of different taxa present at a range of abundances in the microbiome. Only 10% to
40% of complex bacterial communities cultured through the selective growth media and special
growth conditions ( Hanson and Weinstock, 2016). However, a solution was created in 2007 when
the National Institutes of Health supported “the Human Microbiome Project (HMP)” with the
purpose to collect and integrate the composition and evolution of the human microbiome. Also,
HMP displays aspects that will impact or affect the microbiome, and whether the human
microbiome will be directly correlated toward particular diseases (Hattori & Taylor, 2009;
Johnson and Versalovic, 2012).
26
The arrival of new molecular methods and technologies has been beneficial for the
detection of uncultured microbes and may enable more microorganisms in the future. The culture-
independent known methods are DNA pyrosequencing, microarrays (Phlytochip), next generation
DNA sequencers such as 454-FLX (Roche), SOLiD (Applied Biosystems), PacBio, and Genome
Analyzer (Illumina). DNA sequencing technologies and computational methods had been used to
identify prokaryotic taxonomy in complete environmental samples such as the microbiome by
working with the 16S ribosomal RNA gene (16S rRNA). The phylogenetic data analyses are
required for a deeper understanding of the commensal residents, beneficial microorganisms, and
their role in human health (Quail et al., 2008; Hattori & Taylor, 2009; Johnson and Versalovic,
2012).
Both methods, the culture-based, and 16-based have limitations for functional analysis. It
is with metagenomics, which made possible to comprehensively explore the biological nature of
complex communities (Weng et al., 2006). For sequencing the 16S rRNA gene it is important to
make several considerations selecting the platform that will be used. The most important attention
is to have sequence quality, also known as reads. The second consideration is the number of reads
that each can obtain per run and dollar. Finally, the last consideration for 16S rRNA studies is the
length of the study, as long the sequences are the fastest way to assign the operational taxonomic
unit (OTU) (Kozich et al., 2013).
2.7.1 Next-Generation Sequencing Method: Illumina
Next generation sequencing (NGS) is innovating the molecular biology studies throughout
a wide and rapidly growing range of applications. Due to the NGS improvements, microbial
ecology has shifted its research from observational analyses to experimental characterization of
the taxonomy in communities through the practice of complex experimental designs. This change

27
has been taken since the next-generation sequencing cost had become inexpensive and the
availability of bioinformatic tools have increased. The Illumina sequencing technology has been
under constant improvements, concerning instrumentation, processing software, and the
sequencing chemistry, to accomplish the development of more data and longer reads (Minoche et
al., 2011).
Illumina works using a chip-based bridge amplification procedure followed by a
sequencing by synthesis utilizing reversible terminator dye nucleotides. Illumina depends on
reagents and two platforms that are distinguished by their capacity of cycles, HiSeq2000 and
MiSeq, which obtain 300 and 500 cycles respectively. The HiSeq2000 generates more than 50
Gbps per day using 100-nucleoutide reads (i.e., during 10.8 days run produces 1.6 billion pairs of
reads). By contrast, the MiSeq is a one-day run experiment and produces 1.5 Gbps per day using
paired 150-nt reads (i.e., 5 million pairs of reads) (Caporaso et al., 2012). The platforms need the
same reagents since the only difference is the number of cycles, so logistically is more difficult to
fill up a 500 cycle than 300. Reagents for HiSeq2000 (300 cycles) are $500 per lane more
expensive than MiSeq. HiSeq2000 platform is the standard method for shotgun metagenomic
sequencing because it generates depth reads. However, MiSeq has better potential for 16S rRNA
gene sequence studies because it produces longer reads for a low cost (Kozich et al., 2013).
28
CHAPTER 3. MATERIALS AND METHODS
3.1 Samples collection
3.1.1 Cocoa Powder Samples
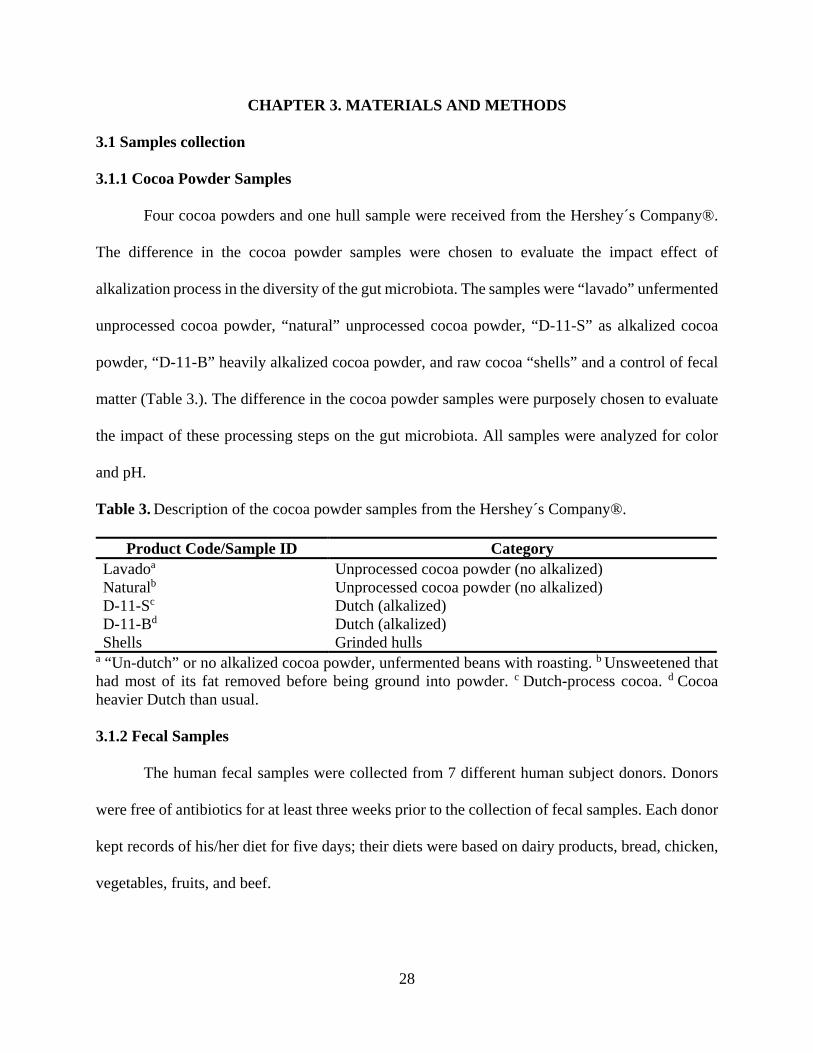
Four cocoa powders and one hull sample were received from the Hershey´s Company®.
The difference in the cocoa powder samples were chosen to evaluate the impact effect of
alkalization process in the diversity of the gut microbiota. The samples were “lavado” unfermented
unprocessed cocoa powder, “natural” unprocessed cocoa powder, “D-11-S” as alkalized cocoa
powder, “D-11-B” heavily alkalized cocoa powder, and raw cocoa “shells” and a control of fecal
matter (Table 3.). The difference in the cocoa powder samples were purposely chosen to evaluate
the impact of these processing steps on the gut microbiota. All samples were analyzed for color
and pH.
Table 3. Description of the cocoa powder samples from the Hershey´s Company®.
Product Code/Sample ID Category Lavadoa Unprocessed cocoa powder (no alkalized) Naturalb Unprocessed cocoa powder (no alkalized) D-11-Sc Dutch (alkalized) D-11-Bd Dutch (alkalized) Shells Grinded hulls
a “Un-dutch” or no alkalized cocoa powder, unfermented beans with roasting. b Unsweetened that had most of its fat removed before being ground into powder. c Dutch-process cocoa. d Cocoa heavier Dutch than usual. 3.1.2 Fecal Samples
The human fecal samples were collected from 7 different human subject donors. Donors
were free of antibiotics for at least three weeks prior to the collection of fecal samples. Each donor
kept records of his/her diet for five days; their diets were based on dairy products, bread, chicken,
vegetables, fruits, and beef.

29
The fecal sample of each contributor was collected on the fifth day of their diets. Samples were
immediately stored in an ultra-low temperature freezer (-80°C) until it was used.
3.2 Color Analyses
The samples’ color measurement was determined per treatment as triplicates to
characterize each sample. The color was measured using a chroma meter LABSCAN XE
(Hunterlab, VA) fitted with a pulsed xenon lamp and an aperture diameter of 13 mm. Each sample
was placed into a sample tray and fitted into the aperture to record the surface color. CIELAB
color scales were used and reported as L*, a* and b* values. L* values describe the lightness (100)
to darkness (0) measurements on the axis. The a* values assess the red-green hues, corresponding
positive values to redness and negative to greenness. The b* axis refers to yellow-blue hues, with
positive values referring to yellowness and negative representing blueness (Sharma 2003).
3.3 pH measurement
The pH was measured using a Mettler Toledo pH meter. The pH is an important parameter
in fermentation assessment because it can reflect microbiota growth. Also, the pH parameter is
associated with the alkalization process of cocoa samples.
3.4 Cocoa sample pre-digestion
A protocol mimicking the human digestion and absorption process in the stomach and
small intestine was established (Goita, 2013). Cocoa substrates were pretreated in the model in-
vitro digestive system to simulate the products that would reach the colon microbiota for
fermentation. The enzymatic digestion involved pepsin digestion followed by pancreatin, to
remove the digestible, non-fibrous contents of the substrate. Pepsin is an enzyme used to degrade
the protein into mostly water-soluble peptides; and the pancreatin (a mixture of amylase, lipase,
and protease) degrades protein, peptides, starches, and lipids. The protease works to hydrolyze
30
proteins into oligopeptides; amylase hydrolyzes starches into oligosaccharides and the
disaccharide maltose, and lipase hydrolyzes triglycerides into fatty acids, monoacylglycerols, and
glycerol. The digestion process was conducted as followed:
Sixty (60) g of freeze dried cocoa sample was added to 200 mL distilled water. After,
hydrochloric acid (HCl) was added to bring the solution to a pH of 2. The mixture was incubated
for 10 minutes in a shaking water bath to bring the temperature to 37°C. Next, 0.5 g (3500 U/mg)
of pepsin was added to the mixture and incubated while shaking for another 3 hours. Then the
sample pH was brought to 7.5 with a sodium hydroxide (NaOH) solution and incubated for 10
minutes to bring back the temperature to 37°C before adding 4.0 g of pancreatin (SIGMA-
ALDRICH) and 1 g of bile salts (sodium cholate and sodium deoxycholate mixture from SIGMA-
ALDRICH). The solution was mixed thoroughly for 10 minutes and then incubated at 37°C for an
extra 2 hours. The mixture was microwaved for 3-5 minutes for the enzymes denaturation and then
filtered to obtain the solids. Those remaining solids from the mixture were washed with ethanol
and filtered again and freeze dried overnight. The dried substrate was a powder that was kept
frozen in a -80°C freezer until utilized for the fermentation step.
3.5 Cocoa sample fermentation
Throughout the fermentation process, an anaerobic buffer solution was used and it was
prepared according to the following steps. The anaerobic solution was created with two solutions,
A and B, at a 9:1 ratio. The solutions were prepared as mentioned in the following steps:
Solution A was used as a redox (oxidation-reduction) indicator. To prepare solution A several
components were added, 11.76 g of sodium bicarbonate (NaHCO3), 11.1 ml of hemin (0.78
mmol/L of water), 1.1ml of menadione (0.36 mmol/L of water) and 1.1 ml of resazurin (3.98
mmol/L of water) to 1 liter of distilled water. The solution was autoclaved for 15 minutes at 121°C.
31
Solution B had a composition of 0.48 mmol of sodium chloride (NaCl), 0.02 mmol of dipotassium
phosphate (K2HPO4), and 0.63 mmol L-Cysteine-HCl, in a liter of autoclaved distilled water.
The in-vitro bacterial inoculum was prepared using 50 g of fecal sample mixed with 200
mL of the anaerobic buffer. Then the mixture was filtered with either cheesecloth or a filter whirl
pack bag. The solution was incubated at 37°C under anaerobic conditions for an hour. Sterile glass
bottles contained 175mL of the anaerobic solution (solution A and B) and 5 g of the fermentation
substrate. Then, an aliquot of 25mL of the incubated fecal bacteria solution was added to each
vessel and flushed with an anaerobic gas composition (10% CO2, 80% N2 and 10% H2) for 10
minutes. Subsequently, samples were incubated at 37°C while stirring. Finally, processed samples
were collected in 15 mL falcon tubes at 0, 6, 12, and 24 hours, and stored at -80°C until usage.
The in-vitro fermentation in a digestive model system was done in duplicates for each separate
experiment.
3.6 Nucleic Acid Extraction and sequencing
3.6.1 DNA Extraction
Using the PowerSoil® DNA Isolation Kit (MoBio), DNA was extracted from 250 µl of
stool added to the power beads tube with lysis buffer to ensure bacterial cell lysis. Purified genomic
DNA was subjected to fragmentation, ligation to sequencing adapters for identification of
individuals samples, and purification. After the amplification and denaturation steps, libraries were
pooled and sequenced. The quantity of DNA was determined using a NanoDrop 2000
spectrophotometer (Thermo Scientific). Purified DNA was stored for future analysis at -20°C.

32
3.6.2 Sequencing
The bacterial genomic DNA was amplified with the specific primers for the universal
Eubacterial 16S rRNA gene 515F (5´-GTGCCAGCMGCCGCGGTAA-3´) and 806R (5´-
GGACTACHVGGGTWTCTAAT-3´). These primers result in amplicons that are produced from
hypovariable and hypervariable regions of the gene and were used to assess the microbial ecology
of all samples using Illumina HiSeq methods by bTEFAP® DNA analysis service. All single-step
30 cycle PCRs were performed using HotStarTaq Plus Master Mix Kit (Qiagen, Valencia, CA).
On the first cycles of denaturation the settings used were 94°C for 3 minutes, followed by 28 cycles
of 94°C for 30 seconds. In the annealing process, a condition of 53°C for 40 seconds and 72°C for
1 minute were established. Finally, the elongation step was performed at 72°C for 5 minutes. All
amplicon products from samples were mixed in equal concentrations and purified using Agencourt
Ampure beads (Agencourt Bioscience Corporation, MA, USA). Samples were pooled and
sequenced utilizing the Illumina HiSeq 2500 chemistry following manufacturer’s
recommendations.
3.6.3 Bioinformatics
Raw Illumina sequencing reads obtained from the sequencer were denoised using a
proprietary pipeline from MR. DNA software (MR DNA, Shallowater, TX). The resulting Illumina
reads were filtered according to barcodes to identify different samples. Preliminary quality control
steps included the removal of sequences shorter than <200bp, and all reads containing ambiguous
base calls and sequences with homopolymer runs longer than 6 nucleotides. Chimera sequences
arising from the PCR amplification were detected and excluded from the denoised sequences.

33
3.6.4 Phylogenetic analysis
Operational taxonomic units (OTUs) were generated and defined by clustering at 3%
divergence (97% similarity). Final OTUs were taxonomically classified using BLASTn against a
curated database derived from GreenGenes/RDP/NCBI. The RDP runs were quality-controlled,
aligned for annotation of Bacterial and Archaeal 16S rRNA sequences. For the metagenomics
visualization, a web browser known as Krona was set. Krona is a new visualization tool that allows
intuitive exploration of relative abundances and confidences within the complex hierarchies
(Ondov et al., 2011).
3.7 Data Analysis
3.7.1 Color and pH analysis
Data was statistically analyzed using SAS software version 9.4 (SAS Institute Inc., Cary,
NC). Mean values of triplicate analyses were reported with their standard deviations. To determine
differences between treatments and within treatments during the fermentation time, Analysis of
Variance (ANOVA) and Tukey’s studentized range test was used at a significance level of P ≤0.05.
3.7.2 Alpha and beta diversity statistical analysis
The OTUs that reached a 97% nucleotide similarity level were used for the alpha diversity
(Shannon-Wiener) and rarefaction curve analysis using Qiime. Alpha diversity calculates how
many bacterial species are within each given sample, and is expressed by the number of species
found in the ecosystem. A heat map was created on the basis of the relative abundance of OTUs
using “R” (The “R” Project for Statistical Computing). Phylogenetic beta diversity was performed
using OTUs for each sample using the Qiime program. This analysis creates an individual
34
phylogenetic tree for each sample. Afterward, the tree is evaluated statistically for each sample
and subsequently, a coordinate analysis is applied to visualize ten separate jackknife iterative
comparisons.
The beta diversity specifically allows the comparisons of the bacteria community as a
whole, in consideration of the variety of things in each sample and how these unknown sequences
are phylogenetically related. The principal coordinate analysis (PCoA) was conducted according
to the weighted UniFrac distance matrix, calculating the relationships between organisms
phylogenetically. Weighted UniFrac is the dominant method in the field for pairwise distance
measurements. This method requires higher presence of different OTUs rather than just the mere
presence as in unweighted. Also, it is considered a powerful method for analyzing the complex
data sets, with many samples and extensive metadata, created in microbial ecology (Lozupone et
al., 2010; Golob et al., 2017). PCoA and UniFrac were used to examine the correlation between
hours of fermentation and treatments.
The statistical analysis was done using a variety of computer packages including XLstat,
NCSS 2007, and NCSS 2010. Monte Carlo simulation was performed to detect features with
significant differences from the samples remaining. All tests considered had to represent statistical
significance of p<0.05.

35
CHAPTER 4. RESULTS AND DISCUSSION
4.1 Color analysis
The texture, flavor and color of cocoa powder is dependent on the type of processing it
goes through. The “Dutch” process, also known as alkalization, affects these characteristics. Alkali
treatment involves adding agents, NaOH or K2CO3, dissolved in water directly to the powder
allowing the mixture to react. This process neutralizes the normal cocoa acidity, raises the pH,
darkens the cocoa, reduces the acid and astringent taste of cocoa improving its flavor (Li et al.,
2012). Representative samples of natural cocoa, along with a series of dark brown/black and
reddish alkali-processed were used in this study.
Polyphenols in cocoa powder are associated with health benefits and also are involved in
the production of the brown cocoa color and the astringent taste (Li et al., 2014). The cocoa
samples that have not been alkalized, natural and lavado, have a pale to light brown color. The D-
11-S and D-11-B showed a range going from red/brown to dark brown/black (Table 4). Although
all alkalized cocoa powders can vary in color from reddish brown to darker brown, and this
characteristic is dependent of the alkalization process. As Li and collaborators (2012) explained,
this process improves the flavor and appearance of a wide range of products and therefore is an
important procedure for chocolate and food manufacturers.
Table 4. Characteristics of the cocoa samples in color and pH before the digestion and then fermentation.
Samples Color Description¥ Color L* Color a* Color b* pH D-11-B Dark brown/black 23.73±0.41a 8.32±0.06d 10.76±0.14d 7.65±0.01a D-11-S Red/Brown 40.63±0.37b 18.81±0.01a 26.70±0.02a 6.87±0.03b Natural Light brown 50.23±0.58c 15.64±0.04b 28.17±0.17a 5.19±0.04d Lavado Pale brown 52.95±1.74d 12.09±0.38c 20.02±0.84b 5.41±0.06c Shell Dark and light brown 35.74±1.68e 11.41±1.13c 14.91±1.97c 5.17±0.04d
The means and standard error with the same letters are not significantly different (P<0.05). ¥ Color description refers to a visual observation. a-d means with a different letter along each column represents significantly difference between treatments.

36
The colors of the cocoa samples were characterized by a chroma meter LABSCAN XE
using L*, a* and b* values (Table 4). The lavado and natural cocoa powder had the highest L*
values being significantly different. While the powders that have gone further with the Dutch
process showed a significant decrease in L* values. Due to the fact that D-11-B is a sample that
has been heavily alkalized it has the lowest L* value. The a* and b* values were significantly
different almost in every sample, only lavado and shells were the same on a*; and for b* D-11-S
and natural reported similarities.
The a* scale reveals that un-alkalized samples and shells have values between 11 to 15,
but the heavily alkalized D-11-B have the lowest a* value; indicating a significant reduction of
the red component. As the color increases to brown/black a progressive reduction in polyphenol
content was evident. During alkalization the anthocyanins, procyanidins, and catechins, are
changed into quinones, which form high molecule weight insoluble brown compound. Hence, the
darker the cocoa powder is, less astringent, and a basic pH but a decreased in the polyphenol
content will be notice (Li et al., 2014).
4.2 Gut microbiota
A total of 3,799,034 sequences were parsed and 3,309,403 were clustered. After a high-
quality sequence curation, the Bacteria and Archaea domain were utilized for the final microbial
analyses with a total of 3,308,382 sequences identified; the remaining 1,021 sequences belonged
to the domain of Eukaryota, Metazoa, and Viridiplantae domains. For the final microbial analyses,
3,301,825 sequences were identified within the bacteria domain, representing 99.7% of high-
quality reads (Table 5).

37
At 0 hours, the sample that showed the highest microbial diversity was D-11-S, followed
by D-11-B and shells. For the 6 and 12 hours, besides the control, samples that had more sequence
counts were D-11-B and lavado. At 24 hours, the order of maximum readings were D-11-S, shells,
and lavado.
Table 5. Comparison of sequence amount estimation of the 16S rRNA gene libraries at 97% similarity from the Illumina sequencing analysis before trimming and quality filtering.
Treatments
Number of Sequence counts per hour 0 hours 6 hours 12 hours 24 hours
Control 263714 39286 38290 223730 D-11-B 278152 34950 30598 217703 D-11-S 282044 29876 22853 244252 Natural 252275 33955 25765 231307 Lavado 177988 32914 31804 239968 Shells 273241 28328 29686 240724
After cleaning, quality filtering and dereplication, the input sequences were ordered
according to their abundances considering that the high abundance reads are more likely correct
and convenient to use as cluster seeds. Based on the results tested by Mr. DNA lab, the operational
taxonomic units (OTU) analysis were defined after the removal of singleton sequences, clustering
at 3% (97% similarity).
For alpha and beta diversity analysis, samples were rarefied to 25,000 sequences and
bootstrapped at 20,000 sequences. The Shannon-Wiener Index curve plot reaches a plateau at
approximately 5,000 sequences indicating that sequencing depth was sufficient to capture the full
scope of microbial diversity making the data reliable. The Shannon-Wiener Index (Figure 2), is a
measured to define the alpha-diversity, both evenness and number of distinct organisms within
samples, within an environment.
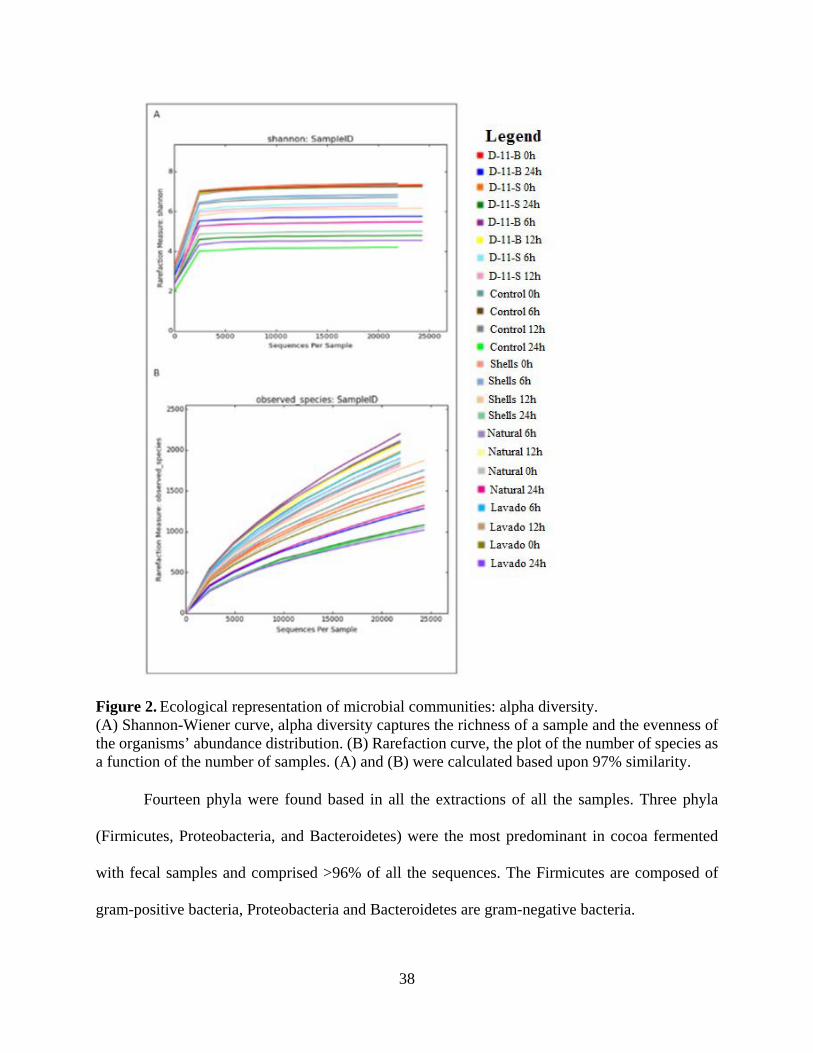
38
Figure 2. Ecological representation of microbial communities: alpha diversity. (A) Shannon-Wiener curve, alpha diversity captures the richness of a sample and the evenness of the organisms’ abundance distribution. (B) Rarefaction curve, the plot of the number of species as a function of the number of samples. (A) and (B) were calculated based upon 97% similarity.
Fourteen phyla were found based in all the extractions of all the samples. Three phyla
(Firmicutes, Proteobacteria, and Bacteroidetes) were the most predominant in cocoa fermented
with fecal samples and comprised >96% of all the sequences. The Firmicutes are composed of
gram-positive bacteria, Proteobacteria and Bacteroidetes are gram-negative bacteria.
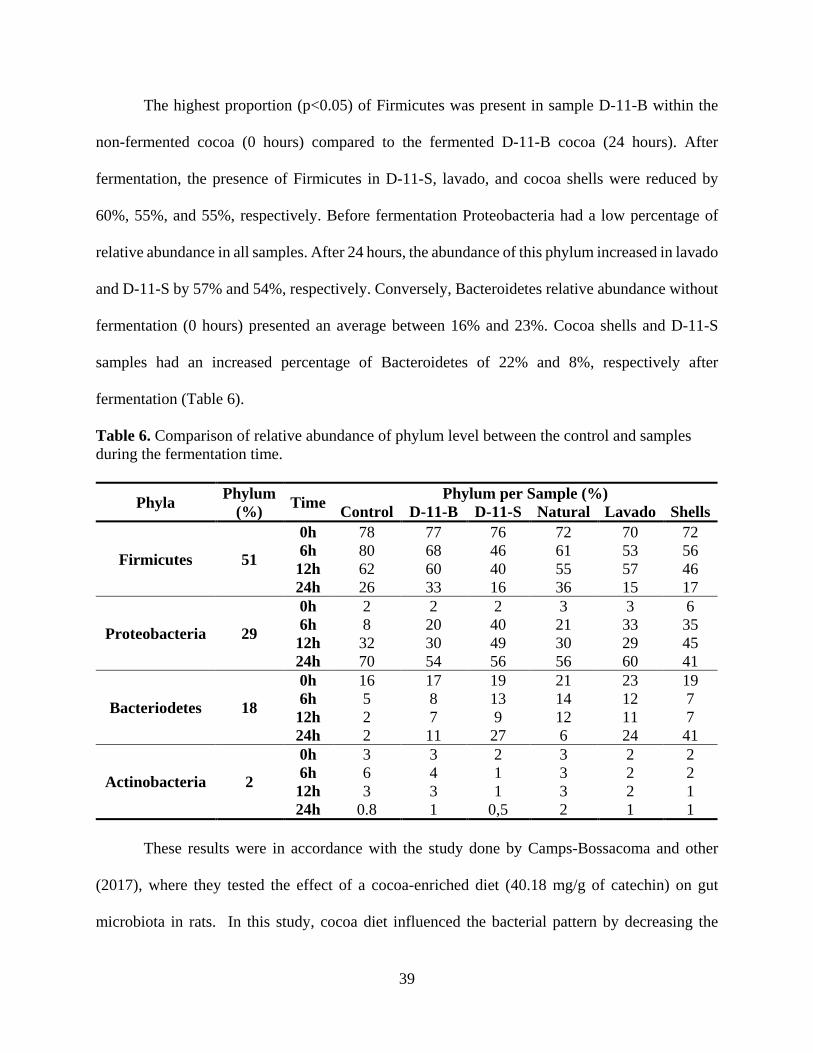
39
The highest proportion (p<0.05) of Firmicutes was present in sample D-11-B within the
non-fermented cocoa (0 hours) compared to the fermented D-11-B cocoa (24 hours). After
fermentation, the presence of Firmicutes in D-11-S, lavado, and cocoa shells were reduced by
60%, 55%, and 55%, respectively. Before fermentation Proteobacteria had a low percentage of
relative abundance in all samples. After 24 hours, the abundance of this phylum increased in lavado
and D-11-S by 57% and 54%, respectively. Conversely, Bacteroidetes relative abundance without
fermentation (0 hours) presented an average between 16% and 23%. Cocoa shells and D-11-S
samples had an increased percentage of Bacteroidetes of 22% and 8%, respectively after
fermentation (Table 6).
Table 6. Comparison of relative abundance of phylum level between the control and samples during the fermentation time.
Phyla Phylum (%) Time Phylum per Sample (%)
Control D-11-B D-11-S Natural Lavado Shells
Firmicutes 51
0h 78 77 76 72 70 72 6h 80 68 46 61 53 56 12h 62 60 40 55 57 46 24h 26 33 16 36 15 17
Proteobacteria 29
0h 2 2 2 3 3 6 6h 8 20 40 21 33 35 12h 32 30 49 30 29 45 24h 70 54 56 56 60 41
Bacteriodetes 18
0h 16 17 19 21 23 19 6h 5 8 13 14 12 7 12h 2 7 9 12 11 7 24h 2 11 27 6 24 41
Actinobacteria 2
0h 3 3 2 3 2 2 6h 6 4 1 3 2 2 12h 3 3 1 3 2 1 24h 0.8 1 0,5 2 1 1
These results were in accordance with the study done by Camps-Bossacoma and other
(2017), where they tested the effect of a cocoa-enriched diet (40.18 mg/g of catechin) on gut
microbiota in rats. In this study, cocoa diet influenced the bacterial pattern by decreasing the

40
percentages of Firmicutes phylum and increasing Bacteroidetes, Proteobacteria, and
Actinobacteria as the result of this cocoa product. Camps-Bossacoma and collaborators associate
their outcome with the cocoa composition, which is rich in polyphenols (flavonoids), also
carbohydrates, proteins, lipids, fiber, and minerals. It has been reported that polyphenols have
diverse prebiotic effects and antimicrobial activities, and excessive amounts of polyphenols may
inhibit the growth of beneficial microorganisms (Chodak, 2012).
Another possible mechanism is the content of polyphenols on the gut microbiota
composition. Processing cocoa through the alkalization process had shown that components such
as polyphenols are lost or reduced (Li et al., 2013). Many studies have been conducted to
investigate the ratio between the most abundant phylum in the GI tract, Firmicutes and
Bacteriodetes. The F:B ratio has been associated with obesity or weight loss (Cho and Blaser,
2012; Sanz et al., 2013).
In the study by Duda-Chodak and collaborators (2015) they determined that higher levels
of F:B were found in obese subjects than those maintaining a natural weight. This indicates that it
may be possible to incorporate D-11-B or natural cocoa into a diet for a possible decrease in the
ratio of F:B in the gut microbiota to maintain a natural weight. Comparatively the increase in the
presence of Bacteroidetes from the D-11-S, lavado, and shells could lessen weight gain when
incorporated into a diet. Methylxanthines induce acid and pepsin secretions in the GI tract. A
synergistic interaction between methylxanthines and flavonoids is suggested by Dulloo (2011) and
may be involved in the effects on body weight. The interaction of cocoa polyphenols and dietary
fiber repress the growth of certain bacteria modifying microbiota composition and immune
response. However, the sole presence of cocoa polyphenols does not have a direct effect on body
weight (Massot-Cladera et al., 2015).
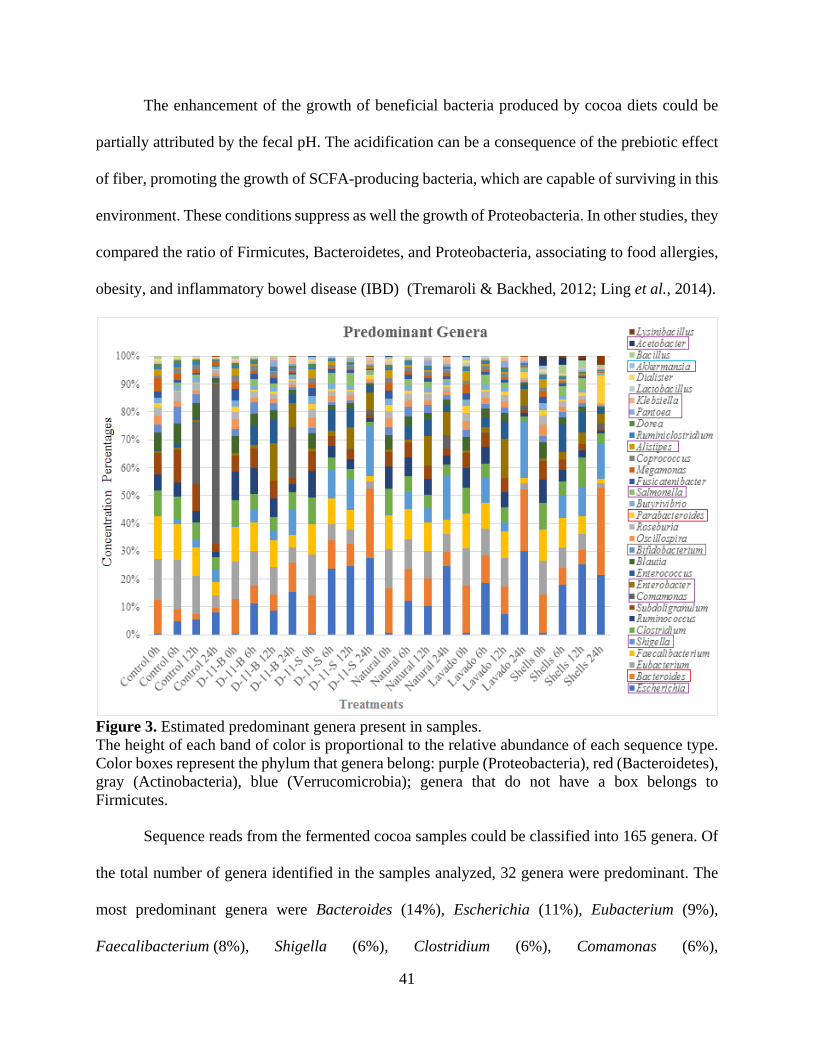
41
The enhancement of the growth of beneficial bacteria produced by cocoa diets could be
partially attributed by the fecal pH. The acidification can be a consequence of the prebiotic effect
of fiber, promoting the growth of SCFA-producing bacteria, which are capable of surviving in this
environment. These conditions suppress as well the growth of Proteobacteria. In other studies, they
compared the ratio of Firmicutes, Bacteroidetes, and Proteobacteria, associating to food allergies,
obesity, and inflammatory bowel disease (IBD) (Tremaroli & Backhed, 2012; Ling et al., 2014).
Figure 3. Estimated predominant genera present in samples. The height of each band of color is proportional to the relative abundance of each sequence type. Color boxes represent the phylum that genera belong: purple (Proteobacteria), red (Bacteroidetes), gray (Actinobacteria), blue (Verrucomicrobia); genera that do not have a box belongs to Firmicutes.
Sequence reads from the fermented cocoa samples could be classified into 165 genera. Of
the total number of genera identified in the samples analyzed, 32 genera were predominant. The
most predominant genera were Bacteroides (14%), Escherichia (11%), Eubacterium (9%),
Faecalibacterium (8%), Shigella (6%), Clostridium (6%), Comamonas (6%),

42
Ruminococcus (5%), Subdoligranulum (4%), Enterobacter (3%), Blautia (3%), Bifidobacterium
(2%), Roseburia (2%), Oscillospira (2%), and Parabacteroides (2%). Among the shared
predominant genera in all the treatments, Bacteroides and Parabacteroides belonged to the phylum
Bacteroidetes. Escherichia, Comamonas, Enterobacter, and Shigella are members of
Proteobacteria phylum. Correspondingly, for Actinobacteria it would be Bifidobacterium and the
remaining nine genera belonged to Firmicutes. (Figure 3).
In the control group (fecal sample without cocoa), fifteen genera were predominantly
detected. The genera that increased in percentages through fermentation time belonged to the
Proteobacteria phylum. Specifically, the microbiota of the control after fermentation was
characterized by a depletion of the two phyla of bacteria, Firmicutes and Bacteriodetes. A
disruption of homeostasis, by environmental or host factors, such as a low-fiber diet can cause
dysbiosis with a growth of Proteobacteria in the gut (Shin et al., 2015). Proteobacteria increasing
ratios through fermentation can be due to substrate limitations. The most prevalent growing genus
through time was the Comamonas. The species detected was Comamonas kerstersii that is
considered non-pathogenic, and a non-fermenting Proteobacteria (Opota et al., 2013). The species
of Comamonas related to human diseases is Comamonas testosteroni, but they are rarely clinically
significant as all Comamonas (Arda et al.,2013).
With regard to the D-11-B group, heavily alkalized cocoa, ten genera were identified. Of
the ten, four genera reside in the Proteobacteria phylum including Escherichia, Shigella,
Enterobacter, and Comamonas. Escherichia and Shigella had a significantly increase at the 6 hours
fermentation period. The point of growth for Enterobacter and Comamonas was at 12 and 24
hours, respectively. Bacteroides and Parabacteroides stayed consistent through the 24 hours of
fermentation while Firmicutes decreased.

43
The fermentation of the D-11-S cocoa sample group, alkalized treatment, had seven genera
that were predominant. Some changes in the microbiota composition appeared due to limited
substrate for the samples and the change in pH (Massot-Cladera et al., 2015). It is worth noting
that the genus Bacteroides percentage increased at the 24 hours, as well as Parabacteroides. Also,
some bacteria like Bifidobacterium colonized the mucus layer and start growing. Further five
bacterial genera from the Firmicutes phylum almost disappeared during the cocoa fermentation
after 24 hours.
Observing the results on the natural cocoa samples, Bacteroides genus decrease in
percentages during 24-hour fermentation, in contrast with the rest of the samples. The principal
genera representing Firmicutes such as Eubacterium, Faecalibacterium, Clostridium, and
Ruminococcus remained constant over time, showing a minimal decrease at the 24 hours of
fermentation. Escherichia, Shigella, and Enterobacter genera from Proteobacteria, at the 0 hours
percentages was minimal having a growth at the 24 hours.
In regard with lavado and shells, these two samples had similar results. Proteobacteria
represented genera increase and Firmicutes decrease through time. It is worth observing that the
quantity of Bacteroides and Parabacteroides had an increase in percentages at 24 hours. Mirpuri
and collaborators (2014) describe that Firmicutes or lack of Bacteroidetes expansion is due to
competition or inhibition by Proteobacteria, however, the precise mechanism is unknown. As
previously stated, Proteobacteria is abundant in the gut microbiota; Camps-Bossacoma and others
(2017) stated that the more relative abundance of Proteobacteria, the higher are the IgA levels.
To provide a visual overview combined with the previous analysis, we utilize a dual
hierarchal dendrogram to display the data for the predominant genera with clustering related to the
different groups. The heatmap is compared with the same proportion of bacterial diversity. The
44
analysis revealed four major groups of microbial communities. The most diverse communities
were those at the end of the fermentation, and this was reflected in the Shannon diversity (Figure
3). Based on the clustering in Figure 4, it showed a significant difference between the 0 hours and
24 hours collection samples. Upon closer analysis, it also displayed similarities in the microbial
community of the populations treated with shells and D-11-S at hours 6 and 12 closely resemble
the microbial composition of the natural or D-11-B populations at hour 24.
Genera that were in the samples but almost absent or disappear during the fermentation
were Butyrivibrio, Akkermansia, Lysinbacillus, Acetobacter, Bacillus, Klebsiella,
Methanobrevibacter, Lachnoclostridium, Dialister, Preludibacter, and Lactobacillus. Genera
growing through fermentation were Enterococcus, Enterobacter, Shigella, Escherichia belonging
to Proteobacteria; Bacteroides and Parabacteroides belonging to Bacteroidetes.
By the abundance of Bacteroides and Parabacteroides, and the presence of
Bifidobacterium, D-11-B and natural cocoa at 6 hours of fermentation array a healthy pattern of
the diversity in the gut microbiota. This healthy pattern is attributed to the SCFA, acetate,
propionate, and succinate, produced by the fermentation of the Bacteroides as previously stated
by Duncan and collaborators (2004), and Louis and collaborators (2007). The presence of
Bifidobacterium, a probiotic, improves the digestion absorption in the immune system while
enhancing Eubacterium ability to convert lactate into acetate and butyrate (Leahy et al. 2005; Sato
et al. 2008).
It is well known that non-digestible complex carbohydrates are metabolized by the human
microbiota to oligosaccharides and then fermented to SCFA (Massot-Cladera et al., 2015). After
the fermentation of cocoa powder and fiber, both reach the colon intact. There the commensal
bacteria have the opportunity to metabolize and influence the intestinal environment and the

45
immune system. As a genus of importance in this study was Bacteroides, Bird and collaborator
(2000) state in their investigation that Bacteroides by itself does not produce butyrate as the final
product.
Figure 4. Dual hierarchal dendrogram evaluation of the taxonomic classification data. Sample clustered on the X-axis is labeled based upon the treatment. Samples with more similar microbial populations are mathematically clustered closer together. The genera (consortium) are used for clustering. Thus, the samples with a more similar consortium of genera cluster closer together with the length of connecting lines (top of heatmap) related to the similarity, shorter lines between two samples indicate closely matched microbial consortium. The heatmap represents the relative percentages of each genus. The predominant genera are represented along the right Y-axis. The legend for the heatmap is provided in the upper left corner.

46
Therefore, Louis and collaborators (2007) mentioned that Bacteroides stick to the surface
of starch molecules and ferment dietary fiber into intermediate products and with the collaboration
of other species they can produce butyrate. A sample that has high percentages of these genera was
cocoa shells, and it was also the sample that presents the lowest pH, affirming the investigation of
Walker and others (2005) that butyrate production is done in anaerobe acidify environment.
Making this relation, butyrate is related as the major source of energy for epithelial cells of
colonic mucosa and stimulates cells proliferation (Cummings, 1981). Also, gives protection
against cancer and ulcerative colitis by blocking the absorption of carcinogenic substances and
making the colon less susceptible to DNA damage (Kushkevych, 2014). In addition, the absorption
of calcium (Ca) increased through the butyrate helping in the maintenance of a healthy epithelium
(Gibson and Mccartney, 1993; Asp et al., 1996). The growth of Bacteroides and Parabacteroides
after the 24 hours of fermentation is commonly related to positive benefits in health.
For beta diversity analysis, a principal coordinate analysis plot was generated based upon
the weighted UniFrac distance matrix. The coefficient shows the monotonicity between the true
distance between communities and the times. Figure 5 displays the weighted UniFrac plot of the
collection time (Fig.5A.) and to complement the weighted UniFrac plot of the treatment (Fig. 5B.).
After examining each UniFrac plot, it appears there is a strong correlation between phylogenetic
assemblage and collection time. Additionally, there appears to be phylogenetic assemblage among
each treatment group collected at both 6 hours and 12 hours that is significantly different from the
remaining collection times; with exception of the natural and D-11-B samples collected at 6, 12,
and 24 hours. The shells demonstrated the highest percent variation at the 24 hours.

47
Figure 5. Coordinate analysis plot generated based upon the weighted UniFrac distance matrix. A. represents the weighted UniFrac PCoA Plot: Collection Time. B. represents the weighted UniFrac PCoA Plot: Treatment.
4.3 pH
The pH in cacao is closely related to the proportion of fatty acids and the fermentation
process. As what appeared in (Table 7) the control was significantly different from all the samples
within the hours (P<0.05). At the starting time (0 hours) pH in the in vitro fermentation, there was
a statistical difference between D-11-S and shells. The major decrease in pH during fermentation
was reflected after 6 hours when all the treatments show a significant reduction over time. In the
pH shells had a consistent tendency of having the more acidic values, followed by lavado and
natural that were statistically similar. The alkalinized treatments, D-11-B and D-11-S, regardless
of the strength of the process showed a statistically equal pH over time. Of all the treatments, the
control had the more basic pH. These results of pH reduction can be attributed to the presence of
microorganisms in the samples fermenting carbohydrates.
A.
B.
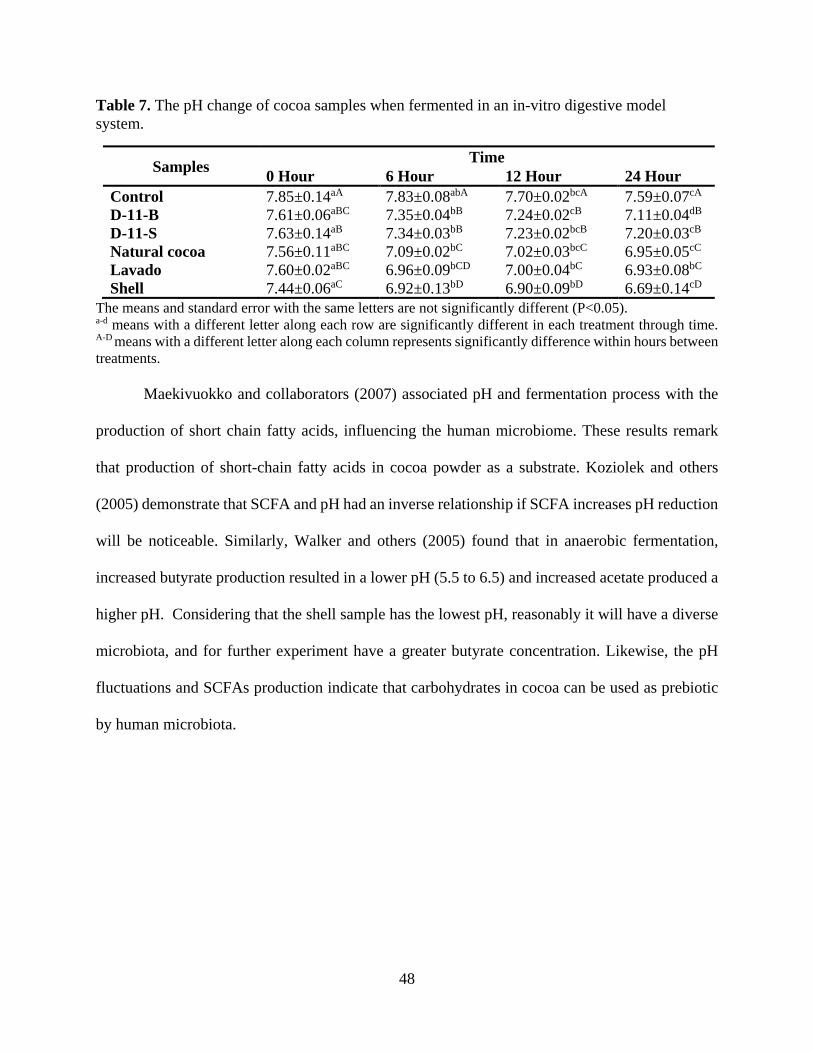
48
Table 7. The pH change of cocoa samples when fermented in an in-vitro digestive model system.
Samples Time 0 Hour 6 Hour 12 Hour 24 Hour
Control 7.85±0.14aA 7.83±0.08abA 7.70±0.02bcA 7.59±0.07cA D-11-B 7.61±0.06aBC 7.35±0.04bB 7.24±0.02cB 7.11±0.04dB D-11-S 7.63±0.14aB 7.34±0.03bB 7.23±0.02bcB 7.20±0.03cB Natural cocoa 7.56±0.11aBC 7.09±0.02bC 7.02±0.03bcC 6.95±0.05cC Lavado 7.60±0.02aBC 6.96±0.09bCD 7.00±0.04bC 6.93±0.08bC Shell 7.44±0.06aC 6.92±0.13bD 6.90±0.09bD 6.69±0.14cD
The means and standard error with the same letters are not significantly different (P<0.05). a-d means with a different letter along each row are significantly different in each treatment through time. A-D means with a different letter along each column represents significantly difference within hours between treatments.
Maekivuokko and collaborators (2007) associated pH and fermentation process with the
production of short chain fatty acids, influencing the human microbiome. These results remark
that production of short-chain fatty acids in cocoa powder as a substrate. Koziolek and others
(2005) demonstrate that SCFA and pH had an inverse relationship if SCFA increases pH reduction
will be noticeable. Similarly, Walker and others (2005) found that in anaerobic fermentation,
increased butyrate production resulted in a lower pH (5.5 to 6.5) and increased acetate produced a
higher pH. Considering that the shell sample has the lowest pH, reasonably it will have a diverse
microbiota, and for further experiment have a greater butyrate concentration. Likewise, the pH
fluctuations and SCFAs production indicate that carbohydrates in cocoa can be used as prebiotic
by human microbiota.
49
CHAPTER 5. SUMMARY AND CONCLUSIONS
In this study, we determine the effect of the alkalization process of the cocoa bean in the
diversity of the gut microbiota throughout an in-vitro fermentation. Analyses performed for color
and pH were directly related to the presence of polyphenols in the cocoa samples.
Concerning color and pH study, polyphenols in cocoa powder are associated with health
benefits and also are involved in the production of the brown cocoa color and the astringent taste.
These characteristics are directly affected during alkalization. The anthocyanins, procyanidins, and
catechins are changed into quinones, which form high molecular weight insoluble brown
compound (Li et al., 2014). Sample D-11-B was the darkest cocoa with a basic pH. The processed
samples, D-11-S, natural, and shells showed dark color but lighter than D-11-B. Making lavado
the lightest cocoa powder because it is unfermented and unprocessed. Thus, the darker cocoa
powder is, the less astringent it will taste, but it will decrease polyphenol content.
Overall the alkalization process did affect the diversity of the gut microbiota, but the effect
was not consistent for only alkalinized cocoa. The reduction of Firmicutes and Bacteriodetes (F:B)
by the non-alkalinized natural cocoa and the alkalinized D-11-B affect the diversity of the gut
microbiota and promote a natural weight. The percentage of Bacteriodetes increase in the
alkalinized D-11-S, the non-alkalinized natural cocoa, and the shells attributing to a reduce weight
gain when incorporated into a diet. Increases in the growth of the gut microbiota from all samples
of cocoa were present.
The analysis of pH correlated to microbial diversity and helped us understand what form
of cocoa was more active during the fermentation, alkalized or non-alkalized. The major decrease
in pH during fermentation was reflected after 6 hours. The non-alkalized shells had the largest
drop in pH over the 24 hours. Based on the microbial diversity of Bacteroides and

50
Parabacteroides, and the presence of Bifidobacterium in samples D-11-B and natural cocoa at 6
hours of fermentation array a healthy pattern in the gut microbiota. This healthy pattern is
attributed to the fermentation products as acetate and butyrate by Bacteroides, Parabacteroides,
Bifidobacterium and Eubacterium.
In conclusion, cocoa powder can be used as a prebiotic and its consumption may aid in the
prevalence of a beneficial microbiota in the human gut. Of the samples presented both D-11-B and
natural cocoa presented microbial diversity in the gut microbiota. They both had reduced ratios of
Firmicutes to Bacteriodetes that are associated with weight management. The color profile of the
D-11-B is a dark/brown, which had been through alkalization to darken the powder and remove
bitterness. Natural cocoa has a light brown color and has not been processed. The pH of the
alkalized D-11-B is basic as compared with the acidic pH of the natural cocoa. These color and
pH variation between the two samples could allow manufacturers to utilize microbial diverse cocoa
and have the option of color and pH dependent upon its future use. Also, cocoa shell has a good
profile for the consumption and develop a diversity microbiota.

51
REFERENCES
Ackar, D., Valek Lendić, K., Valek, M., Šubarić, D., Miličević, B., Babić, J., & Nedić, I. (2013). Cocoa polyphenols: can we consider cocoa and chocolate as potential functional food? Journal of chemistry, 2013.
Arda, B., Aydemir, S., Yamazhan, T., Hassan, A., Tunger, A. & Serter, D. (2003). Comamonas
testosteroni meningitis in a patient with recurrent cholesteatoma. APMIS, 111, 474–477. Asp, N. G., Van Amelsvoort, J. M. M., & Hautvast, J. G. A. J. (1996). Nutritional implications of
resistant starch. Nutrition research reviews, 9(01), 1-31. Bäckhed, F., Ley, R. E., Sonnenburg, J. L., Peterson, D. A., & Gordon, J. I. (2005). Host-bacterial
mutualism in the human intestine. science, 307(5717), 1915-1920. Baptista, L. (2009). Guia tecnica el Cultivo de Cacao de la Republica Dominicana, Santo
Domingo. Santo Domingo, Republica Dominicana.Centro para el Desarrollo Agropecuario y Forestal CEDAF, 250.
Beckett, S.T. (2009). Industrial Chocolate Manufacture and Use: Fourth Edition. Industrial
Chocolate Manufacture and Use: Fourth Edition. Bird, A.R., Brown, I.L. & Topping, D.L. (2000). Starches, Resistant Starches, the Gut Microflora
and Human Health Further Reading, 1, 25–37. Boisen, S., & Eggum, B. O. (1991). Critical evaluation of in vitro methods for estimating
digestibility in simple-stomach animals. Nutrition research reviews, 4(01), 141-162. Booijink, C. C., Zoetendal, E. G., Kleerebezem, M., & De Vos, W. M. (2007). Microbial
communities in the human small intestine: coupling diversity to metagenomics. Brown, I., Warhurst, M., Arcot, J., Playne, M., Illman, R.J. & Topping, D.L. (1997). Fecal
Numbers of Bifidobacteria Are Higher in Pigs Fed Bifidobacterium longum with a High Amylose Cornstarch Than with a Low Amylose, 1822–1827.
Butts, C. A., Monro, J. A., & Moughan, P. J. (2012). In vitro determination of dietary protein and
amino acid digestibility for humans. The British journal of nutrition, 108(S2), S282. Camps-bossacoma, M., Pérez-cano, F.J., Franch, À. & Castell, M. (2017). Gut Microbiota in a Rat
Oral Sensitization Model : Effect of a Cocoa-Enriched Diet, 2017. Cani, P. D., Dewever, C., & Delzenne, N. M. (2004). Inulin-type fructans modulate gastrointestinal
peptides involved in appetite regulation (glucagon-like peptide-1 and ghrelin) in rats. British Journal of Nutrition, 92(03), 521-526.

52
Cani, PD. & Delzenne, NM. (2007). Gut microflora as a target for energy and metabolic homeostasis. Curr Opin Clin Nutr Metab Care 10, 729-734.
Caporaso, J.G., Lauber, C.L., Walters, W.A., Berg-lyons, D., Huntley, J., Fierer, N., Owens, S.M.,
Betley, J., Fraser, L., Bauer, M., Gormley, N., Gilbert, J.A., Smith, G. & Knight, R. (2012). Ultra-high-throughput microbial community analysis on the Illumina HiSeq and MiSeq platforms. The ISME Journal, 6, 1621–1624.
Cherbut, C. (2002). Inulin and oligofructose in the dietary fibre concept. British Journal of
Nutrition, 87(S2), S159-S162. Cho, I., & Blaser, M. J. (2012). The human microbiome: at the interface of health and
disease. Nature Reviews Genetics, 13(4), 260-270. Cummings, J. H. (1981). Short chain fatty acids in the human colon. Gut, 22(9), 763. Cummings, J. H., & Macfarlane, G. T. (1997). Role of intestinal bacteria in nutrient
metabolism. Clinical nutrition, 16(1), 3-11. de Vrese M, Stegelmann A, Richter B, Fenselau S, Laue C & Schrezenmeir J. (2001). Probiotics-
-compensation for lactase insufficiency. Am J Clin Nutr 73, 421S-429S. Delzenne, N.M., Neyrinck, A.M. & Cani, P.D. (2011). Modulation of the gut microbiota by
nutrients with prebiotic properties : consequences for host health in the context of obesity and metabolic syndrome, 10, 1–12.
Duda-Chodak, A., Tarko, T., Satora, P., & Sroka, P. (2015). Interaction of dietary compounds,
especially polyphenols, with the intestinal microbiota: a review. European journal of nutrition, 54(3), 325-341.
Dulloo, G. (2011). The search for compounds that stimulate thermogenesis in obesity
management: From pharmaceuticals to functional food ingredients. Obesity Reviews, 12(10), 866–883.
Duncan, S.H., Barcenilla, A., Stewart, C.S., Pryde, S.E. & Flint, H.J. (2002). Acetate Utilization
and Butyryl Coenzyme A ( CoA ): Acetate-CoA Transferase in Butyrate-Producing Bacteria from the Human Large Intestine, 68, 5186–5190.
Duncan, S.H., Louis, P. & Flint, H.J. (2004). Lactate-Utilizing Bacteria, Isolated from Human
Feces, That Produce Butyrate as a Major Fermentation Product, 70, 5810–5817. Encarnação, J.C., Abrantes, A.M., Pires, A.S. & Botelho, M.F. (2015). Revisit dietary fiber on
colorectal cancer : butyrate and its role on prevention and treatment, 465–478.
53
Falony G, Vlachou A, Verbrugghe K & De Vuyst L. (2006). Cross-feeding between Bifidobacterium longum BB536 and acetate-converting, butyrate-producing colon bacteria during growth on oligofructose. Appl Environ Microbiol 72, 7835-7841.
Forsythe, P., Sudo, N., Dinan, T., Taylor, V.H. & Bienenstock, J. (2010). Mood and gut feelings.
Brain, Behavior, and Immunity, 24, 9–16. Fuller, R. (1989). Probiotics in man and animals. Journal of applied bacteriology, 66(5), 365-378. Ferguson JD, Sklan D, Chalupa WV & Kronfeld DS. (1990). Effects of hard fats on in vitro and
in vivo rumen fermentation, milk production and reproduction in dairy cows. J Dairy Sci 73, 2864-2879.
Gareau, M. G., Sherman, P. M., & Walker, W. A. (2010). Probiotics and the gut microbiota in
intestinal health and disease. Nature Reviews Gastroenterology and Hepatology, 7(9), 503-514.
Gerritsen, J., Smidt, H., Rijkers, G.T. & Vos, W.M. De. (2011). Intestinal microbiota in human
health and disease: The impact of probiotics. Genes and Nutrition, 6, 209–240. Gibson, G.R. & Mccartney, A.L. (1993). The gut microbial ecosystem, 26, 222–228. Gibson, G. R., & Roberfroid, M. B. (1995). Dietary modulation of the human colonic microbiota:
introducing the concept of prebiotics. The Journal of Nutrition, 125(6), 1401. Goita, M. (2013). Determination of Cane Berry Pomaces Benefits Through in Vitro Model for
Human Colonic Fermentation. Golob, J.L., Margolis, E., Hoffman, N.G. & Fredricks, D.N. (2017). Evaluating the accuracy of
amplicon-based microbiome computational pipelines on simulated human gut microbial communities, 1–13.
Grimble, G.K. & Silk, D.B. (1989). Peptides in human nutrition. Nutrition research reviews, 2,
87–108. Gu, L., House, S.E., Wu, X., Ou, B. & Prior, R.L. (2006). Procyanidin and catechin contents and
antioxidant capacity of cocoa and chocolate products. Journal of Agricultural and Food Chemistry, 54, 4057–4061.
Hanson, B. M., & Weinstock, G. M. (2016). The importance of the microbiome in epidemiologic
research. Annals of Epidemiology, 26(5), 301-305. Hattori, M., & Taylor, T. D. (2009). The human intestinal microbiome: a new frontier of human
biology. DNA Research, 16(1), 1-12.

54
Hijova, E., & Chmelarova, A. (2007). Short chain fatty acids and colonic health. Bratislavské lekárske listy, 108(8), 354.
Ilhan, Z. E., Marcus, A. K., Kang, D. W., Rittmann, B. E., & Krajmalnik-Brown, R. (2017). pH-
Mediated Microbial and Metabolic Interactions in Fecal Enrichment Cultures. mSphere, 2(3), e00047-17.
Illanep, Silvia. (2005). Inventory of the Health and Nutritional Attributes of Cocoa and Chocolate.
PCR. London, Nov.2005. Johnson, C. L., & Versalovic, J. (2012). The human microbiome and its potential importance to
pediatrics. Pediatrics, 129(5), 950-960. Kamphuis, H. J. (2009). Production and quality standards of cocoa mass, cocoa butter, and cocoa
powder. Industrial Chocolate Manufacture and Use, Fourth Edition, 121-141. Kozich, J.J., Westcott, S.L., Baxter, N.T., Highlander, S.K. & Schloss, P.D. (2013). Development
of a Dual-Index Sequencing Strategy and Curation Pipeline for Analyzing Amplicon Sequence Data on the MiSeq, 79, 5112–5120.
Koziolek, M., Grimm, M., Becker, D., Iordanov, V., Zou, H., Shimizu, J., ... & Weitschies, W.
(2015). Investigation of pH and temperature profiles in the GI tract of fasted human subjects using the Intellicap® system. Journal of Pharmaceutical Sciences, 104(9), 2855-2863.
Kushkevych, I. V. (2014). Etiological Role of Sulfate-Reducing Bacteria in the Development of
Inflammatory Bowel Diseases and Ulcerative Colitis, 2, 63–73. Leahy, S.C., Higgins, D.G., Fitzgerald, G.F. & Sinderen, D. Van. (2005). Getting better with
bifidobacteria, 1303–1315. Leser, T. D., & Mølbak, L. (2009). Better living through microbial action: the benefits of the
mammalian gastrointestinal microbiota on the host. Environmental Microbiology, 11(9), 2194-2206.
Li, Y., Feng, Y., Zhu, S., Luo, C., Ma, J., & Zhong, F. (2012). The effect of alkalization on the
bioactive and flavor-related components in commercial cocoa powder. Journal of Food Composition and Analysis, 25(1), 17-23.
Li, Y., Zhu, S., Feng, Y., Xu, F., Ma, J., & Zhong, F. (2014). Influence of alkalization treatment
on the color quality and the total phenolic and anthocyanin contents in cocoa powder. Food Science and Biotechnology, 23(1), 59-63.
Lin, C.-S., Chang, C.-J., Lu, C.-C., Martel, J., Ojcius, D.M., Ko, Y.-F., Young, J.D. & Lai, H.-C.
(2014). Impact of the gut microbiota, prebiotics, and probiotics on human health and disease. Biomedical Journal, 37, 259–68.
55
Louis, P., Scott, K.P., Duncan, S.H. & Flint, H.J. (2007). Understanding the effects of diet on bacterial metabolism in the large intestine, 102, 1197–1208.
Lozupone, C., Lladser, M.E., Knights, D., Stombaugh, J. & Knight, R. (2010). UniFrac : an
effective distance metric for microbial community comparison. The ISME Journal, 5, 169–172.
Maekivuokko, H., Kettunen, H., Saarinen, M., Kamiwaki, T., Yokoyama, Y., Stowell, J.,
Rautonen, N. (2007). The effect of cocoa Theobroma cacao and polydextrose on bacterial fermentation in gastrointestinal tract simulations (Japan). Bioscience, Biotechnology, And Biochemistry, 71(8):1834-1843.
Margaret B. Kelly. (2000) "Method For Producing Fat And/Or Solids From Cocoa Beans". 2000:5. Mariat, D., Firmesse, O., Levenez, F., Guimarăes, V. D., Sokol, H., Doré, J., ... & Furet, J. P.
(2009). The Firmicutes/Bacteroidetes ratio of the human microbiota changes with age. BMC Microbiology, 9(1), 123.
Martín, M.Á. & Ramos, S. (2016). Health beneficial effects of cocoa phenolic compounds: a mini-
review. Current Opinion in Food Science. Massot-Cladera, M., Costabile, A., Childs, C. E., Yaqoob, P., Franch, À., Castell, M., & Pérez-
Cano, F. J. (2015). Prebiotic effects of cocoa fiber on rats. Journal of Functional Foods, 19, 341-352.
Matsuki, T., Watanabe, K., Fujimoto, J. & Takada, T. (2004). Use of 16S rRNA Gene-Targeted
Group-Specific Primers for Real-Time PCR Analysis of Predominant Bacteria in Human Feces, 70, 7220–7228.
Maukonen, J. & Saarela, M. (2015). Human gut microbiota: does diet matter? The Proceedings of
the Nutrition Society, 74, 23–36. Miller, K.B., Hurst, W.J., Payne, M.J., Stuart, D.A., Apgar, J., Sweigart, D.S. & Ou, B. (2008).
Impact of alkalization on the antioxidant and flavanol content of commercial cocoa powders. Journal of Agricultural and Food Chemistry, 56, 8527–8533.
Minoche, A.E., Dohm, J.C. & Himmelbauer, H. (2011). Evaluation of genomic high-throughput
sequencing data generated on Illumina HiSeq and Genome Analyzer systems. Mirpuri, J., Raetz, M., Sturge, C.R., Wilhelm, C.L., Benson, A., Savani, R.C., Hooper, L. V,
Yarovinsky, F., Mirpuri, J., Raetz, M., Sturge, C.R., Wilhelm, C.L., Benson, A., Savani, R.C., Hooper, L. V, Yarovinsky, F., Iga, P., Mirpuri, J., Raetz, M., Sturge, C.R., Wilhelm, C.L., Benson, A., Savani, R.C. & Hooper, L. V. (2014). Proteobacteria-specific IgA regulates maturation of the intestinal microbiota Proteobacteria-specific IgA regulates maturation of the intestinal microbiota, 976.
56
Morelli, L. (2008). Postnatal development of intestinal microflora as influenced by infant nutrition. The Journal of Nutrition, 138, 1791S–1795S.
Ondov, B.D., Bergman, N.H. & Phillippy, A.M. (2011). Interactive metagenomic visualization in
Web browser, 385. Opota, O., Ney, B., Zanetti, G., Jaton, K., Greub, G., Prod’hom, G. & 1. (2013). Comamonas
kerstersii bacteremia in a patient with diverticulosis. J. Clin. Microbiol. Palmer, C., Bik, E.M., Digiulio, D.B., Relman, D.A. & Brown, P.O. (2007). Development of the
Human Infant Intestinal Microbiota, 5. Petersen, C., & Round, J. L. (2014). Defining dysbiosis and its influence on host immunity and
disease. Cellular Microbiology, 16(7), 1024-1033. Quail, M.A., Kozarewa, I., Smith, F., Scally, A., Stephens, P.J., Durbin, R., Swerdlow, H. &
Turner, D.J. (2008). A large genome center ’ s improvements to the Illumina sequencing system, 5, 1005–1011.
Rajilić-Stojanović, M., Smidt, H. & Vos, W.M. De. (2007). Diversity of the human gastrointestinal
tract microbiota revisited. Environmental Microbiology, 9, 2125–2136. Ramachandran V. and Baojun X. (2015) Antidiabetic properties of dietary flavonoids: a cellular
mechanism review. Nutrition & Metabolism [serial online]. December 23, 2015;12:1-20 20p. Available from: CINAHL Complete, Ipswich, MA. Accessed April 7, 2016.
Reid, G. (1999). The scientific basis for probiotic strains ofLactobacillus. Applied and
environmental microbiology, 65(9), 3763-3766. Sanz, Y., Rastmanesh, R., & Agostonic, C. (2013). Understanding the role of gut microbes and
probiotics in obesity: How far are we? Pharmacological Research, 69(1), 144–155. Sarris, A. (2003). Medium-term prospects for agricultural commodities: projections to the year
2010. Organization, 99. Sato, T., Matsumoto, K., Okumura, T., Yokoi, W., Naito, E. & Yoshida, Y. (2008). Isolation of
lactate-utilizing butyrate-producing bacteria from human feces and in vivo administration of Anaerostipes caccae strain L2 and galacto-oligosaccharides in a rat model, 66, 528–536.
Saunders, D. R., & Sillery, J. K. (1988). Absorption of triglyceride by human small intestine: dose-
response relationships. The American journal of clinical nutrition, 48(4), 988-991. Schrezenmeir J & de Vrese M. (2001). Probiotics, prebiotics, and synbiotics--approaching a
definition. Am J Clin Nutr 73, 361S-364S.

57
Schwiertz, A., Taras, D., Schäfer, K., Beijer, S., Bos, N.A., Donus, C. & Hardt, P.D. (2009). Microbiota and SCFA in Lean and Overweight Healthy Subjects. Obesity, 18, 190–195.
Sharma G. 2003. Digital color imaging handbook. Boca Raton: CRC Press 32p. Stanton, C., Gardiner, G., Meehan, H., Collins, K., Fitzgerald, G., Lynch, P.B. & Ross, R.P.
(2001). Market potential for probiotics 1 – 4, 73, 476–483. The Intercontinental Exchange (ICE) Futures U.S. (2007). Cocoa, 1–6. Tlaskalová-Hogenová, H., Štěpánková, R., Hudcovic, T., Tučková, L., Cukrowska, B., Lodinová-
Žádnıková, R., ... & Funda, D. P. (2004). Commensal bacteria (normal microflora), mucosal immunity and chronic inflammatory and autoimmune diseases. Immunology letters, 93(2), 97-108.
Topping DL & Clifton PM. (2001). Short-Chain Fatty Acids and Human Colonic Function: Roles
of Resistant Starch and Nonstarch Polysaccharides. Physiological Rew 81, 1031-1064. Tremaroli, V., and Backhed F. (2012). “Functional interactions between the gut microbiota and
host metabolism”. J. Biochemistry, Microbiology and Immunology 4:11. Turnbaugh, P.J., Ley, R.E., Mahowald, M.A., Magrini, V., Mardis, E.R. & Gordon, J.I. (2006).
An obesity-associated gut microbiome with increased capacity for energy harvest, 444, 1027–1032.
Urokawa, K.K., Toh, T.I., Uwahara, T.K., Shima, K.O., Oh, H.T., Oyoda, A.T., Ori, H.M., Gura,
Y.O., Hrlich, D.S.E., Toh, K.I., Akagi, T.T. & Akaki, Y.S. (2007). Comparative Metagenomics Revealed Commonly Enriched Gene Sets in Human Gut Microbiomes, 169–181.
US. Department of Agriculture (USDA). (2001). Database for the Proanthocyanidin content of
selected foods; http://www.nal.usda.cov/fnic/foodcomp. Valeur, J. & Berstad, A. (2010). Colonic fermentation : a neglected topic in human physiology
education, 4046. Wang, X. & Gibson, G.R. (1993). Effects of the in vitro fermentation of oligofructose and inulin
by bacteria growing in the human large intestine, 373–380. Wang JF, Zhu YH, Li DF, Wang Z & Jensen BB. (2004). In vitro fermentation of various fiber
and starch sources by pig fecal inocula. J Anim Sci 82, 2615-2622. Watson, R., Preedy, V., Zibadi, S. (2013). Chocolate in Health and Nutrition. Springer New York
Heidelberg.

58
Weng, L., Rubin, E.M. & Bristow, J. (2006). Application of sequence-based methods in human microbial ecology, 316–322.
Wiele, T. Van De, Backer, F. De, Neyrinck, A.M., Possemiers, S., Cani, P.D., Larondelle, Y. &
Delzenne, N.M. (2011). Prebiotic Effects of Wheat Arabinoxylan Related to the Increase in Bifidobacteria, Roseburia, and Bacteroides / Prevotella in Diet-Induced Obese Mice, 6.
Wollgast, J. & Anklam, E. (2000). Review on polyphenols in Theobroma cacao: Changes in
composition during the manufacture of chocolate and methodology for identification and quantification. Food Research International, 33, 423–447.
Woolnough, J.W., Monro, J.A., Brennan, C.S. & Bird, A.R. (2008). Simulating human
carbohydrate digestion in vitro: A review of methods and the need for standardization. International Journal of Food Science and Technology, 43, 2245–2256.
World Cocoa Foundation. (2012). Cocoa Market Update. Www.Worldcocoa.Org, 1–7. Xu, J., Bjursell, M.K., Himrod, J., Deng, S., Carmichael, L.K., Chiang, H.C., Hooper, L. V &
Gordon, J.I. (2017). American Association for the Advancement of Science, 299, 2074–2076. Zhu, Q.Y., Holt, R.R., Lazarus, S.A., Ensunsa, J.L., Hammerstone, J.F., Schmitz, H.H. & Keen,
C.L. (2002). Stability of the flavan-3-ols epicatechin and catechin and related dimeric procyanidins derived from cocoa. Journal of Agricultural and Food Chemistry, 50, 1700–1705.
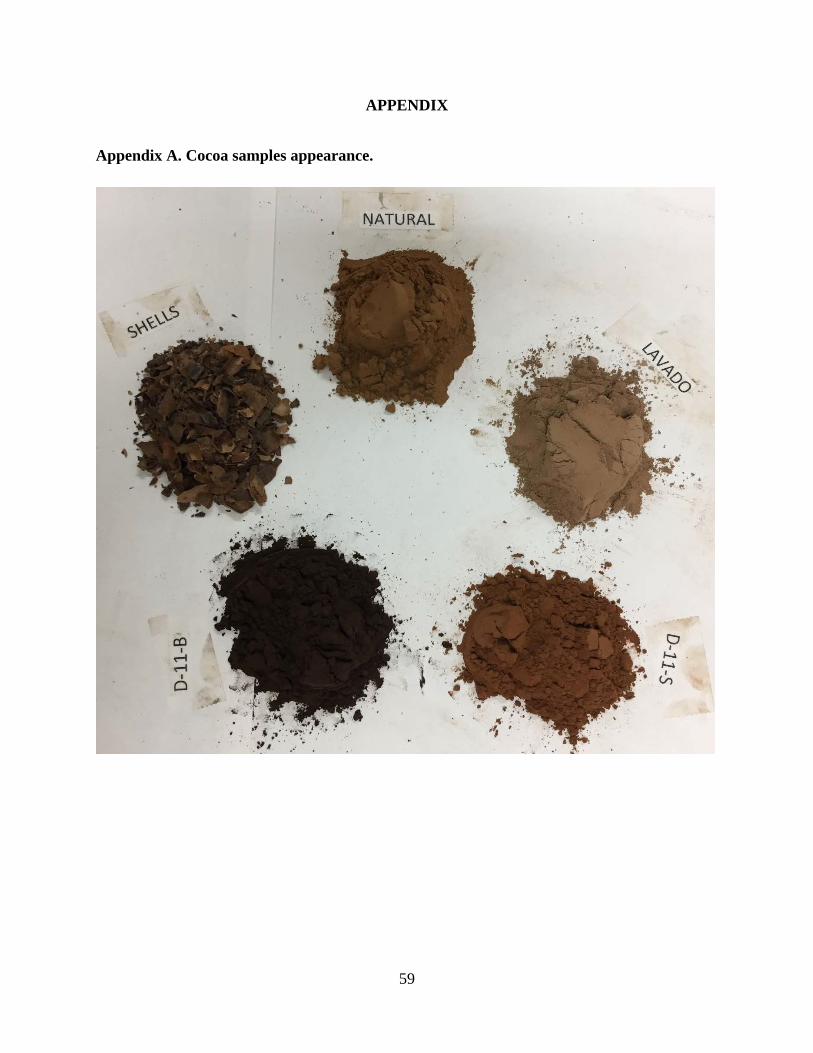
59
APPENDIX
Appendix A. Cocoa samples appearance.

60
Appendix B. The pH change of cocoa samples when fermented in an in-vitro digestive model system.
6.5
6.7
6.9
7.1
7.3
7.5
7.7
7.9
8.1
0 6 12 18 24
pH
Hours
Control
D-11-B
D-11-S
NaturalcocoaLavado
Shell
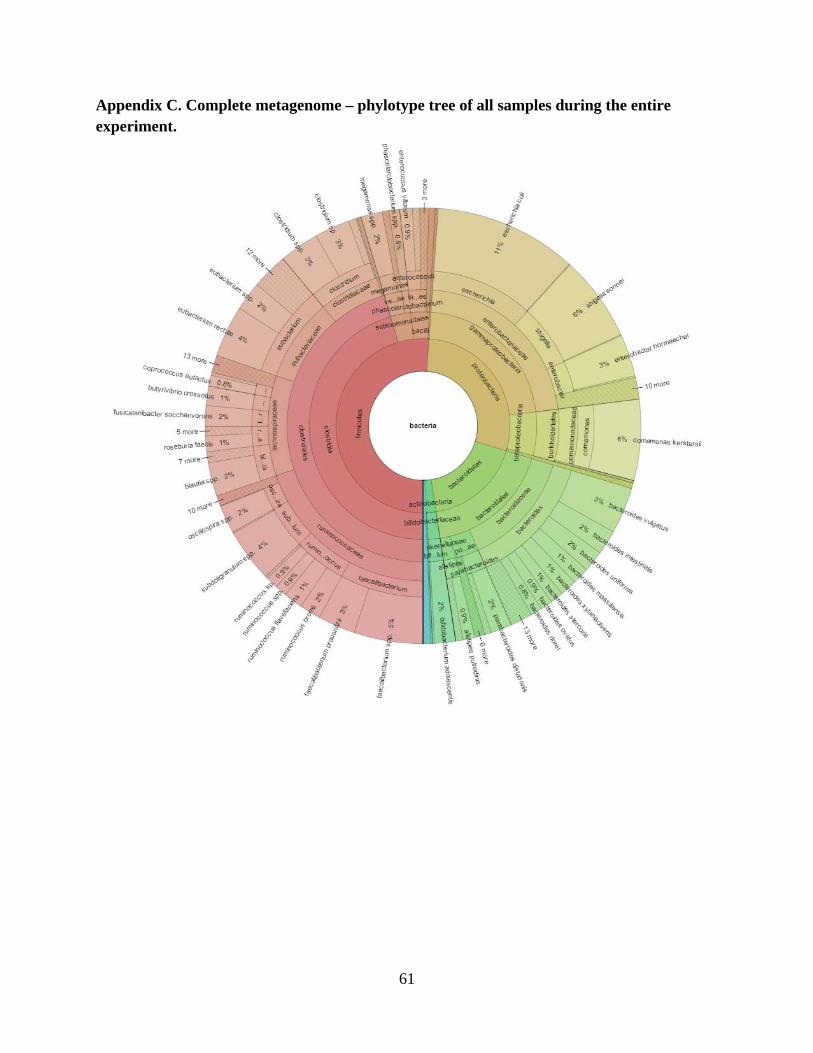
61
Appendix C. Complete metagenome – phylotype tree of all samples during the entire experiment.
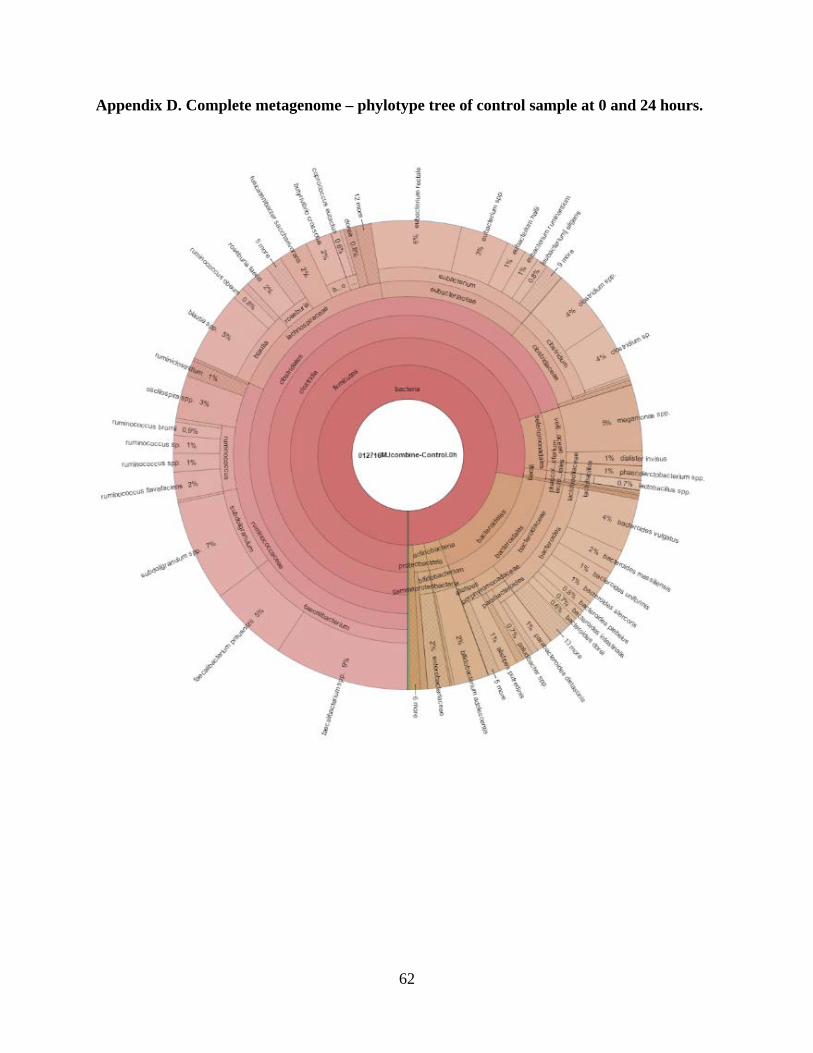
62
Appendix D. Complete metagenome – phylotype tree of control sample at 0 and 24 hours.

63

64
Appendix E. Complete metagenome – phylotype tree of D-11-B sample at 0 and 24 hours.
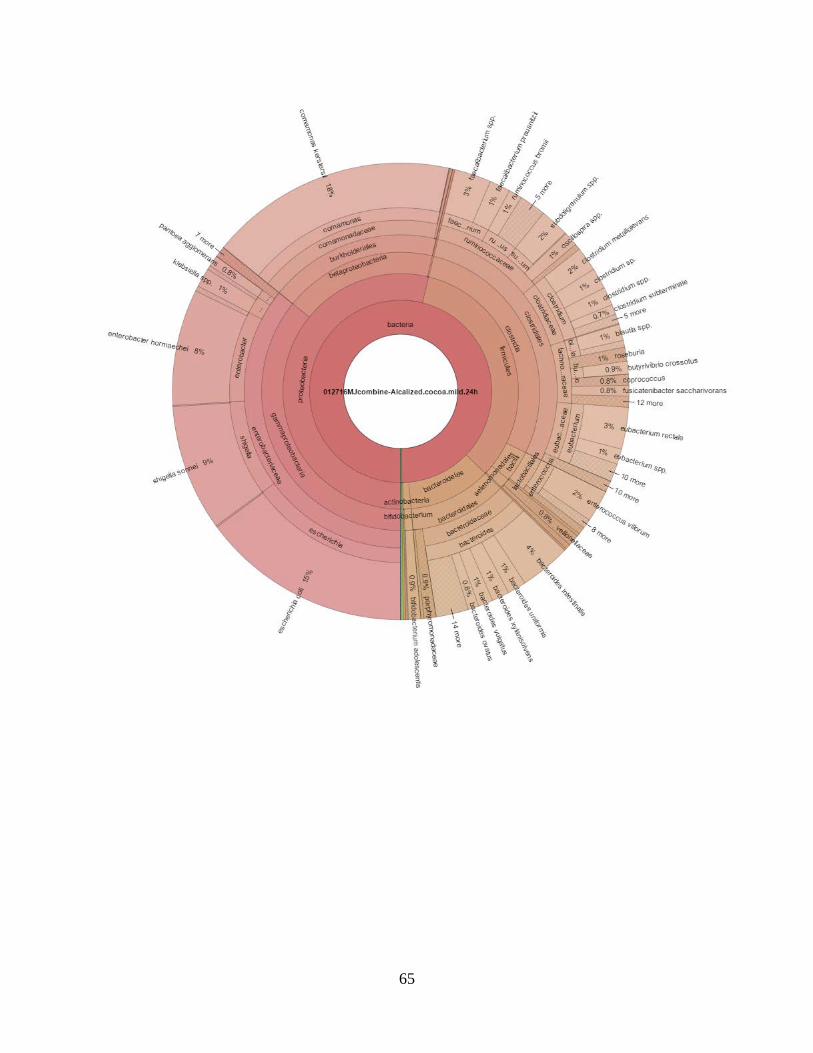
65
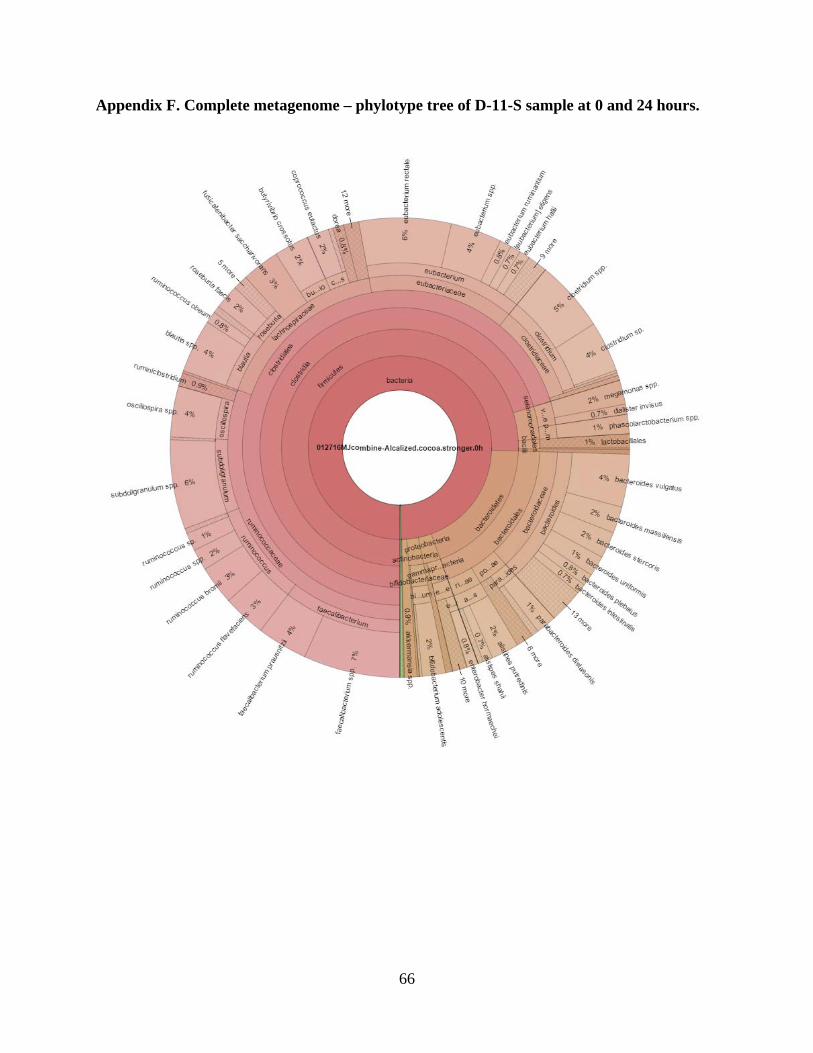
66
Appendix F. Complete metagenome – phylotype tree of D-11-S sample at 0 and 24 hours.
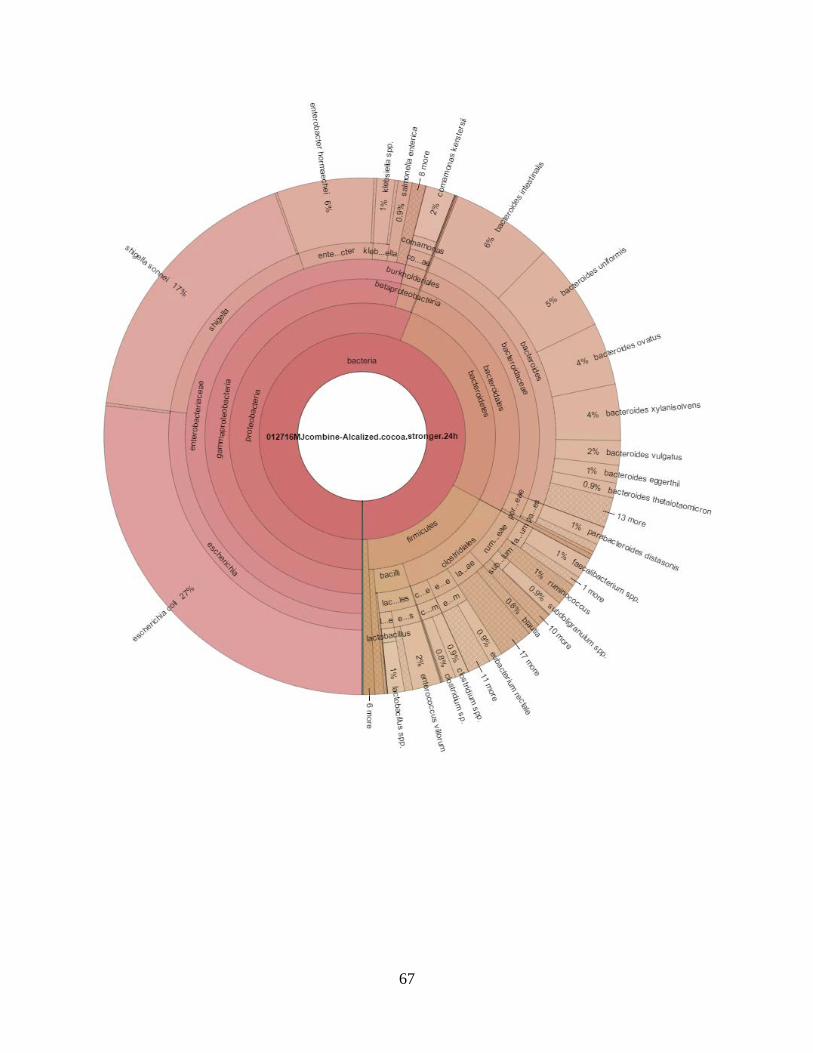
67

68
Appendix G. Complete metagenome – phylotype tree of the natural sample at 0 and 24 hours.

69
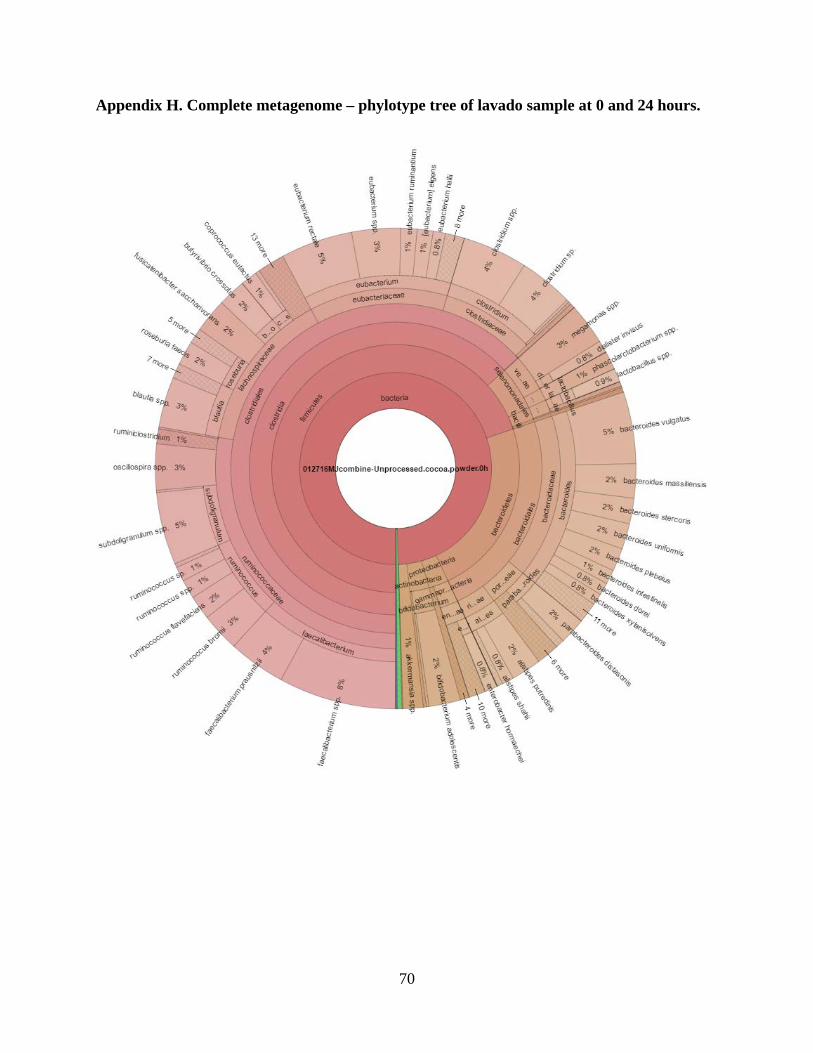
70
Appendix H. Complete metagenome – phylotype tree of lavado sample at 0 and 24 hours.
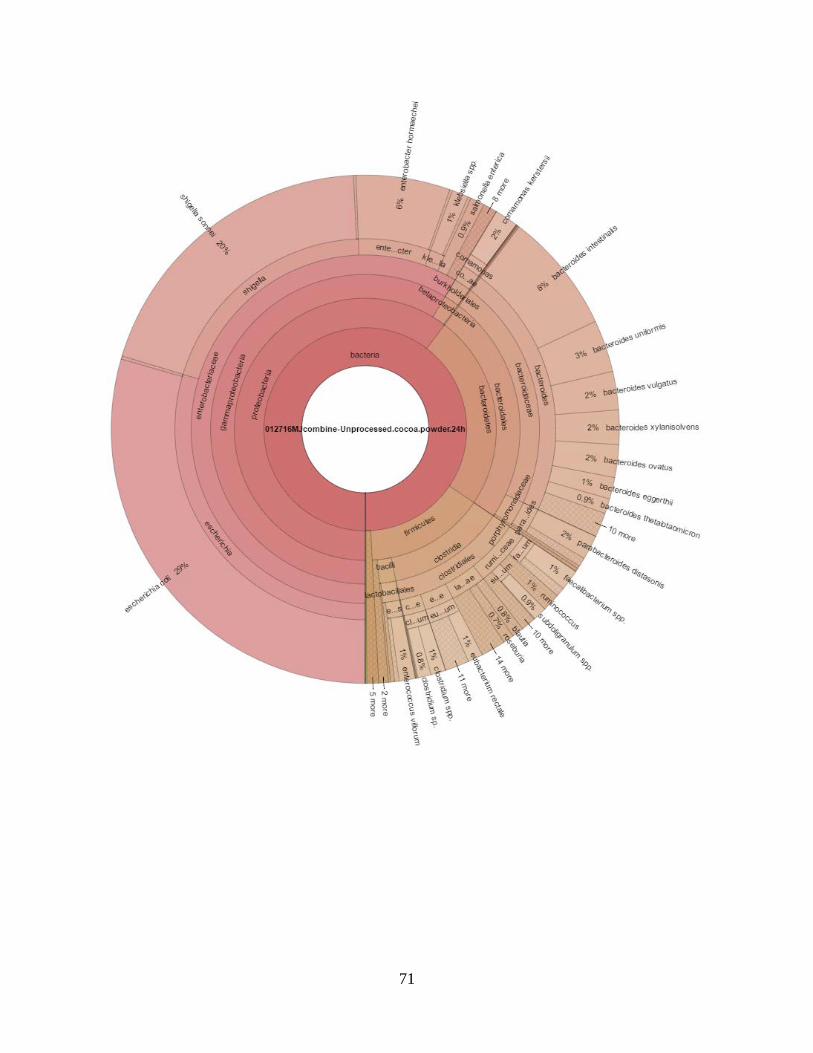
71
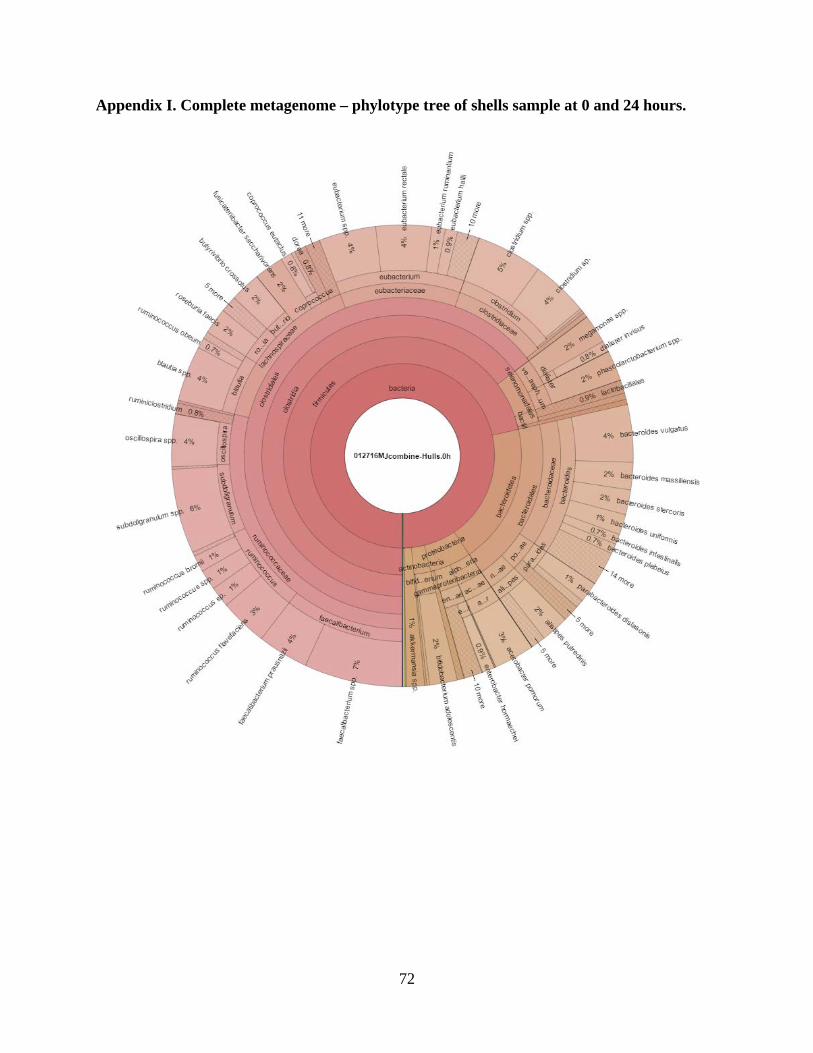
72
Appendix I. Complete metagenome – phylotype tree of shells sample at 0 and 24 hours.
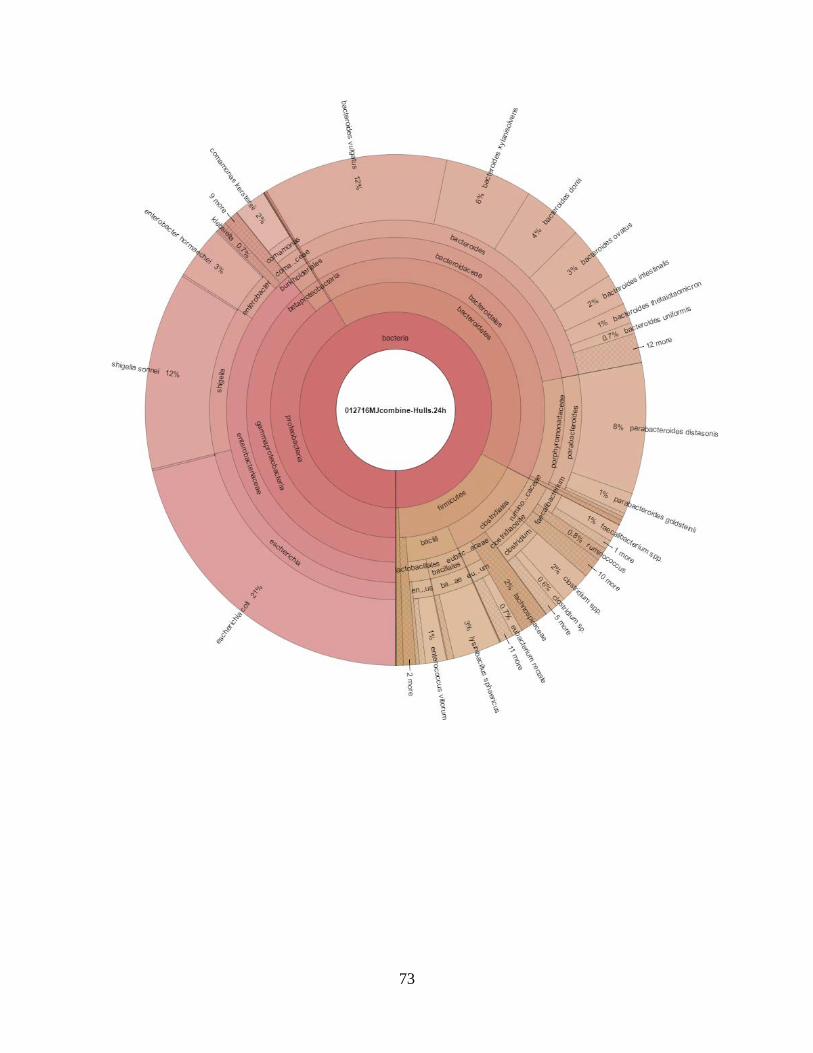
73

74
VITA
Martha Marina Escoto Sabillón was born and raised in Tegucigalpa, Honduras. She attended her
elementary and high school in the present city. In 2010, she enrolled as an undergraduate student
at Zamorano Pan-American Agricultural School and she later performed a senior internship at
Louisiana State University in Louisiana, USA. She obtained her Bachelor of Sciences in Food
Science and Technology in December 2014. After completion, she became a graduate student in
the School of Nutrition and Food Sciences in January 2015 at Louisiana State University and
expects to graduate in December 2017.