interaction of formal and informal financial markets in ...formal and semi-formal –nancial sector...
TRANSCRIPT

Interaction of Formal and Informal Financial Marketsin Quasi-Emerging Market Economies�
Harold P.E. Ngalaway
University of Cape Town
September 15, 2009
Abstract
The primary objective of this paper is to investigate the interaction of formal andinformal �nancial markets and their impact on economic activity in quasi-emergingmarket economies (QEMEs). Using a four-sector dynamic stochastic general equilib-rium (DSGE) model, we demonstrate that formal and informal �nancial sector loansare complementary in the aggregate, suggesting that an increase in the use of formal�nancial sector (FFS) credit creates additional productive capacity that requires moreinformal �nancial sector (IFS) credit to maintain equilibrium. Our model also demon-strates that the response of FFS loans to a positive production technology shock issensitive to the rate of success for high risk borrowers while the response of IFS loansis not. We further show that interest rates in the IFS may not necessarily be drivenby FFS interest rates, with the implication that the impact of monetary policy oneconomic activity may partly be o¤set by IFS interest rates.
1 Introduction
One of the fundamental distinguishing features of quasi-emerging market economies (QEMEs)
is the co-existence of formal and informal �nancial sectors. Within the two broad market
segments, there are several di¤erent types of operators that usually have very little contact
with one another and whose clients often do not overlap; and even when they overlap, they
are able to sort out clearly which aspects of their �nancial business will be handled by which
�nancial arrangement (Aryeetey, 2008). Unfortunately, nearly all QEMEs leave out informal
�This paper is part of a PhD Thesis in progress. I thank Professor Nicola Viegi, my supervisor, for hisuseful comments. Any errors are my responsibility, though.
[email protected]/ [email protected]
1
�nancial transactions in o¢ cial monetary data, e¤ectively underestimating the volume of
�nancial transactions and bringing into question the timing and e¤ect of monetary policy.
A number of studies have shown that the informal �nancial sector (IFS) is large (see for
example African Development Bank, 1994; Chipeta and Mkandawire, 1991) and growing
(see for example Chipeta, 1998; Soyibo, 1997; Bagachwa, 1995; Aryeetey, 1994; Chipeta
and Mkandawire, 1991) in most QEMEs. Given its sheer size, the response of the IFS
to policy is clearly non-trivial, and may vary depending on whether the informal markets
are autonomous or reactive to formal �nancial markets (See Rahman, 1992; Acharya and
Madhura, 1983; Sundaram and Pandit, 1984); whether the two markets are competitive
or complementary; and whether the nature of their interaction frustrates or strengthens
monetary policy. This paper sets out to investigate these and other issues.
For many years, informal �nancial markets have been perceived as an economic ill that has
only succeeded in exploiting impoverished peasants in QEMEs (Bolnick, 1992). The policy
prescription, as expected, has been to integrate the IFS in the formal �nancial sector (FFS)
(see Aryeetey, 2008; Bolnick, 1992; Bell, 1990). Recent research, however, has shown an
emerging change in opinion with the sector now being positively regarded as an integral
component of the whole �nancial sector. Chipeta and Mkandawire (1991), for instance, re-
port that the IFS in Malawi is playing an important role in alleviating economic hardships
among low-income groups by enabling these groups mobilise resources (savings e¤ect), use
the resources to earn income (investment e¤ect) and obtain loans (credit e¤ect). An account
of similar �ndings is presented by Steel, Aryeetey, Hettige and Nissanke (1997) in a study
of Ghana, Malawi, Nigeria and Tanzania. Steel et al. (1997) stress that informal �nancial
institutions (IFIs) in the three countries are an important vehicle for mobilising household
savings and �nancing small businesses, a function that is carried out using specialized tech-
niques that address the problems of information, transaction costs and risks, which prevent
banks from serving these market segments. In Kenya, Atieno (2001) observes that unlike
commercial banks, informal credit sources provide easier access to credit facilities for small
and micro-enterprises.
The importance of the IFS in QEMEs is also underlined by its size. According to the
African Development Bank (1994), 70 percent of the total population in Cameroon and 80
percent in Zambia take part in informal �nancial activities; 85 percent of rural households
in Niger and over 80 percent of smallholder farmers in Zimbabwe have access to informal
credit; and, 60 percent of the population in Ethiopia and 52 percent in Senegal participate
in rotating savings and credit associations (ROSCAs). In Malawi, Chipeta and Mkandawire
(1991) observed that in 1989, the IFS was larger than the FFS when measured in terms
of the ratio of credit extended by the IFS to the private sector to credit extended by the
2
formal and semi-formal �nancial sector to the same sector. They arrived at the same result
by comparing savings mobilised by the formal and informal �nancial sectors. A number of
studies also suggest that the IFS may not only be large, but growing as well. Field surveys
carried out in Nigeria by Soyibo (1997), in Ghana by Aryeetey (1994), in Malawi by Chipeta
and Mkandawire (1991) and in Tanzania by Bagachwa (1995) established that the IFS grew
faster than the FFS in the reform years 1990-1992 (Chipeta, 1998).
Against this background, it is clear that o¢ cial monetary data grossly underestimates the
volume of �nancial transactions in QEMEs; and that operating tools of monetary policy are
targeted at only a portion of the �nancial sector though their impact may spread to the
whole sector. To this point, important questions with profound policy implications ought to
be asked. How do formal and informal �nancial markets interact? How does this interaction
a¤ect economic activity? How do informal �nancial markets respond to monetary policy
and what is the impact on economic activity? This study contributes to the literature by
providing answers to these and related questions using a four-sector dynamic stochastic
general equilibrium (DSGE) model incorporating asymmetric information in the FFS.
The choice of a DSGE framework for analysis has been motivated by a number of factors.
First, DSGE models are derived from microeconomic principles of constrained decision-
making. That is, they describe the general equilibrium allocations and prices of the economy
in which all agents dynamically maximise their objectives subject to budget or resource
constraints (Tovar, 2008). Following the estimation of deep parameters, it is possible to
avoid the Lucas Critique, where only models in which the parameters that do not vary
with policy interventions are suited to evaluate the impact of policy change (Ibid, 2008).
Indeed, according to Woodford (2003), DSGE models should not, at least in principle, be
vulnerable to the Lucas Critique, unlike the more traditional macroeconomic forecasting
models. Second, DSGE models are structural, implying that each equation has an economic
interpretation which allows clear identi�cation of policy interventions and their transmission
mechanisms (Peiris and Saxegaard, 2007). Third, DSGE models are forward looking in
the sense that agents optimise model-consistent forecasts about the future evolution of the
economy (Ibid, 2007). And fourth, DSGE models allow for a precise and an unambiguous
examination of random disturbances. This is facilitated by the stochastic design of the
models. To the best of our knowledge, there is no study that has examined the interaction of
formal and informal �nancial sectors and their impact on economic activity in QEMEs using a
macromonetary model developed within the context of a microfounded DSGE representation.
Following this introduction, the rest of the paper is structured as follows. A DSGE model for
QEMEs is developed in Section 2. The model aims at building a quantitative macroeconomic
representation from explicit optimising behaviour while allowing for a minimum amount pos-
3
sible of imperfections. Thus, the model is similar in many aspects to the Real Business Cycle
(RBC) approach except on the monetary side (see Tovar, 2008; Mankiw, 2006). Section 3
presents calibrations of parameter and steady state values; outlines and interprets simulation
results of the baseline model in the event that a positive shock in production technology and
a monetary policy shock within the context of a forward-looking monetary policy rule; and
carries out a comparative analysis of sample moments from the simulations model and those
obtained from actual data of selected QEMEs and industrial economies. A summary and
conclusion follow in Section 4.
2 A DSGE Model for QEMEs
2.1 Basic Design
There are four sectors in the economy: households, �rms, �nancial intermediaries and mon-
etary authorities. The household maximises an intertemporal utility function separable in
consumption, leisure,and real cash balances; and its �nancial resources are used for consump-
tion or held as cash balances with the excess deposited in commercial banks or lent out to
�rms in the informal credit market. We describe the household�s credit function as �money-
lending�and we reserve the term �moneylenders� for credit institutions in the IFS. Thus,
we assume that the behaviour of moneylenders is described within the household�s utility
maximisation problem. The �rm produces its own capital by converting loans obtained from
the formal or informal �nancial sectors, which are assumed to be perfect substitutes (see
Dasgupta, 2004). Using capital and labour as the only factors of production, the �rm pro-
duces �nal output using technology described by a Cobb Douglas production function. In
the �nancial market, �rms self-selectively seek loans either in the formal or informal credit
markets.
While lenders in the IFS deal with local communities for which they are able to identify risk
levels of individual potential borrowers, the same does not apply to commercial banks in
the FFS. Commercial banks are unable to distinguish between high and low risk borrowers
ex-ante because high risk borrowers disguise themselves as low risk borrowers in order to
enhance their chances of obtaining credit. We assume banks have a preference for low risk
borrowers because they are associated with relatively higher expected pro�ts while high risk
borrowers tend to lower expected pro�ts. At this point, we invoke the Stiglitz and Weiss
(1981) hypothesis that banks may ration credit in equilibrium. The residual demand that is
rationed out of the formal loan market spills over to the informal credit market. Accordingly,
the IFS provides credit to this demand as well as the component of total credit demand which
4

self selectively seeks loans in the IFS only. Finally, we assume that the population is constant
so there is no aggregation bias with treating average quantities as aggregate quantities (see
Dasgupta, 2004).
2.2 Household Sector
There is a continuum of identical households (with identical endowments and preferences).
We ignore population growth and consider a representative household of constant size with
a constant amount of time per period and an in�nite planning horizon. The objective of the
household is to maximise the expected sum of a discounted stream of instantaneous utilities
Ut given by1:
maxE0
1Xt=0
�tUt (1)
where �� (0; 1) is the consumer subjective intertemporal discount factor. The utility function
is assumed to be separable in consumption (Ct), leisure (1�Nt) and real cash balances�Mt
Pt
�:
Ut = lnCt + � ln (1�Nt) + � ln�Mt
Pt
�(2)
whereNt is time t labour (the amount of time worked) and �;� > 0 represent the importance
of leisure and real cash balances, respectively, in utility. The utility function Ut(:; :; :) satis�es
Ut;Ct > 0; Ut;(1�Nt) > 0; Ut;�MtPt
� > 0; Ut;Ct;Ct < 0; Ut;(1�Nt);(1�Nt) < 0 and Ut;�MtPt
�;�MtPt
� < 0.
The household�s �nancial resources are used for consumption, deposited in commercial banks,
held in cash or lent out to �rms. We assume the household lends money to �rms or deposits
funds in commercial banks from its own earnings. Maximisation of the household�s objective
function, therefore, is subject to the following intertemporal budget constraint:
Ct + Lit +Dt +
Mt
Pt=�1 +Rlit�1
�qLit�1 + (1 +R
dft�1)Dt�1 +
Mt�1
Pt�1+WtNt (3)
where Lit are loans to �rms given by households (informal �nance), which we generalise as
moneylending, Dt are the household�s deposits in commercial banks, Rlit are interest rates
on credit given by the households, qt is the probability of repayment on loans given by the
moneylenders, Rdft are interest rates on deposits in commercial banks andWt is the wage rate.
Maximising the objective function given in equation (1) subject to the budget constraint in
equation (3) with respect to consumption, labour, cash balances, and the household�s loans
1A summary of parameters and variable de�nitions is presented in Appendix 1, Table 1.
5
to �rms and deposits in commercial banks, yields the following �rst order conditions:
1
Ct= �
�1 +Rdft
�Et
�1
Ct+1
�(4)
Nt = 1� �CtWt
(5)
Mt
Pt= ��Et
�Ct+1
Rdft
�(6)
1 +Rdft =�1 +Rlit
�q (7)
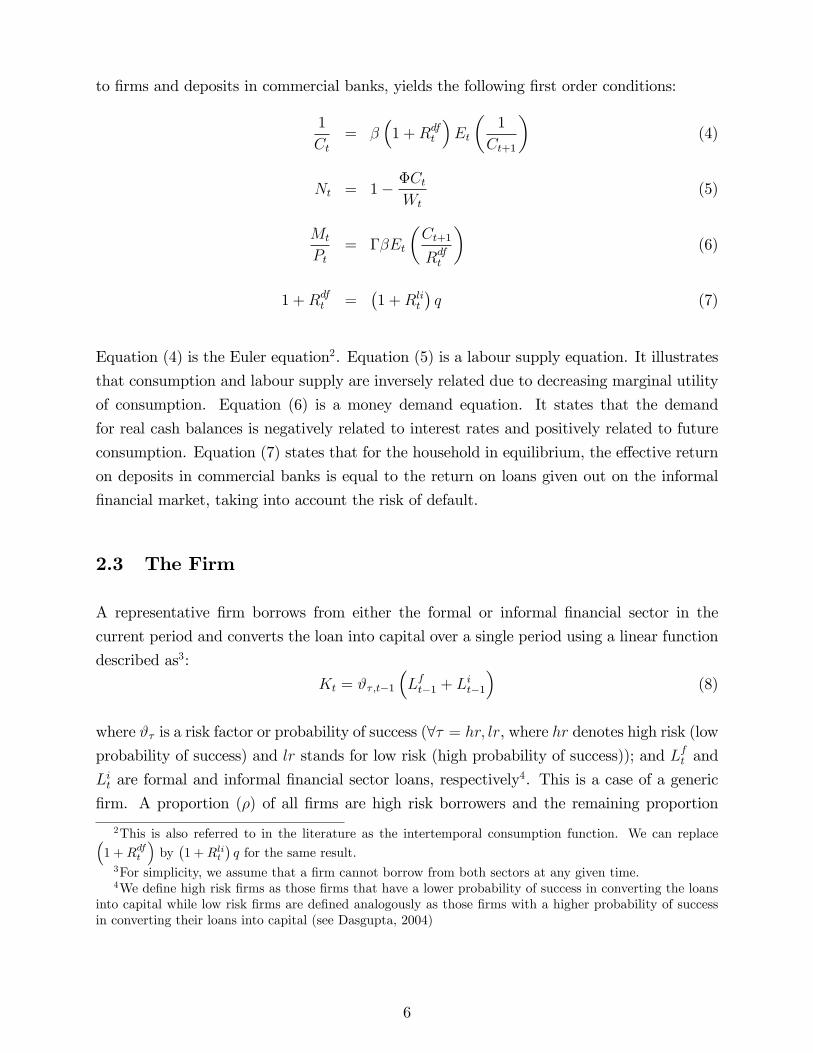
Equation (4) is the Euler equation2. Equation (5) is a labour supply equation. It illustrates
that consumption and labour supply are inversely related due to decreasing marginal utility
of consumption. Equation (6) is a money demand equation. It states that the demand
for real cash balances is negatively related to interest rates and positively related to future
consumption. Equation (7) states that for the household in equilibrium, the e¤ective return
on deposits in commercial banks is equal to the return on loans given out on the informal
�nancial market, taking into account the risk of default.
2.3 The Firm
A representative �rm borrows from either the formal or informal �nancial sector in the
current period and converts the loan into capital over a single period using a linear function
described as3:
Kt = #�;t�1
�Lft�1 + L
it�1
�(8)
where #� is a risk factor or probability of success (8� = hr; lr, where hr denotes high risk (lowprobability of success) and lr stands for low risk (high probability of success)); and Lft and
Lit are formal and informal �nancial sector loans, respectively4. This is a case of a generic
�rm. A proportion (�) of all �rms are high risk borrowers and the remaining proportion
2This is also referred to in the literature as the intertemporal consumption function. We can replace�1 +Rdft
�by�1 +Rlit
�q for the same result.
3For simplicity, we assume that a �rm cannot borrow from both sectors at any given time.4We de�ne high risk �rms as those �rms that have a lower probability of success in converting the loans
into capital while low risk �rms are de�ned analogously as those �rms with a higher probability of successin converting their loans into capital (see Dasgupta, 2004)
6

(1� �) are low risk. Aggregate capital stock, therefore, is described as:
Kt = �#hr;t�1
�Lft�1 + L
it�1
�+ (1� �)#lr;t�1
�Lft�1 + L
it�1
�Kt = [�#hr;t�1 + (1� �)#lr;t�1]
�Lft�1 + L
it�1
�(9)
The �rm�s production technology is assumed to be given by a Cobb-Douglas formulation of
the following form:
Yt = eAtK�
t N1��t (10)
where Yt is output; and At > 0 captures technology, which is assumed to evolve according
to a �rst order autoregressive process given by:
At = �At�1 + "At (11)
where "At is independently and identically distributed (iid) with a standard deviation of �"A.
We assume the installation of capital takes one period and there are no adjustment costs,
suggesting that capital stock is predetermined at time t (Ambler and Paquet, 1994). The
equation of motion for the capital stock is given by:
Kt+1 = (1� �)Kt + It (12)
The �rm�s cost minimisation problem subject to satisfying market demand, therefore, is
given by:
minKt, Nt
WtNt +�1 +Rlft
�Lft +
�1 +Rlit
�qLit + �t
�Yt � eAtK�
t N1��t
�(13)
where �t is a Lagrangian multiplier. First order conditions with respect to labour, FFS loans
and IFS loans yield demand functions for labour and formal and informal �nancial sector
loans, in that order, given by:
7

Wt = �t (1� �)YtNt
(14)
Ldft =1
#�tEt
24(1� �)�1 +Rlft
�K�t+1
�#�tWt+1Nt+1
351
��1
(15)
Ldit =1
#�tEt
"(1� �)
�1 +Rlit
�qK�
t+1
�#�tWt+1Nt+1
# 1��1
(16)
Equation (14) shows that wages increase with output but are inversely related to labour
supply. Equations (15) and (16) show the self-selection of �rms in seeking loans. While
some �rms approach the FFS �rst, others self-selectively approach the IFS for credit. Both
demand functions show that the demand for loans increases with higher expected wages and
employment.
2.4 Financial Intermediaries
An important distinguishing feature of low income economies is the segmentation of the
�nancial system into formal and informal �nancial sectors. Within the two broad segments,
there are several di¤erent types of operators that usually have very little contact with one
another and whose clients often do not overlap; and even when they overlap, they are able to
sort out clearly which aspects of their �nancial business will be handled by which �nancial
arrangement (Aryeetey, 2008). Our model of the �nancial sector is drawn in the spirit of
Dasgupta (2004).
2.4.1 Formal Financial Sector
Base lending rates are set as a mark-up (�) over the bank rate i.e. Rlft = Rnrt + �, where
Rnrt is the bank rate. The size of the mark-up depends on the commercial bank�s market
power, re�ecting its estimate of the interest elasticity of the demand for credit (King, 2003).
For simplicity, we assume the mark-up is �xed. Aggregate self-selection demand for loans in
8
the FFS is given by:
Ladft =�
#hr;tEt
24(1� �)�1 +Rlft
�K�t+1
�#hr;tWt+1Nt+1
351
��1
+
(1� �)#lr;t
Et
24(1� �)�1 +Rlft
�K�t+1
�#lr;tWt+1Nt+1
351
��1
(17)
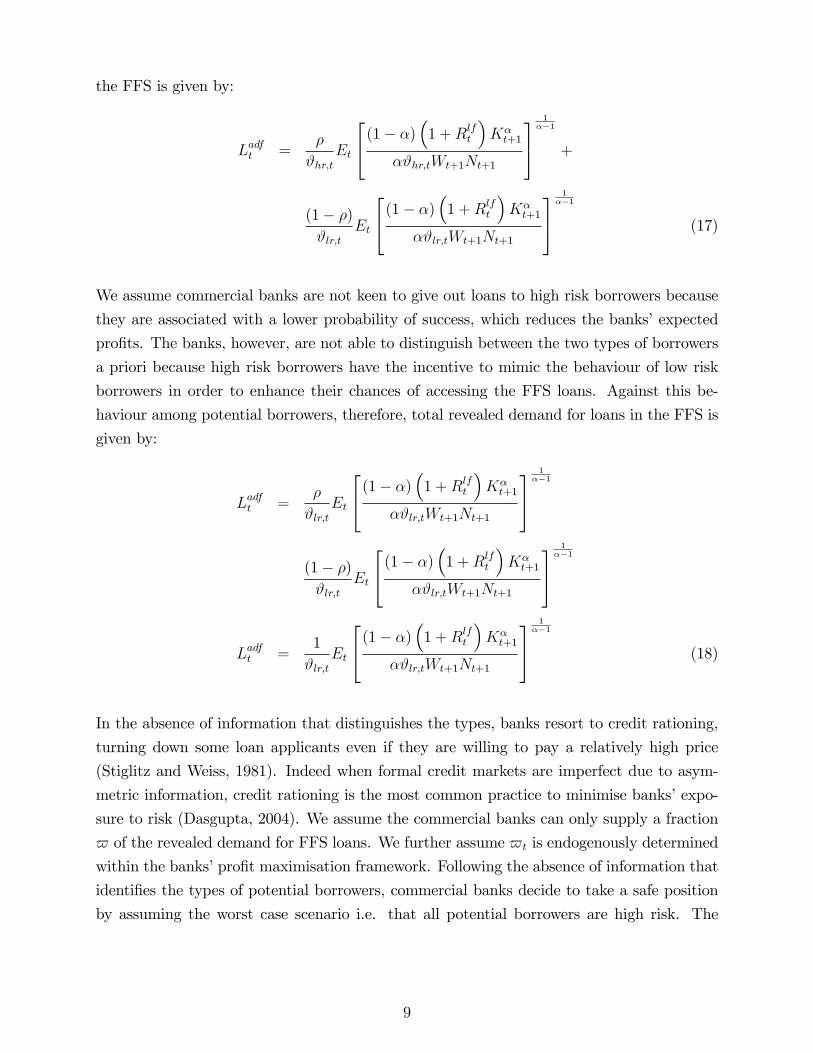
We assume commercial banks are not keen to give out loans to high risk borrowers because
they are associated with a lower probability of success, which reduces the banks�expected
pro�ts. The banks, however, are not able to distinguish between the two types of borrowers
a priori because high risk borrowers have the incentive to mimic the behaviour of low risk
borrowers in order to enhance their chances of accessing the FFS loans. Against this be-
haviour among potential borrowers, therefore, total revealed demand for loans in the FFS is
given by:
Ladft =�
#lr;tEt
24(1� �)�1 +Rlft
�K�t+1
�#lr;tWt+1Nt+1
351
��1
(1� �)#lr;t
Et
24(1� �)�1 +Rlft
�K�t+1
�#lr;tWt+1Nt+1
351
��1
Ladft =1
#lr;tEt
24(1� �)�1 +Rlft
�K�t+1
�#lr;tWt+1Nt+1
351
��1
(18)
In the absence of information that distinguishes the types, banks resort to credit rationing,
turning down some loan applicants even if they are willing to pay a relatively high price
(Stiglitz and Weiss, 1981). Indeed when formal credit markets are imperfect due to asym-
metric information, credit rationing is the most common practice to minimise banks�expo-
sure to risk (Dasgupta, 2004). We assume the commercial banks can only supply a fraction
$ of the revealed demand for FFS loans. We further assume $t is endogenously determined
within the banks�pro�t maximisation framework. Following the absence of information that
identi�es the types of potential borrowers, commercial banks decide to take a safe position
by assuming the worst case scenario i.e. that all potential borrowers are high risk. The
9

supply function for FFS loans, therefore, is given by:
Lsft =$t
#hr;tEt
24(1� �)�1 +Rlft
�K�t+1
�#hr;tWt+1Nt+1
351
��1
(19)
The loans given out by commercial banks to �rms in the formal credit market�Lft
�are
converted from household deposits (Dt) and borrowing from the central bank�Lcbt�. For
simplicity, we assume there is no liquidity reserve requirement (LRR) i.e. all the deposits
can be converted into loans. The intermediation technology is assumed to be given by5:
Lsft = Dt + Lcbt (20)
The commercial banks�pro�t maximisation problem is described as:
maxLadft , $t
$t
�1 +Rlft
�Ladft +Dt + L
cbt �$tL
adft �
�1 +Rdft
�Dt � (1 +Rnrt )Lcbt
subject to Ladft � Dt + Lcbt , which reduces to:
maxLadft , $t
$tRlft L
adft �Rdft Dt �Rnrt Lcbt subject to L
adft � Dt + L
cbt (21)
Taking FOCs with respect to Ladft , Dt and Lcbt and solving for $t, we obtain:
`t = $tRlft = R
nrt = Rdft (22)
$t =Rdft
Rlft=Rnrt
Rlft(23)
where `t is a Lagrangian multiplier. Equation (22) states that in equilibrium, the cost of
funds from the di¤erent sources (household deposits and borrowing from the central bank)
will be equal�i.e. Rnrt = Rdft
�and they will be proportional to the return on loans
�$Rlft
�.
Alternatively, equation (23) can be interpreted as stating that the proportion of total demand
for FFS loans that is satis�ed by the commercial banks is equal to the ratio of the cost of
funds from the two identi�ed sources.5This can also be seen as a simpli�ed representation the banks�balance sheets with assets on the left
hand side and liabilities on the right.
10

2.4.2 Informal Financial Sector
Loans in the IFS are provided by moneylenders6. The self selection demand for IFS credit
is given by:
Ladit =�
#hr;tEt
"(1� �)
�1 +Rlit
�qK�
t+1
�#hr;tWt+1Nt+1
# 1��1
+(1� �)#lr;t
Et
"(1� �)
�1 +Rlit
�qK�
t+1
�#lr;tWt+1Nt+1
# 1��1
(24)
Like commercial banks, moneylenders also face a pool of high and low risk borrowers. How-
ever, unlike the banks, the moneylenders are able to identify the risk levels of speci�c borrow-
ers. Achievement of this feat owes to the localisation of moneylending to communities within
the neighbourhood of the lenders, which makes risk-level information readily available. The
residual demand for credit in the FFS is de�ned by equation (25) as the total self-selection
demand for loans in the FFS (equation (17)) less the proportion of revealed demand for FFS
loans that succeeds in getting loans from the commercial banks (equation (19)). We assume
the type of each potential borrower is correctly identi�ed by moneylenders as given by:
Lrft =�
#hr;tEt
24(1� �)�1 +Rlft
�K�t+1
�#hr;tWt+1Nt+1
351
��1
+(1� �)#lr;t
Et
24(1� �)�1 +Rlft
�K�t+1
�#lr;tWt+1Nt+1
351
��1
�
$t�
#hr;tEt
24(1� �)�1 +Rlft
�K�t+1
�#hr;tWt+1Nt+1
351
��1
� $t (1� �)#lr;t
Et
24(1� �)�1 +Rlft
�K�t+1
�#lr;tWt+1Nt+1
351
��1
Lrft =
"�
#hr;t
�1
#hr;t
� 1��1
+(1� �)#lr;t
�1
#lr;t
� 1��1
� $t�
#hr;t
�1
#hr;t
� 1��1
� $t (1� �)#lr;t
�1
#lr;t
� 1��1#
Et
24(1� �)�1 +Rlft
�K�t+1
�Wt+1Nt+1
351
��1
6We emphasize that the term moneylenders is not used to distinctly refer to the usury market, but ratheras a blanket reference to all creditors in the IFS, including the moneylenders themselves, traders, landlords,estate owners and grain millers, inter alia.
11

Lrft =
"�1
#hr;t
� 1��1�� (1�$t)
#hr;t
�+ Et
�1
#lr;t
� 1��1�(1� �) (1�$t)
#lr;t
�#24(1� �)
�1 +Rlft
�K�t+1
�Wt+1Nt+1
351
��1
(25)
Aggregate demand for loans in the IFS is given by the sum of equations (24) and (25):
Ladit =�
#hr;tEt
"(1� �)
�1 +Rlit
�qK�
t+1
�#hr;tWt+1Nt+1
# 1��1
+(1� �)#lr;t
Et
"(1� �)
�1 +Rlit
�qK�
t+1
�#lr;tWt+1Nt+1
# 1��1
+
"�1
#hr;t
� 1��1�� (1�$t)
#hr;t
�+
�1
#lr;t
� 1��1�(1� �) (1�$t)
#lr;t
�#24(1� �)
�1 +Rlft
�K�t+1
�Wt+1Nt+1
351
��1
Ladit =
"(1� �)
�1 +Rlit
�qK�
t+1
�Wt+1Nt+1
# 1��1 h �
#hr;t
�1
#hr;t
� 1��1
+(1� �)#lr;t
�1
#lr;t
� 1��1
+
�1
#hr;t
� 1��1�� (1�$t)
#hr;t
�+
�1
#lr;t
� 1��1�(1� �) (1�$t)
#lr;t
� i
Ladit = Et
"(1� �)
�1 +Rlit
�qK�
t+1
�Wt+1Nt+1
# 1��1 h �
�
#hr;t
��1
#hr;t
� 1��1
(2�$) +
�(1� �)#lr;t
��1
#lr;t
� 1��1
(2�$)i
Ladit = (2�$t)Et
"(1� �)
�1 +Rlit
�qK�
t+1
�Wt+1Nt+1
# 1��1 h �
�
#hr;t
��1
#hr;t
� 1��1
+
�(1� �)#lr;t
��1
#lr;t
� 1��1 i
(26)
12

2.5 Monetary Authorities
To identify how monetary policy is conducted in QEMEs, we �rst experiment with a forward
looking monetary policy rule that treats the bank rate (Rnrt ) as an operating tool of monetary
policy. The forward-looking speci�cation allows the central bank to consider a broad array
of information to form beliefs about the future condition of the economy (Clarida, Gali
and Gertler, 2000). The rule calls for adjustment of the bank rate based on the return on
investment, the expected change in output and expected in�ation:
Rnrt = �1Rrrt + �2�Y
e + (1� �2)�e + � (27)
where Rrrt is the real rat of interest or return on investment, �Y e is expected change in
output i.e. �Y e = E (Yt+1) � Yt, �e is expected rate of in�ation de�ned as the expecteddi¤erence between real and nominal interest rates in the next period and � is a disturbance
term assumed to be iid. Since our model is in discreet time, we postulate that the marginal
productivity of capital in the next period is equal to the rate of interest (see Carlstrom and
Fuerst, 2003; Benhabib, Carlstrom and Fuerst, 2005) as given by:
Rrrt = �eAt+1K��1
t+1 N1��t+1 (28)
2.6 Market Equilibrium
In equilibrium, clearing of the �nal goods market implies that aggregate production is equal
to demand for household consumption and private investment:
Yt = Ct + It (29)
where It = Kt+1. We assume that money is required for all transactions in the goods market.
In equilibrium, therefore, the following equality will hold:
PtCt =Mt (30)
Equation (30) is an identity illustrating an ex-post equilibrium position connoting that prices
operate only on the real side of the market. Since we have used Nt to represent labour supply
by the household as well as labour demand by the �rm, we have implicitly assumed clearing
of the labour market. The equilibrium wage is determined by the market according to
equations (5) and (14). The bank rate is determined by the monetary policy reaction function
13

in equation (27). Commercial bank deposit and and IFS interest rates are endogenously
determined. Base lending rates are determined by loading a �xed mark-up over the bank rate.
Self selection demand for FFS and IFS loans is given by equations (15) and (16), in that order.
Equations (19) and (26) represent loans supplied by the formal and informal �nancial sectors,
respectively. Equilibrium in the two markets follow the simultaneous equation solution of
the two equations, which takes into account the spill-over of demand from the FFS satis�ed
by the supply in the IFS. The sum of equations (19) and (26) determines the level of capital
accumulation in the economy.
We assume prices adjust to equate supply and demand in every market simultaneously (see
Mankiw, 1989). We further assume that money supply is exogenous. Interest rates and the
price level adjust to equate the supply and demand in the money market.
3 Simulation Results and Inferences
The model is solved using DYNARE. Calibrated parameter and steady state values are
summarised in Table 1 in the Appendix. We focus our attention on two shocks, viz., a
positive production technology shock characterised by an unexpected improvement in pro-
duction technology and a monetary policy shock identi�ed by an unanticipated increase in
the bank rate. In each case, we experiment with two distinct risk factors or success rates for
high risk borrowers. Figures 1 and 2 show the impact of a positive production technology
shock on various economic indicators when the success rate is nearly zero (0.00001) and 0.2,
respectively. Figures 3 and 4 repeat the experiment but for a monetary policy shock.
3.1 Production Technology Shock (#hr = 0:00001)
An unanticipated improvement in production technology with the rate of success for high risk
borrowers nearly zero (#hr = 0:00001), as illustrated in Figure 1, causes a decline in marginal
costs across all �rms leading to a jump in output and a decline in expected prices. In line
with the assumption of �exible prices, �rms fully adjust their prices with the result that
aggregate demand rises proportionately to the increase in productivity, leading to a gradual
increase in employment (after an initial dip). Since the shock causes an improvement in
the marginal productivity of capital, which is equal to the instantaneous interest rate (see
Carlstrom and Fuerst, 2003; Benhabib et al., 2005), we observe that our measure of the real
interest rate goes up together with all nominal interest rates in the FFS. Holding the risk of
default constant, interest rates in the IFS adjust upwards as well, in line with the lenders�
14

risk hypothesis (see Basu, 1997)7.
As a direct consequence of the improvement in technology, labour productivity increases,
consequently pushing wage rates upwards. Coupled with the increase in employment, the
higher wage rates lead to a rise in households��nancial resources, which results in an increase
in loans supplied by moneylenders. IFS loans, therefore, go up. Commercial banks respond
to the higher output by expanding their customer base, which results into a rise in FFS
loans, albeit marginally. Consistent with the higher interest rates, the commercial banks
also increase the proportion of total demand for FFS loans that succeeds in getting the
loans. Since capital stock depends on the sum of formal and informal �nancial sector loans,
inter alia, the increase in lending by commercial banks and moneylenders is followed by a
rise in capital stock.
3.2 Production Technology Shock (#hr = 0:2)
Figure 2 shows the impact of a positive production technology shock when the rate of success
for high risk borrowers is relatively high at 0.2. In contrast to the case in the previous section,
it is shown in Figure 2 that a higher rate of success for high risk borrowers causes a larger
increase in FFS loans since more entrepreneurs are now willing to take the risk of investing in
a business. IFS loans, on the other hand, do not change since all borrowers in this sector are
fully identi�ed by the lenders, implying that their loss function at every level of risk remains
unchanged. The net position is a larger increase in capital stock and output. The initial
dip in employment observed in 1 lessens as the rate of success for the high risk borrowers
increases and at #hr = 0:2, it completely reverses, turning into an initial jump in employment
that gradually returns to equilibrium.
3.3 Monetary Policy Shock (#hr = 0:00001)
Figure 3 shows impulse response functions of a monetary policy shock when the rate of
success for high risk borrowers is nearly zero (i.e. 0.00001). The shock causes an increase
in base lending rates and expected forward in�ation. Facing higher expected prices, house-
holds smoothen their consumption by reducing their consumption expenditures while �rms
respond to the expected lower sales by cutting down on production, employment and wage
rates. Accordingly, capital formation and subsequently demand for both formal and informal
�nancial sectors loans decline. The decline in IFS loans is reinforced by the lower wages and
7The lender�s risk hypothesis states that lenders in the IFS face a positive risk of default. Once the riskis taken into account, the e¤ective interest rate in the IFS equates to the FFS rate of interest.
15

employment, which reduce households��nancial resources, consequently lowering loanable
funds for moneylenders. Though commercial banks increase the proportion of total demand
for FFS loans that succeeds in getting the loans following the relatively higher lending rates,
total FFS loans decline as a result of the general decline in the demand for loans.
Moneylenders initially reduce their lending rates, possibly because the reduction in their
capacity to give out loans is proportionately lower than the decline in demand for IFS
loans i.e. at the pre-shock lending rates, the moneylenders have excess supply of loans,
ceteris paribus. Since IFS loans and commercial bank deposits are substitutes to households,
the excess IFS loanable funds are deposited in commercial banks, leading to a decline in
commercial bank deposit rates as well. This decline in commercial bank deposit rates may
also be attributed to the banks�inability to lend, leaving them with no incentive to attract
deposits because of the absence of any outlet for them.
3.4 Monetary Policy Shock (#hr = 0:2)
Figure 4 shows impulse responses of a monetary policy shock on selected macroeconomic
indicators following an increase in the success rate of high risk borrowers to 0.2 from 0.00001.
At this higher success rate, an unexpected increase in the bank rate causes a larger decline in
the demand for loans, both in the formal and informal �nancial sectors, leading to a larger
drop in capital stock, which corresponds to a larger decline in employment and output.
Expected forward prices go up by a larger margin than in the case where #hr = 0:00001,
causing a larger decline in consumption, output, employment, wages, lending and capital
formation. While the base lending rates remain unchanged, commercial bank deposit rates
and IFS lending rates decline by a larger margin relative to the case of a lower success rate
for high risk borrowers. A larger decline in the proportion of the total demand for FFS loans
that succeeds in getting the loans leads to a further decline in FFS loans.
3.5 Inferences
The model reveals that though formal and informal �nancial sector loans may be substitutes
in the borrowing �rm�s utility function, they are in e¤ect complementary in the aggregate.
A complementary credit link exists when growth in demand for credit from one sector is
accompanied by an increase in demand for credit from the other sector (Chipeta and Mkan-
dawire, 1991). This implies that an increase in capital formation �nanced by FFS credit
creates additional productive capacity that can be utilised only with IFS credit in order
to maintain the economy at an equilibrium level (see Aryeetey, 1992; Chipeta and Mkan-
16
dawire, 1992). Since the IFS provides additional �nance to �rms in excess of what comes
from the FFS, increasing the use of FFS credit increases the demand for credit in the IFS.
The model further demonstrates that the response of FFS loans to a positive production
technology shock is sensitive to the rate of success for high risk borrowers while the response
of IFS loans is not. An increase in the rate of success for high risk borrowers motivates
potential entrepreneurs to borrow from commercial banks and invest in businesses as the risk
of failure is now relatively low. Since commercial banks are not able to distinguish between
the types of borrowers, an increase in the success rate of high risk borrowers increases the
banks�expected pro�ts. For this reason, more FFS loans are given out. In the IFS, on the
other hand, the types of borrowers are fully identi�ed, indicating that a change in the success
rate of high risk borrowers does not change the risk pro�le of the potential borrowers in the
sector. Accordingly, moneylenders �nd no reason to adjust the amount of loans given out.
The model also illustrates that both formal and informal �nancial sector loans are sensitive
to high risk borrowers�success rates in their response to a monetary policy shock. Following
an unexpected increase in the base lending rate, we observe that higher success rates for high
risk borrowers are associated with larger declines in the demand for loans in both sectors.
In addition, the model shows that interest rates in the IFS are not necessarily driven by FFS
interest rates. While interest rates in the two sectors were observed to change together in the
same direction following a positive production technology shock, the same is not observed
with a monetary policy shock. The implication of this �nding is that the IFS may frustrate
monetary policy. We observe, for instance, from the impulse responses of the monetary
policy shock that a contractionary monetary policy is partly o¤set by a subdued decline in
IFS lending. While formal and informal �nancial sector loans remain complementary, the
decline in IFS loans following a contractionary monetary policy is lessened by a drop in IFS
interest rates.
Finally, in line with business cycle stylised facts, the model shows that lending, both in the
formal and informal �nancial sectors, capital formation, consumption and output follow the
pattern of business cycles.
4 Summary and Conclusion
This paper set out to investigate the interaction of formal and informal �nancial sectors and
to examine how economic activity is a¤ected. Commencing with the observation that the
IFS in QEMEs is large and plays a non-trivial role in de�ning the direction of economic
activity, we developed a four-sector macromonetary DSGE model for analysis. The model
17
demonstrate that while formal and informal sector loans may be substitutes in a borrower�s
utility function, they are in the aggregate complementary. Given that the IFS provides
additional �nance to borrowers in excess of the FFS loan supply, increasing the use of
FFS credit increases the demand for credit in the IFS (see Aryeetey, 1992; Chipeta and
Mkandawire, 1992). We also show that interest rates in the IFS may not necessarily be
driven by FFS interest rates. While the two may move together in some instances, they
may also move in diametrically opposite directions in other instances. It cannot, therefore,
be generalised that the IFS promotes or frustrates monetary policy. Finally, in line with
business cycle stylised facts, the model shows that lending, both in the formal and informal
�nancial sectors, capital formation, consumption and output follow the pattern of business
cycles.
References
Acharya, S. and Madhura, S. (1983). Informal credit markets and black money: Do they
frustrate monetary policy?, Economic and Political Weekly 8: 1751�1756.
African Development Bank, A. (1994). African development report, African Development .
Ambler, S. and Paquet, A. (1994). Stochastic depreciation and the business cycle, Interna-
tional Economic Review. 44: 101�116.
Aryeetey, E. (1992). The relationship between formal and informal sectors in the �nancial
market in ghana, AERC Research Paper Series 10.
Aryeetey, E. (1994). Financial integration and development in sub-saharan: A study of infor-
mal �nance in ghana, Overseas Development Institute Working Paper SeriesWP/78.
Aryeetey, E. (2008). From informal �nance to formal �nance in sub-saharan africa: Lessons
from linkage e¤orts, AERC/IMF African Finance for the 21st Century UnpublishedManuscript.
Atieno, R. (2001). Formal and informal institutions� lending policies and access to credit
by small-scale enterprises in kenya: An empirical assessment, AERC Research Paper
Series RP111: 1�46.
Bagachwa, M. (1995). Financial integration and development in sub-saharan africa: A study
of informal �nance in tanzania, ODI Working Paper Series .
Basu, K. (1997). Analytical Development Economics: The Less Developed Economy Revis-
ited, revised edition edn, Massachussetts: The MIT Press.
18

Bell, C. (1990). Interactions between institutional and informal credit agencies in rural india,
The World Bank Economic Review 4(3): 297�327.
Benhabib, J., Carlstrom, C. and Fuerst, T. (2005). Introduction to monetary policy and
capital accumulation, Journal of Economic Theory 123: 1�3.
Bolnick, B. (1992). Moneylenders and informal �nancial markets in malawi, World Devel-
opment 20(1): 57�68.
Carlstrom, C. and Fuerst, T. (2003). Investment and interest rate policy: A discrete time
analysis, Federal Reserve Bank of Cleveland Working Paper SeriesWP/03/20: 1�24.
Chipeta, C. (1998). Improving the intermediation role of the informal �nancial sector in
africa, Paper Presented at the United Nations Asia-Africa High-Level Workshop on
Advancing Financial Intermediation in Africa, Port Louis, Mauritius, 20-22 April, 1998
.
Chipeta, C. and Mkandawire, M. (1991). The informal �nancial sector and macroeconomic
adjustment in malawi, AERC Research Paper Series RP4: 1�58.
Chipeta, C. andMkandawire, M. (1992). Links between the informal and formal /semi-formal
�nancial sectors in malawi, AERC Research Paper Series 14: 1�39.
Clarida, R., Gali, J. and Gertler, M. (2000). Monetary policy rules and macroeconomic
stability: Evidence and some theory, The Qauarterly Journal of Economics Febru-ary: 147�180.
Dasgupta, B. (2004). Capital accumulation in the presence of informal credit constraints:
Does the incentive mechanism work better than credit rationing under asymmetric in-
formation?, University of Connecticut, Department of Economics Working Paper Series
2004-32.
Mankiw, G. (1989). Real business cycles: A new keynesian perspective, Journal of Economic
Perspectives 3(3): 79�90.
Mankiw, G. (2006). The macroeconomist as scientist and engineer, Journal of Economic
Perspectives 20(4): 29�46.
Peiris, S. and Saxegaard, M. (2007). An estimated dsge model for monetary policy analysis
in low income countries, IMF Working Paper SeriesWP/07/282.
Rahman, A. (1992). The informal �nancial sector in bangladesh: An appraisal of its role in
development, Development and Change 23: 147�168.
19

Soyibo, A. (1997). The informal �nancial sector in nigeria: Characteristics and relationship
with the formal sector, Development Policy Review 15: 5�22.
Steel, W., Aryeetey, E., Hettige, H. and Nissanke, M. (1997). Informal �nancial markets
under liberalisation in four african countries, World Development 25(5): 817�830.
Stiglitz, J. and Weiss, A. (1981). Credit rationing in markets with imperfect information,
The American Economic Review 71(3): 393�410.
Sundaram, K. and Pandit, V. (1984). Informal credit markets, black money and monetary
policy: Some analytical and empirical issues, Economic and Political Weekly 19: 695�677 & 679�682.
Tovar, C. (2008). Dsge models and central banks, BIS Working Paper SeriesWP No. 258.
Woodford, M. (2003). Interest and prices: Foundations of a theory of monetary policy.
20

Appendix: Tables and Figures
21

Table 1: Calibrated Parameter and Steady State ValuesParameter Description Value� Output elasticity of capital 0.37� Consumer subjective intertemporal discount factor 0.99� Depreciation rate 1� Autoregressive process for the technology factor 0.91� Consumption parameter 1q Probability of loan repayment in the IFS 0.85� Leisure parameter 3� Lagrangian multiplier in a �rm�s cost minimisation function 0.8� Proportion of high risk borrowers 0.15#hr Risk factor (rate of success) for high risk borrowers 0.00001/0.2#lr Risk factor (rate of success) for low risk borrowers 0.98� Mark-up over the bank rate to obtain base lending rate 0.1�1 Factor of inertia in the base lending rate 0.99�2 Weight of expected change in output in the monetary policy rule 0.99C Initial value of consumption 0.8K Initial value of capital stock 0.2N Initial value of employment 0.3$ Initial value of proportion of FFS loan demand that is satis�ed 0.7W Initial value of wage rate 0.3Rdf Initial value of commercial bank deposit rates 0.075�e Initial value of expected in�ation 0.27"A Initial value of technology shock 0.02mu Initial value of monetary policy shock 0.02
22

Figure 1: Impulse Responses of a Production Technology Shock when #hr = 0:00001
10 20 30 400
0.2
0.4A
10 20 30 400
0.02
0.04C
10 20 30 40-5
0
5x 10
-3 epie
10 20 30 400
0.005
0.01K
10 20 30 400
2
4x 10
-6 Lf
10 20 30 400
0.01
0.02Li
10 20 30 40-2
0
2x 10
-4 N
10 20 30 40-0.2
0
0.2Rrr
10 20 30 40-0.1
0
0.1Rdf
10 20 30 40-0.2
0
0.2Rlf
10 20 30 40-0.1
0
0.1Rli
10 20 30 40-0.2
0
0.2Rnr
10 20 30 40-5
0
5x 10
-3 varpi
10 20 30 400
0.1
0.2W
10 20 30 400
0.02
0.04Y
23

Figure 2: Impulse Responses of a Production technology Shock when #hr = 0:2
10 20 30 400
0.2
0.4A
10 20 30 400
0.02
0.04C
10 20 30 40-5
0
5x 10
-3 epie
10 20 30 400
0.01
0.02K
10 20 30 400
1
2x 10
-3 Lf
10 20 30 400
0.01
0.02Li
10 20 30 40-5
0
5x 10
-6 N
10 20 30 40-0.1
0
0.1Rrr
10 20 30 40-0.1
0
0.1Rdf
10 20 30 40-0.2
0
0.2Rlf
10 20 30 40-0.1
0
0.1Rli
10 20 30 40-0.2
0
0.2Rnr
10 20 30 40-5
0
5x 10
-3 varpi
10 20 30 400
0.1
0.2W
10 20 30 400
0.05Y
24

Figure 3: Impulse Responses of a Monetary Policy Shock when #hr = 0:00001�� � �� �����
�
2 4 6 8 10 12-2
0
2x 10
-4 C
2 4 6 8 10 120
1
2x 10
-4 epie
2 4 6 8 10 12-2
-1
0x 10
-4 K
2 4 6 8 10 12-2
-1
0x 10
-6 Lf
2 4 6 8 10 12-2
-1
0x 10
-4 Li
2 4 6 8 10 12-4
-2
0x 10
-4 N
2 4 6 8 10 120
5x 10
-3 Rrr
2 4 6 8 10 12-5
0
5x 10
-3 Rdf
2 4 6 8 10 120
0.2
0.4
Rlf
2 4 6 8 10 12-5
0
5x 10
-3 Rli
2 4 6 8 10 120
0.2
0.4
Rnr
2 4 6 8 10 120
0.005
0.01
varpi
2 4 6 8 10 12-1
0
1x 10
-3 W
2 4 6 8 10 12-4
-2
0x 10
-4 Y
25

Figure 4: Impulse Responses of a Monetary Policy Shock when #hr = 0:2
2 4 6 8 10 12-5
0
5x 10
-4 C
2 4 6 8 10 120
2
4x 10
-4 epie
2 4 6 8 10 12
-4
-2
0x 10
-4 K
2 4 6 8 10 12-1
-0.5
0x 10
-3 Lf
2 4 6 8 10 12-2
-1
0x 10
-4 Li
2 4 6 8 10 12-1
0
1x 10
-3 N
2 4 6 8 10 120
0.01
0.02Rrr
2 4 6 8 10 12-0.01
0
0.01Rdf
2 4 6 8 10 120
0.2
0.4Rlf
2 4 6 8 10 12-0.01
0
0.01
Rli
2 4 6 8 10 120
0.2
0.4
Rnr
2 4 6 8 10 120
0.01
0.02varpi
2 4 6 8 10 12-2
0
2x 10
-3 W
2 4 6 8 10 12-1
-0.5
0x 10
-3 Y
26