interactions between the thermic effect of food and
TRANSCRIPT

University of Arkansas, FayettevilleScholarWorks@UARK
Theses and Dissertations
8-2012
Interactions Between the Thermic Effect of Foodand Exercise on Total Energy Expenditure inModerately Active FemalesAshley BinnsUniversity of Arkansas, Fayetteville
Follow this and additional works at: http://scholarworks.uark.edu/etd
Part of the Exercise Science Commons, and the Nutritional Epidemiology Commons
This Thesis is brought to you for free and open access by ScholarWorks@UARK. It has been accepted for inclusion in Theses and Dissertations by anauthorized administrator of ScholarWorks@UARK. For more information, please contact [email protected], [email protected].
Recommended CitationBinns, Ashley, "Interactions Between the Thermic Effect of Food and Exercise on Total Energy Expenditure in Moderately ActiveFemales" (2012). Theses and Dissertations. 460.http://scholarworks.uark.edu/etd/460
INTERACTIONS BETWEEN THE THERMIC EFFECT OF FOOD AND EXERCISE ON
TOTAL ENERGY EXPENDITURE IN MODERATELY ACTIVE FEMALES

INTERACTIONS BETWEEN THE THERMIC EFFECT OF FOOD AND EXERCISE ON
TOTAL ENERGY EXPENDITURE IN MODERATELY ACTIVE FEMALES
A thesis submitted in partial fulfillment
of the requirements for the degree of
Master of Science in Kinesiology
By
Ashley Binns
University of Arkansas
Bachelor of Science in Education in Kinesiology, 2010
Bachelor of Science in Human Environmental Sciences, 2010
August 2012
University of Arkansas

ABSTRACT
Diet and exercise are key components to overall health maintenance. Aspects
contributing to weight maintenance include the thermic effect of food (TEF) and total energy
expenditure (TEE), with TEF contributing to upwards of 10% TEE. PURPOSE: The purpose of
this study was to determine the interaction between TEF and exercise on TEE in moderately
active females. METHODS: A sample population was established with the use of a health
history questionnaire (HHQ). Ten active females of normal body composition, determined by
body mass index (BMI) and a dual energy absorptiometry x-ray (DEXA) scan, participated in the
study. Maximal aerobic capacity was determined using the standard Bruce graded exercise
treadmill test. Participants returned for three additional testing sessions, each consisting of a
different feeding protocol combined with 30 minutes of exercise performed at 60% VO2max.
RESULTS: Repeated measures ANOVA indicated a significant time effect for the feeding
protocols (α = .05). Post-hoc analyses indicated significantly greater TEF with high protein
content compared to low and fasted as well as in low protein compared to the fasted condition.
Combined with exercise, TEE was significantly greater under high protein conditions compared
to fasted. No significance was found between the high and low protein conditions combined with
exercise or with the low protein compared to fasted. CONCLUSION: Findings of this study
indicate a relationship between protein content of a meal, TEF, and TEE with moderate-intensity
exercise. High protein meal (45%) consumption potentiated a greater TEF and overall TEE in
comparison to low protein meal (15%) consumption. In relation to exercise and TEE,
significance was only found when comparing high protein meal consumption and exercise to the
fasted state with exercise. Trends for increased TEF with exercise were present for exercise
performed after consumption of a low protein meal compared to the high protein meal and the
fasted state, though not statistically significant. Further research should be conducted examining

chronic exposure to a high protein diet combined with exercise to observe potential increased
interactions longitudinally. Additionally, a broader spectrum of populations should be studied to
better understand protein metabolism and TEE potentiated through TEF and exercise.

This thesis is approved for recommendation to the Graduate Council.
Thesis Director:
_________________________________
Dr. Michelle Gray
Thesis Committee:
_________________________________
Dr. Michelle Gray
_________________________________
Dr. Ro DiBrezzo
_________________________________
Dr. Matthew Ganio

THESIS DUPLICATION RELEASE
I hereby authorize the University of Arkansas Libraries to duplicate this thesis when needed for
research and/or scholarship.
Agreed _________________________________
Ashley Binns
Refused _________________________________
Ashley Binns
ACKNOWLEDGMENTS
Regardless of what goals I’ve decided to pursue over the years, it goes without saying
that I’ve chosen to be quite ambitious. In pursuing my Master’s degree, I challenged myself to
take it to a whole new level. I trusted in my advisor, mentor, peers, and colleagues to lead me in
the right direction toward continued professional development through gaining research
experience. Along the way, I’ve gained personal insight and perspective and have continued to
grow academically, professionally, and as an individual. It is through this growth that I’ve been
able to achieve all that I have.
Family and friends, it’s been a challenging six years! Although I’ve said, “I’m done after
this degree.” and have, at times, felt like I’m not cut out for a job in research or the field of
higher education, it turns out, I’m addicted to the process and am excited to continue on in
pursuit of a doctoral degree. Often referred to as “Webster”, by my sister, it is of no surprise that
I’ve grown to love academia and all that it has to offer.
Mom, Dad, Sister, Grandparents, Aunts and Uncles, thank you for knowing that I’d
always find my way through whatever struggles and hard times I faced. Thank you Dr. Di
Brezzo for constantly seeing in me what I could never really see in myself, potential. Thank you
Dr. Gray for seeing the potential in me that I’ve never quite seen in myself, for coming in before
6 a.m. on most days of the week to make this project possible, and for seeing my vision through
even if it couldn’t have been further from your research agenda. Thank you Dr. Ganio for
providing feedback and different perspectives on ways in which to improve my research.
Thank you to Ana and Brittany for devoting their entire Spring semester to help with
hours, upon hours, of data collection and making emergency milk and protein powder runs; the

study would not have been a success without all of your continued help and support throughout
the data collection process!
A special thank you to Jaci and Bethany for constantly being a listening ear and helping
hand in guiding me toward success. I feel fortunate to have the honor to have worked and
collaborated with you both.
Last, but certainly not least, thank you to the University of Arkansas Human Performance
Lab for permitting the use of the laboratory equipment that made my research project a success.

DEDICATION
This research project is dedicated to my family and close friends. The support you’ve
provided has helped me continue to pursue my aspirations, regardless of how ambitious they
may be.
To all of the teachers and professors, both past and present, for constantly reminding me
that I have what it takes to one day be in the same profession. For teaching me patience in the
process and helping mold me into the individual I am today. To my fourth grade teacher, Mrs.
Clinton, for staying in touch and indirectly providing the push that I needed to keep working
hard in pursuit of my dreams.
To all of my close friends who have been a listening ear and understanding of the
commitment I have to my work. You are always there to get me out of a rut, challenge my
thoughts and actions, and keep my life outside of work alive.
Most importantly, this is dedicated to my mom; an amazing woman, role model, and
support system, constantly reminding me that I have the power, strength, and determination to
get out of life what I put into it. You’ve been there through the worst and best of times in my
academic career and are my biggest fan. To my Dad for always being supportive and believing in
me. To my sister for teasing me about my nerdiness but embracing it at the same time; you have
taught me to loosen up a bit, but still enjoy my long walks in the library and piggy back rides.

TABLE OF CONTENTS
Chapter One .................................................................................................................................... 1
Introduction ..................................................................................................................................... 1
Hypotheses ...................................................................................................................................... 2
Research hypotheses ....................................................................................................................... 2
Operational Definitions ................................................................................................................... 3
Assumptions .................................................................................................................................... 4
Delimitations ................................................................................................................................... 5
Limitations ...................................................................................................................................... 5
Significance of Study ...................................................................................................................... 5
Chapter Two.................................................................................................................................... 6
Review of Literature ....................................................................................................................... 6
Diet-induced thermogenesis............................................................................................................ 7
Health implications for physical activity ...................................................................................... 10
Participant health and fitness status .............................................................................................. 10
Exercise ......................................................................................................................................... 12
Dietary thermogenesis and training .............................................................................................. 16
Feedings ........................................................................................................................................ 17
Meal size ....................................................................................................................................... 18
Meal composition.......................................................................................................................... 19
RMR measure ............................................................................................................................... 21
Chapter Three................................................................................................................................ 23
Participants .................................................................................................................................... 23
Study design .................................................................................................................................. 23
Instrumentation ............................................................................................................................. 23
Procedures ..................................................................................................................................... 26
Variables ....................................................................................................................................... 34
Data analysis ................................................................................................................................. 34
Chapter Four ................................................................................................................................. 36

Purpose ........................................................................................................................................ 386
Descriptives................................................................................................................................. 386
Hypothesis one ............................................................................................................................ 397
Hypotheses two and three ............................................................................................................. 39
Hypothesis four ............................................................................................................................. 41
Summary ....................................................................................................................................... 41
Chapter Five .................................................................................................................................. 43
Discussion ................................................................................................................................... 463
Conclusions ................................................................................................................................. 505
References ................................................................................................................................... 530
Appendices .................................................................................................................................. 533
Appendix 1: Informed Consent ................................................................................................... 544
Appendix 2: IRB Approval Letter ................................................................................................ 56
Appendix 3: Health History Questionnaire (HHQ) .................................................................... 577
Appendix 4: DEXA Informed Consent......................................................................................... 60
Appendix 5: IRB Modification Approval Letter .......................................................................... 62
Appendix 6: GXT Data Collection Sheet ..................................................................................... 63
Appendix 7: Pre-Testing Guidelines ............................................................................................. 64
Appendix 8: Data Collection Sheets ............................................................................................. 65
Appendix 9: IRB Modification Approval Letter .......................................................................... 70
Figures........................................................................................................................................... 71
Figure 1: Feeding Protocol Flow Chart ........................................................................................ 72
Figure 2: Electrode Placement ...................................................................................................... 73
Tables ............................................................................................................................................ 74
Table 1: Meal Macronutrient Composition................................................................................... 75
Table 2: Bruce Protocol ................................................................................................................ 76
Table 3: Descriptive Statistics for All Participants ....................................................................... 77
Table 4: Repeated Measures ANOVA Summary Table for Thermic Effect of Food .................. 78
Table 5: Post-hoc Analysis for Thermic Effect of Food ............................................................... 79

Table 6:Repeated Measures ANOVA Summary Table for Thermic Effect of Food with Exercise
.................................................................................................................................................... 80
Table 7: Post-hoc Analysis for Thermic Effect of Food with Exercise ........................................ 81

1
CHAPTER ONE
INTRODUCTION
It is well known that both diet and exercise are key components in overall maintenance of
optimal health. Certain aspects of diet and exercise, however, may actually have a greater impact
on weight maintenance than originally thought. Exercise, in both aerobic and anaerobic forms, is
well known to contribute to overall energy expenditure. The thermic effect of food (TEF),
however, is another component that contributes to total energy expenditure (TEE). TEF has been
recognized as a contributor to energy expenditure due to the increase in metabolic rate induced
after meal ingestion as the body works to break down meal components into utilizable
components (Halton & Hu, 2004). Overall, TEF is said to account for approximately 10% of
total energy expenditure in humans (Welle, 1984). The extent to which metabolic rate is
increased after meal ingestion has been shown to be macronutrient dependent. Given the
composition of a meal [protein to carbohydrate to fat ratio (PRO:CHO:F)], it may likely be more
or less of a contributor to total energy expenditure.
In mixed meal studies, there has been convincing evidence indicating that meals
containing higher protein content potentiate a greater thermic effect when compared to
carbohydrate and fat (Halton & Hu, 2004). A main reason for this difference may be due to the
fact that the body has no storage capacity for protein so it needs to be metabolically broken down
immediately (Halton & Hu, 2004). Reasons for the increased thermic effect of protein are
postulated to consist of the high adenosine triphosphate (ATP) cost of synthesis, the high cost of
urea production, as well as gluconeogenesis (Halton & Hu, 2004).
Although mixed meal studies have been indicative of significant energy expenditure
based on potentiated TEF, many have been conducted using population extremes, such as obese

2
compared to non-obese, with no exercise protocol implementation. In particular, populations of
non-lean (obese) individuals have been compared to lean individuals to monitor TEF changes
under normal, resting conditions. While there are some studies that have been conducted using
these population extremes with exercise protocol implementation, there is room for further
research in isolated gender populations as well as non-extreme populations such as normal
weight. That being understood, the purpose of this study was to observe and better understand
the interactions between TEF and exercise intensities based on protein content of a meal in a
moderately active, pre-menopausal, female population. Mixed meals were used, in addition to an
exercise protocol, in order to potentiate maximal TEF and energy expenditure.
Hypotheses
Research:
1. Meals with high protein content will create a greater TEF than lower protein meals
and fasted.
2. Meals with high protein content will create greater TEF with moderate intensity
aerobic exercise as compared to meals with low protein content and fasted.
3. Meals with low protein content will create a greater TEF with moderate intensity
aerobic exercise as compared to fasted.
4. Moderate intensity aerobic exercise performed in the fed state will create a greater
total energy expenditure when compared to moderate intensity aerobic exercise
performed in the fasted state.
The purpose of these hypotheses was to further investigate if there was an interaction between
TEF, exercise protocol, and total energy expenditure based on the protein content of a meal.

3
Operational Definitions
Activity level, defined as the amount of structured exercise and the intensity to which that
exercise is completed on a weekly basis. An active activity level, as defined by the American
College of Sports Medicine (ACSM, 2001), consists of habitual physical activity/regular
moderate to vigorous intensity exercise, burning greater than 2,000 kcal∙wk-1
, 3-5 d∙wk-1
at an
intensity of 40%-84% heart rate reserve (HRR). Moderate activity level, as defined by ACSM,
consists of sporadic physical activity/no or suboptimal exercise/moderately to mildly
deconditioned, burning 1,500-2,000 kcal∙wk-1
, 3-5 d∙wk-1
at an intensity of 40%-59% HRR.
Sedentary activity level, as defined by ACSM, consists of no habitual activity or exercise,
extremely deconditioned, burning 500-1,000 kcal∙wk-1
, 3-5 d∙wk-1
at an intensity of less than
20% HRR.
Aerobic exercise, defined as the exercise intensity at which oxygen (O2) uptake is
sufficient to sustain a workload; moderate intensity aerobic exercise, defined as approximately
60-70% VO2max.
Body mass index (BMI), as defined by ACSM, is an assessment of weight relative to
height and is calculated by dividing body weight in kilograms by height in meters squared
(kgm-2
).
Energy expenditure, defined as increased ATP utilization above baseline or resting rate.
Fasted state, defined as not having consumed any food or beverage, aside from water,
within the past 12 hours prior to testing (Segal, Presta, & Gutin, 1984; Tai, Castillo, & Pi-
Sunyer, 1991; Westerterp, 2004; Kinabo & Durnin, 1990).
Low-protein meal, defined as a meal comprised of 15% protein.
High-protein meal, defined as a meal comprised of 45% protein.
4
Normal weight, defined as a BMI of 18.5-24.9 kgm-2
according to the World Health
Organization (WHO).
Maximal oxygen consumption (VO2max) defined as maximum O2 consumed per minute
(Segal, Gutin, Nyman, & Pi-Sunyer, 1985).
Respiratory exchange ratio (RER), defined as the ratio of CO2 to O2 measured from the
mouth and is used in interpreting substrate utilization and heat production (Scott, 2005).
Resting metabolic rate (RMR) defined as oxygen uptake and carbon dioxide expulsion in
the rested state (Reed & Hill, 1996).
Thermic effect of food (TEF), defined as the increase in energy expenditure above
baseline following consumption of a meal (Halton & Hu, 2004). It can be further defined as the
difference in energy expenditure between fed and fasted conditions (Segal & Pi-Sunyer, 1986)
and the energy required for digestion, absorption, and disposal of ingested nutrients (Halton &
Hu, 2004). It can occur in response to such stimuli as meal content (Segal & Pi-Sunyer, 1986)
and is measured by oxygen (O2) uptake and carbon dioxide (CO2) expenditure ratio (Segal,
Presta & Grutin, 1984).
Total energy expenditure (TEE), defined as anaerobic energy expenditure plus aerobic
energy expenditure (Scott, 2005).
Assumptions
1. Based on an overview of the literature, the assumption can be made that protein will
create a greater TEF than its macronutrient counterparts, carbohydrate and fat.
2. Given the moderately active lifestyle and normal weight status of the participants, it
was assumed that insulin regulation should not influence overall TEF and energy expenditure
results.

5
3. It was assumed that during maximal VO2 testing, participants gave 100% effort and
performing the exercise to volitional exhaustion.
Delimitations
Given the specificity of the study, results may not be applicable to the general population.
More specifically, results may not be an accurate representation in the male population, in the
athletic or highly active population, in sedentary individuals, in individuals with metabolic
disorder(s), and individuals who have experienced significant weight loss (> 2 kg) in the past 6
months (Segal, Gutin, Nyman, & Pi-Sunyer, 1985). While this list is not all inclusive, it provides
for an idea of those in which the results of this study may not be generalizeable.
Limitations
The phase of the menstrual cycle the participant is in during the given test period may
present as a potential limitation due to hormonal changes and physiological adaptations that may
take place during a given time of the cycle.
Significance of Study
With much of the reviewed literature being based on the outcomes of male populations,
the purpose of this study was to determine the interaction between TEF and TEE based on
protein content of a meal in a moderately active, college-aged, female population. Developing
further understanding of the interactions between these components may be beneficial in
determining how to better potentiate total energy expenditure with diet and exercise
modifications.

6
CHAPTER TWO
LITERATURE REVIEW
The thermic effect of food (TEF), as well as the type and intensity of exercise, potentiate
total energy expenditure (TEE). Defined in different ways, TEF of food is said to be the increase
in metabolic rate and energy expenditure above baseline following ingestion of a meal (Kinabo
& Durnin, 1990; Reed & Hill, 1996; Halton & Hu, 2004), the difference in energy expenditure
between fed and fasted conditions (Segal & Pi-Sunyer, 1986), and the energy required for
digestion, absorption, and disposal of ingested nutrients (Halton & Hu, 2004). All of these
definitions make up the overall definition of TEF in that they all may occur as a result of certain
physiologic stimuli, such as meal consumption (Halton & Hu, 2004). TEF is thought to account
for an increase in energy expenditure and approximately 10% of TEE (Welle, 1984; Halton &
Hu, 2004; Stob, Bell, van Baak, & Seals, 2007). As a means of measure, carbon dioxide (CO2)
production and oxygen (O2) uptake ratios (i.e. respiratory exchange ratio [RER]) can be
measured using indirect calorimetry (Hill et al., 1991) and can be used to assess heat production
(Scott, 2005; Segal et al., 1984). This measure of heat production provides for a means of
estimating caloric expenditure at any given intensity as well as at rest. Although arguably the
most important consideration of energy expenditure is the total amount of energy expended
(Buchholz & Schoeller, 2004), multiple aspects of diet and nutrition have been related to overall
TEF and TEE. Thermic effect of food has been shown to be affected by dietary thermogenesis,
feeding type and content, meal size, and meal composition whereas TEE is related to TEF with
the addition of physical activity and RMR.

7
Diet Induced Thermogenesis
Variation in potentiation of dietary thermogenesis is a result of the composition of the
meal. With caloric intake, metabolic rate is known to rise. However, the extent to which it rises
is also dependent on macronutrient composition. Pittet, Gygax, and Jéquier (1974) found energy
expenditure to increase 6-8% with consumption of carbohydrate-based meals, 3% with higher fat
meals, and 25-40% with protein-based meals. These increases in energy expenditure were
exhibited in the seven healthy males who participated in the study in which three different meals
were administered; a 50g glucose meal, a 50g meal consisting of a balanced mixture of amino
acids, and a 50g glucose + 50g meal consisting of an amino acid mixture (Pittet et al., 1974).
Prior to consuming either of the meals, the participants fasted for 12 hours. Upon arrival to the
testing facility, the participants rested for one hour, completed a 40-minute metabolic
measurement, and then consumed a test meal; metabolic measurements were again taken for two
and a half hours following meal administration, with the focus being on respiratory quotient
(RQ) and O2 to CO2 concentration ratios. Although all three 200 calorie feeding protocols
resulted in increased energy expenditure, protein was found to cause a greater increase when
compared to carbohydrate. However, the researchers were unable to determine the exact time
point in which increased energy expenditure took place since most metabolic measures were on
the way to reaching their initial value towards the end of the test.
In an effort to determine time points in which dietary thermogenesis occurred, Scott,
Fernandes, and Lehman (2007) conducted an experiment examining: 1) when energy expenditure
began to rise after a feeding, and 2) the difference in onset of TEF between isocaloric (300 kcals)
carbohydrate and protein meals. A total of 18 healthy individuals participated in this study
(males, n = 7; females n = 11). On two different occasions, participants arrived at the testing

8
facility, rested for 60-minutes, and then had RMR measured over a 30-minute period, the last 10
minutes of which was averaged into an estimated RMR. Following this measure, participants
randomly received either a high protein (73.8%) or high carbohydrate (88%) liquid meal.
Immediately after consuming the meal, another 30-minute metabolic measure was taken to
identify the onset of TEF. Onset was determined by two consecutive one-minute measures
exceeding five to ten percent of each individual’s RMR. Examined as a five to ten percent
increase in RMR, no significant differences were found in the onset of TEF between the high
protein and high carbohydrate meals. On average, TEF potentiation was found to take
approximately 8 minutes for a 5% rise in energy expenditure and upwards of 14-16 minutes for
a 10% rise in energy expenditure; several participant’s (n = 11) results indicated no increase in
TEF over the 30-minute time period. Although the results of this study were not indicative of the
time exact in which TEF was potentiated, a difference in macronutrient metabolism between
genders was found, with males exhibiting a faster carbohydrate metabolism rate than females.
Further observation of the difference in macronutrient metabolism between subjects needs to
take place to better understand the significant of the differences.
Miller, Mumford, and Stock (1967), found the thermic effect of a meal to occur one hour
after consumption of breakfast meals composed of 370-3,200 calories with 1.8-18.0% of the
calories coming from protein. The thermic effect was calculated based in comparison to each
participant’s baseline fasting RMR; results indicated a thermic response. On average, a
magnitude equivalent to 25% of the fasting heat production by each participant was attained. It
was also found within this study that the larger the meal consumption, the greater the magnitude
of the thermic response and the longer the duration it occurred. Also, activity among the
individuals participating in the study was examined to potentially find an association between

9
thermic effect of meals, activity level, and energy expenditure. Results indicated that the thermic
responses increased during normal activity up to twice the resting value when exercising.
Although exercise dose response was not stated, this study provides background evidence that
meals of varying sizes and protein content have the ability to create a thermic effect that is
increased when at rest or during exercise.
Duration of dietary thermogenesis may differ between macronutrient composition as well
as caloric content. Looking to examine nutrient quality and quantity on diet-induced
thermogenesis, Karst, Steiniger, Noack, and Steglich (1984) recruited 12 healthy males to
undergo two, six-hour investigations. Test meals consumed by the participants consisted of one
of three different proteins, one carbohydrate, and two dietary fats. Either dry-frozen egg white or
commercial gelatin and casein, obtained from skimmed curds, were used as the protein source,
corn starch as the carbohydrate, and sunflower oil and butter as the fats. Upon arrival to the
testing facility, participants assumed the seated position and respiratory metabolic measurements
were obtained for two hours. Following the two hours of measurement, participants were given a
meal to consume consisting of various combinations of the previously listed food stuffs; some
meals containing a greater caloric content than others. Metabolic measurements were again taken
via indirect calorimetry and urine collected for an additional six hours post-meal. Results from
these measures indicated that the thermic effect of the carbohydrate reached its peak one hour
after the test meal had been consumed, casein achieved peak values two hours post-meal, and the
thermic effect of the egg protein and gelatin combination continued to increase over a four-hour
time period. All protein thermic response ceased five hours post-meal. Based on these findings, it
was demonstrated that the thermic effect present in normal-weight subjects was dependent on the

10
amount of energy, or calories, supplied by the meal. This confirmed the significant thermic
difference between smaller and larger feedings.
Health Implications for Physical Activity
Implications of the study conducted by Pittet et al. (1974) warrant further investigation
taking into account age, activity level, and body composition of individuals on TEF. It is known
that these factors can influence the breakdown of certain food stuffs. It is also known that proper
nutrition is critical in the maintenance of optimal health (CDC, 2011). In addition, exercise is
important in the reduction in risk for development of chronic diseases such as cardiovascular
disease, diabetes, cancer, obesity, hypertension, bone and joint diseases, and depression
(Warburton, Nicol, & Bredin, 2006; CDC, 2011). Exercise has also been established as one
factor that may possibly affect thermogenesis; however, results have not been conclusive
(Westerterp, Wilson, & Rolland, 1999).
Participant Health and Fitness Status
A factor contributing to TEF and TEE that has not been extensively studied includes
body composition of the individual. Segal et al. (1985), compared non-obese (< 15% body fat)
and obese (> 25% body fat) men to examine the relationship between body composition and
thermogenesis with the understanding that body weight, body fat, and lean body mass all
increase with increasing obesity and may have an impact on TEF. None of the men in the study
participated in regular aerobic exercise, but the non-obese individuals participated in regular
strength training programs or in sports of anaerobic nature (e.g. wrestling, power-lifting,
football) (Segal et al., 1985). Maximal oxygen consumption was significantly lower in obese
individuals; however, relative to lean body mass, VO2max was not significantly different among
the two groups. The thermic effect of food during 30 minutes of cycle ergometry was
11
significantly greater for the non-obese than the obese men. Both groups exhibited significantly
greater energy expenditure during exercise in the postprandial versus the postabsorptive state.
The peak increase in postprandial metabolic rate during rest occurred significantly later for the
obese individuals than for the non-obese individuals. The correlation between aerobic fitness and
the thermic effect of food was not statistically significant under either the resting or post-exercise
conditions for either group (Segal et al., 1985). Given that the exercise bout was performed from
30 to 60 minutes after the start of the test meal, it is possible that the 3-fold lower thermic
response during exercise for the obese compared with the non-obese men is related to their
delayed response to the meal and potentially to impaired glucose tolerance (Segal et al., 1985).
Therefore, the capacity for thermogenesis in an overly fat population may be blunted more so
than in overweight, but overly muscular, men.
Similarly, Segal et al. (1984) studied the thermic effect of food during incremental cycle
ergometer exercise in non-obese and obese men. In each population, graded exercise tests were
performed after a 12-hour fast and 60 minutes after a 910 calorie mixed meal feeding, on
separate days. Results from the study indicated that VO2max was significantly higher in non-obese
men compared to obese men, relative to body weight. Overall, the thermic effect of food during
exercise was virtually absent in obese men as compared to the non-obese men. Potential
contributors to this impaired thermogenesis may have been the cycling of substrates by the liver
or due to the presence of more adipose tissue than to active skeletal muscle (Segal et al., 1984);
with increased body fat being related to a decreased VO2 capacity and thus decreased
thermogenesis.
A supplementary review conducted by Paddon-Jones and colleagues (2008) contradicts
the perceived viewpoint about a hindered increase in energy expenditure with consumption of a

12
higher amount of protein. Instead it provides the viewpoint that the apparent increase in satiety
and thermogenesis associated with consumption of a diet higher in protein may actually result in:
1) reduced energy efficiency of macronutrient consumption, leading to increased dietary
thermogenesis; 2) an overall decrease in caloric consumption; and 3) increased weight loss and
maintenance over time. From this perspective, implications for diet modification, with an
emphasis on increased protein consumption, in combination with an exercise regimen, may
potentiate greater total energy expenditure.
Exercise
Richard and Rivest (1989) introduced an idea of work-induced thermogenesis, which
refers to heat loss associated with the internal processes necessary for the production of external
work, such as exercise. In light to moderate intensity exercise, oxygen uptake remains relatively
level, but as intensity of exercise increases, oxygen uptake also increases (Scott, 2005). The
combination of these components, in addition to meal content and the interactive effects of diet
and exercise on energy expenditure, might suggest additional energy expenditure under training
conditions of differing energy contributions (Scott, 2005; Richard & Rivest, 1989); lower
intensity exercise being related to greater utilization of fat as fuel and higher intensity exercise
being related to greater carbohydrate utilization. Therefore, exercise type and intensity may play
an additive role in increasing the thermic effect of food.
Melanson et al. (2002) put the previous substrate utilization hypotheses to the test when
examining 24-hour energy expenditure and nutrient oxidation in 16 lean, healthy adults, all of
which were moderately active. Preliminary assessments were conducted with the use of indirect
calorimetry. To obtain maximal aerobic capacity, a graded exercise cycling test was conducted.
Resting metabolic rate was also measured via indirect calorimetry with a 15-20 minute
13
measuring period following a 12-hour fast and 30 minutes of rest upon arrival to the testing
facility. The experimental protocol consisted of the following: 1) measurement of 24-hour
energy expenditure and substrate oxidation via whole room, indirect calorimetry; 2) an additional
calorimetery day in which no exercise was performed; 3) a calorimetery day in which low-
intensity aerobic exercise (40% VO2max) was performed; and 4) a calorimetery day in which
high-intensity aerobic exercise (70% VO2max) was performed. Under conditions in which
exercise was performed at low- or high-intensity, the bout lasted until participants expended
approximately 400 calories. For women, this took anywhere from 66.3 ± 4.0 minutes to 111.9 ±
2.5 minutes during high-intensity and low-intensity protocols, respectively. For men, the
duration lasted anywhere from 49.1 ± 2.2 minutes to 86.1 ± 4.7 minutes during high- and low-
intensity protocols, respectively. Original hypotheses suggested the potential for 24-hour energy
expenditure to be greater on the day in which high-intensity exercise was performed and 24-hour
fat oxidation lower with high-intensity exercise. Results indicated absolute 24-hour energy
expenditure to be significantly elevated above the control protocol with both the high- and low-
intensity exercise bouts; however, no significant difference was found between the exercising
conditions. As hypothesized, the rate of energy expenditure during exercise was significantly
increased with intensity, but no significant differences were found in post-exercise energy
expenditure among the high- and low-intensity exercise bouts. Gender differences were found in
relation to nutrient oxidation; 24-hour carbohydrate oxidation was significantly higher in men
than in women and fat oxidation occurred at a higher rate among women (24-56%). Given these
results, and the lack of increased energy expenditure following an acute bout of aerobic exercise
when energy cost of exercise was matched, resting energy expenditure was not found to

14
significantly change. In addition, carbohydrate was not found to be of greater presence with
regard to oxidation, thus contributing to a greater proportion of the elevated respiratory quotient.
In another study examining postprandial thermogenesis with exercise, Schutz, Bessard,
and Jéquer (1987) recruited 12 healthy women, six obese and six non-obese, to participate in a
multi-part study designed to examine such potential changes. Throughout the duration of this
study, and on the days preceding data collection, participants maintained their usual eating
habits. Ten days prior to participating in the second thermogenesis study, a diet for inducing
weight loss was introduced with protein supplementation which permitted for adequate weight
loss averaging 11.2 kg. During the second part of this study, carbohydrates were slowly
implemented back into the diet. In testing for thermogenesis at rest, individuals underwent basal
energy expenditure measures through the use of a ventilated hood, shortly after waking. They
were then administered a test meal composed of 17% calories derived from protein, 54% derived
from carbohydrate, and 29% derived from fat. A postprandial energy expenditure measure was
conducted for 300 minutes following the feeding. Approximately five hours later, each
participant performed 44 minutes of continuous exercise on a bicycle ergometer at various
workloads. Energy expenditure was measured continuously throughout the exercise bout. A 20-
minute seated recovery period was given following the exercise bout in which further
expenditure measures were taken, followed by re-administration of a meal and completion of the
exercise protocol. The overall purpose of this repeated measurement format was to examine a
possible influence of a first bout of exercise on the second bout of exercise with energy
expenditure. Results indicated non-significant effects of workload on the thermic response to a
meal; however the ingestion of the meal provoked an elevation in the respiratory quotient.
Although the net increase in energy expenditure induced by the meal while exercising was

15
slightly lower than that obtained in the matched resting period immediately before or at the onset
of exercise, there was sufficient evidence to support that eating provokes an increase in oxygen
consumption. With this understanding, it can be hypothesized that meal consumption combined
with an adequate duration of exercise, at a given intensity, can further potentiate energy
expenditure through dietary thermogenesis.
Segal, Presta, and Gutin (1984) also studied TEF between obese and non-obese men.
However, one of the main differences being the graded exercise bout. Six obese and six non-
obese men participated in this study and committed to reporting for testing on two
nonconsecutive mornings following a 12-hour fast. For comparison measures, one of the testing
protocols involved performing a cycle ergometer graded exercise test in the fasted state and then
returning on a separate occasion to perform the same exercise test after consumption of a meal.
The meal consisted of 910 calories comprised of 14% protein, 46% carbohydrate, and 40% fat.
Upon arrival to the laboratory each testing day, RMR measurement was taken for use as a
baseline measurement. On the testing day that did not include consumption of a meal, the RMR
measurement was taken and the exercise bout administered. On the day the participant was to
consume a meal, RMR measurement was taken, the meal consumed, and then the exercise bout
performed. Caloric expenditure was estimated with the use of the VO2 data. Based on these
measures, VO2 at 60 minutes postprandial was significantly higher than the fasted for both
groups. The energy expenditure during submaximal exercise differed between the two groups;
non-obese men expended significantly more energy in the fed state at each power output, but that
was not the case for the obese men. It was also found that although the thermic effect of food
during exercise was significantly different between the two groups, it did not significantly
change across varying exercise intensities among both groups.

16
Dietary Thermogenesis and Training
Physiologically, it is important to understand that a large determinant of overall energy
expenditure, over time, can be attributed to training state and potential body composition
changes. Based on previous studies, it has been found that TEF is greater in healthy adults who
habitually exercise than in their sedentary counterparts (Stob et al., 2007). This is thought to be a
result of increased sympathetic nervous system (SNS) activation, ultimately contributing to
greater β-adrenergic receptor stimulation and increased cellular metabolism (Stob et al., 2007).
Therefore, the more active an individual, the greater the potential for SNS activation with a
susequent increase in energy expenditure when combined with the thermic response of a meal
alone.
LeBlanc, Mercier, and Samson (1984) related diet-induced thermogenesis to training
state among females of various fitness levels. One group consisted of individuals who had
participated in competitive events for at least one year, a second group who had exercised at least
three times per week for 60 minutes per day, and a third group of individuals that occasionally
performed moderate activity. All participants completed a VO2max test to volitional fatigue prior
to their first protocol testing session. Upon arrival to the laboratory for their second testing
session, participants relaxed comfortably for 10 minutes and then underwent two, 15-minute
metabolic measurements in which RMR was determined from indirect calorimetry VO2 to VCO2
exchange ratios. The participants were then given an 818 calorie mixed-meal (14.9% protein,
38.5% carbohydrate, and 46.5% fat) to consume, followed by 120 minutes of additional
metabolic measures. Dietary thermogenesis was determined as the difference between the heat
production after meal ingestion and RMR; results indicated a significant difference between the
highly-trained group and the sedentary group one hour after meal consumption. A significantly

17
greater elevation in respiratory quotient measures was found among the second and third groups
in comparison to the first; this difference being indicative of the nutrient utilization by each of
the groups based on their trained state. The acute bout Implications from this study can be used
in conducting further research on energy expenditure following a meal in moderately-active
individuals. With increased energy expenditure exhibited from administration of a meal, and
additional energy expenditure exhibited with exercise, it could be hypothesized that acute food
and exercise bouts could potentiate greater overall energy expenditure and may be enhanced with
habitual aerobic endurance exercise (Jones et al., 2004).
Feedings
Feeding protocols have been shown to have an effect on energy expenditure. Recently,
various food sources used in experiments have been examined in an attempt to potentiate a
thermic effect (Welle, 1984). In particular, the role of protein in relationship to TEF has received
considerable attention (Belko, Barbier, & Wong, 2004). Potential reasons for the increased
thermic effect of protein may include increased energy expenditure associated with intestinal
absorption of food stuffs, metabolic effects of hepatic metabolism (Bray, Whipp, & Koyal,
1974), the body having inadequate storage capacity for protein, the energy requirement for
protein synthesis, the high adenosine triphosphate (ATP) cost of peptide synthesis, the high
energy cost of urea, creatine, and other nitrogenous end product production, and gluconeogenesis
(Buchholz & Schoeller, 2004; Halton & Hu, 2004; Johnston, Day, & Swan, 2002). Given this
understanding of the work required for substrate catabolism, it can be hypothesized that greater
energy expenditure may result from consumption of a meal containing a greater proportion of
protein than any other macronutrient.

18
In further examination of the catabolism of food stuffs for energy, the first law of
thermodynamics can be taken into consideration; energy is neither created nor destroyed, but is
rather transformed resulting in heat production (Buchholz & Schoeller, 2004). Heat production
from protein was closely examined by Rubner and Atwater (Widdowson, 1955). When looking
at different heat production reactions in macronutrients, Rubner and Atwater found that the heat
of combustion of protein was greater than its caloric value to this body (Widdowson, 1955). This
result being due to the body only being able to oxidize protein into urea, creatinine, uric acid, or
other nitrogenous end-products which are then capable of being further oxidized (Widdowson,
1955), thus being transformed into greater heat production.
Regardless of the apparent findings indicating the potential for greater heat production
and energy expenditure due to the chemical composition of protein, a calorie is equivalent to a
calorie, numerically. The difference in the calorie per macronutrient comes from the ability of
the body to extract all of the calories liberated from the combustion of food stuff (Buchholz &
Schoeller, 2004). In reference to protein, the body is unable to extract all of the calories liberated
from this macronutrient due to active oxidation and excretion of excess amino acids (Paddon-
Jones et al., 2008); therefore, additional energy is expended to account for the above listed
metabolic processes.
Meal Size
It has also been suggested that the size of the meal may impact the thermic response with
an increase in meal size potentiating an increase in basal metabolic rate after exercise (Bray et
al., 1974; Segal & Pi-Sunyer, 1986). The magnitude of the thermic response to protein ingestion
alone has been seen to range from 10-30% (Segal et al., 1985; Leibel, Rosenbaum, & Hirsh,
1995) to upwards of 50-100% (Johnston et al., 2002) higher than that for carbohydrate or fat

19
(Belko et al., 2004). While these reports are conflicting, there is an indication that protein
exhibits a greater thermic response than other macronutrients in partial contribution to the
magnitude of the effect of thermic response; meal size is suggested to play a part (Bray et al.,
1974). As meal size increases, thermic response has also been seen to increase and be higher
after exercise than before (Miller et al., 1967). Some studies have suggested that TEF
potentiation by exercise can only be found when meal size exceeds that of 900 calories or when
subjects are overfed at least one day prior to testing (Welle, 1984). Contrary to this belief,
Kaplan and Leveille (1976) found that administration of an 823 calorie high protein meal in
obese and non-obese individuals led to an increase in oxygen consumption in the non-obese
women. The prevalence of this increased oxygen consumption is indicative of increased carbon
dioxide expulsion, ultimately resulting in potentially greater energy expenditure among this
group due to the consumption of the high protein meal, but the opposite resulted in the obese
women. Further research is needed to examine the potential physiological barriers amongst the
obese population leading to decreased potentiation of thermic effect.
Meal Composition
Although meal size is an influential component to dietary thermogenesis as well as
overall energy expenditure, it has also been found that energy content of a meal can have a
significant effect on TEF (Kinabo & Durnin, 1990; Westerterp, 2004). Results from short-term
studies have indicated that protein is superior to carbohydrate in promoting both satiety and
dietary induced thermogenesis (DIT) (Mikkelsen et al., 2000). However, the bioavailability of
the nutrients within a meal may also be influential. Carbohydrates, when consumed, can be
readily broken down for fuel with or without enough oxygen present. Fat can also be catbolized
and used as fuel while at rest or during steady state exercise permitting enough oxygen is

20
available. Therefore, further examination of the extent to which energy is expended with
variance in meal composition and bioavailability of the macronutrients comprising the meal is
warranted.
Uses of liquid formulas as well as common meal combinations have been found to
potentiate a dietary thermic effect and lead to an overall increase in oxygen consumption and
metabolic rate (Welle, 1984; Tai, Castillo, & Pi-Sunyer, 1991). More specifically, high-protein
feedings have been found to potentiate a greater TEF in comparison to high-carbohydrate
feedings as well as lead to increased feeling of satiety (Robinson et al., 1990). To observe these
effects, Robinson et al. (1990) utilized a high-protein liquid formula containing 35g of protein,
15g of carbohydrate, and 6g of fat. Isocaloric meals of high-protein content or high-carbohydrate
content were administered hourly and thermic effect observed for nine hours; the nine-hour
measure indicated greater thermic response to high-protein feedings than high-carbohydrate
feedings (Robinson et al., 1990). Similarly, Welle (1984) used a liquid formula composed of 800
calories, 14% of which were protein, 31% fat, and 55% carbohydrate, mainly to observe
increases in metabolic rate, plasma insulin, glucose, and triglyceride concentrations with
intermittent exercise. Results of this study indicated mean resting metabolic rates increased 31%,
30-120 minutes after the meal compared to the resting metabolic rate. At three hours post-meal
consumption, resting metabolic rate was still 24% higher than the basal metabolic rate. The
maintained elevation of these values corresponded to the dietary thermogenesis potentiated by
the meal consumed (Welle, 1984). Evidence is thus provided indicating a thermic response and
overall energy expenditure to a meal composed of as little as 15% protein.
In comparison, common American meal combinations were used in a study conducted by
Johnston et al. (2002) examining the magnitude of thermic response to high protein diets among
21
a female population of normal weight, as indicated by BMI normative values. The high-protein
meal consisting of egg substitute, non-fat cheese, whole wheat bread, peanut butter, and 2% milk
and the high-carbohydrate diet consisting of soy milk, Total cereal, grapefruit, English muffin,
and butter. Likewise, Segal et al. (1984) utilized a test meal consisting of an eight ounce glass of
whole milk and two packages of General Mills chocolate Breakfast Squares (14% protein, 46%
carbohydrate, and 40% fat), as well as a graded exercise test, in non-obese and obese men.
Results from these feedings indicated ultimately, no significant thermic effect of food for either
the non-obese of obese group. Mikkelsen et al. (2000) utilized a pork meat protein and a soy
protein to examine a potentiated higher 24-hour TEE in healthy, overweight-to-moderately obese
men in comparison to a carbohydrate diet. Results from this study indicated that substitution of
carbohydrate with 17-18% of energy as either pork-meal or soy protein produced 3% higher 24-
hour energy expenditure. Two percent higher energy expenditure was found with consumption of
pork-meat in comparison to soy (Mikkelsen et al., 2000).
RMR Measure
The measure of resting metabolic rate (RMR) can be conducted in various ways.
Important factors to take into consideration when conducting RMR tests include: the timing of
meals, the fasting length, foods that should not be consumed within a certain time frame of
testing (e.g. caffeine and alcohol), and the emphasis of minimal to no activity prior to arrival for
metabolic testing. These findings have been found to alter RMR values; therefore, should be
controlled.
Actual RMR measurement procedures vary among studies. Kinabo and Durnin (1990)
measured RMR as a basal metabolic rate (BMR). In doing so, they defined BMR as being the
metabolic rate occurring prior to excessive movement following a fasting state; therefore, it is

22
similar to that of the RMR measure. Kinabo and Durnin obtained this measure within 30 minutes
of participant arrival to the testing facility via utilization of a fitted nose clip, mouth piece, and
breathing through a Rudolph low resistance valve. Participants rested in the supine position for
30 minutes and breathed through the mouth piece, with nose clip affixed to nose, for three
minutes to become accustomed to the breathing apparatus (Kinabo & Durnin, 1990). Following
this adaptation period, two 10-minute samples of expired air were collected in Douglas bags and
analyzed for oxygen (O2) consumption and carbon dioxide (CO2) expulsion (Kinabo & Durnin,
1990).
Similarly, Reed and Hill (1996) had participants arrive in the early morning hours after
an overnight fast and then measured their RMR. The methods and duration of measurement,
however, differed from that of Kinabo and Durnin in that Reed and Hill had participants lie
quietly for 45 minutes, after which their RMR was determined for 30 minutes with a ventilated
hood indirect calorimetry system (Swaminathan et al., 1985) instead of a Rudolph low resistance
valve. Participants were allotted 15 minutes to consume a meal consisting of 15% protein and
either a fixed amount (e.g. 4180 kJ and 40% energy from fat) or of an amount tailored to meet
25% of the usual intake of a participant, based on diet records; the overall purpose being to
determine the optimum time it takes to measure TEF (Reed & Hill, 1996). Significant differences
were found between baseline and hourly readings with variation becoming smaller as time
progressed. While analysis of these data strongly indicate continued TEF potentiation past six
hours, it is not to say that measurement of TEF less than six hours is entirely insufficient; it does
suggest, however, important effects could be either masked or misinterpreted if TEF is not
measured at least five hours (Reed & Hill, 1996).

23
CHAPTER THREE
METHOD
The purpose of this study was to determine the interaction between TEF and exercise on
TEE based on protein content of a meal in a moderately active, college-aged, female population
in an attempt to determine how to better potentiate total energy expenditure with diet and
exercise.
Participants
Twelve healthy female participants, college-aged, of normal weight range qualified for,
and completed, this study. The women were considered to be moderately active, defined as
burning no less than 500 kcal/wk and no more than 2,000 kcal/wk (Thompson, Gordon, &
Pescatello, 2010), who had not experienced a significant weight gain or loss (≥ 2 kg body
weight) in the last six months (Segal, Gutin, Nyman, & Pi-Sunyer, 1985) and had no history of
metabolic disorders, such as diabetes. Participants reported having a normal menstrual cycle and
were not taking other medications that would affect overall metabolic or physiological
functioning (e.g. thyroid medications, β-blockers, inhalants).
Study design
This study was an experimental, repeated measures design consisting of four different
testing days under various testing conditions.
Instrumentation
Participation was completely voluntary. Signing of informed consent provided clearance
and indicated participant understanding of study protocols as well as any potential for risk in
participating in the study (Appendix 1). The protocol was approved by the Institutional Review
Board at the University of Arkansas, Fayetteville (Appendix 2).

24
In addition to informed consent, a health history questionnaire was completed by all
subjects interested in participating in the study (Appendix 3). This questionnaire was designed to
act as a screening tool in the establishment of a sample population for the study. In completing
this questionnaire, potential participants in the study provided their age, background health
history, information regarding general diet and exercise regimens, as well as menstrual cycle
information pertinent to protocols of the study. Those participants who did not meet the criteria
for the study based on information provided via the health history questionnaire were notified.
Height and weight of each participant were measured using a Detecto Physician’s Scale
(Webb City, MO). Body composition was then be assessed via the calculation of body mass
index (BMI) (weight in kg/height in m2). After completion of all protocols, participants also had
a DEXA scan performed for further body composition analysis. Informed consent was obtained
by all (Appendix 4; Appendix 5). Feeding protocols took place in the Human Performance
Laboratory and contained complete food sources of varying macronutrient content (Table 1). In
preparing food for feeding protocols, a food scale was used to weigh all food items to ensure
correct serving sizes of each food source being served at the appropriate time. For initial VO2max
testing, as well as for all subsequent exercise protocol administration to take place throughout the
duration of the study, the Quinton Q-stress 4.0 electrocardiogram (ECG) software and treadmill
(Bothell, WA) were used in junction with the Parvo-Medics TrueMax 2400 metabolic
measurement system (Salt Lake City, UT). In addition to the use of the metabolic measurement
system during exercise protocols, this system was also used in the measurement of resting
metabolic rate (RMR). To account for changes in environmental conditions, equipment was used
in the Human Performance Lab Fitness Laboratory where environmental conditions could be
held more constant.

25
Table 1
High Protein Meal Composition
Macronutrient Protein
powder
(68 g)
Whole milk
(16 oz.)
Greek
yogurt
(225 g)
Reduced-
fat peanut
butter (18
g)
Total
(g)
Total
Calories
(kcal)
Total kcal
percentage
(%)
Fat 3.5g 16g 0g 16.5g 27g 243 30.19%
Carbohydrate 8g 22g 9g 7g 46g 184 22.86%
Protein 52g 16g 22.5g 4g 94.5g 378 46.96%
Low Protein Meal Composition
Macronutrient Oatmeal
(120g)
2% milk
(20 oz.)
Wheat
bread
(1 slice)
Reduced-
fat peanut
butter
(9 g)
Total
(g)
Total
Calories
(kcal)
Total kcal
percentage
(%)
Fat 7.5g 12.5g 1g 3.25g 24.25g 218.5 27.2%
Carbohydrate 81g 16.5g 13g 3.5g 114g 456 56.84%
Protein 15g 12g 3g 2g 32g 128 15.96%

26
Procedures
General testing procedures consisted of participants coming in a total of four times over
the course of a 4-week testing period. The first week of testing was used for baseline VO2max
measure. The participants then returned on three other occasions throughout the testing period
and were exposed to various feeding and exercise protocols designed to potentiate an increase in
overall energy expenditure (Figure 1). The baseline VO2max measure was completed before
participants advanced to the randomized tests involving a feeding and exercise protocol. Once an
initial VO2max was established, calculated percentages of this value were used in the
establishment of individualized aerobic intensities to be followed when participants returned for
additional testing. Each participant completed a moderate intensity aerobic exercise (60%
VO2max) protocol following consumption of a designated meal or in the fasted state, depending
upon which protocol was randomly assigned on that given test day.
The first time participants came into the laboratory, they completed the standard Bruce
Treadmill VO2max test (Table 2). Participants were asked to refrain from consuming any alcoholic
or caffeinated beverages 24 hours prior to the initial testing so an accurate VO2max could be
established (Thompson, Gordon, & Pescatello, 2010). Upon arrival to the laboratory, participants
completed an informed consent (Appendix 1). After completing this document, participants were
prepped for the VO2max test. Prepping the participants for the test first consisted of application of
10 electrodes for a 12-lead electrocardiogram (ECG) (V1-V6, an electrode above both the right
and left hips, and an electrode at both the right and left acromioclavicular space) lead attachment.
Before applying the electrodes, participants were wiped down by the technician with alcohol
pads at all locations in which electrodes were placed to ensure a clean surface for adherence and
optimal conduction. Once the participant was wiped down and the locations have dried, the

28
Figure 1. Experimental Design

29
Table 2
Standard Bruce Treadmill Protocol
Standard Bruce Treadmill Protocol (VO2max Test)
Time Period (min) Stage Speed (mph) Grade (%)
0:00-3:00 1 1.7 10
3:00-6:00 2 2.5 12
6:00-9:00 3 3.4 14
9:00-12:00 4 4.2 16
12:00-15:00 5 5 18
15:00-18:00 6 5.5 20
18:00-21:00 7 6 22

30
electrodes were placed at each designated location on the body (Figure 2). It is important to note
that given the participant population was female, V1 and V2 electrodes may have needed to be
placed closer to the second and third intercostals spaces just to the right and left of the sternal
border, respectively, instead of at the fourth intercostals space due to breast tissue. Should any of
the above electrode placements have fallen in a region of breast tissue, the electrode was placed
close to the point beneath or around the breast tissue (Thompson, Gordon, & Pescatello, 2010).
Once all electrodes had been placed, the participant stood on the treadmill and the trained
technician attached the ECG leads to their corresponding electrode. Once the leads were adhered
to the electrodes, the technician ensured adequate and accurate conductivity was taking place at
all electrodes by selecting the electrode conductivity icon within the Quinton Q-stress software.
When all leads registered as ‘good’, indicated by a green light on the computer screen at each
electrode placement, the participant was ready to have the headpiece attached to their head, the
mouthpiece placed in their mouth with the nose clip nearby, and the VO2 hose attached to the
mouthpiece so the test could begin.
For VO2max testing, the standard Bruce Treadmill Protocol was used and conducted using
the Quinton treadmill and ECG software (Bothell, WA). This protocol was pre-programmed into
the software being used by investigators so that the speed or incline of the treadmill would not
need to be manually adjusted as the test progressed through the stages. Since this test was
designed to be a maximal test, blood pressure (BP) and heart rate (HR) were monitored during
the entire test via the ECG as well as by a trained technician (Appendix 6). Prior to the start of
the test, a resting BP and HR were taken by a trained technician. For each stage the participant
was walking, subsequent BP measures were taken. Cessation of the test occurred if there were

31
Figure 2. Electrode Placement

32
abnormal tendencies on the ECG and/or if the participant indicated they had reached their
maximal physical exertion as indicated with a hand gesture.
Participants were exposed to various feeding protocols throughout the duration of the 4-
week testing period in addition to an exercise protocol (Figure 1). The meals in which they
received were administered after a 12-hour fast (Thompson, Gordon, & Pescatello, 2010; Miller,
Mumford, & Stock, 1967) in which no food, beverage, alcohol, or caffeine was consumed as this
could have an effect on RMR as well as overall energy expenditure measures (Segal et al., 1984;
Tai et al., 1991; Westerterp, 2004). Upon each arrival to the Human Performance Laboratory on
a day in which a feeding protocol was administered, participants first had their RMR measured.
To complete the RMR measure, participants rested in a seated position for 15 minutes. At the
15-minute mark, the participant was fitted with a mouthpiece attached to a VO2 tube that was
also attached to the metabolic cart. The participant put the mouthpiece in their mouth, nose clip
on their nose, and was instructed to take slow and controlled normal breaths for a 5-minute
period. This allowed for the participant to breathe through the mouthpiece and into the tube in an
attempt to create a more naturally adapted breathing technique. At the 20-minute mark, the
investigator started the RMR test using the software on the metabolic cart. Participants remained
seated in the resting position and continued to breathe normally, through their mouth only, into
the tube for 15 minutes so an RMR could be estimated.
Following the RMR measure, participants were disconnected from the metabolic cart
and given either a high protein meal (45% total calories of meal), a low protein meal (15% total
calories of meal), or no food at all. For the trials in which participants received a feeding
protocol, they consumed the randomly assigned meal over the course of approximately 15
minutes. Following meal consumption, participants again assumed the resting seated position

33
and performed very minimal activity (e.g. reading, going to the restroom, listening to music) for
one hour to allow for digestion and a potential rise in energy expenditure. Subsequent metabolic
measures were taken throughout the duration of this 60-minute period; a five minute measure at
the 5-10 minute mark, a five minute measure at the 25-30 minute mark, a five minute measure at
the 40-45 minute mark. Preceding each of these measures, a 5-minute adapted breathing period
was conducted. This allowed for the participants to breathe through the mouthpiece and into the
tube in an attempt to create a more naturally adapted breathing technique. These postprandial
measures were taken to capture potential metabolic increases in energy expenditure following the
meal. Following the 60-minute rest period, another 15-minute RMR measure was conducted
using the same procedures as before. This measurement was conducted to examine the potential
increase in energy expenditure following exercise. After completion of this resting metabolic
measure, participants then completed a 40-minute exercise protocol which included a 5-minute
warm-up and 5-minute cool down period at 50% VO2max and a 30-minute exercise bout at 60%
VO2max. Participants performed the warm-up and exercise bout with the mouthpiece in their
mouth and nose clip on their nose in order for continuous metabolic measures to be taken
throughout the entire exercise bout. The mouthpiece and nose clip were not worn for the cool
down period. Following completion of the exercise protocol, a final 15 minute metabolic
measure was conducted so that changes in total energy expenditure could be observed. For
complete protocol layout, see Figure 1.
For the trials in which the participants did not receive a feeding protocol, the 15-minute
meal consumption period and 60-minute resting period were still undergone as if a meal had
been administered. Participants then proceeded to complete an exercise bout. Following the

34
exercise protocol, a 15-minute metabolic measure was again taken so that changes in total energy
expenditure could be observed.
Meal contents varied depending on the feeding protocol in which the participant was
randomly assigned on any given testing day. The high protein feeding consisted of consuming a
shake composed of whole milk, whey protein powder, and Greek yogurt (Table 1). The low
protein feeding consisted of oatmeal made with whole milk (Table 1). Each of these feedings
contained approximately 800 calories and was prepared on site in the Fitness Laboratory. For the
testing days in which individuals performed the exercise protocol in the fasted state, bagels and
fruit were provided for consumption post-testing.
Variables
The independent variables in this study included: (1) a feeding protocol and (2) an
exercise protocol. Within the feeding protocol variable, three levels were examined: (a) high
protein feeding consisting of 45% total kcal from protein, (b) low protein feeding consisting of
15% total kcal from protein, and (c) a fasted state in which no feeding protocol was
administered. Within the exercise protocol, one level was examined: (a) moderate intensity
aerobic exercise (60% VO2max). The dependent variable examined in this study was the change in
energy expenditure between different feeding protocols and exercise.
Data analysis
Data were analyzed using SPSS statistical analysis software (IBM SPSS Statistics,
Version 19). Repeated measures ANOVA analyses were conducted with significance indicated
by an alpha value equal to .05 (α = .05). A Bonferroni post-hoc test was used where significance
was indicated. Type I error rate was controlled for by adapting the significance level to an alpha
value equal to .0167 (α = .0167). In doing so, all three pairwise comparisons were taken into

35
account. Boxplot analyses were used to eliminate outliers. Descriptive measures were reported as
means within a specified amount of standard deviation (mean ± SD). Cohen’s d was calculated to
indicate the effect size, or measure difference, between variable comparisons.

36
CHAPTER FOUR
RESULTS
Purpose
The purpose of this study was to determine the interaction between TEF and moderate-
intensity exercise on TEE in moderately active females based on protein content of a meal.
Descriptives
Twelve participants of various activity levels participated in the study with demographic
data reported in Table 3 for the ten participants used in data analysis. Participant recruitment was
conducted by posting flyers with information regarding the study, speaking to undergraduate and
graduate kinesiology and nutrition classes, and hanging flyers at local establishments. A total of
45 individuals responded with interest in participating in the study; however only 16 individuals
qualified to participate. All interested participants reported to the testing facility to complete a
health history questionnaire (Appendix 3) and have height and weight measured. Based on
answers to the health history questionnaire, potential participants were contacted via e-mail
regarding whether or not they qualified for the study. Elimination criteria included such items as
BMI not within normal range, inadequate activity status, lactose intolerance, recent history of an
eating disorder, and/or any food allergies. Individuals that did not qualify were thanked for their
interest. Individuals who qualified for the study were notified and given further information
regarding VO2max testing as well as more detailed instructions about the following three
protocols.
Of the 16 eligible participants, a total of 10 participants were used in data analysis. A
variety of reasons led to the decrease in participant data used for analysis. One participant
withdrew prior to conduction of the VO2max test, three participants withdrew due to schedule
37
conflicts, and data for two participants were not used following completion of all testing due to
being statistical outliers or not working at close to their estimated 60% VO2max based on
calculations.
Hypothesis One
The first hypothesis proposed that meals with high protein content would create a greater
TEF than low protein meals. Repeated measures ANOVA was used to examine TEF potentiation
between the three feeding protocols (high protein, low protein, and fasted) (Table 4). There was a
significant time effect for the feeding protocols (F [2,18] = 115.067, p = .000). Post-hoc analysis
was conducted where significance was found using paired samples t-tests. Bonferroni alpha level
adjustments were conducted based on the number of comparisons made to minimize the
likelihood of a type I error; this resulted in an alpha equal to .0167 (α = .0167). The thermic
effect of food was 30.39% greater with the high protein meal compared to the low protein meal
(p = .006), 98.15% greater with the high protein meal compared to the fasted state (p = .000), and
94.34% greater with the low protein meal compared to the fasted state (p = .000) (Table 5).
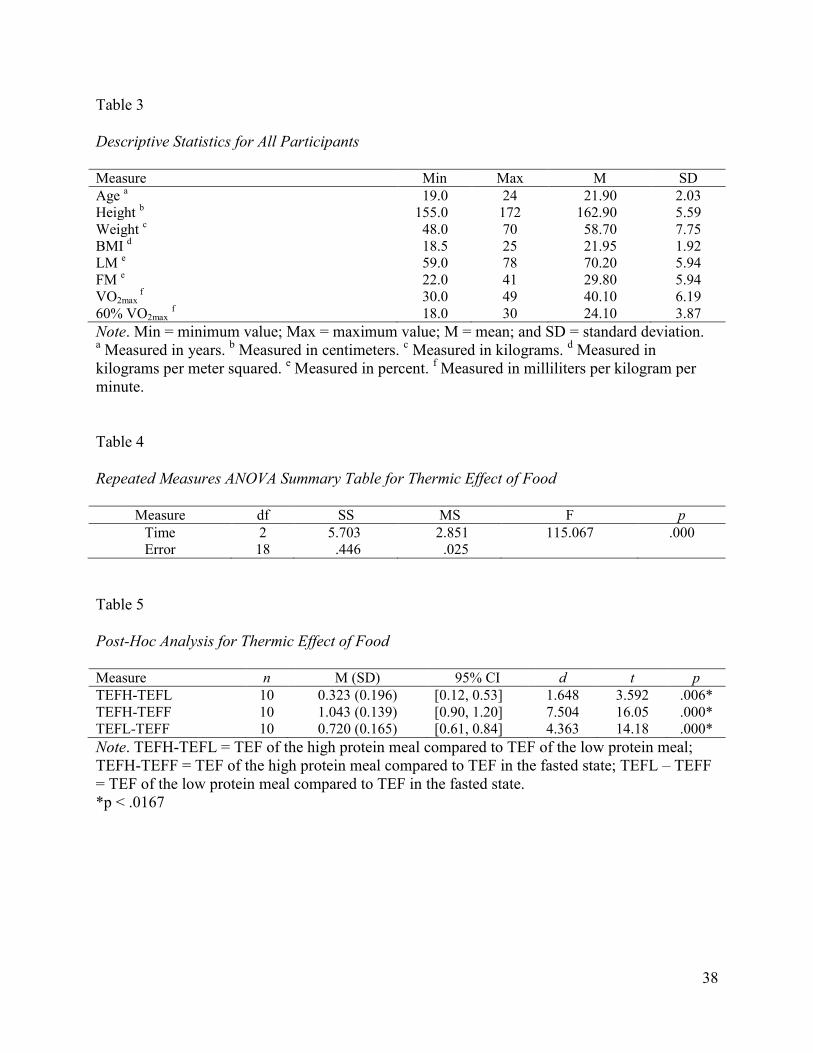
38
Table 3
Descriptive Statistics for All Participants
Measure Min Max M SD
Age a 19.0 24 21.90 2.03
Height b 155.0 172 162.90 5.59
Weight c 48.0 70 58.70 7.75
BMI d 18.5 25 21.95 1.92
LM e 59.0 78 70.20 5.94
FM e 22.0 41 29.80 5.94
VO2max f 30.0 49 40.10 6.19
60% VO2max f 18.0 30 24.10 3.87
Note. Min = minimum value; Max = maximum value; M = mean; and SD = standard deviation. a Measured in years.
b Measured in centimeters.
c Measured in kilograms.
d Measured in
kilograms per meter squared. e Measured in percent.
f Measured in milliliters per kilogram per
minute.
Table 4
Repeated Measures ANOVA Summary Table for Thermic Effect of Food
Measure df SS MS F p
Time 2 5.703 2.851 115.067 .000
Error 18 .446 .025
Table 5
Post-Hoc Analysis for Thermic Effect of Food
Measure n M (SD) 95% CI d t p
TEFH-TEFL 10 0.323 (0.196) [0.12, 0.53] 1.648 3.592 .006*
TEFH-TEFF 10 1.043 (0.139) [0.90, 1.20] 7.504 16.05 .000*
TEFL-TEFF 10 0.720 (0.165) [0.61, 0.84] 4.363 14.18 .000*
Note. TEFH-TEFL = TEF of the high protein meal compared to TEF of the low protein meal;
TEFH-TEFF = TEF of the high protein meal compared to TEF in the fasted state; TEFL – TEFF
= TEF of the low protein meal compared to TEF in the fasted state.
*p < .0167

39
Hypotheses two and three
The second hypothesis proposed that meals with high protein content would create
greater TEF with moderate intensity aerobic exercise as compared to meals with low protein
content and fasted. The third hypothesis proposed that meals with low protein content would
create a greater TEF with moderate intensity aerobic exercise when compared to fasting.
Repeated measures ANOVA was used to examine the potential for greater TEF potentiation in a
high protein meal combined with exercise as compared to a meal with low protein meal and the
fasted state with exercise (Table 6). Within subjects significance was found (F [2,18] = 6.039, p
= .010) and post-hoc analysis was conducted where significance was indicated using paired
samples t-tests. The thermic effect of food with a high protein meal and exercise was
significantly greater compared to the fasted state (p = .010) but was not significantly greater
compared to the low protein meal with exercise (p = .122). Additionally, the low protein meal
combined with exercise did not potentiate a significantly greater thermic effect compared to the
fasted state with exercise (p = .094).
Cohen’s d was calculated for measures in which no significance was found to interpret
the overall importance of the results. A small effect size was calculated for the interaction
between a high protein feeding with exercise as compared to a low protein meal with exercise
(d = 0.243) indicating a small interactive effect between the two testing protocols. Small effect
sizes for the high protein meal with exercise compared to the low protein meal with exercise (d =
0.087) and for the low protein meal with exercise compared to the fasted state with exercise (d =
0.149) indicating no real meaningful interactive effect among the testing protocols (Table 7).

40
Table 6
Repeated Measures ANOVA Summary Table for Thermic Effect of Food with Exercise
Measure df SS MS F p
Time 2 7.524 3.762 6.039 .010
Error 18 11.214 .623
Table 7
Post-Hoc Analysis for Thermic Effect of Food with Exercise
Measure n M (SD) 95% CI d t p
TEFHe-TEFLe 10 0.458 (5.264) [-0.15, 1.10] 0.087 1.709 .122
TEFHe-TEFFe 10 1.215 (4.993) [0.37, 2.10] 0.243 3.266 .010*
TEFLe-TEFFe 10 0.756 (5.061) [-0.16, 1.70] 0.149 1.870 .094
Note. TEFHe-TEFLe = TEF of the high protein meal with exercise compared to TEF of the low
protein meal with exercise; TEFHe-TEFFe = TEF of the high protein meal with exercise
compared to TEF in the fasted state with exercise; TEFLe – TEFFe = TEF of the low protein
meal with exercise compared to TEF in the fasted state with exercise.
*p < .0167

41
Hypothesis four
The fourth hypothesis proposed that moderate intensity aerobic exercise performed in the
fed state will create greater TEE when compared to moderate intensity aerobic exercise
performed in the fasted state. Repeated measures ANOVA was used to examine energy
expenditure among the high protein feeding during exercise and the low protein feeding with
exercise in comparison to the fasted state with exercise (Table 6). Within subjects significance
was found (F [2,18] = 6.039, p = .010) and post-hoc analysis was conducted where significance
was indicated using paired samples t-tests. Energy expenditure with the high protein meal
combined with exercise was significantly greater than energy expenditure in the fasted state with
exercise (p = .010). No significance in energy expenditure was found with the low protein
feeding with exercise compared to the fasted state with exercise (p = .094) (Table 7).
Summary
Results of all analyses indicate a relationship between protein content of a meal,
moderate-intensity exercise, thermic effect of food, and energy expenditure. In support for the
first hypothesis, the thermic effect of food after consumption of a high protein meal was
significantly greater than after consumption of a low protein meal. In comparing the thermic
effect of food and exercise under high protein meal consumption conditions, as stated by the
second hypothesis, it was found that a greater thermic effect of food occurred in comparison to
the fasted condition with exercise than with the low protein meal and exercise. The third
hypothesis was not supported by the findings of the study due to the thermic effect of food not
being significantly greater in under low protein feeding and exercise conditions as compared to
the fasted state with moderate-intensity exercise. Finally, total energy expenditure under high
protein meal consumption and exercise was not significantly greater than the total energy

42
expenditure during fasted conditions and exercise nor was significance found in total energy
expenditure with low protein meal consumption and exercise compared with the fasted state and
exercise.

43
CHAPTER FIVE
DISCUSSION
The findings of this study are indicative of a relationship between protein content of a
meal, thermic effect of food, and energy expenditure with moderate-intensity exercise.
Consumption of a high protein meal (45%) was shown to potentiate a greater thermic effect and
overall energy expenditure in comparison to consumption of a low protein meal (15%). In
comparison to the fasted state, both fed states were shown to potentiate a greater thermic effect
thus indicating energy expenditure is greater in the fed state than the fasted state, regardless of
macronutrient composition. With relation to exercise and energy expenditure, significance was
only found when comparing high protein meal consumption and exercise to the fasted state with
exercise. Although not significant, trends for increased thermic effect with exercise were present
for exercise performed after consumption of a low protein meal compared to the high protein
meal as well as the fasted state.
To maintain consistency in protocol duration throughout the entire course of the study, all
protocols were expected to take 3.5 hours to complete in both the fed and fasted states. Variation
in testing session completion time occurred when participants were unable to complete the meal
in the allotted 15-minute period. Many participants were unable to consume either one or both of
the meals in the allotted time; all ten participants took considerably longer to consume the low
protein meal whereas only three participants took longer to consume the high protein meal. Meal
palatability as well as the necessary serving size to be consumed contributed to these variances.
It has been shown that meals containing between 200 and 1,000 kcal gave an average
increase of about 10% over the basal metabolic rate for 6 hours, with a peak value of 25% at 1
hour after beginning of the meal (Segal & Pi-Sunyer, 1986). In the present study, thermic effect

44
of food calculation consisted of subtracting the resting metabolic measure from the final
metabolic measure one hour following meal consumption. Based on these calculations, a 30%
increase in energy expenditure was found under high protein conditions, 20% under low protein
conditions, and approximately 0.05% under fasted conditions. For those individuals who took
longer to consume either meal, it is possible that a small window for measurement of metabolic
changes was missed due to the gap between completion of the meal and the time allotted for
metabolic measurement; four metabolic measures were taken within one hour following
completion of the meal. Although not definitive, it is possible that peak thermic effect of food
measures were not captured when participants took upwards of one hour to consume the meals in
their entirety. Additionally, no participant was able to complete each meal in the exact amount of
time as the other which could mean slight variance in the dietary thermogenic window.
A few issues arose throughout the data collection process that may have contributed to
these findings, some of which include the ability for participants to fully consume the meals and
the ability to finish the meals in the allotted time frame. Of the participant data used in the
analyses, only one participant was unable to complete the low protein meal in its entirety and
many were unable to complete both meals in the same amount of time. For the participant that
could not complete the entire low protein meal, only a small amount of the low protein meal was
not consumed. Although a factor to take into consideration in data analysis, none of the
participant’s metabolic measure results were significantly altered by the amount of time it took to
consume either meal. Timing of the meal began with the first bite and ended with the swallowing
of the last bite. All protocol times following meal consumption were adapted accordingly to
allow for the same time amount between measures.

45
When examining the exercise component alone with relation to an increase in energy
expenditure, no significance was found. When comparing the high protein meal with the low
protein meal, in combination with exercise, an insignificant 1.23% difference in energy
expenditure was found (p = .595). Similar results were found when comparing the high protein
meal with the fasted state. The increase in energy expenditure above the TEF value during the
exercise bout was 1.47% (p = .455). Finally, when comparing the low protein meal with the
fasted state, during exercise, an insignificant 0.25% difference was found (p = .888).
Conclusively, these results indicate that although an additional increase in energy expenditure
was exhibited with the addition of exercise, the increase was not statistically significant.
Although not a primary focus of this study, another influence on substrate utilization to
take into consideration is body composition. It is known that a greater amount of lean mass often
leads to greater energy expenditure (Segal & Pi-Sunyer, 1986). Participants in this study varied
in lean and fat mass; however, all fell within normal parameters based on BMI calculation.
To better accommodate the variation in activity levels of all participants, a graded
walking protocol was used for the exercise bout. The grade of incline was held constant for each
individual and speed modifications made to match that of each participant’s calculated 60%
VO2max. Although this was a way in which to accommodate for the variation in exercise
capacities among the population, future research should be done examining various modes of
exercise and any impact that mode variation could have on energy expenditure when combined
with a high or low protein feeding.
A proposed limitation of this study was the lack of control for the menstrual cycle phase
or contraceptive use throughout the duration of the protocol. It is known that hormone
fluctuations throughout the menstrual cycle may influence metabolism and aerobic capacity in
46
females (Segal & Pi-Sunyer, 1986). However, this study was not designed to examine metabolic
changes with hormonal variation so not controlling for the menstrual cycle or contraceptive use
was not of concern. Furthermore, the exercise bout was not long enough in duration to
significantly impact overall results with regards to hormone fluctuations and exercise on
substrate metabolism. Further research should examine the influence of hormone fluctuations
and substrate utilization at rest and during exercise given various phases of the cycle and/or
contraceptive use.
Conclusions
In support of the proposed hypotheses, an acute high protein meal did exhibit greater
thermic effect potentiation when compared to the fasted state and low protein meal. This is
thought to have occurred due to the inability for protein to be catabolized and used as an
immediate fuel source. In addition, a meal with high protein content in combination with
moderate-intensity exercise was found to potentiate significantly greater energy expenditure in
comparison to the fasted state.
Contrary to the proposed hypotheses, moderate-intensity exercise was not found to have a
significant impact on total energy expenditure or further potentiation of thermic effect of food.
While it has been reported that significant increases in energy expenditure can be found with an
acute feeding accompanied with an exercise bout (Segal & Pi-Sunyer, 1986), the parameters of
this study did not entirely support these findings. Consumption of a high protein meal combined
with exercise as compared to a low protein meal combined with exercise was not found to
potentiate greater energy expenditure. Additionally, no significant increase in energy expenditure
was found when comparing a low protein meal combined with exercise to exercise performed in
the fasted state. Post-hoc analyses for the interactive effect between exercise and TEF

47
An important finding of this study was the increased energy expenditure combined with
exercise following meal consumption. Although the feedings were acute in nature and the
exercise only lasted 30 minutes in duration, energy expenditure was found to be greater. In
addition, it was found that an increase in energy expenditure can be potentiated with the
consumption of a higher protein meal in comparison to a lower protein meal. Given this
understanding, important implications can be made for weight loss when taking into
consideration an implementation of a diet and exercise regimen. Further understanding of
interactions between these components may be beneficial in determining how to better potentiate
total energy expenditure among varying populations.
Variation in workout time and exercise intensity could be contributing factors to the lack
of significance presented with exercise implementation in addition to increased dietary
thermogenesis. Performing exercise at a high-intensity has been shown to result in increased
energy expenditure. Therefore, the intensity in which exercise is performed as well as the
duration of the exercise bout should be further examined. For the purposes of this study, only
moderate-intensity exercise was examined. Examining high-intensity exercise in comparison to
moderate-intensity exercise may provide further insight to the extent in energy expenditure is
increased when combined with the increased dietary thermogenesis potentiated when consuming
high protein meals. Additionally, duration of exercise should also be further examined. This
study simply examined the energy expended throughout a 30-minute exercise bout; caloric
expenditure during the warm-up and cool down were not taken into consideration. Implementing
an exercise bout that lasts longer in duration may indicate even greater changes in energy
expenditure.

48
Given the specificity of the study, results may not be applicable to the general population.
More specifically, results may not be an accurate representation in the male population, in the
athletic or highly active population, in sedentary individuals, in individuals with metabolic
disorder(s), or in individuals who have experienced significant weight loss (> 2 kg) in the past 6
months (Segal, Gutin, Nyman, & Pi-Sunyer, 1985). While this list is not all inclusive, it provides
for an idea of those in which the results of this study may not be generalizeable.
Future research should look to examine the thermic effect of food on overall energy
expenditure across various population samples as well as in a chronic versus acute conditions.
Implementation of a high protein diet over a longer period of time may indicate a time frame in
which metabolic homeostasis arises and thermic effect of food becomes less influential on
energy expenditure, or vice versa. In addition, examination of potential variation in thermic
effect and energy expenditure in meals containing varying protein forms (e.g. complete proteins
versus supplemental protein) is also a topic of further interest.
Although lengthy in protocol design, the study encompassed and accounted for all details
related to the study. Due to limitations of equipment time and lack of transportation for the
participants, resting metabolic measures could have been more accurate had they been taken
immediately upon waking and/or if the subjects had been breathing in a ventilated hood instead
of with the mouthpiece and nose clip setup. In addition, food and activity records were not kept
for any of the participants throughout the duration of this study. Information was inquired in
relation to these two items upon arrival to the testing facility; however, specific details were not.
Although given specific instructions to follow the day prior to coming in for testing, it is
unknown as to how well the participants followed these guidelines. Should this study again be
repeated, examination of food consumption the day prior to coming in for testing would be
49
helpful. In addition, exercise logs for a few days preceding the testing session should also be kept
and used for analysis.
Finally, for the purposes of this study, thermic effect of food with exercise was examined
based on VO2 measures. While VO2 has been shown to be a more sensitive measure in relation to
energy expenditure, additional measures, such as urine nitrogen levels should also be reported
and further examined to gain a better all-encompasing idea of protein content of a meal and the
energy required to decompose this macronutrient.

50
References
Belko, A.Z., Barbieri, T.F., & Wong, E.C. (1986). Effect of energy and protein intake and
exercise intensity on the thermic effect of food. American Journal of Clinical Nutrition,
43, 863-869.
Bray, G.A., Whipp, B.J., & Koyal, S.N. (1974). The acute effects of food intake on energy
expenditure during cycle ergometry. American Journal of Clinical Nutrition, 27, 254-
259.
Buchholz, A.C. and Schoeller, D.A. (2004). Is a calorie a calorie?. American Journal of Clinical
Nutrition, 79(suppl), 899S-906S.
Centers for Disease Control and Prevention. (2011). Nutrition for Everyone. Atlanta: Centers for
Disease Control and Prevention; 2011.
Halton, T.L., & Hu, F.B. (2004). The effects of high protein diets on thermogenesis, satiety and
weight loss: a critical review. Journal of the American College of Nutrition, 23(5), 373-
385.
Hill, J.O., Peters, J.C., Reed, G.W., Schlundt, D.G., Sharp, T., & Greene, H.L. (1991). Nutrient
balance in humans: effects of diet composition. American Journal of Clinical Nutrition,
54, 10-17.
Johnston, C.S., Day, C.S., & Swan, P.D. (2002). Postprandial thermogenesis is increased 100%
on a high-protein, low-fat diet versus a high-carbohydrate, low-fat diet in healthy, young
women. Journal of the American College of Nutrition, 21(1), 55-61.
Jones, P.P., Van Pelt, R.E., Johnson, D.G., & Seals, D.R. (2004). Role of sympathetic neural
activation in age- and habitual exercise-related differences in the thermic effect of food.
The Journal of Clinical Endocrinology & Metabolism, 89(10), 5138-5144.
Karst, H., Steiniger, J., Noack, R, & Steglich, H.D. (1984). Diet-induced thermogenesis in man:
Thermic effects of single proteins, carbohydrates and fats depending on their energy
amount. Annual of Nutrition and Metabolism, 28, 245-252.
Kaplan, M.L. and Leveille, G.A. (1976). Calorigenic response in obese and nonobese women.
American Journal of Clinical Nutrition, 29, 1108-1113.
Kinabo, J.L., & Durnin, J.V. (1990). Thermic effect of food in man: effect of meal composition,
and energy content. British Journal of Nutrition, 64, 37-44.
LeBlanc, J., Mercier, P., & Samson, P. (1984). Diet-induced thermogenesis with relation to
training state in female subjects. Canadian Journal of Physiology and Pharmacology,
62(3), 334-337.
51
Leibel, R.L., Rosenbaum, M., & Hirsch, J. (1995). Changes in energy expenditure resulting from
altered body weight. New England Journal of Medicine, 332(10), 621-628.
Melanson, E.L., Sharp, T.A., Seagle, H.M., Horton, T.J., Donahoo, W.T., Grunwald, G.K.,
…&Hill, J.O. (2002). Effect of exercise intensity on 24-h energy expenditure and nutrient
oxidation. Journal of Applied Physiology, 92, 1045-1052.
Miller, D.S., Mumford, P., & Stock, M.J. (1967). Thermogenesis in overeating man. American
Journal of Clinical Nutrition, 20(11), 1223-1229.
Mikkelsen, P.B., Toubro S., & Astrup, A. (2000). Effect of fat-reduced diets on 24-h energy
expenditure: comparisons between animal protein, vegetable protein, and carbohydrate.
American Journal of Clinical Nutrition, 72, 1135-1141.
Paddon-Jones, D., Westman, E., Mates, R.D., Wolfe, R.R., Astrup, A., & Westerterp-Plantenga,
M. (2008). Protein, weight management, and satiety. American Journal of Clinical
Nutrition, 87(suppl), 1558S-1561S.
Pittet, P.H., Gygax, P.H., Jéquier, E. (1974). Thermic effect of glucose and amino acids in man
studied by direct and indirect calorimetry. British Journal of Nutrition, 31, 343-349.
Reed, G.W., & Hill, J.O. (1996). Measuring the thermic effect of food. American Journal of
Clinical Nutrition, 63, 164-169.
Richard, D. and Rivest, S. (1989). The role of exercise in thermogenesis and energy balance.
Canadian Journal of Physiology and Pharmacology, 67, 402-409.
Robinson, S.M., Jaccard, C., Persaud, C., Jackson, A.A., Jequier, E., Schutz, Y. (1990). Protein
turnover and thermogenesis in response to high-protein and high-carbohydrate feeding in
men. American Journal of Clinical Nutrition, 52, 72-80.
Scott. C.B. (2005). Contribution of anaerobic energy expenditure to whole body thermogenesis.
Nutrition & Metabolism, 2 (14), 1-9. doi: 10.1186/1743-7075-2-14
Scott, C.B., Fernandes, J., & Lehman, M. (2007). Onset of thermic effect of feeding (TEF): A
randomized cross-over trial. Journal of the International Society of Sports Nutrition,
4(24), 1-5. doi: 10.1186/1550-2783-4-24.
Schutz, Y., Bessard, T., & Jéquier, E. (1987). Exercise and postprandial thermogenesis in obese
women before and after weight loss. American Journal of Clinical Nutrition, 45, 1424-
1432.
Segal, K.R., Gutin, B., Nyman, A.M., & Pi-Sunyer, F.X. (1985). Thermic effect of food at rest,
during exercise, and after exercise in lean and obese men of similar body weight. Journal
of Clinical Investigation, 76, 1107-1112. doi: 0021-9738/85/09/1107/06
52
Segal, K.R., Presta, E., & Gutin, B. (1984). Thermic effect of food during graded exercise in
normal weight an obese men. American Journal of Clinical Nutrition, 40, 995-1000.
Segal, K.R., & Pi-Sunyer, F.X. (1986). Exercise, resting metabolic rate, and thermogenesis.
Diabetes/Metabolism Reviews, 2(1&2), 19-34.
Stob, N.R., Bell, C., van Baak, M.A., & Seals, D.R. (2007). Thermic effect of food and β-
adrenergic thermogenic responsiveness in habitually exercising and sedentary healthy
adult humans. Journal of Applied Physiology, 103, 616-622.
Swaminathan, R., King, R.F., Holmfield, J., Siwek, R.A., Baker, M., & Wales, J.K. (1985).
Thermic effect of feeding carbohydrate, fat, protein and mixed meal in lean and obese
subjects. American Journal of Clinical Nutrition, 42, 177-181.
Tai, M.M., Castillo, P., & Pi-Sunyer, F.X. (1991). Meal size and frequency: effect on the thermic
effect of food. American Journal of Clinical Nutrition, 54, 783-787.
Thompson, W.R. (2010). ACSM’s guidelines for exercise testing and prescription (8th
ed.).
Philadelphia, PA: Lippincott Williams & Wilkins.
Warburton, D.E.R, Nicol, C.W., & Bredin, S.S.D. (2006). Health benefits of physical activity:
the evidence. Canadian Medical Association Journal, 174(6), 801-809.
Welle, S. (1984). Metabolic responses to a meal during rest and low-intensity exercise. The
American Journal of Clinical Nutrition, 40, 990-994.
Westerterp, K.R. (2004). Diet induced thermogenesis. Nutrition & Metabolism, 1, 1-5. doi:
10.1186/1743-7075-1-5
Westerterp, K.R., Wilson, S.A.J., & Rolland, V. (1999). Diet induced thermogenesis measured
over 24h in a respiration chamber: effect of diet composition. International Journal of
Obesity, 23, 287-292.
Widdowson, E.M. (1955). Assessment of the energy value of human foods. Medical Research
Council Department of Experimental Medicine, 14, 142-153.

53
APPENDICES

54
Appendix 1: Informed Consent
INFORMED CONSENT
Title: The interaction between the thermic effect of food and varying exercise intensities on total energy
expenditure in moderately active females:
Investigators:
Description: This study is designed to measure total energy expenditure with diet and exercise
modifications to better understand the interactions between the thermic effect of food (number of calories
expended after a meal) and exercise. This study consists of a total of four testing sessions. Exercise
intensities for these testing sessions will be based on your individual results from maximal oxygen
consumption (VO2max) testing. Height and weight will be measured, and BMI calculated, in a private
setting. Next, you will complete the first testing session. This will consist of coming into the fitness
laboratory in a fasted state (no food for at least 12 hours) and having your resting metabolic rate (RMR)
measured for analysis of caloric expenditure in the rested state. You will then be permitted to leave the
fitness laboratory to eat and will either return later in the day, or on a different day, to complete a VO2max
treadmill test. The remaining three trials will vary in protocol, will be feeding and exercise dependent,
and will occur one week apart from one another. For all trials, you will arrive in a fasted state for RMR
measurement. The three feeding and exercise protocols are as follows: consumption of a high protein
meal (45% total calories) followed by a one hour resting period, a metabolic rate measurement, a 40
minute moderate intensity treadmill protocol, and a final metabolic rate measurement; consumption of a
low protein meal (15% total calories) followed by a one hour resting period, a 40 minute moderate
intensity treadmill protocol, and a final metabolic rate measurement; arrival in a fasted state, RMR
measurement, rest period with metabolic measurement, completion of a 40 minute moderate intensity
treadmill protocol, and a final metabolic rate measurement. All aerobic treadmill exercise (moderate
intensity) will be determined on an individual basis and used accordingly. For trials in which you arrive
and exercise in a fasted state, food will be provided for after. Please see attached for complete description
of procedures.
Risks and Benefits: Although small, there are a few risks associated with these tests. There exists the
possibility of certain changes occurring during the fitness assessments. They include, but are not limited
to, muscle or joint injury, fainting, disorders of the heart beat, and in rare instances heart attack, stroke, or
even death. Every effort will be made to minimize these risks through careful pre-screening and close
observation during the tests. Trained personnel will be available during testing at all times in the event an
unforeseen instance may arise. The results obtained will help identify if certain feeding protocols
combined with certain exercise intensities potentiate greater total energy expenditure.
Voluntary Participation: Participation in the testing protocol is voluntary. You are free to deny or
withdraw from testing at any time if you so desire.
Ashley Binns Ro Windwalker Human Performance Laboratory Research & Sponsored Programs College of Education and Health Professions Compliance Coordinator Dept. of Health, Human Performance, and Recreation University of Arkansas 155 Stadium Drive - HPER 321 120 Ozark Hall 479-575-6762 Fayetteville, AR 72701 [email protected] 479-575-2208 [email protected]

55
Confidentiality: You will be assigned a code number and this will be the only information used for
tracking purposes. Your testing information will be accessed only by persons directly involved in the
testing and will be stored in a locking filing cabinet. All information will be kept confidential to the
extent allowed by law and University policy.
Right to Withdraw: You are free to refuse to participate in the study and to withdraw at any time. Your
decision to withdraw will bring no penalty to you.
Informed Consent: I, ____________________________________________, have read the description of
this project, including the purpose of the project, the procedures to be used, the potential risks and side
effects, the confidentiality, as well as the option to withdraw at any time. The investigator has explained
each of these items to me. The investigator has answered all of my questions regarding the project, and I
understand what is involved. My signature below indicates that I freely agree to participate in this project
and that I have received a copy of this agreement if desired from the investigator.
Participant:_____________________________________________________
Date:___________________
Witness:_______________________________________________________
Date:___________________
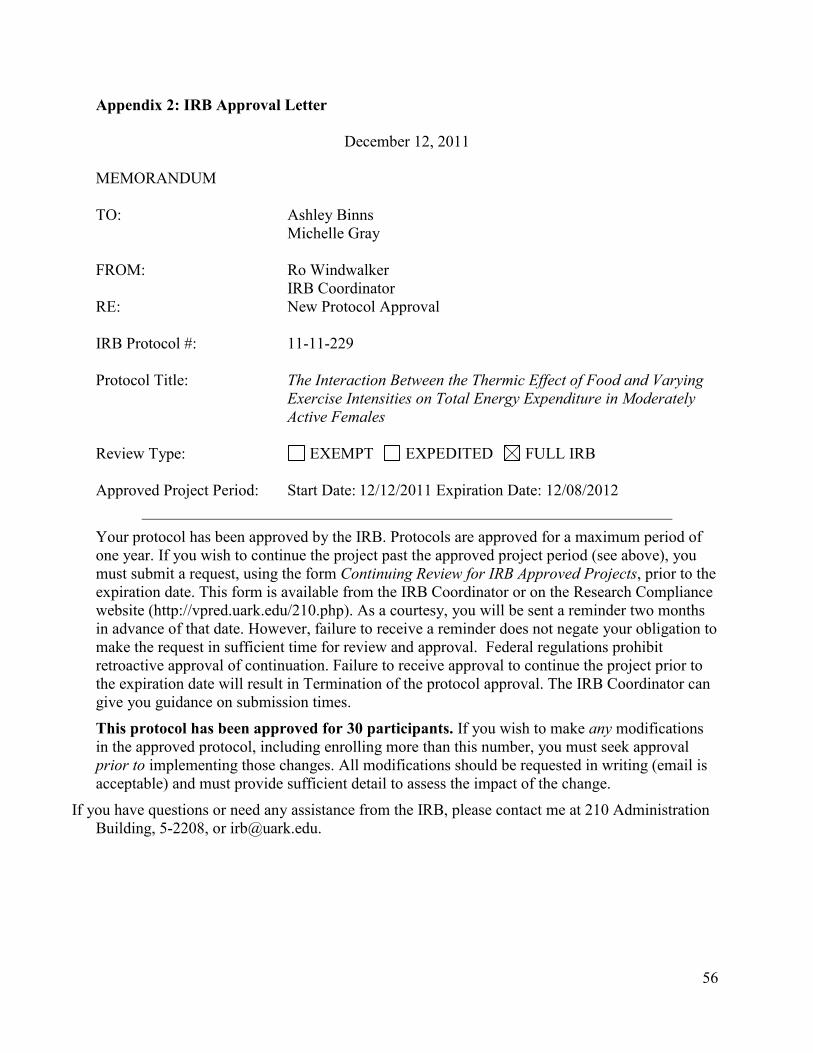
56
Appendix 2: IRB Approval Letter
December 12, 2011
MEMORANDUM
TO: Ashley Binns
Michelle Gray
FROM: Ro Windwalker
IRB Coordinator
RE: New Protocol Approval
IRB Protocol #: 11-11-229
Protocol Title: The Interaction Between the Thermic Effect of Food and Varying
Exercise Intensities on Total Energy Expenditure in Moderately
Active Females
Review Type: EXEMPT EXPEDITED FULL IRB
Approved Project Period: Start Date: 12/12/2011 Expiration Date: 12/08/2012
Your protocol has been approved by the IRB. Protocols are approved for a maximum period of
one year. If you wish to continue the project past the approved project period (see above), you
must submit a request, using the form Continuing Review for IRB Approved Projects, prior to the
expiration date. This form is available from the IRB Coordinator or on the Research Compliance
website (http://vpred.uark.edu/210.php). As a courtesy, you will be sent a reminder two months
in advance of that date. However, failure to receive a reminder does not negate your obligation to
make the request in sufficient time for review and approval. Federal regulations prohibit
retroactive approval of continuation. Failure to receive approval to continue the project prior to
the expiration date will result in Termination of the protocol approval. The IRB Coordinator can
give you guidance on submission times.
This protocol has been approved for 30 participants. If you wish to make any modifications
in the approved protocol, including enrolling more than this number, you must seek approval
prior to implementing those changes. All modifications should be requested in writing (email is
acceptable) and must provide sufficient detail to assess the impact of the change.
If you have questions or need any assistance from the IRB, please contact me at 210 Administration
Building, 5-2208, or [email protected].

57
Appendix 3: Health History Questionnaire (HHQ)
Health History Questionnaire Code #: __________ Please answer the following questions completely and accurately. If the question does not pertain to you, indicate this on the survey and continue on to the next question. Your responses to these questions will be kept confidential. Only the researchers will have access to these data. Please read the following questions carefully and answer each one honestly. Circle yes
or no.
a. Has your doctor ever said that you have a heart condition and that you should only do physical
activity recommended by a doctor? Yes No
b. Do you feel pain in your chest when you do physical activity? Yes No
c. In the past month, have you had chest pain when you were not doing physical activity? Yes
No
d. Do you lost your balance because of dizziness or do you ever lost consciousness? Yes No
e. Do you have a bone or joint problem (for example, back, knee or hip) that could be made worse
by a change in your physical activity? Yes No
f. Is your doctor currently prescribing drugs (for example, water pills) for your blood pressure or
heart condition? Yes No
g. Do you know of any other reason why you should not do physical activity? Yes No
Have you ever had, or do you currently have, any of the following conditions? Check yes
or no. If yes, please explain.
Heart Disease Yes No
Heart Attack Yes No Angina (Chest Pain) Yes No Peripheral Artery Disease Yes No Stroke Yes No High Cholesterol (>220) Yes No High Blood Pressure (>140/90) Yes No Diabetes Yes No Polycystic Ovarian Syndrome (PCOS) Yes No Partial or complete hysterectomy Yes No Hormone Therapy Yes No Leg pain, cramping, or tightness during exercise Yes No Shortness of breath at rest or with mild exertion Yes No Dizziness Yes No Rapid or irregular beating heart Yes No
Do you currently smoke? Yes No If yes, how many cigarettes do you smoke per day? a)1-10 b) 11-20 c) 21-30 d) 31-40 e) >40 How long have you been smoking? _____

58
Have you previously smoked? Yes No If yes, how long? _____ Do you drink alcohol? Yes No If yes, how many drinks do you consume per day? a)1-2 b) 3-4 c) 5+ d) socially, on occasion
Are you currently taking any medications (over the counter and/or prescribed)? Yes No
If yes, please list medication and reason prescribed:
Do you have any food allergies? Yes No
If yes, please list: ______________________________ Are you a vegetarian? Yes No
Are you lactose intolerant? Yes No
What is your current level of physical activity?
a) inactive b) recreational c) very active (no competition) d) trained
(competitive)
Do you currently perform in any form of endurance activity? Yes No
If yes: Frequency (days per week) Duration (min per day) Length of Participation Please list any and all activities: Do you currently participate in any form of strengthening activity? Yes No
Activities:
Frequency Duration Length of Participation
Sets _______ Reps _______
Have you recently experienced weight loss or weight gain? Yes No
If yes, how much weight? _________
Have you ever been diagnosed with an eating disorder? Yes No
If so, how old were you? ______
How long did you have this problem? ______
Do you have a normal menstrual cycle? Yes No
How many periods have you had in the last year?

59
a) 12 or more d) 3-5
b) 9-11 e) 1-2
c) 6-8 f) 0
In the last two years, has your cycle changed? a) Periods have become more frequent c) Periods have stopped
b) Periods have become less frequent d) Cycle has not changed
Are you currently using an oral (or any other form of) contraceptive? Yes No
If yes, please list:
To be filled out by experimenter:
Date of Birth: ___________ Current Age:_____ BMI: ____
Height: ___ feet ____ inches Weight:_____
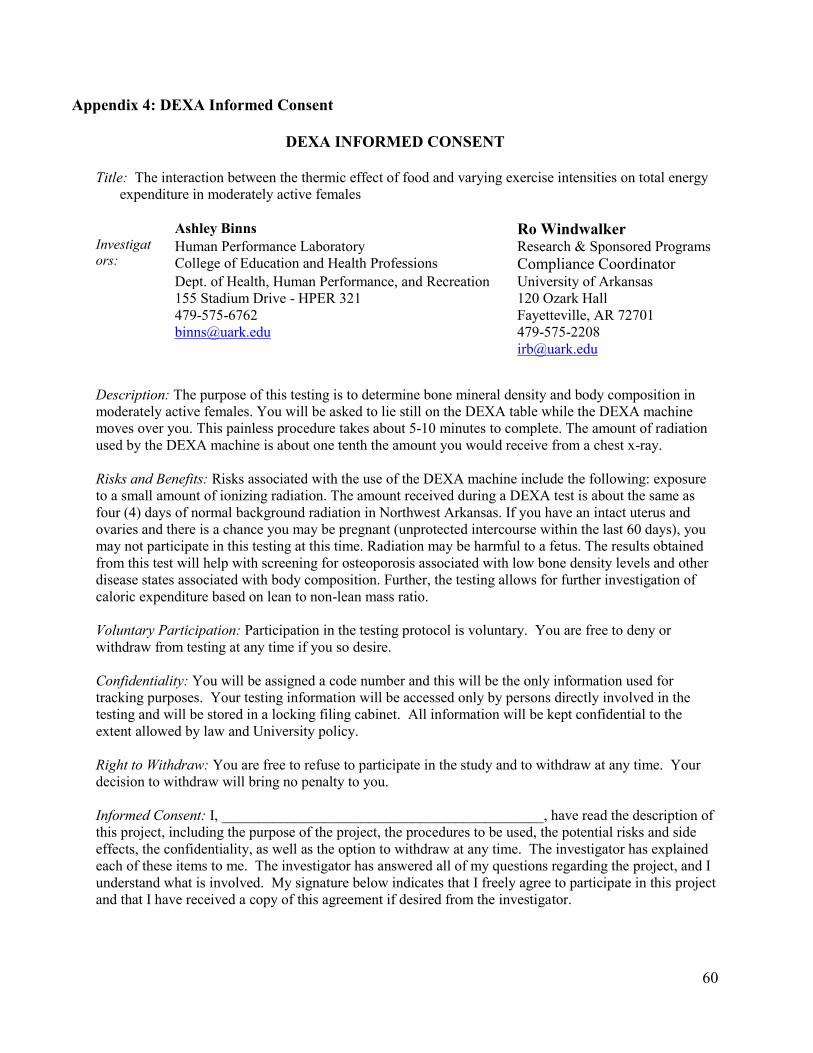
60
Appendix 4: DEXA Informed Consent
DEXA INFORMED CONSENT
Title: The interaction between the thermic effect of food and varying exercise intensities on total energy
expenditure in moderately active females
Investigators:
Description: The purpose of this testing is to determine bone mineral density and body composition in
moderately active females. You will be asked to lie still on the DEXA table while the DEXA machine
moves over you. This painless procedure takes about 5-10 minutes to complete. The amount of radiation
used by the DEXA machine is about one tenth the amount you would receive from a chest x-ray.
Risks and Benefits: Risks associated with the use of the DEXA machine include the following: exposure
to a small amount of ionizing radiation. The amount received during a DEXA test is about the same as
four (4) days of normal background radiation in Northwest Arkansas. If you have an intact uterus and
ovaries and there is a chance you may be pregnant (unprotected intercourse within the last 60 days), you
may not participate in this testing at this time. Radiation may be harmful to a fetus. The results obtained
from this test will help with screening for osteoporosis associated with low bone density levels and other
disease states associated with body composition. Further, the testing allows for further investigation of
caloric expenditure based on lean to non-lean mass ratio.
Voluntary Participation: Participation in the testing protocol is voluntary. You are free to deny or
withdraw from testing at any time if you so desire.
Confidentiality: You will be assigned a code number and this will be the only information used for
tracking purposes. Your testing information will be accessed only by persons directly involved in the
testing and will be stored in a locking filing cabinet. All information will be kept confidential to the
extent allowed by law and University policy.
Right to Withdraw: You are free to refuse to participate in the study and to withdraw at any time. Your
decision to withdraw will bring no penalty to you.
Informed Consent: I, ____________________________________________, have read the description of
this project, including the purpose of the project, the procedures to be used, the potential risks and side
effects, the confidentiality, as well as the option to withdraw at any time. The investigator has explained
each of these items to me. The investigator has answered all of my questions regarding the project, and I
understand what is involved. My signature below indicates that I freely agree to participate in this project
and that I have received a copy of this agreement if desired from the investigator.
Ashley Binns Ro Windwalker Human Performance Laboratory Research & Sponsored Programs College of Education and Health Professions Compliance Coordinator Dept. of Health, Human Performance, and Recreation University of Arkansas 155 Stadium Drive - HPER 321 120 Ozark Hall 479-575-6762 Fayetteville, AR 72701 [email protected] 479-575-2208 [email protected]

61
Participant:_____________________________________________________
Date:___________________
Witness:_______________________________________________________
Date:___________________

62
Appendix 5: IRB Modification Approval Letter
February 13, 2012
MEMORANDUM
TO: Ashley Binns
Michelle Gray
FROM: Ro Windwalker
IRB Coordinator
RE: PROJECT MODIFICATION
IRB Protocol #: 11-11-229
Protocol Title: The Interaction Between the Thermic Effect of Food and Varying
Exercise Intensities on Total Energy Expenditure in Moderately
Active Females
Review Type: EXEMPT EXPEDITED FULL IRB
Approved Project Period: Start Date: 02/13/2012 Expiration Date: 12/08/2012
Your request to modify the referenced protocol has been approved by the IRB. This protocol is
currently approved for 30 total participants. If you wish to make any further modifications in
the approved protocol, including enrolling more than this number, you must seek approval prior
to implementing those changes. All modifications should be requested in writing (email is
acceptable) and must provide sufficient detail to assess the impact of the change.
Please note that this approval does not extend the Approved Project Period. Should you wish to
extend your project beyond the current expiration date, you must submit a request for
continuation using the UAF IRB form “Continuing Review for IRB Approved Projects.” The
request should be sent to the IRB Coordinator, 210 Administration.
For protocols requiring FULL IRB review, please submit your request at least one month prior to
the current expiration date. (High-risk protocols may require even more time for approval.) For
protocols requiring an EXPEDITED or EXEMPT review, submit your request at least two weeks
prior to the current expiration date. Failure to obtain approval for a continuation on or prior to
the currently approved expiration date will result in termination of the protocol and you will be
required to submit a new protocol to the IRB before continuing the project. Data collected past
the protocol expiration date may need to be eliminated from the dataset should you wish to
publish. Only data collected under a currently approved protocol can be certified by the IRB for
any purpose.
If you have questions or need any assistance from the IRB, please contact me at 210 Administration
Building, 5-2208, or [email protected].

63
Appendix 6: GXT Data Collection Sheet
Name: Date:
Pre-exercise HR: Pre-exercise BP:
Reason for Test:
Reason for Stopping Test:
Max Time:
Max Speed & Grade:
Max HR:
Max BP:
Time Speed Grade Heart Rate Blood
Pressure
Comments (ectopic beats, etc)
1:00 2:00 3:00 4:00 5:00 6:00 7:00 8:00 9:00 10:00 11:00 12:00 13:00 14:00 15:00 Recovery 2:00 4:00 6:00

64
Appendix 7: Pre-Testing Guidelines
Due to the high metabolic nature of the upcoming testing sessions, it is important for some
aspects of the study to be as controlled as possible. Below are some guidelines that are important
to follow prior to each of the three upcoming testing sessions. Please read through the list below
and do your very best to follow as accurately as possible.
1.Get a restful night’s sleep.
-at least 8 hrs is preferable
2. Refrain from consuming any food or beverages 12 hours prior to your testing appointment
time.
-example: if you have a 6am appointment, do not consume any food or beverage (other
than water) after 6pm the night before.
3. Refrain from consuming caffeine and/or alcohol at least 12 hours prior to your testing
appointment.
4. Refrain from performing any exercise (especially strenuous) 24 hours prior to each testing
session.
-e.g. cardio (running, rowing, walking, elliptical, bike, swimming, jump rope, spin, group
exercise, etc); strength training (weights, weight machines, body weight exercises, group
exercise, etc)
5. Maintain a regular eating pattern the day prior to your testing session.
6. Minimize the amount of activities you do the morning of the test. The less you do, the better
(e.g. brush teeth/hair, put clothes on, drive to facility, walk to testing appointment).
-although there will be a “rest” period prior to beginning the test, it is important to not
exert yourself prior to the testing session.
7. Upon arrival to the building, take the elevator to the third floor (Human Performance Lab).
8. Feel free to bring a water bottle and light reading materials to each testing session.
-since there will be quite a bit of down time, you are welcome to bring a book,
magazine(s), school work, etc. to read throughout the duration of the testing session.
Some magazines will be provided as well as music.
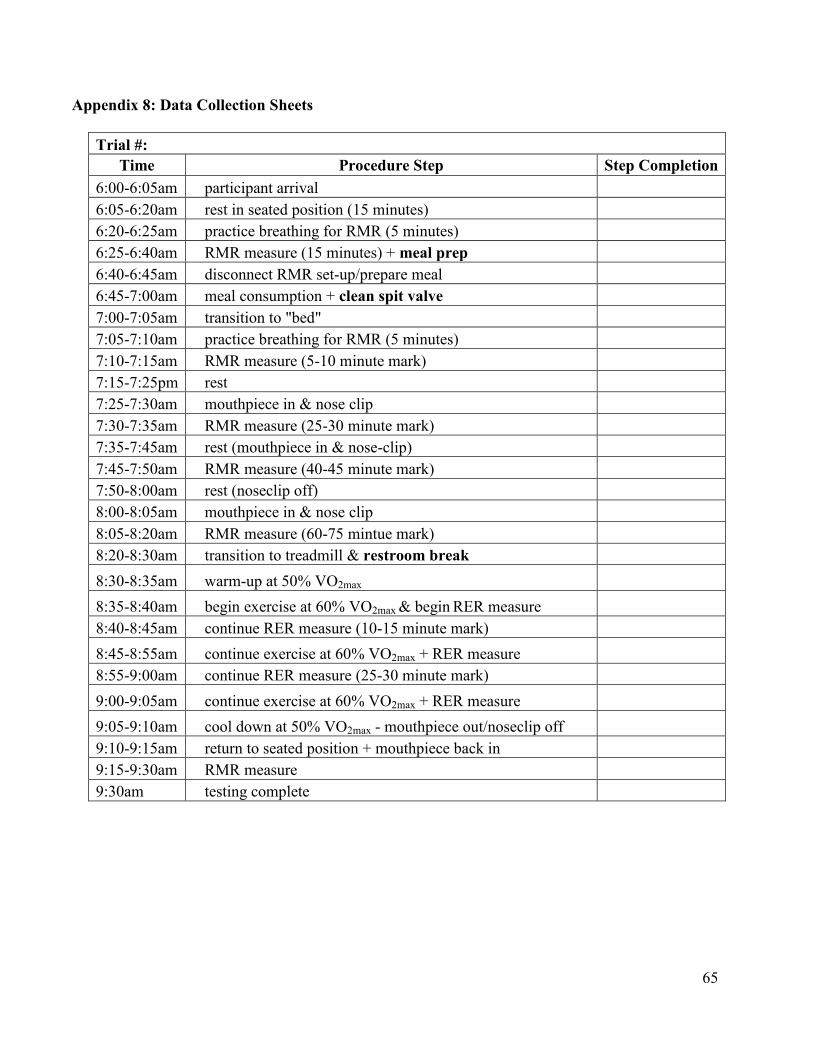
65
Appendix 8: Data Collection Sheets
Trial #:
Time Procedure Step Step Completion
6:00-6:05am participant arrival
6:05-6:20am rest in seated position (15 minutes)
6:20-6:25am practice breathing for RMR (5 minutes)
6:25-6:40am RMR measure (15 minutes) + meal prep
6:40-6:45am disconnect RMR set-up/prepare meal
6:45-7:00am meal consumption + clean spit valve
7:00-7:05am transition to "bed"
7:05-7:10am practice breathing for RMR (5 minutes)
7:10-7:15am RMR measure (5-10 minute mark)
7:15-7:25pm rest
7:25-7:30am mouthpiece in & nose clip
7:30-7:35am RMR measure (25-30 minute mark)
7:35-7:45am rest (mouthpiece in & nose-clip)
7:45-7:50am RMR measure (40-45 minute mark)
7:50-8:00am rest (noseclip off)
8:00-8:05am mouthpiece in & nose clip
8:05-8:20am RMR measure (60-75 mintue mark)
8:20-8:30am transition to treadmill & restroom break
8:30-8:35am warm-up at 50% VO2max
8:35-8:40am begin exercise at 60% VO2max & begin RER measure
8:40-8:45am continue RER measure (10-15 minute mark)
8:45-8:55am continue exercise at 60% VO2max + RER measure
8:55-9:00am continue RER measure (25-30 minute mark)
9:00-9:05am continue exercise at 60% VO2max + RER measure
9:05-9:10am cool down at 50% VO2max - mouthpiece out/noseclip off
9:10-9:15am return to seated position + mouthpiece back in
9:15-9:30am RMR measure
9:30am testing complete

66
Appendix 8: Data Collection Sheets
Trial #:
Time Procedure Step Step Completion
9:00-9:05am participant arrival
9:05-9:20am rest in seated position (15 minutes)
9:20-9:25am practice breathing for RMR (5 minutes)
9:25-9:40am RMR measure (15 minutes) + meal prep
9:40-9:45am disconnect RMR set-up/prepare meal
9:45-10:00am meal consumption + clean spit valve
10:00-10:05am transition to "bed"
10:05-10:10am practice breathing for RMR (5 minutes)
10:10-10:15am RMR measure (5-10 minute mark)
10:15-10:25pm rest
10:25-10:30am mouthpiece in & nose clip
10:30-10:35am RMR measure (25-30 minute mark)
10:35-10:45am rest (mouthpiece in & nose-clip)
10:45-10:50am RMR measure (40-45 minute mark)
10:50-11:00am rest (noseclip off)
10:00-11:05am mouthpiece in & nose clip
11:05-11:20am RMR measure (60-75 mintue mark)
11:20-11:30am transition to treadmill & restroom break
11:30-11:35am warm-up at 50% VO2max
11:35-11:40am begin exercise at 60% VO2max & begin RER measure
11:40-11:45am continue RER measure (10-15 minute mark)
11:45-11:55am continue exercise at 60% VO2max + RER measure
11:55-12:00pm continue RER measure (25-30 minute mark)
12:00-12:05pm continue exercise at 60% VO2max + RER measure
12:05-12:10pm cool down at 50% VO2max - mouthpiece out/noseclip off
12:10-12:15pm return to seated position + mouthpiece back in
12:15-12:30pm RMR measure
12:30pm testing complete
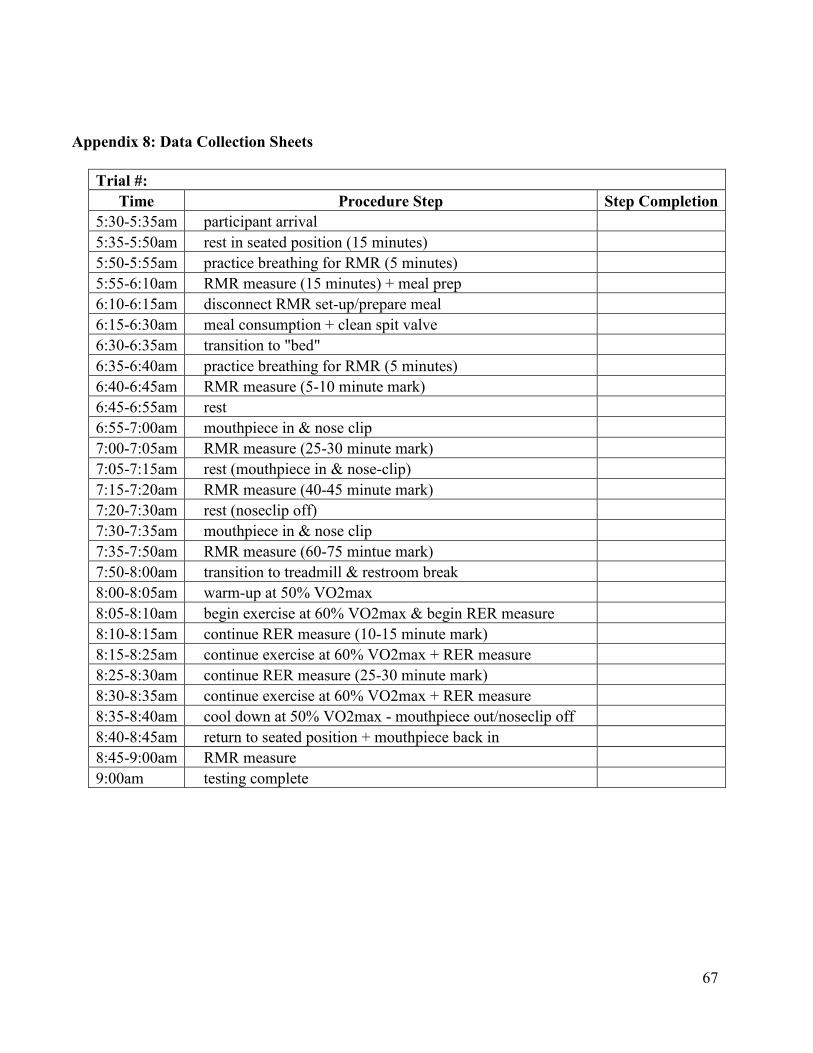
67
Appendix 8: Data Collection Sheets
Trial #:
Time Procedure Step Step Completion
5:30-5:35am participant arrival
5:35-5:50am rest in seated position (15 minutes)
5:50-5:55am practice breathing for RMR (5 minutes)
5:55-6:10am RMR measure (15 minutes) + meal prep
6:10-6:15am disconnect RMR set-up/prepare meal
6:15-6:30am meal consumption + clean spit valve
6:30-6:35am transition to "bed"
6:35-6:40am practice breathing for RMR (5 minutes)
6:40-6:45am RMR measure (5-10 minute mark)
6:45-6:55am rest
6:55-7:00am mouthpiece in & nose clip
7:00-7:05am RMR measure (25-30 minute mark)
7:05-7:15am rest (mouthpiece in & nose-clip)
7:15-7:20am RMR measure (40-45 minute mark)
7:20-7:30am rest (noseclip off)
7:30-7:35am mouthpiece in & nose clip
7:35-7:50am RMR measure (60-75 mintue mark)
7:50-8:00am transition to treadmill & restroom break
8:00-8:05am warm-up at 50% VO2max
8:05-8:10am begin exercise at 60% VO2max & begin RER measure
8:10-8:15am continue RER measure (10-15 minute mark)
8:15-8:25am continue exercise at 60% VO2max + RER measure
8:25-8:30am continue RER measure (25-30 minute mark)
8:30-8:35am continue exercise at 60% VO2max + RER measure
8:35-8:40am cool down at 50% VO2max - mouthpiece out/noseclip off
8:40-8:45am return to seated position + mouthpiece back in
8:45-9:00am RMR measure
9:00am testing complete
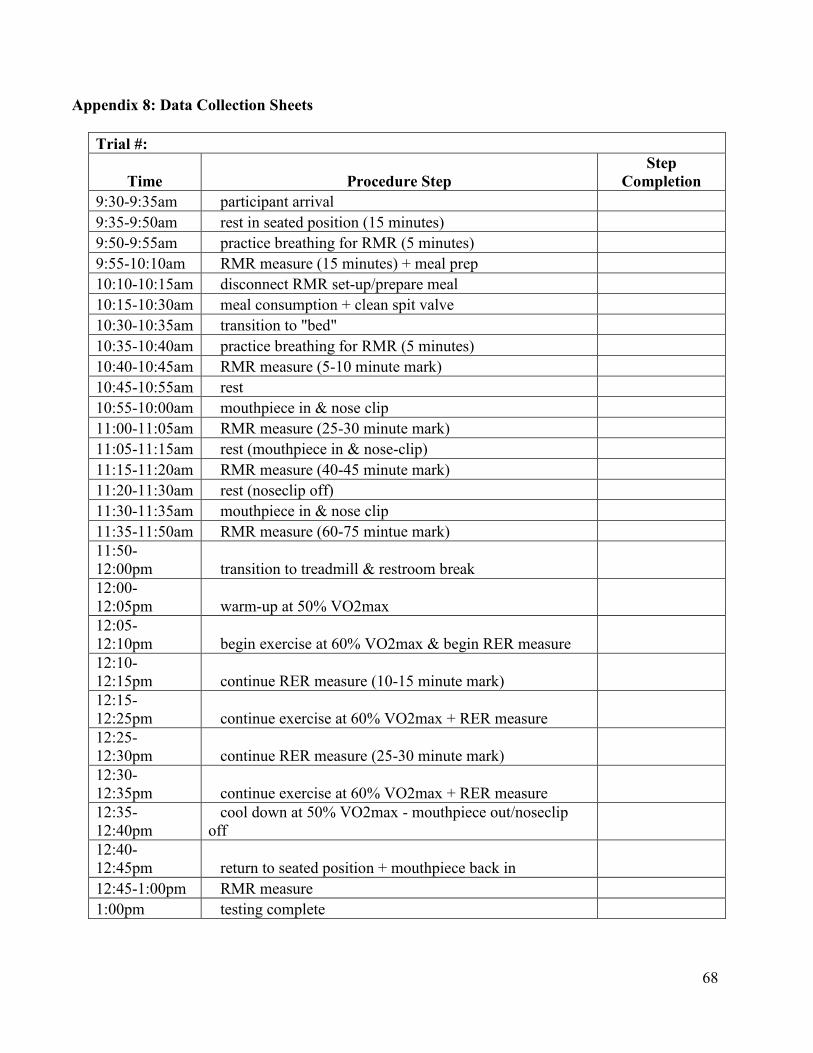
68
Appendix 8: Data Collection Sheets
Trial #:
Time Procedure Step
Step
Completion
9:30-9:35am participant arrival
9:35-9:50am rest in seated position (15 minutes)
9:50-9:55am practice breathing for RMR (5 minutes)
9:55-10:10am RMR measure (15 minutes) + meal prep
10:10-10:15am disconnect RMR set-up/prepare meal
10:15-10:30am meal consumption + clean spit valve
10:30-10:35am transition to "bed"
10:35-10:40am practice breathing for RMR (5 minutes)
10:40-10:45am RMR measure (5-10 minute mark)
10:45-10:55am rest
10:55-10:00am mouthpiece in & nose clip
11:00-11:05am RMR measure (25-30 minute mark)
11:05-11:15am rest (mouthpiece in & nose-clip)
11:15-11:20am RMR measure (40-45 minute mark)
11:20-11:30am rest (noseclip off)
11:30-11:35am mouthpiece in & nose clip
11:35-11:50am RMR measure (60-75 mintue mark)
11:50-
12:00pm transition to treadmill & restroom break
12:00-
12:05pm warm-up at 50% VO2max
12:05-
12:10pm begin exercise at 60% VO2max & begin RER measure
12:10-
12:15pm continue RER measure (10-15 minute mark)
12:15-
12:25pm continue exercise at 60% VO2max + RER measure
12:25-
12:30pm continue RER measure (25-30 minute mark)
12:30-
12:35pm continue exercise at 60% VO2max + RER measure
12:35-
12:40pm
cool down at 50% VO2max - mouthpiece out/noseclip
off
12:40-
12:45pm return to seated position + mouthpiece back in
12:45-1:00pm RMR measure
1:00pm testing complete
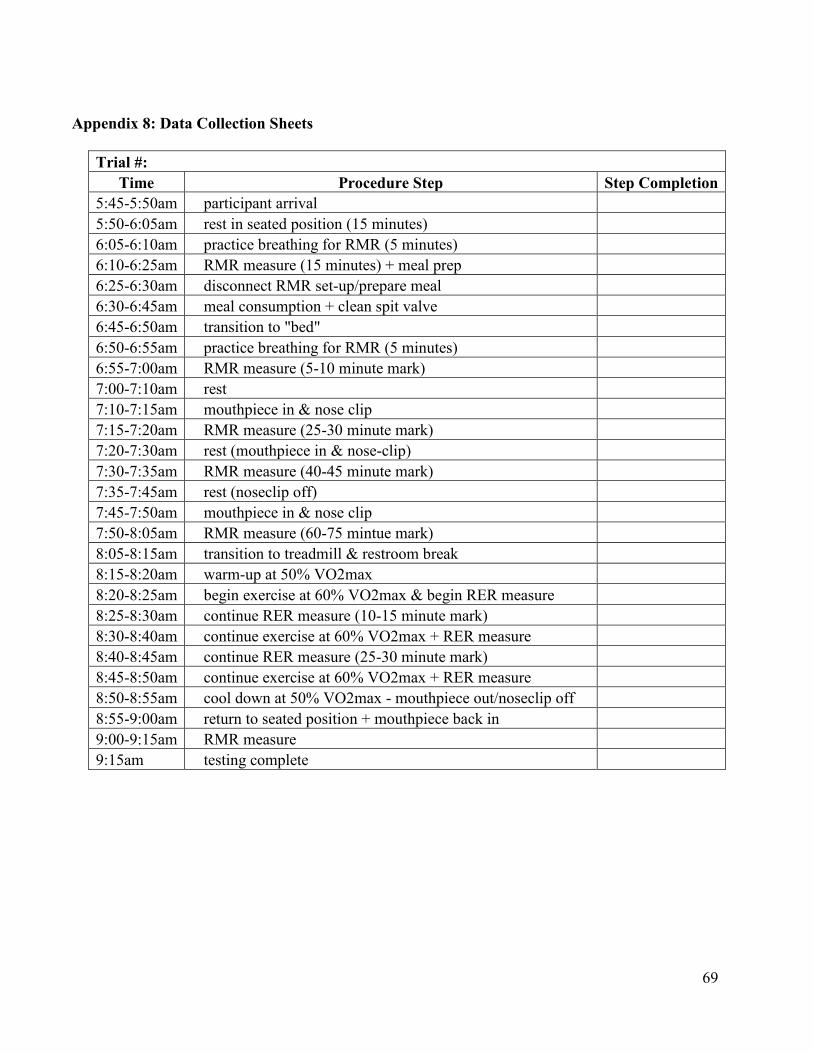
69
Appendix 8: Data Collection Sheets
Trial #:
Time Procedure Step Step Completion
5:45-5:50am participant arrival
5:50-6:05am rest in seated position (15 minutes)
6:05-6:10am practice breathing for RMR (5 minutes)
6:10-6:25am RMR measure (15 minutes) + meal prep
6:25-6:30am disconnect RMR set-up/prepare meal
6:30-6:45am meal consumption + clean spit valve
6:45-6:50am transition to "bed"
6:50-6:55am practice breathing for RMR (5 minutes)
6:55-7:00am RMR measure (5-10 minute mark)
7:00-7:10am rest
7:10-7:15am mouthpiece in & nose clip
7:15-7:20am RMR measure (25-30 minute mark)
7:20-7:30am rest (mouthpiece in & nose-clip)
7:30-7:35am RMR measure (40-45 minute mark)
7:35-7:45am rest (noseclip off)
7:45-7:50am mouthpiece in & nose clip
7:50-8:05am RMR measure (60-75 mintue mark)
8:05-8:15am transition to treadmill & restroom break
8:15-8:20am warm-up at 50% VO2max
8:20-8:25am begin exercise at 60% VO2max & begin RER measure
8:25-8:30am continue RER measure (10-15 minute mark)
8:30-8:40am continue exercise at 60% VO2max + RER measure
8:40-8:45am continue RER measure (25-30 minute mark)
8:45-8:50am continue exercise at 60% VO2max + RER measure
8:50-8:55am cool down at 50% VO2max - mouthpiece out/noseclip off
8:55-9:00am return to seated position + mouthpiece back in
9:00-9:15am RMR measure
9:15am testing complete

70
Appendix 9: IRB Modification Approval
April 13, 2012
MEMORANDUM
TO: Ashley Binns
Michelle Gray
FROM: Ro Windwalker
IRB Coordinator
RE: PROJECT MODIFICATION
IRB Protocol #: 11-11-229
Protocol Title: The Interaction Between the Thermic Effect of Food and Varying
Exercise Intensities on Total Energy Expenditure in Moderately
Active Females
Review Type: EXEMPT EXPEDITED FULL IRB
Approved Project Period: Start Date: 04/13/2012 Expiration Date: 12/08/2012
Your request to modify the referenced protocol has been approved by the IRB. This protocol is
currently approved for 30 total participants. If you wish to make any further modifications in
the approved protocol, including enrolling more than this number, you must seek approval prior
to implementing those changes. All modifications should be requested in writing (email is
acceptable) and must provide sufficient detail to assess the impact of the change.
Please note that this approval does not extend the Approved Project Period. Should you wish to
extend your project beyond the current expiration date, you must submit a request for
continuation using the UAF IRB form “Continuing Review for IRB Approved Projects.” The
request should be sent to the IRB Coordinator, 210 Administration.
For protocols requiring FULL IRB review, please submit your request at least one month prior to
the current expiration date. (High-risk protocols may require even more time for approval.) For
protocols requiring an EXPEDITED or EXEMPT review, submit your request at least two weeks
prior to the current expiration date. Failure to obtain approval for a continuation on or prior to
the currently approved expiration date will result in termination of the protocol and you will be
required to submit a new protocol to the IRB before continuing the project. Data collected past
the protocol expiration date may need to be eliminated from the dataset should you wish to
publish. Only data collected under a currently approved protocol can be certified by the IRB for
any purpose.
If you have questions or need any assistance from the IRB, please contact me at 210 Administration
Building, 5-2208, or [email protected].

71
Figures

72
Figure 1. Experimental Design
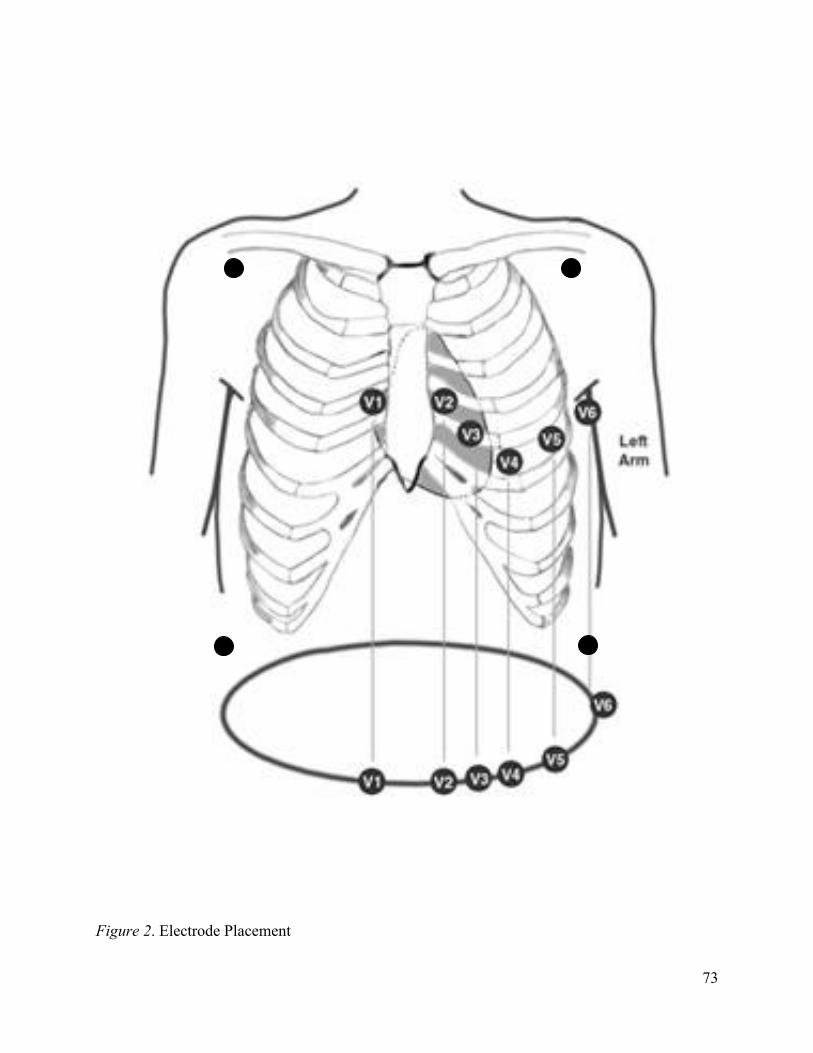
73
Figure 2. Electrode Placement

74
Tables
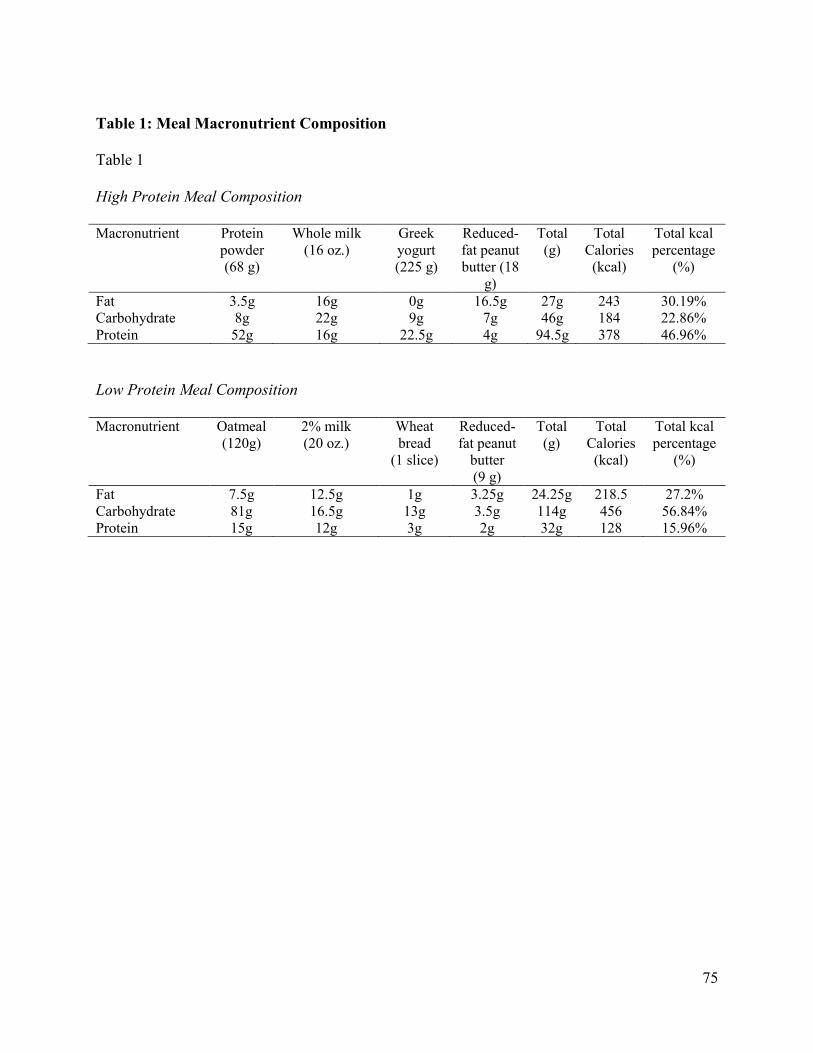
75
Table 1: Meal Macronutrient Composition
Table 1
High Protein Meal Composition
Macronutrient Protein
powder
(68 g)
Whole milk
(16 oz.)
Greek
yogurt
(225 g)
Reduced-
fat peanut
butter (18
g)
Total
(g)
Total
Calories
(kcal)
Total kcal
percentage
(%)
Fat 3.5g 16g 0g 16.5g 27g 243 30.19%
Carbohydrate 8g 22g 9g 7g 46g 184 22.86%
Protein 52g 16g 22.5g 4g 94.5g 378 46.96%
Low Protein Meal Composition
Macronutrient Oatmeal
(120g)
2% milk
(20 oz.)
Wheat
bread
(1 slice)
Reduced-
fat peanut
butter
(9 g)
Total
(g)
Total
Calories
(kcal)
Total kcal
percentage
(%)
Fat 7.5g 12.5g 1g 3.25g 24.25g 218.5 27.2%
Carbohydrate 81g 16.5g 13g 3.5g 114g 456 56.84%
Protein 15g 12g 3g 2g 32g 128 15.96%

76
Table 2: Bruce Treadmill Protocol
Table 2
Standard Bruce Treadmill Protocol
Standard Bruce Treadmill Protocol (VO2max Test)
Time Period (min) Stage Speed (mph) Grade (%)
0:00-3:00 1 1.7 10
3:00-6:00 2 2.5 12
6:00-9:00 3 3.4 14
9:00-12:00 4 4.2 16
12:00-15:00 5 5 18
15:00-18:00 6 5.5 20
18:00-21:00 7 6 22

77
Table 3: Descriptive Statistics for All Participants
Table 3
Descriptive Statistics for All Participants
Measure Min Max M SD
Age a 19.0 24 21.90 2.03
Height b 155 172 162.9 5.59
Weight c 48.0 70 58.70 7.75
BMI d 18.5 25 21.95 1.92
LM e 59.0 78 70.20 5.94
FM e 22.0 41 29.80 5.94
VO2max f 30.0 49 40.10 6.19
60% VO2max f 18.0 30 24.10 3.87
Note. Min = minimum value; Max = maximum value; M = mean; and SD = standard deviation. a Measured in years.
b Measured in centimeters.
c Measured in kilograms.
d Measured in
kilograms per meter squared. e Measured in percent.
f Measured in milliliters per kilogram per
minute.

78
Table 4: Repeated Measures ANOVA Summary Table for Thermic Effect of Food
Table 4
Repeated Measures ANOVA Summary Table for Thermic Effect of Food
Measure df SS MS F p
Time 2 5.703 2.851 115.067 .000
Error 18 .446 .025

79
Table 5: Post-hoc Analysis for Thermic Effect of Food
Table 5
Post-Hoc Analysis for Thermic Effect of Food
Measure n M (SD) 95% CI d t p
TEFH-TEFL 10 0.323 (0.196) [.12, .53] 1.648 3.592 .006*
TEFH-TEFF 10 1.043 (0.139) [.90, 1.2] 7.504 16.05 .000*
TEFL-TEFF 10 0.720 (0.165) [.61, .84] 4.363 14.18 .000*
Note. TEFH-TEFL = TEF of the high protein meal compared to TEF of the low protein meal;
TEFH-TEFF = TEF of the high protein meal compared to TEF in the fasted state; TEFL – TEFF
= TEF of the low protein meal compared to TEF in the fasted state.
*p < .0167

80
Table 6: Repeated Measures ANOVA Summary Table for Thermic Effect of Food with
Exercise
Table 6
Repeated Measures ANOVA Summary Table for Thermic Effect of Food with Exercise
Measure df SS MS F p
Time 2 7.524 3.762 6.039 .010
Error 18 11.214 .623

81
Table 7: Post-hoc Analysis for Thermic Effect of Food with Exercise
Table 7
Post-Hoc Analysis for Thermic Effect of Food with Exercise
Measure n M (SD) 95% CI d t p
TEFHe-TEFLe 10 0.458 (5.264) [-.15, 1.1] 0.087 1.709 .122
TEFHe-TEFFe 10 1.215 (4.993) [.37, 2.1] 0.243 3.266 .010*
TEFLe-TEFFe 10 0.756 (5.061) [-.16, 1.7] 0.149 1.870 .094
Note. TEFHe-TEFLe = TEF of the high protein meal with exercise compared to TEF of the low
protein meal with exercise; TEFHe-TEFFe = TEF of the high protein meal with exercise
compared to TEF in the fasted state with exercise; TEFLe – TEFFe = TEF of the low protein
meal with exercise compared to TEF in the fasted state with exercise.
*p < .0167