interactive effects of altitude, microclimate and shading
TRANSCRIPT

Full Terms amp Conditions of access and use can be found athttpswwwtandfonlinecomactionjournalInformationjournalCode=tjpi20
Journal of Plant Interactions
ISSN 1742-9145 (Print) 1742-9153 (Online) Journal homepage httpswwwtandfonlinecomloitjpi20
Interactive effects of altitude microclimate andshading system on coffee leaf rust
Theresa Liebig Fabienne Ribeyre Peter Laumlderach Hans-Michael PoehlingPiet van Asten amp Jacques Avelino
To cite this article Theresa Liebig Fabienne Ribeyre Peter Laumlderach Hans-Michael PoehlingPiet van Asten amp Jacques Avelino (2019) Interactive effects of altitude microclimate and shadingsystem on coffee leaf rust Journal of Plant Interactions 141 407-415
To link to this article httpsdoiorg1010801742914520191643934
copy 2019 The Author(s) Published by InformaUK Limited trading as Taylor amp FrancisGroup
View supplementary material
Published online 01 Aug 2019
Submit your article to this journal
View Crossmark data
Interactive effects of altitude microclimate and shading system on coffee leaf rustTheresa Liebig a Fabienne Ribeyreb Peter Laumlderachc Hans-Michael Poehlingd Piet van Astene andJacques Avelinobfg
aClimate Change Agriculture and Food Security (CCAFS) International Institute of Tropical Agriculture (IITA) Kampala Uganda bUPRBioagresseurs CIRAD Montpellier France cClimate Change Agriculture and Food Security (CCAFS) International Center for Tropical Agriculture(CIAT) CaliHanoi ColombiaVietnam dInstitute of Horticultural Production Systems - Section Phytomedicine Leibniz University of HanoverHanover Germany eOlam International Ltd Kampala Uganda fDepartment of Research and Development Tropical Agricultural Research andHigher Education Center (CATIE) Turrialba Costa Rica gInter-American Institute for Cooperation on Agriculture (IICA) San Joseacute Costa Rica
ABSTRACTShade effects on coffee diseases are ambiguous because they vary depending on the season andenvironment Using Coffee Leaf Rust (CLR) as an example we demonstrate relationships betweenthe environment and shading systems and their effects on disease intensity We characterizedseasonal variations in microclimate and CLR incidence across different altitudes and shadingsystems and integrated effects between the environment shading systems microclimate and CLRinto a piecewise structural equation model The diurnal temperature range was higher in unshadedsystems but differences decreased with altitude Humidity related indicators in shaded systemsdecreased with altitude At mid and high altitudes high CLR incidence occurred in the shadingsystem showing a low diurnal temperature range and a high dew point temperature Our studydemonstrates how microclimatic indicators vary as a function of the season altitude and the coffeeshading system and how this in turn is related to CLR
ARTICLE HISTORYReceived 21 February 2019Accepted 6 July 2019
KEYWORDSHemileia vastatrix coffeeshade microclimatepiecewise structural equationmodelling
Introduction
Coffee agroecosystems are interaction networks consisting ofanthropogenic topographic meteorological edaphic andbiological components which vary in space and time(Wagenet 1998) The performance of the coffee system withrespect to different ecosystem services is a function of com-plex space and time-dependent interactions which canemerge as trade-offs or synergies (Cerda et al 2016) Sustain-able pest and disease management strategies require anunderstanding of the complexity of agroecosystems (Avelinoet al 2006 Cerda et al 2016)
The performance of coffee eg productivity (Vaast et al2006) quality (Bosselmann et al 2009) biodiversity (Teodoroet al 2010) or sustainability (Jha et al 2011) under shaded vssun-exposed conditions has been explored in numerousstudies Beneficial shading effects on coffee productionthrough the mitigation of microclimatic extremes have beenquantified and are generally well-established (Barradas andFanjul 1986 Lin 2007) It has also been acknowledged thatthe extent to which shaded systems are advantageous dependson the biophysical context (Cerda et al 2017 Rahn et al2018)
Since shading effects vary across sites and season itsimpacts on coffee pests and diseases are ambiguous (Avelinoet al 2006 2011 Loacutepez-Bravo et al 2012 Boudrot et al 2016)Few studies were conducted across different temporal andspatial scales or focused on the effect of multiple factorsand response variables With the availability of both spatialdata and statistical tools to evaluate networks of causalrelationships (Grace 2006 Lefcheck 2016) recent research
addresses the complexity of agroecosystems (Boreux et al2013 Allinne et al 2016)
Shading modifies the environment for pests and diseasesdirectly or indirectly via changes in microclimate or by creat-ing habitats for beneficial or competitive organisms (Avelinoet al 2004 Pumarintildeo et al 2015) Likewise shade modifiesthe environment for many other components of the systemeg coffee physiology and productivity soil water as wellas biodiversity which in turn may also be related amongstthemselves and with pests and diseases (Muschler 2004)Moreover these ecological mechanisms of shade are alteredby greater spatial factors such as macroclimatic variationsalong altitudinal or latitudinal gradients (Staver et al 2001Avelino et al 2011 Cerda et al 2017)
The case of Coffee Leaf Rust (CLR Hemileia vastatrix)illustrates how shade can operate in two antithetic pathwaysshade may (i) aggravate the disease due to modifying themicroclimate to conditions more favorable for the fungusor (ii) regulate yield which in turn could negatively affectthe pathogen because attack intensities are more acutewhen fruit load is high (Avelino et al 2004 2006 Loacutepez-Bravo et al 2012)
CLR has caused tremendous damage for the Arabica coffeesector of the Americas over the past few years (Avelino et al2015) The combination of suboptimal management andmeteorological factors were responsible for the heavy out-breaks and this is expected to play a role under future climateconditions (Avelino et al 2015) In Africa CLR is the mostdevastating disease of Arabica coffee after Coffee Berry Dis-ease (Colletotrichum kahawae) (Matovu et al 2013) In
copy 2019 The Author(s) Published by Informa UK Limited trading as Taylor amp Francis GroupThis is an Open Access article distributed under the terms of the Creative Commons Attribution License (httpcreativecommonsorglicensesby40) which permits unrestricted usedistribution and reproduction in any medium provided the original work is properly cited
CONTACT Theresa Liebig theresaliebiggmailcom Climate Change Agriculture and Food Security (CCAFS) International Institute of Tropical Agriculture(IITA) Kampala Uganda
Supplemental data for this article can be accessed at httpsdoiorg1010801742914520191643934
JOURNAL OF PLANT INTERACTIONS2019 VOL 14 NO 1 407ndash415httpsdoiorg1010801742914520191643934
Uganda the impact of CLR became apparent in the 1940swhen areas of land typically producing Arabica had to bereplaced with Robusta coffee (McCook 2006)
In this study we explore direct indirect and interactiveeffects of the altitude and coffee shading system on microcli-matic indicators and CLR We (i) characterized seasonal vari-ations in microclimate and CLR incidence across differentaltitudes and shading systems We then (ii) integratedeffects between the environment shading systems microcli-mate and CLR into a conceptual and statistical frameworkto understand directional relationships
Material and methods
Study area
The study was conducted in three districts that produce Ara-bica coffee in the Mt Elgon area of eastern Uganda (Figure 1)The area dominated by smallholder agriculture has an alti-tude of 1000ndash2200 masl We sampled three altitude ranges(see S1 Supporting Information) low (1100ndash1400 masl)mid (1400ndash1700 masl) and high (1700ndash2200 masl) Thearea has a bimodal rainfall with peaks in MarchApril andOctoberNovember and is dry in DecemberndashFebruaryAnnual rainfall is 1200ndash1800 mm with mean temperaturefrom 18 to 23degC depending on altitude Smallholders growcoffee with varying shade-tree species and density with bana-nas or with no shade Traditional CLR susceptible varietiessuch as SL 14 SL 28 and Nyasaland are grown (Matovuet al 2013)
Plot selection and characterization
We selected sites based on a survey conducted in 2014 (Rahnet al 2018) In summary along the three altitude ranges we cre-ated typologies of shading systems using descriptors of the veg-etation structure Table 1 shows which shade-relateddescriptors we used and how we characterized them (see alsoS1 Supporting Information) Based on those typologies atotal of 49 plots (003ndash05 ha) were used for the present study
Data acquisition
On each plot we systematically selected nine coffee bushes ona cross-shaped transect representing the shading system ofthe whole plot We avoided exhausted too old (gt30 years)
or too young (ltfive years) bushes and those on plot bordersto avoid boundary effects On each coffee bush six branchesin the lower mid and higher vegetation storey (two perstorey) and facing towards different directions were markedCLR was assessed on these branches by counting healthy anddiseased leaves (identified by chlorotic or yellow spots on thelower leaf surface) in approximately six-week intervals fromthe beginning (March) until the end (December) of 2015growing season We installed the temperature and relativehumidity data loggers (iButtonreg DS1923) on a subset of 27plots (three replicates for each system by three altitudes)We installed two screened loggers (Holden et al 2013) oneach plot at the height of 150 m and set them to recordeach hour during the 20152016 season
Explanatory and response variables
Explanatory variables included the altitude range (represent-ing a set of topographical indicators) and coffee shading sys-tem Microclimatic variables served as both responsevariables as a function of the altitude range and coffee shadingsystem as well as explanatory variables for CLR Microcli-matic variables explaining CLR variability were generatedand selected in two steps First we did a literature review toidentify microclimatic variables driving CLR epidemics(Table 2 and S2 of the supporting information) Identifiedvariables (or a related variable if the measurement was not
Table 1 Characteristics of production typologies generated by K-meansclustering
CO CB CT
n = 54 n = 44 n = 46
Mean SE Mean SE Mean SE
Coffee density (coffee haminus1) 2255a 125 2094a 127 2095a 112Banana density (bananashaminus1)
29a 17 1496b 105 278c 82
Shade tree density (treeshaminus1)
63a 6 49a 6 146b 16
Shade tree species richness 28a 02 27a 02 6b 04Canopy Closure () 21a 14 28b 14 48c 2
Canopy closure indicates the average plot shade estimated using a sphericalcrown densiometer (Forestry Suppliers convex model A) (Lemmon 1957) atfour random positions within the plot SE = Standard error Means withinrows with different letters indicate significant differences (one-way ANOVAp lt 05) Clustering was based on a total of 144 plots which were sampledin May 2014 In 2015 22 additional plots were included and classified retro-spectively CB = Coffee-Banana System CO = Coffee-Open System CT =Coffee-Tree System These plots were used for coffee leaf rust assessments
Figure 1 Study area within the Ugandan Mount Elgon area and the districts (Bulambuli Kapchorwa and Sironko)
408 T LIEBIG ET AL
available) were derived from our microclimate recordingstotalling nine microclimatic variables Second to select timeperiods for each variable four-week time intervals for eachmonitoring date were extracted The final number of poten-tial CLR driving microclimatic variables totalled 63 (9 vari-ables times 7 monitoring dates) The maximum CLR incidence(CLRmax) of the season ie the number of diseased leavesas a proportion of the total number of young leaves (accord-ing to Avelino et al 1991 determined by the short internoderesulting from the dry season) per bush was the response vari-able Explanatory and response variables are summarized inTable 3
Data analysis
(i) Characterization of seasonal variations of microclimateand CLR
We identified microclimatic variables and corresponding4-week time intervals by plotting them against CLRmax Weexcluded highly autocorrelated predictors by estimating thecorrelation coefficients matrix
The CLRmax and the selected microclimatic variables wereplotted per altitude range and coffee shading system to illus-trate seasonal variations Differences among the altitude andshading system gradients were tested with the methoddescribed in the following paragraph
(ii) Formulation of a piecewise structural equation model(SEM)
Based on literature and field observations we developed ana priori conceptual model of the possible underlying relation-ships between components of the environment coffee shad-ing system microclimate coffee productivity and coffee
pests and diseases (Figure 2) Table 4 shows which variableswere considered and how they were used in the subsequentanalysis
We used a piecewise structural equation model (SEM) toinfer direct and indirect effects of altitude and coffee shadingsystem on CLRmax via microclimatic indicators An SEM is astatistical framework used to understand causalities withincomplex natural systems (Shipley 2000 Grace 2006) Thehypothetical causal relationships are represented in a graphi-cal model where each path describes directional relationshipsbetween variables We used piecewise SEM enabling general-ized linear models to be fit to different distributions includingthose typical for pest and disease data Individual paths areestimated separately and then combined to a series ofequations to estimate direct and indirect effects within thesystem (Lefcheck 2016)
The piecewise SEM was constructed based on the concep-tual model in Figure 2 and the results of the selection pro-cedure of potential microclimatic variables First eachresponse variable ie the microclimatic variables and CLRrepresenting the component models or paths were fitted aslinear or generalized linear models in dependence on individ-ual or combined predictors For each path the best model wasselected by Akaike information criterion (AIC) Then theindividual models were combined to a list of equations andapplied to the piecewise SEM function Non-significantpaths (p gt 05) were excluded from the overall model TheShipleyrsquos test of d-separation was used to test whether signifi-cant paths were missing The Fisherrsquos C statistic evaluated theoverall fit of the model
We used R software (R Core Team 2016) with RStudio(Version 099903) for data analysis We used ArcMap(ESRI 2014) to produce the maps We used the 90-m resol-ution digital elevation model of the shuttle radar topographymission and the administrative borders from the DataUgdatabase (httpmapsdataug)
Table 2 Literature reviewa on microclimatic variables driving coffee leaf rust epidemics
Microclimatic drivers ofCLR Reference Description
Derived variables selectionprocedureb
Temperature (meanmaximum orminimum)
(Rayner 1961 Nutman et al1963 De Jong et al 1987)
Bimodal relation between temperature and CLR sporegerminationappressorium formation (optimum range between21degC and 25degC) Optimum temperature for lesion formation at22degC De Jong et al (1987) reported a broader range (16ndash28degC)for germination and appressorium formation the latter beingstimulated by low temperatures
(1) Mean daily(2) mean nightlyc(3) maximum(4) minimum temperature
Diurnal temperaturerange (DTR)
(Loacutepez-Bravo et al 2012Avelino et al 2015)
Lower diurnal temperature range favors CLR infection and reducesthe latent period of infection
(1) Diurnal temperature range(DTR)
Light (Rayner 1961 Bock 1962Nutman et al 1963)
Light has a retarding but not inhibiting effect on sporegermination Germination is favored by darkness (eg at night)but can also occur during the day in dependence of rainfall andtemperature
-
Humidity (RH) andrainfall
(Rayner 1961 Bock 1962Nutman et al 1963Kushalappa 1982)
The presence and duration of liquid water is essential for CLRgermination and infection Rainfall plays a role in wetting theundersurface of coffee leaves and in spore dispersal
(1) Relative humidity (RH)(2) Dew point (DP)(3) Number of hours with
temperatures below DP atnightcd
(4) Number of hours with RHabove 95 at nightcd
Leaf wetness (Avelino et al 2004 Loacutepez-Bravo et al 2012)
Higher leaf wetness frequencyduration favors CLR intensity
aBased on Avelino et al (2004)bFor each monitoring date the mean of the 4-weeks interval (counting backwards from the monitoring date) was extracted Given a latent period of approximatelythree weeks (Leguizamoacuten 1983) and incubation period of four to seven weeks (Rayner 1961) the four-week interval was considered as reasonable
cIn East Africa infection processes occur between 10 pm and 8 am (Rayner 1961) therefore some variables representing the night time hours were extracteddBased on an empirical model (Rowlandson et al 2015) leaf wetness duration is equal to the number of hours in which the RH (measured 15ndash20 m above theground) is equal or greater than 90
JOURNAL OF PLANT INTERACTIONS 409
Results
(i) Characterization of seasonal variations of microclimateand CLR
Microclimatic variables and time periods related to CLRmax
are shown in Table 4 Results of the selection process areshown in detail in S3a-b of the supporting information
Figure 3 shows the seasonal patterns of selected microcli-matic indicators grouped by altitude range and coffee systemThe mean night time temperature (TempN) differed between
the three coffee systems in the period between May andSeptember It was lowest in coffee-tree (CT) at low incoffee-banana (CB) at mid and in coffee open canopy (CO)at high altitudes The diurnal temperature range (DTR) washigher in CO systems in all altitudes but less pronouncedin the low altitude range The dew point temperature (DP)at low altitude was constantly lower in CO systems over theseason At mid-altitude the mean DP over the season waslower in CT systems while differences were marginal athigh altitudes The number of night hours with relativehumidity gt95 (RH95) in CO systems was lowest at low
Table 3 Recorded explanatory and response variables used in the structural equation model
Initial availablerecorded variables Retained explanatoryresponse variables Description
Topoclimatea Altitude (masl)Slope (deg)Slope aspect (deg)
Explanatory Altitude class (Alt) Key variables of climate and topography were subjected to a clusteranalysis The determinant variable was altitude with the remainingvariables being correlatedLow lt 1400 maslMid = 1400ndash1700 maslHigh gt 1700ndash2200 masl
Vegetationstructure
No of shade treeshaNo of shade treespeciesNo of banana matshaCanopy closure ()
Explanatory Typology of coffeeshading system (CS)
Clustering of the vegetation structure of coffee plots resulted in threedifferent coffee shading systems classified asCB = Coffee-banana systemCO = Coffee open canopy systemCT = Coffee-tree systemwhereas the CO system shows the lowest and the CT system highestshade levels (Table 1)
Microclimate Temperature (degC)Relative humidity()
ExplanatoryResponse
Non-correlatedmicroclimaticindicatorsb
Diseaseindicator
CLR incidence Response Maximum CLRincidence ()(CLRmax)
c
The maximum disease incidence (mean per plot) of the season (CLRmax)Monitoring dates (1) MarchApril (2) MayJune (3) JulyAugust (4)September (5) OctoberNovember (6) January (7) February
aTopographic variables (altitude slope and slope aspect) of the study area were generated from a digital elevation model (90 m DEM) of the shuttle radar topographymission
bMicroclimatic indicators resulting from the selection procedure described in the subsequent data analysis sectioncThe maximum incidence of the season was reported to be a good indicator of epidemic intensity (Kushalappa and Chaves 1980 Silva-Acuntildea and Zambolim 1999Avelino et al 2006)
Figure 2 A priori conceptual model (based on literature review Supporting Information S2) of the possible underlying relationships between components of theenvironment coffee shading system microclimatic indicators coffee productivity and coffee pests and diseases Ovals represent latent constructs (unobserved vari-ables) and boxes manifest (observed) variables Endogenous constructs (dependent variables) are indicated by η and exogenous (independent variables) by ξ Num-bers 1ndash27 refer to literature references Arrows indicate the directional relationships between latent constructs representing individual paths to be modeled in thepiecewise SEM approach Grey shaded fields show the variables used in the subsequent piecewise SEM The indicated sub-system shows the relation between topo-climate and coffee system both characterized by a set of observed variables modifying the environment for coffee pests and diseases either directly andor indirectlyvia microclimate
410 T LIEBIG ET AL
altitude and highest at high altitudes while at mid altitudes itwas highest in CB systems
Figure 4 shows the CLR disease process of the 20152016growing season as a sigmoid-shaped growing curve typicalfor a polycyclic epidemic At low and mid altitudes symp-toms appeared approximately two months after the rainy sea-son (JuneJuly) when newly grown leaves were fullydeveloped An exponential increase in CLR incidence fol-lowed across the short dry spell around AugustSeptemberand the second rain flush in OctoberNovember peaking inthe main dry season during December until February The
amount of disease at low and mid altitudes was similarlyhigh while the incidence was lower at high altitudes whereCLR developed after the second rainy season The CLR inci-dence in the different systems did not differ at low altitudesAt mid and high altitudes there was a downward gradient ofdisease incidence from CB to CO and CT systems
(ii) Formulation of piecewise structural equation model(SEM)
The piecewise SEM was fitted to infer the effects of theselected microclimatic variables the altitude class andcoffee system on the maximum CLR incidence Each com-ponent model corresponding to the five response variablesie the four selected microclimatic variables (Table 4) andCLRmax represented one path Two DP (MayndashNov) DTR(SeptndashOct) of the four response functions for the microcli-matic variables were significant paths (p lt 05) The list ofcomponent models consisted of three equations
CLRmax Alt cat x CS+ DP MN + DTR SO (1)
DP MN Alt cat x CS (2)
Table 4 Selected microclimatic variables
Selected microclimatic variablesa Selected time periodsb
Night temperature (TempN)c JulyndashSeptemberd
Dew point temperature (DP)e MayndashNovemberNumber of night hours with RH gt 95 (RH95)c SeptemberndashNovemberDiurnal temperature range (DTR)e SeptemberndashNovemberaVariable selection based on literature review (Table 2)bRemaining variables and time periods excluding highly correlated predictorscMeans per nightdTime periods within a variable of microclimate were autocorrelated and hencewere combined to one variable for the piecewise structural equation model(eg dew point temperature of the four time periods were used as themean dew point temperature for the period between MayndashNovember)
eMeans per day (24 h)
Figure 3 Microclimatic indicators over the 20152016 growing season Variables represent monthly means with standard errors CB = Coffee-banana system CO =Coffee open canopy system CT = Coffee-tree system Altitude ranges were low (1100ndash1400 masl) mid (1400ndash1700 masl) and high (1700ndash2200 masl) Loggers withmissing data were excluded
JOURNAL OF PLANT INTERACTIONS 411
DTR SO Alt cat+ CS (3)
where CLRmax is the maximum disease incidence Alt_cat thealtitude category CS the coffee shading system DP_MN theaverage dew point temperature of MayndashNov and DTR_SOthe average diurnal temperature range of SeptndashOct CLRmax
was fitted as a generalized linear model with a negative bino-mial distribution with DP_MN and DTR_SO as linear models
The piecewise SEM (p gt 05 Fisherrsquos C AIC = 5901)showed interactive direct and indirect effects of the altitudeclasses and coffee systems on CLRmax (Figure 5) CLRmax
was predicted to be lower in CT systems (β =minus300156p lt 0001) but was also determined by an interacting effectof altitude and system Highest CLRmax were predicted inCO systems at low altitude but in CB systems at mid andhigh altitudes The average DP (MayndashNov) was higher atlow and mid compared to high altitudes (β = 31892p lt 0001 β = 14821 p lt 0001 respectively) and there wasa combined effect of altitudes and systems with lowest valuesin CO systems at low and in CT systems at mid altitudes (β =06929 p lt 05 and β =minus06220 p lt 05) The DTR was high-est in CO systems (β = 34354 p lt 0001) and lowest at midaltitudes (β =minus15199 p lt 05) The Model showed indirecteffects of altitude and coffee systems on CLRmax mediatedby the microclimatic variables DTR was negatively (β =minus02731 p lt 0001) and DP positively (β = 15577 p lt 001)related to CLRmax
Discussion
We have shown that the effects of the environment (altitude)and coffee shading system (shading) on CLR variability areeither direct interactive or indirectly mediated by key micro-climatic indicators Our case study on CLR illustrates anapproach also applicable to other (patho)- systems to describeinteractions in agroecosystems
Literature on microclimatic drivers shows that amongothers CLR development is dependent on variables relatedto the presence of liquid water and temperature (De Jonget al 1987 Avelino et al 2004 Loacutepez-Bravo et al 2012)The microclimatic indicators we identified as CLR drivers(dew point temperature (DP) and the number of hourswith RH gt 95 (RH95)) relate to dew formation We also
found temperature related variables especially the DTR tobe decisive for CLR A lower mean DTR results in shorterlatency periods because the temperature is closer to its opti-mum for infection processes (Waller 1982 Avelino et al2012 Loacutepez-Bravo et al 2012) Night temperatures alsoaffect CLR epidemics Since germination is favored by dark-ness (Bock 1962 Nutman et al 1963) most infectionsoccur at night (Rayner 1961)
It is well established which main factors drive CLR epi-demics However few studies have investigated how those
Figure 4 CLR disease process curves of the 20152016 growing season The curves represent the average CLR incidence per monitoring date (n = 49) grouped byaltitude range and coffee shading system CB = Coffee-banana system CO = Coffee open canopy system CT = Coffee-Tree system Altitude ranges were low (1100ndash1400 masl) mid (1400ndash1700 masl) and high (1700ndash2200 masl)
Figure 5 Final path model selected through the piecewise SEM procedure Solidblack arrows show positive solid red arrows negative paths The standardizedcoefficient for each path from the individual models are illustrated Referencecategories (data not shown) for the coffee shading system and altitude rangeare CB and high altitude Crosses indicate an interacting effect of two categoriesShipleyrsquos test of d-separation was used to estimate the overall fit of the model(chi-squared test on the Fisherrsquos C statistic results in P gt 05 if no paths are miss-ing) CT = Coffee-Tree system CO = Coffee-Open system Alt = Altitude rangelow (1100ndash1400 masl) mid (1400ndash1700 masl) DTR_SO = Diurnal TemperatureRange (September-October 2015) DP_MN = Average Dew Point temperature(MayndashNovember 2015) CLR_max = the maximum disease incidence
412 T LIEBIG ET AL
microclimatic drivers themselves vary in space and time andhow this in turn would be related to CLR We showed thatmicroclimatic indicators varied as a function of the seasonaltitude and the coffee shading system At higher altitudeshumidity indicators decreased in the systems with highestshade (CT) compared to the lowest shade density and diver-sity (CB and CO) This contradicts the widely-acceptednotion of higher moisture and leaf wetness in shaded versusnon-shaded systems (Barradas and Fanjul 1986 Beer et al1998 Morais et al 2006) The consistently highest DTRvalues of CO systems agreed with reports of existing literature(Barradas and Fanjul 1986 Lin 2007) However while differ-ences at low altitudes were negligible they strongly increasedwith altitude
The variability of microclimatic variables across altitudinalgradients shading systems and seasons can be explained byprocesses of surface energy fluxes (Shuttleworth 2012) Dewformation is driven by the interplay between air moisturetemperature variations and cooling of plant surfaces via radi-ation (Xiao et al 2013) This in turn is influenced by cloudi-ness wind speed soil water content and water vapor pressureand hence by altitude and vegetation cover (Linacre 1982 Daiet al 1999) Diurnal fluctuations are extreme at high altitudesand under sun-exposed conditions The reduced atmosphericpressure causes higher maximum and lower minimum temp-eratures due to rapid insolation and reduced radiation(Linacre 1982 Mani 2013) Clouds as well as shade treecover buffer these effects which on the one hand results ina lower DTR in shaded systems (Dai et al 1999) but alsoreduced night-time radiation (Morais et al 2006) and henceless dew formation In contrast reduced minimum or nighttemperatures in unshaded systems increase the nocturnalsoil emissivity and hence dew formation Those dynamicsare furthermore altered by the seasons Changes in solar radi-ation precipitation and cloudiness imply a seasonality in sur-face energy fluxes and hence microclimate (Dai et al 1999Xiao et al 2013) Our data also show these seasonal effectsDTR was lowest and DPRH95 was highest during therainy seasons (AprMay and OctNov) when cloud coverwas high
Differences in microclimatic conditions driven by theenvironmental and seasonal context influence CLR dynamicsAt mid altitudes highest CLR incidence was found in CB sys-tems where DTR was low and DP high (Avelino et al 2015)The same reasoning applies for high altitudes although dis-ease incidence was low due to low mean temperatures Atlow altitudes differences between systems in both microcli-matic variability and CLR incidence were minor Our resultsagree with the findings of other studies where CLR wasreduced at high altitudes in highly diversified systems (Ave-lino et al 2006 Cerda et al 2016) CLR development wasalso related to the seasonal changes of microclimate Themicroclimate differed between altitude ranges and systemsduring the rainy seasons In the first season this may beless important because leaves that are not fully developedare resistant to infection (Eskes 1982) In addition fruitloads positively related to CLR severity (Avelino et al2006) are low during this time Leaf susceptibility growswith fruit growth (Kushalappa and Chaves 1980) thereforemicroclimatic conditions during the second rainy seasonmight be decisive In coffee-growing regions with a pro-nounced dry season such as in our study area the residualinoculum is minimized by the shedding of diseased leaves
and lack of new infections (Bock 1962) However in areaswithout a clear dry season microclimatic conditions mightinfluence the inter-seasonal survival of rust spores and diseasebuilt-up in the subsequent season (Waller 1982)
The mediated effects of the environment and coffee shad-ing system through the local microclimate on CLR are funda-mental They co-occur however as shown in our conceptualmodel (Figure 2) with a diversity of other influencing factorsThough not addressed in the present study they are concep-tually incorporated within the piecewiseSEM The altituderange and the shading system are latent constructs thereforetheir direct and interacting effects must be mediated throughfurther mechanisms and variables one way or the other
Our results validate approaches of other studies thatshowed how production situations (the ecological technicalsocial economic context of agricultural systems (Rabbingeand De Wit 1989)) and crop management are linked tocrop health and that they can be considered as proxies formicroclimate (Avelino et al 2004 Savary et al 2017) Thisis not only important for pests and diseases in coffee-basedbut also other tropical agroecosystems that form hetero-geneous mosaics of small thermal microhabitats (Potteret al 2013) The impact of micro-environments on crophealth are understudied and their ecological relevance under-stated (Stigter 2015) This is especially relevant in the contextof adaptation to climate change
Acknowledgements
The authors thank Dr Laurence Jassogne Dr Christian Cilas Wilber-force Wodada Alessandro Craparo Eric Rahn David Mukasa and GilGram for their contribution The authors especially thank the participat-ing farmers for providing their fields for this research The authorsapplied the FLAE (first-last-author-emphasis) and SDC (sequence-determines-credit) approach to define the sequence of authors
Disclosure statement
No potential conflict of interest was reported by the authors
Funding
This research was supported by the German Bundesministerium fuumlrWirtschaftliche Zusammenarbeit und Entwicklung (BMZ) It wasimplemented as part of the CGIAR Research Program on ClimateChange Agriculture and Food Security (CCAFS) which is carried outwith support from CGIAR Fund Donors and through bilateral fundingagreements For details please visit httpsccafscgiar orgdonors Theviews expressed in this document cannot be taken to reflect the officialopinions of these organizations
Notes on contributors
Theresa Liebig is an agricultural biologist who has been working oncoffee-based agroforestry systems in Latin America and East Africa atthe International Center for Tropical Agriculture (CIAT) and the Inter-national Institute of Tropical Agriculture (IITA) since 2012 Sheobtained her PhD at the University of Hanover Germany working oncoffee pests and diseases in East Africa
Fabienne Ribeyre is an agronomist who obtained a doctorate in appliedmathematics from the University of Montpellier France with her workon sampling of Coffee Berry Borer Since 2001 she has been working atthe Agricultural Research Centre for Development (CIRAD) She is nowdeputy director of a research unit working on epidemiology of pests anddiseases affecting perennial crops
Peter Laumlderach holds an MSc in Geography and a PhD in Tropical Agri-culture He is currently the theme leader for Climate Change at the
JOURNAL OF PLANT INTERACTIONS 413
International Center for Tropical Agriculture (CIAT) He led for CIATover the last 10 years the expansion of the Decision and Policy Analysis(DAPA) Research Area to Central America East Africa and SoutheastAsia
Prof Dr Hans-Michael Poehling is an entomologist and former mana-ging director of the Department of Phytomedicine at the Institute ofHorticultural Production Systems of the University of HanoverGermany His work mainly focused on integrated pest managementand climate change effects on aphids and thrips
Piet Van Asten holds a PhD in agronomy from Wageningen Universityand worked for the CGIAR from 1998 to 2016 as a scientist on sustain-able intensification of agriculture systems He is now head of agronomyof coffee at Olam aiming to develop adapt and apply approaches thatimprove the productivity profitability and sustainability of Olamrsquoscoffee plantations
Jacques Avelino is a plant pathologist from CIRAD He holds a PhDfrom the University of Orsay Paris XI France and has been workingon coffee rust since 1986 He is currently posted at CATIE CostaRica and is involved in an EU project on the development of a regionalnetwork of early warning systems for coffee rust
ORCID
Theresa Liebig httporcidorg0000-0002-8160-0539
References
Allinne C Savary S Avelino J 2016 Delicate balance between pest anddisease injuries yield performance and other ecosystem services inthe complex coffee-based systems of Costa Rica Agric EcosystEnviron 2221ndash12
Avelino J Cristancho M Georgiou S Imbach P Aguilar L BornemannG Laumlderach P Anzueto F Hruska AJ Morales C 2015 The coffeerust crises in Colombia and Central America (2008ndash2013) impactsplausible causes and proposed solutions Food Secur 7303ndash321
Avelino J Muller RA Cilas C Velasco Pascual H 1991 Deacuteveloppementet comportement de la rouille orangeacutee du cafeacuteier (Hemileia vastatrixBerk et Br) dans des plantations en cours de modernisation planteacuteesde varieacuteteacutes naines dans le sud-est du Mexique Cafeacute cacao theacute3521ndash42
Avelino J Romerogurdiaacuten A Cruz-cuellar HF Declerck FAJ 2012Landscape context and scale differentially impact coffee leaf rustcoffee berry borer and coffee root-knot nematodes Ecol Appl22584ndash596
Avelino J Ten Hoopen GM DeClerck F 2011 Ecological mechanismsfor pest and disease control in coffee and cacao agroecosystems ofthe neotropics In Rapidel B Le Coq J Beer J editors Ecosystem ser-vices from agriculture and agroforestry measurement and paymentLondres Earthscan Publications p 91ndash117
Avelino J Willocquet L Savary S 2004 Effects of crop management pat-terns on coffee rust epidemics Plant Pathol 53541ndash547
Avelino J Zelaya H Merlo A Pineda A Ordontildeez M Savary S 2006 Theintensity of a coffee rust epidemic is dependent on production situ-ations Ecol Modell 197431ndash447
Barradas VL Fanjul L 1986 Microclimatic characterization of shadedand opengrown coffee (Coffea arabica L) plantations in MexicoAgric For Meteorol 38101ndash112
Beer J Muschler R Kass D Somarriba E 1998 Shade management incoffee and cacao plantations Agrofor Syst 38139ndash164
Bock KR 1962 Seasonal periodicity of coffee leaf rust and factors affect-ing the severity of outbreaks in Kenya Colony Trans Br Mycol Soc45289ndash300
Boreux V Kushalappa CG Vaast P Ghazoul J 2013 Interactive effectsamong ecosystem services and management practices on crop pro-duction Pollination in coffee agroforestry systems Proc Natl AcadSci U S A 1108387ndash8392
Bosselmann AS Dons K Oberthur T Olsen CS Raeligbild A Usma H2009 The influence of shade trees on coffee quality in small holdercoffee agroforestry systems in Southern Colombia Agric EcosystEnviron 129253ndash260
Boudrot A Pico J Merle I et al 2016 Shade effects on the dispersal of air-borne Hemileia vastatrix Uredospores Phytopathology 106572ndash580
Cerda R Allinne C Gary C Philippe T Harvey CA Krolczyk L MathiotC Cleacutement E Aubertot J-N Avelino J 2016 Effects of shade altitudeand management on multiple ecosystem services in coffee agroeco-systems Eur J Agron 82308ndash319
Cerda R Avelino J Gary C Tixier P Lechevallier E Allinne C 2017Primary and secondary yield Losses caused by pests and diseasesassessment and modeling in coffee PLoS One 121ndash17
Dai A Trenberth KE Karl TR 1999 Effects of clouds soil moisture pre-cipitation and water vapor on diurnal temperature range J Clim122451ndash2473
De Jong EJ Eskes AB Hoogstraten JGJ Zadoks JC 1987 Temperaturerequirements for germination germ tube growth and appressoriumformation of urediospores of Hemileia vastatrix Neth J Plant Path9361ndash71
Eskes A 1982 The use of leaf disk inoculations in assessing resistance tocoffee leaf rust Neth J Plant Path 88127ndash141
Grace JB 2006 Structural equation modeling and natural systemsCambridge Cambridge University Press
Holden ZA Klene AE Keefe R F Moisen G G 2013 Design and evalu-ation of an inexpensive radiation shield for monitoring surface airtemperatures Agric For Meteorol 180281ndash286
Jha S Bacon CM Philpott SM Rice RA Meacutendez VE Laumlderach P 2011 Areview of ecosystem services farmer livelihoods and value chains inshade coffee agroecosystems In Bruce Campbell W Ortiacutez S Loacutepez edi-tors Integrating agriculture conservation and ecotourism examples fromthe field Dordrecht Springer Science amp Business Media p 141ndash208
Kushalappa AC 1982 Calculation of apparent infection rate in plantdiseases development of a method to correct for host growthPhytopathology 721373
Kushalappa AC Chaves GM 1980 An analysis of the development ofcoffee rust in the field Fitopatol Bras 595ndash103
Lefcheck JS 2016 piecewiseSEM piecewise structural equationmodelling inr for ecology evolution and systematics Methods Ecol Evol 7573ndash579
Leguizamoacuten J 1983 Contribution agrave la connaissance de la reacutesistanceincomplegravete du cafeacuteier agrave Hemileia vastatrix Berk et Br [PhD thesis]Montpellier ENSA
Lemmon PE 1957 A new instrument for measuring forest overstorydensity J For 55667ndash668
Lin BB 2007 Agroforestry management as an adaptive strategy againstpotential microclimate extremes in coffee agriculture Agric ForMeteorol 14485ndash94
Linacre E 1982 The effect of altitude on the daily range of temperature JClimatol 2375ndash382
Loacutepez-Bravo DF Virginio-Filho EDM Avelino J 2012 Shade is condu-cive to coffee rust as compared to full sun exposure under standar-dized fruit load conditions Crop Prot 3821ndash29
Mani MS 2013 Ecology and biogeography of high altitude insects TheHague Springer Science amp Business Media
Matovu JR Kangire A Kabole C et al 2013 Resistance to coffee leaf rust(Hemileia vastatrix Berk and Broome) among Arabica coffee geno-types in Uganda Afr Crop Sci Conf Proc 11221ndash226
McCook S 2006 Global rust belt Hemileia vastatrix and the ecological inte-gration of world coffee production since 1850 J Global Hist 1177ndash195
Morais H Caramori PH De Arruda Ribeiro AM Gomes JC KoguishiMS 2006 Microclimatic characterization and productivity of coffeeplants grown under shade of pigeon pea in Southern Brazil PesquAgropecu Bras 41763ndash770
Muschler RG 2004 Shade management and its effect on coffee growthand quality In Wintgens J editor Coffee growing processing sus-tainable production a guidebook for growers processors tradersand researchers Weinheim Wiley-VCH p 391ndash418
Nutman FJ Roberts FM Clarke RT 1963 Studies on the biology ofHemileia vastatrix Berk amp Br Trans Br Mycol Soc 4627ndash44
Potter KA Arthur Woods H Pincebourde S 2013 Microclimatic chal-lenges in global change biology Glob Change Biol 192932ndash2939
Pumarintildeo L Sileshi GW Gripenberg S et al 2015 Effects of agroforestryon pest disease and weed control A meta-analysis Basic Appl Ecol16573ndash582
Rabbinge R De Wit C 1989 Systems models and simulation In VanLaar HH editor Simulation and systems management in crop protec-tion Wageningen Pudoc p 3ndash15
Rahn E Liebig T Ghazoul J van Asten P Laumlderach P Vaast P SarmientoA Garcia C Jassogne L 2018 Opportunities for sustainable intensifi-cation of coffee agro-ecosystems along an altitudinal gradient on MtElgon Uganda Agric Ecosyst Environ 26331ndash40
414 T LIEBIG ET AL
Rayner RW 1961 Germination and penetration studies on coffee rust(Hemileia vastatrix B amp Br) Ann Appl Biol 49497ndash505
Rowlandson T Gleason M Sentelhas P Gillespie T Thomas CHornbuckle B 2015 Reconsidering leaf wetness duration determi-nation for plant disease management Plant Dis 99310ndash319
Savary S McRoberts N Esker PD Willocquet L Teng PS 2017Production situations as drivers of crop health evidence and impli-cations Plant Pathol 66(6)867ndash876
Shipley B 2000 A new inferential test for path models based on directedacyclic graphs Struct Equ Model 7206ndash218
Shuttleworth WJ 2012 Surface energy fluxes In Terrestrial hydrome-teorology Chichester Wiley p 36ndash47
Silva-Acuntildea R Zambolim L 1999 Incidence-severity relationships in thepathosystem Coffea arabica-Hemileia vastatrix Plant Dis 83186ndash188
Staver C Guharay F Monterroso D Muschler RG 2001 Designing pest-suppressive multistrata perennial crop systems shade-grown coffee inCentral America Agrofor Syst 53151ndash170
Stigter KCJ 2015 Agroforestry and (micro) climate change In Ong CKeditor Tree-crop interactions agroforestry in a changing climateWallingford CABI p 119ndash145 University of Nottingham Malaysia
Teodoro AV Sousa-Souto L Klein A-M Tscharntke T 2010 Seasonalcontrasts in the response of coffee ants to agroforestry shade-treemanagement Environ Entomol 391744ndash1750
Vaast P Bertrand B Perriot J-J Guyot B Geacutenard M 2006 Fruit thinningand shade improve bean characteristics and beverage quality of coffee(Coffea arabica L) under optimal conditions J Sci Food Agric86197ndash204
Wagenet RJ 1998 Scale issues in agroecological research chains NutrCycl Agroecosyst 5023ndash34
Waller JM 1982 Coffee rust-epidemiology and control Crop Prot1385ndash404
Xiao H Meissner R Seeger J Rupp H Borg H Zhang Y 2013 Analysisof the effect of meteorological factors on dewfall Sci Total Environ452ndash453384ndash393
JOURNAL OF PLANT INTERACTIONS 415
- Abstract
- Introduction
- Material and methods
-
- Study area
- Plot selection and characterization
- Data acquisition
- Explanatory and response variables
- Data analysis
-
- Results
- Discussion
- Acknowledgements
- Disclosure statement
- Notes on contributors
- ORCID
- References
-
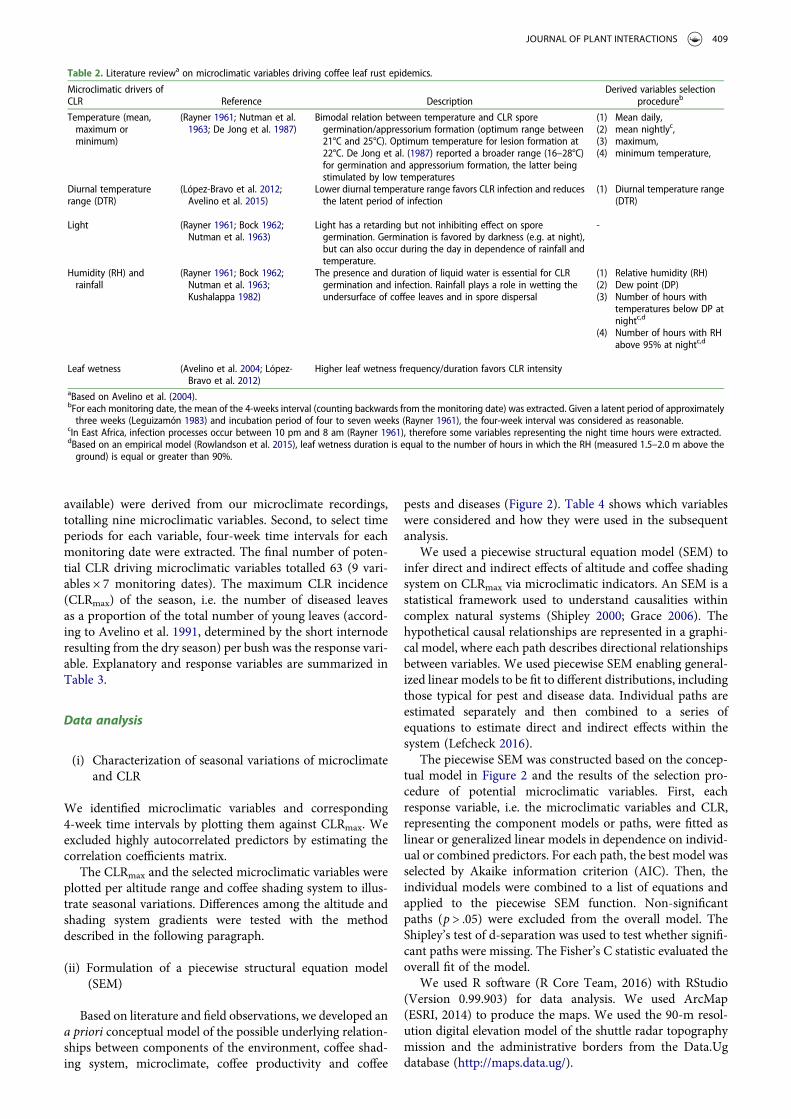