interactive laboratory activities for secondary education - worcester
TRANSCRIPT

1
2010
Interactive Laboratory Activities for Secondary Education:
Teacher Manual
Developed by: Todd Alexander Hannah Israel Sarah Lax Pokchat Lohaphansomboon David Saxner Thanida Srisawasdi
Office of Her Royal Highness Princess Maha Chakri Sirindhorn’s Projects
i
Table of Contents Introduction .................................................................................................................................................. 1
Seasons Modeling ......................................................................................................................................... 2
Gravity is a Hammer .................................................................................................................................... 11
What’s in My Food? .................................................................................................................................... 18
Precipitation Reactions ............................................................................................................................... 34
The Colors of the Sun .................................................................................................................................. 43
References .................................................................................................................................................. 51
1
Introduction The laboratory activities included in this manual were developed as part of a project sponsored
by the Office of Her Royal Highness Princess Maha Chakri Sirindhorn’s Projects, Chulalongkorn
University, and Worcester Polytechnic Institute. The subjects covered include: Astronomy, Physics,
Chemistry, and Biology. All materials used in these activities are inexpensive and easily obtained. The
activities were designed to promote student engagement, interaction in the classroom, and critical
thinking skills. These activities were developed and conducted at the Baan Na Yao School and proven
effective. The laboratory activities can be incorporated into any upper secondary education classroom
throughout Thailand.

“Seasons Modeling” Activity
2
Seasons Modeling
Adapted from “The Seasons Explained by Refutational Modeling Activities.”(Frede, 2008)
Teacher Preparation Begin by reading through the background with the class and having a thorough
discussion to insure that they understand the material. The students are provided the same
background information that you are, but it is important to cover the information in class to
insure they have a complete understanding of the subject matter. After the discussion, have the
students complete the pretest independently. They are allowed to use the background as a
reference while taking the test. The pre test is intended to measure how well the students’
understood the background material as well as measure their previous knowledge of the subject
area.
To conduct the laboratory activity, split the students into groups of 3-4 and provide each
group with the materials required to complete the laboratory activity. Read through the procedure
aloud so that all the students know what they need to do. While the students are conducting the
laboratory activity periodically check in with each group to assist if they have questions.
Once all the groups have completed the activity the students should individually take the
post test. The post test is intended to gauge how much the learned from the activity. The students
are allowed to use the background as a reference while taking the post test.

“Seasons Modeling” Activity
3
Concepts Seasons
Earth’s revolution around the Sun
Background Seasons result from the yearly revolution of the Earth around the Sun and the tilt of the
Earth’s axis relative to the plane of revolution. In the temperate and polar regions, the seasons
are marked by changes in the intensity of sunlight that reaches the Earth’s surface, which
generate four seasons: spring, summer, autumn, and winter. In the tropical and subtropical areas,
there are three seasons: hot, rainy, and cool.
The 23.5° obliquity of the Earth’s rotational axis to its orbital plane.
The earth’s axis is tilted to its orbital plane by an angle of approximately 23.5°, which
makes the Northern and Southern Hemispheres have opposite seasons. The Earth goes around its
orbit so that the Northern Hemisphere is at various times oriented more toward and more away
from the Sun. Therefore, the Sun rises higher in the sky and is above the horizon longer, so the
rays of the Sun strike the ground more directly. Likewise, in the Northern Hemisphere in winter,
the hemisphere is oriented away from the Sun, the Sun only rises low in the sky, is above the
horizon for a shorter period, and the rays of the Sun strike the ground more obliquely. The
seasons in the Southern Hemisphere are determined from the same reasoning, except that they
are out of phase with the Northern Hemisphere seasons because when the Northern Hemisphere
is oriented toward the Sun the Southern Hemisphere is oriented away, and vice versa.
Seasons in the Northern Hemisphere
“Seasons Modeling” Activity
4
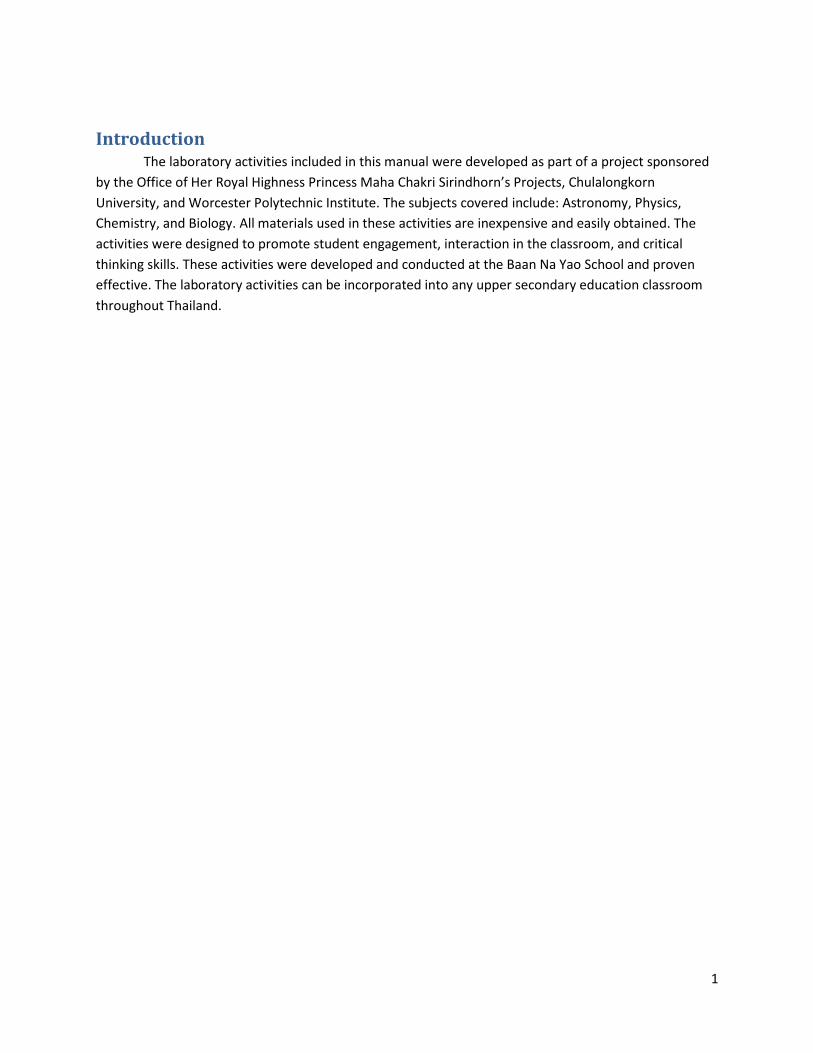
Seasons in the Southern Hemisphere
The elliptical orbit of the Earth can cause seasonal differences between hemispheres.
Thus, the Earth orbits closest to the Sun in January and is farthest from the Sun in July. The
changes in the amount of sunlight will affect seasonal weather in temperate and polar zones,
while there is no noticeable change in the amount of sunlight in the tropical zone.
The flux of solar energy to the Earth.
The hemisphere which is tilted toward the Sun receives a greater flux of solar energy than
the hemisphere tilted away, resulting in higher temperatures. For example, the North Pole will be
dark and the South Pole will be illuminated in the picture above. The effect of incidence angle on
solar flux is well-known to everyone, since the day is warmest when the Sun is overhead and
then cools as the Sun nears the horizon.

“Seasons Modeling” Activity
5
Materials 1. Light source (can be a light bulb or flashlight depending upon the lighting situation in the
room) 1 per group
To stimulate night and day on earth.
2. Ball 1 per group
Represents the earth.
3. String 2 or 3 per group
Will be placed on a parallel of the earth.
Divided into 24 equal segments representing the 24 time zones.
4. 1 Box per group with a hand sized hole cut out of the top
Only needed if the classroom cannot be made sufficiently dark for a light bulb to
effectively portray day and night on the globe.
Student Procedure 1. Come up with your own hypothesis. Which parameter can cause the different seasons?
_____________________________________________________________________
2. Model and observe the four hypotheses that will explain the seasons.

“Seasons Modeling” Activity
6
Model of the distance dependence with no consideration for the tilt of the
Earth. To model this hypothesis you need to keep the Earth perpendicular to floor
and have the Earth circle the sun in an elliptical orbit.
Model without factoring in the tilt of the Earth. To model this hypothesis you
need to keep the Earth perpendicular to floor and have the Earth circle the sun in a
circular orbit.
“Seasons Modeling” Activity
7
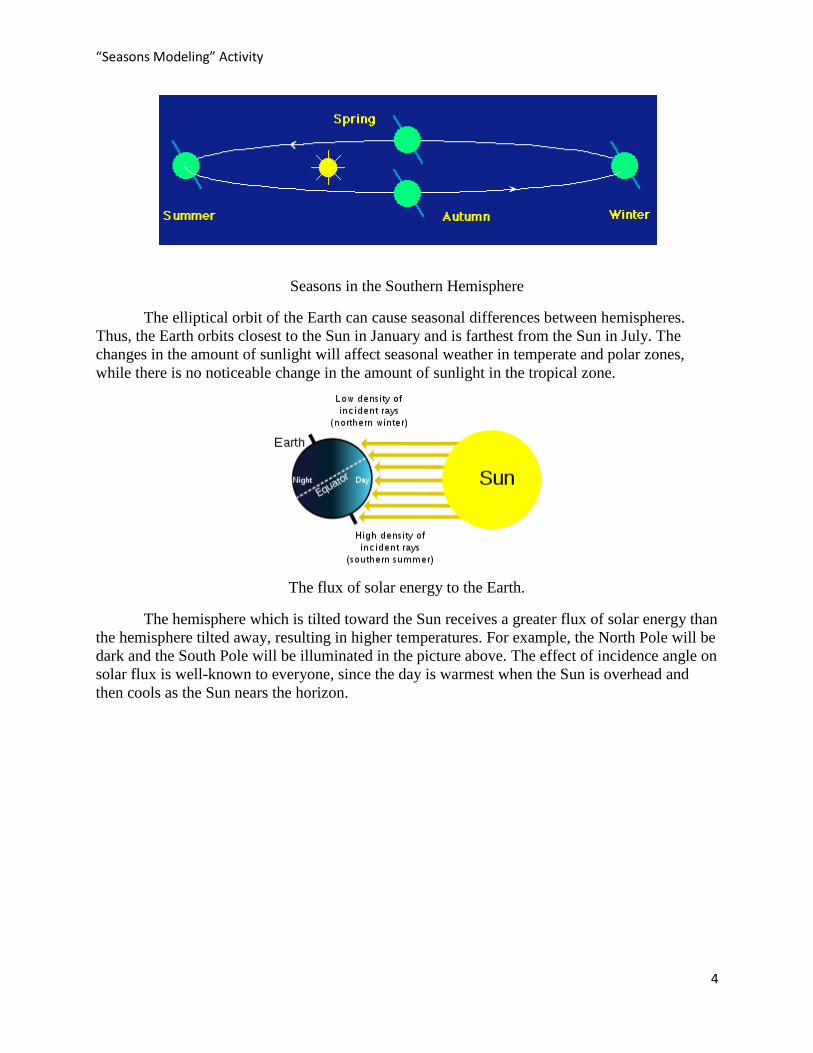
Model oscillatory movement of the Earth’s axis. Rotate the Earth around the
Sun in a circular orbit. Keep the poles at a 23.5 degree tilt from the perpendicular
to the floor and have the North Pole constantly pointed away from the Sun.
Model a constant tilt of the Earth’s axis. Rotate the Earth around the Sun in a
circular orbit. Keep the poles at a 23.5 degree tilt from the perpendicular to the
floor and have the North Pole constantly facing the same direction.
3. Discuss to find arguments for supporting or refuting the each modeling hypotheses.

“Seasons Modeling” Activity
8
Pre Test Choose the correct answer
1. What is the tilt of the Earth’s axis in degree?
A. 22
B. 22.5
C. 23
D. 23.5
2. The different seasons that we observe each year are mainly due to:
A. The variation of distance between the Sun and the Earth.
B. The variation of tilt of the rotation axis of the Earth on orbit plane.
C. The constant tilt of the Earth’s rotation axis on the orbit plane.
D. The varied distances between the Earth, Moon, and Sun.
3. Seasons result from both revolution of the Earth around the Sun and the tilt of the Earth’s
axis relative to the plane of revolution. True
4. The seasons are caused by the elliptical path of the Earth around the Sun. False
5. The Northern and Southern Hemispheres have opposite seasons because the earth’s axis
is tilted to its orbital plane. True
6. Earth’s rotation takes one year and that it revolves around the Sun in 24 hours. False
7. There is no significance between the distances from the Sun to the Earth to the seasons.
True
8. The hemisphere which is tilted toward the Sun receives a greater flux of solar energy than
the hemisphere tilted away. True

“Seasons Modeling” Activity
9
Worksheet Answer the following questions
1. Explain why it is hotter in summer and it is colder in winter.
As a result of the Earth’s tilt, that hemisphere is receiving more sunlight in the
summer when the pole is facing the sun.
2. If you change the distance between the Sun and the Earth, does it act on the parameter in
the expected way?
Nothing happens because the variation in distance from the sun has very little
effect compared to the effect of changes in the angle of incoming sunlight (tilt of the
earth’s axis).
3. If you change the tilt of the earth, does it act on the parameter in the expected way?
If the tilt of the earth is greater than 23.5°, the Southern Hemisphere will be
hotter in summer and colder in winter. If the tilt of the earth is less than 23.5°, the
Northern Hemisphere will be hotter in summer and colder in winter.
4. If the Earth’s axis is not tilted, what will happen to the seasons?
The seasons in the Northern and Southern Hemispheres would be the same.
5. What are the parameters that effect different seasons each year?
The earth’s orbit around the sun and the tilt of the earth’s axis.

“Seasons Modeling” Activity
10
Post Test 1. What is the tilt of the Earth’s axis in degrees?
A. 22
B. 22.5
C. 23
D. 23.5
2. The different seasons that we observe each year are mainly due to:
A. The variation of distance between the Sun and the Earth.
B. The variation of tilt of the rotation axis of the Earth on orbit plane.
C. The constant tilt of the Earth’s rotation axis on the orbit plane.
D. The variation distances between Earth, the Moon, and the Sun.
3. Seasons result from both revolution of the Earth around the Sun and the tilt of the Earth’s
axis relative to the plane of revolution. True
4. The seasons are caused by the elliptical path of the Earth around the Sun. False
5. The Northern and Southern Hemispheres have opposite seasons because of the earth’s
axis is tilted to its orbital plane. True
6. Earth’s rotation takes one year and that it revolves around the Sun in 24 hours. False
7. There is no significance between the distances from the Sun to the Earth to the seasons.
True
8. The hemisphere which is tilted toward the Sun receives a greater flux of solar energy than
the hemisphere tilted away. True
9. The changes in the intensity of sunlight that reaches the Earth’s surface cause 3 seasons
in the temperate and polar regions False
10. Days are longer in summer than in winter in Thailand because:
A. The rotation axis oscillates from +23.5° in summer to -23.5° in winter on the
perpendicular to the orbit plane.
B. The Earth is closer to the Sun in summer.
C. The Earth has a tilted rotation axis of 90° on the orbit plane.
D. The Earth has a tilted rotation axis of 23.5° on the perpendicular to the orbit plane.

“Gravity is a Hammer” Activity
11
Gravity is a Hammer Adapted from “If I had a Hammer”(Hutton, 2009)
Teacher Preparation The first step in this laboratory activity is to read through and discuss the background
with the students. It is important to have a class discussion of the topics to get the students
thinking about the physics involved. Once that discussion is concluded, administer the pretest to
each student. They should be working individually and are allowed reference to the background
during this test. It is just meant to take a measure of their knowledge of the subject prior to the
laboratory activity.
Once the students have completed the pretest split them into groups of 3-4 and hand out
all of the student materials to each group. Read through the procedure aloud with the class and
make sure that everyone understands what they need to do. During the experiment walk around
the classroom to aid when necessary if the students get confused or distracted.
After the students have completed the lab experiment and finished all of the analysis
charts, administer the post test. This post test is also individual so that each student’s
understanding can be measured. The students may use the background and lab findings to
complete the post test.
Laboratory Preparation Before the lab prepare a set of supplies for each group. Each group will need: 1 nail, 1
block of foam, one water bottle, one piece of poster paper, and a ruler/meter stick. Each team
must also have access to a mass scale (one or two for the entire class will be sufficient). Cut the
papers ahead of time so that each group has either a tall piece or a short piece (either 40 x 43 cm
or 40 x 46.5 cm). Two different heights are used so that the students can compare results to
analyze. Label the height of the paper on each sheet. Also, assign each group a different volume
of water (either none, 75 mL, or 120 mL). The ideal set up for groups is shown in the Table
below.
Group Height of Paper Volume of Water in Bottle (mL)
1 43 0
2 43 75
3 43 120
4 46.5 0
5 46.5 75
6 46.5 120
If the class only has enough students for 5 groups, do not give any group both the largest
mass and taller height.
These heights and weights are only recommendations; other variables can be used if
desired. Other materials can be used in the place of foam as well in order to examine varied
frictional effects.

“Gravity is a Hammer” Activity
12
Concepts Newtonian Mechanics
Energy and Work
Background One of the most basic skills in carpentry is the ability to hammer nails. It is important to
understand the concepts behind this simple task so that you can be able to calculate the amount
of work used in hammering a nail. The work needed is defined as the amount of energy
transferred from the hammer to the nail in order to push the nail into the foam. These basic
concepts can be applied to any objects moving by force.
The basic concepts of Newtonian mechanics and energy can be used to form equations to
predict the amount of work needed to hammer the nail. Through this activity your team will use
the given materials to show the relationship between force and work. The necessary equations to
complete this laboratory activity are:
1. F=ma
2. W=∆E
3. W=Fd
4. KE=1/2 mv2
5. PE=mgh
6.
Equation 1 is Newton’s second law and explains the relationship between force, mass,
and acceleration. Equations 2 and 3 show that work is equal to both the change in energy of a
system and the force times the displacement of a moving object (This means that if you hit a nail
with a hammer and the nail does not move no work, was done on the nail). The 4th and 5th
equations illustrate the two types of energy possessed by the hammer, kinetic and gravitational
potential energy. Equation 6 shows the kinematic relationship between velocity, acceleration,
and distance. These relationships will be used to calculate the impact force of the hammer on the
nail. In the case of this experiment the hammer will be represented by a mass you will drop on
the nail.

“Gravity is a Hammer” Activity
13
Materials Nails (1 per group)
Block of foam (1 per group)
Water bottle used as weight (1 per group)
Access to tap water
Mass scale (1-2 per class)
Ruler or Meter stick (1 per group)
Tape (1 roll)
Poster Paper
Graduated Cylinders or Syringes (1 per group)
Student Procedure As you collect data record it in the tables below.
1. Fill your bottle with the amount of water as assigned by the teacher. Then measure the
mass on the electronic scale.
2. Roll the paper into a cylinder and tape it together. This will act as the guide for the falling
water bottle. Be sure to roll the paper in the correct direction to get the desired drop
height.
3. Carefully insert the nail in the foam such that approximately 6 cm is sticking out.
4. Measure the exact initial height of nail head above foam block. Also measure the height
of the foam block above the ground and the length of the water bottle. These lengths will
be needed to calculate the drop height from the bottom of the bottle to the nail head.
5. Place the tube over the nail. Full setup is shown below:

“Gravity is a Hammer” Activity
14
6. Drop the bottle inside the tube, making sure that it is dropped from the top of the tube.
The cap of the bottle should be aligned with the top of the cylinder. As seen to the right:
7. Remove the tube and bottle putting them aside for later use.
8. Measure the new height of the nail sticking out of the foam (if the nail begins to go in
sideways, push it back to an upright position).
9. Repeat steps 3-6 until the nail is completely driven into the foam or you have completed
10 trials, whichever comes first.
Mass of bottle with water __________________________________kg
Length of cylinder (drop height)_____________________________m
Initial length of nail sticking out of foam ______________________m
Foam Height ____________________________________________m
Bottle Length ____________________________________________m
Trial # New nail height
L (m)
Change in nail height
∆L (m)
Total change in nail height
∑∆L (m)
1
2
3
4
5
6
7
8
9
10
“Gravity is a Hammer” Activity
15
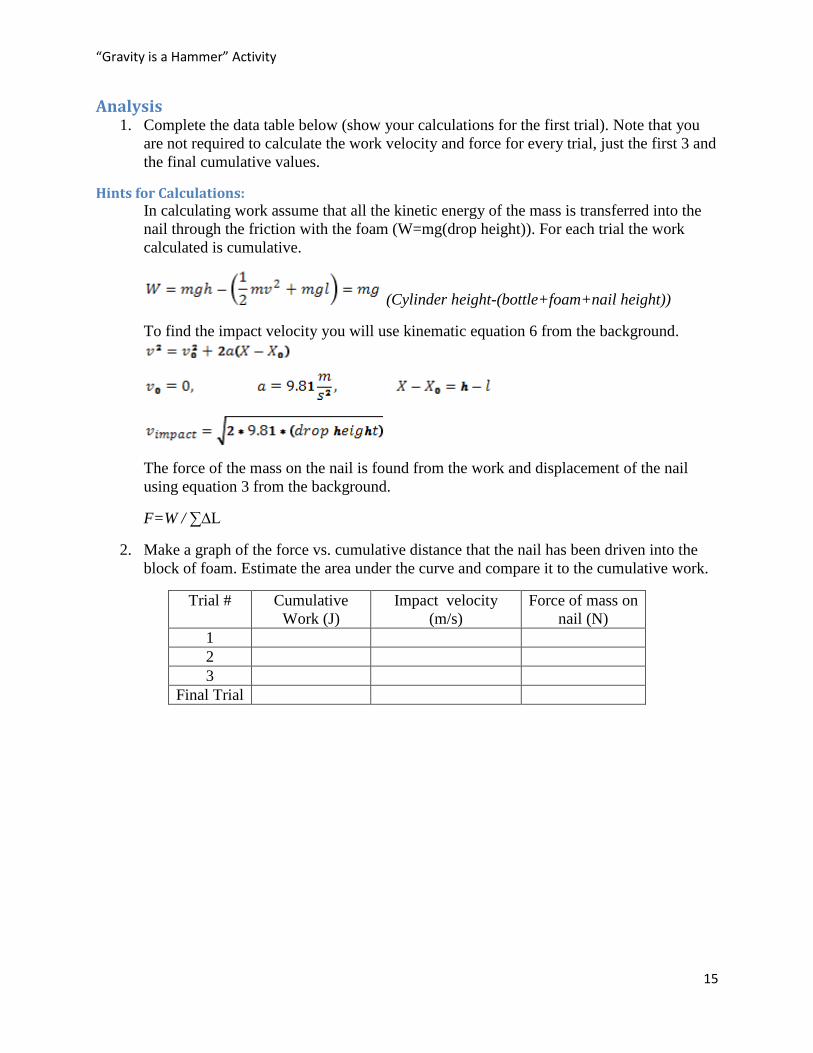
Analysis 1. Complete the data table below (show your calculations for the first trial). Note that you
are not required to calculate the work velocity and force for every trial, just the first 3 and
the final cumulative values.
Hints for Calculations: In calculating work assume that all the kinetic energy of the mass is transferred into the
nail through the friction with the foam (W=mg(drop height)). For each trial the work
calculated is cumulative.
(Cylinder height-(bottle+foam+nail height))
To find the impact velocity you will use kinematic equation 6 from the background.
The force of the mass on the nail is found from the work and displacement of the nail
using equation 3 from the background.
F=W / ∑∆L
2. Make a graph of the force vs. cumulative distance that the nail has been driven into the
block of foam. Estimate the area under the curve and compare it to the cumulative work.
Trial # Cumulative
Work (J)
Impact velocity
(m/s)
Force of mass on
nail (N)
1
2
3
Final Trial

“Gravity is a Hammer” Activity
16
Pre Test 1. Gravitational Energy is:
a. Proportional to the speed an object is moving
b. Dependent on the object’s height above the ground
c. The only type of energy involved in this experiment
d. All of the above
2. Kinetic Energy is:
a. Proportional to the speed an object is moving
b. Dependent on the object’s height above the ground
c. The only type of energy involved in this experiment
d. None of the above
3. When will the mass have most potential energy, when will it have the most kinetic
energy?
Max potential energy is at the top of the cylinder, max kinetic is at the moment it hits the
nail (when it has the highest velocity).
4. Explain in terms of the physics involved, why does the nail move when the mass hits it?
The kinetic energy of the nail is entirely converted into work to push the nail into the
foam against friction.

“Gravity is a Hammer” Activity
17
Post Test 1. Gravitational Energy is:
a. Proportional to the speed an object is moving
b. Dependent on the object’s height above the ground
c. The only type of energy involved in this experiment
d. All of the above
2. Kinetic Energy is:
a. Proportional to the speed an object is moving
b. Dependent on the object’s height above the ground
c. The only type of energy involved in this experiment
d. None of the above
3. When will the mass have most potential energy, when will it have the most kinetic
energy?
Max potential energy is at the top of the cylinder, max kinetic is at the moment it hits the
nail (when it has the highest velocity).
4. Explain in terms of the physics involved, why does the nail move when the mass hits it?
The kinetic energy of the nail is entirely converted into work to push the nail into the
foam against friction.
5. How does the estimated area under the force vs. distance graph compare to the
cumulative work done on the nail? Why are these values comparable?
Work is equal to the force applied to the nail times the distance that the nail moves
(W=Fd). This graph is of the function of the force over the distance. So the area under
the function is equal to the force times the distance.
6. Why is the force calculated in each trial slightly different?
There is error involved in this lab including: slightly inconsistent drop height, possible
bending of the nail, and error in measurement. There is also inherently a slightly longer
drop of the mass with each trial as the nail moves down but also more displaced foam
under the nail as it digs deeper adding more resistance to the nail’s movement.
7. Why did each group have different results (consider the varied masses and heights that
each team used)? Select all answer(s) that apply:
a. A larger mass will create a larger impact force and therefore perform more
work and push the nail into the foam in fewer trials.
b. Some of the groups did not measure correctly; everyone should have had the same
results.
c. The increased drop height gives the mass more potential energy which is
converted into more kinetic and then performs more work on the nail. d. The mass loses energy as it falls, so those dropped from a greater height do less
work on the nail

“What’s in My Food” Activity
18
What’s in My Food? Adapted from “Ramapo High School Food Lab”(Schott, n.d.)
Teacher Preparation Pre lab instructions
1. Acquire all materials needed for the lab, enough for one set of materials per group
(see materials list)
2. Before class prepare each food as necessary. For example foods that need to be peeled
should be peeled. Larger food should be cut into appropriate sized pieces. Place prepared
in a common location for student access.
3. Supply each group with 8 test tubes
4. Prepare for each test:
Testing for Complex Carbohydrates
1. Make sure each group has paper towels, a mortar and pestle, and some
Lugol’s Iodine solution.
2. Supply water as needed for each group.
Testing for Simple Carbohydrates
1. Boil water in a large pot. When each group is ready pour water into
smaller pots for group use.
2. Supply Benedict’s Solution to students as needed.
3. Supply hot/ boiling water as needed for each group.
4. Make sure a clock is visible to each group or that each group has a
stopwatch.
Testing for Lipids
1. Distribute pieces of brown paper for use by each group (white paper works
too).
2. Have mineral oil available for student use.
3. Make sure a clock is visible to each group or that each group has a
stopwatch.
5. Go over the background with the students.
6. If desired you can lead a discussion with the students before they begin the laboratory
activity or before each individual section is conducted about what nutrients they think
each food will contain. This will get the students to start making predictions and begin
critical thinking before the activity begins.
7. Have the students fill out the pre lab worksheet.
8. Split the students up into groups of 3-4 students.

“What’s in My Food” Activity
19
Lab instructions
1. Have students follow laboratory procedures
2. Specific to testing for proteins
1. Supply Biuret’s Solution to students as needed.*
2. If Biuret’s Solution is not obtained from a stock bottle tell them the color they should
observe in a stock bottle would be blue.
Post Lab
1. Have students clean up their equipment
2. Lead a discussion with the students on their observations
3. Have the students hand in observations and measurements
4. Have students individually fill out post tests and hand them in

“What’s in My Food” Activity
20
Concepts Carbohydrates
Protein
Lipids
Laboratory Skills
Background Substances in food that can be used by organisms for energy or growth and repair are called
nutrients. Nutrients include carbohydrates, lipids, proteins, minerals, and vitamins. Cells of all
organisms contain these nutrients as well as water. There are several chemical tests that can be
used to determine which nutrients, if any, are present in substances. These nutrients should be
included in a daily diet. A recommended diet is displayed in the provided food pyramid, in the
categories; grains, vegetables, fruits, milk, meats, and other (fats, oils, and sweets).
Food Pyramid
Serving Sizes
Type of
Food Serving size
Grains 15g of carbohydrates
Fruits 15g of carbohydrates
Vegetables 1 cup if raw 1/2 cup if cooked
Meats 2.5 ounces of protein
Milk 12g carbohydrates and 300mg of calcium

“What’s in My Food” Activity
21
Carbohydrates
Carbohydrates are the body's most preferred source of energy. Most carbohydrates come
from foods of plant origin. Chemically, carbohydrates are organic molecules in which carbon,
hydrogen, and oxygen are bonded together
Carbohydrates are the component of our food which:
1. supplies the energy for the body's automatic activity and for the performance of our daily
tasks. The more physical work we perform daily, the more carbohydrates we must
proportionately consume.
2. plays a vital part in the digestion, assimilation (metabolism) and oxidation of protein and fat.
If we take in more carbohydrate than is needed for immediate use the unused portion is
stored in the liver or converted into fat and deposited in the tissues for future use.
Simple Carbohydrates (sugars)
Simple carbohydrates are quick energy sources, but they do not usually supply any other
nutrients or fiber. Simple carbohydrates are made up of one or two sugar molecules linked
together.
SUGARS
1. Sucrose: commonly known as table sugar, beet sugar, or cane sugar. Sucrose occurs
in many fruits and some vegetables
2. Fructose: known as fruit sugar. Most plants contain fructose, especially fruits and
saps.
3. Glucose: sometimes known as blood sugar, sometimes as grape sugar. Nearly all
plant foods contain glucose. Glucose is the main type of simple sugar and is the
basic source of energy for all living things. It supplies the body with quick energy.
Glucose Molecule
4. Maltose: known as malt sugar. Found in grains.
5. Lactose: commonly known as milk sugar. It is the principal carbohydrate found in
milk.
Complex Carbohydrates
Complex carbohydrates are chains of three or more single sugar molecules linked
together. Carbohydrates, long chains of sugar molecules, are called starches and they serve as
the storage form of energy in plants. Branched complex carbohydrates called cellulose form the
structural components that give plants their shape. Glycogen is another form of complex
carbohydrates used by animals to store energy.

“What’s in My Food” Activity
22
Starch provides a steady release of energy into the body while also providing more of
what each of us need from our daily diets. Starch present in the body breaks down into simple
sugars. The body has to break down all sugar/starch into glucose to use it. Starch supplies the
body with long, sustained energy.
All starchy foods are plant foods. Seeds are the richest source; 70 percent of their weight
is starch. Many human societies have a staple grain from which their people derive their food
energy. These include wheat, corn, millet, rye, barley, and oats. Starch is also found in beans
peas, potato, yam, and cassava. These staple foods are the major source of food energy for
people around the world.
Starch Molecule
Proteins
Proteins in the Body
Proteins are extremely important biomolecules that affect very important functions in the
human body. Some of these functions include muscle repair, tissue growth, hormone regulation,
metabolism control, and illness defense. Proteins consist of half the non water mass of the human
body. Proteins are building blocks in ligaments, tendons, muscles, hair, nails, skin, teeth, tissue,
organs, and bones. A typical person needs 1 gram of protein daily for each kilogram that they
weigh.
Structure of proteins
Proteins are made up of amino acids which are made up of carbon, nitrogen, hydrogen,
and oxygen atoms. There are 22 amino acids that make up the proteins that are found in our
body. Hundreds of proteins can be formed from these basic building blocks. Amino acid consists
of the same basic structure an amino group, a carboxyl group, and a hydrogen group. The group
that differentiates the amino acids is the “R” group which depending on the structure of the
group affects the properties of the amino acid.

“What’s in My Food” Activity
23
Amino Acid Structure
Of the 22 amino acids that make up the proteins in the body only 14 can be made by the
human body itself. The other 8 amino acids need to be obtained from sources outside the body.
The 8 amino acids that the body cannot produce are called “essential amino acids”. Proteins
cannot be stored so if the essential amino acids are not used they will either be burned for energy
or stored in fats.
Lipids (Fats)
Lipids are another set of extremely important biomolecules that are critical in proper
body function. One important function of fats, also known as lipids, is energy storage. Fats
contain an abundance of calories and can be stored easily for when they are needed. Lipids
function in structural components of cells especially in the cell membrane where phospholipids
make up the majority of cell membranes.
Phospholipid Structure
Fats can be broken down into two main groups, saturated fats and unsaturated fats.
Saturated fats have the maximum number of hydrogen atoms bonded to carbon as possible. An
unsaturated fat has double bonds between at least one if not more than one of the carbon bonds in
the main chain.

“What’s in My Food” Activity
24
Saturated Fat
Unsaturated Fat
Solutions Used in Lab
Lugol’s Iodine Solution
This solution is used to test for the presence of starch. Lugol’s is a yellow-brown color.
When it reacts chemically with starch a blue-black colored substance will form called iodine of
starch.
Benedict’s Solution
This solution of sodium and copper salts is a clear-blue color. It is used to test for the
presence of simple sugars. In the presence of simple sugars, when heated, Benedict solution
changes color to green, yellow, orange, red, and brown, depending on the amount of sugar. Blue
(no glucose present), green, yellow, orange, red, and then brick red or brown (high glucose
present).
Biuret’s Solution
This solution is used to indicate the presence of proteins in a solution. Biuret's solution is
blue in color but changes to purple in the presence of proteins due to a chemical reaction. The
solution consists of allophanamide treated with cupric sulfate and sodium hydroxide.
“What’s in My Food” Activity
25
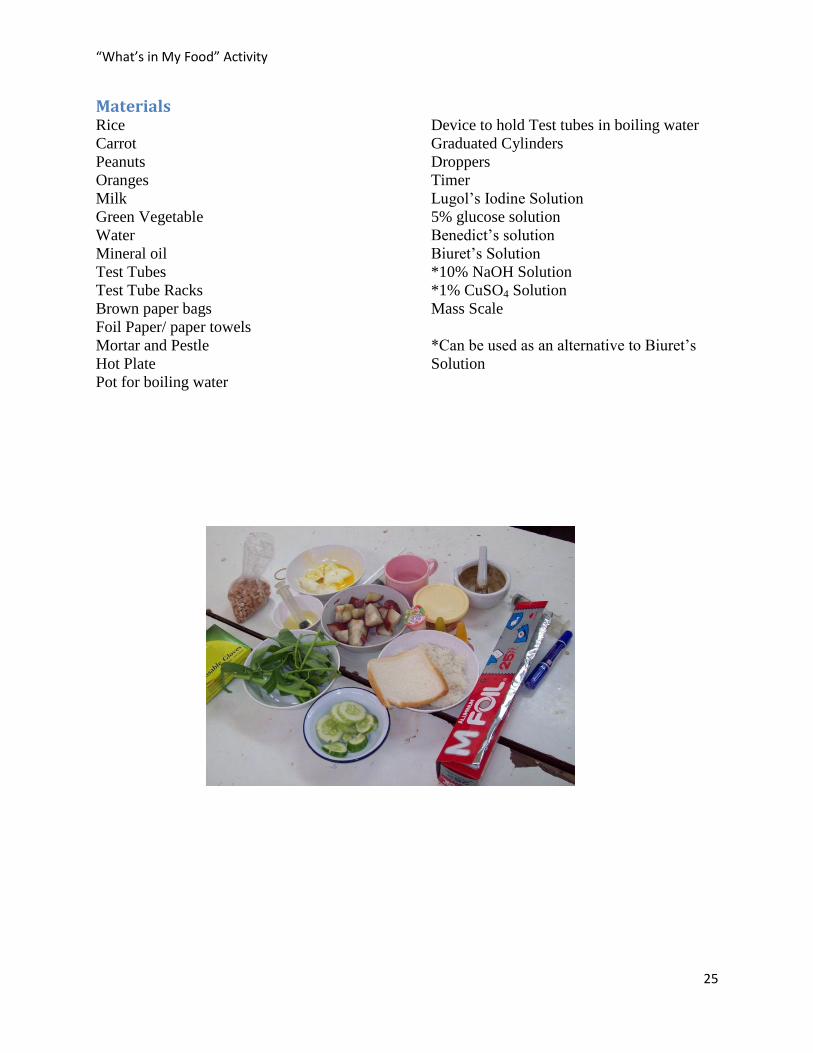
Materials Rice
Carrot
Peanuts
Oranges
Milk
Green Vegetable
Water
Mineral oil
Test Tubes
Test Tube Racks
Brown paper bags
Foil Paper/ paper towels
Mortar and Pestle
Hot Plate
Pot for boiling water
Device to hold Test tubes in boiling water
Graduated Cylinders
Droppers
Timer
Lugol’s Iodine Solution
5% glucose solution
Benedict’s solution
Biuret’s Solution
*10% NaOH Solution
*1% CuSO4 Solution
Mass Scale
*Can be used as an alternative to Biuret’s
Solution

“What’s in My Food” Activity
26
Procedure Testing for Complex Carbohydrates (Starch)
Part A
1. Label 1 test tube control.
2. Measure out 5mL of water in a graduated cylinder.
3. Add the 5 mL of water to the control test tube.
With a dropper add 1 drop of Lugol’s solution to the 5mL of
water in the control test tube. *keep the Lugol’s Iodine off
your skin. It WILL stain your skin* If any Lugol’s iodine
solution is spilled on your skin wash area thoroughly with
water and notify your teacher.
4. What color is the
water?____________________________________________
5. Place a small quantity of rice on a paper towel.
6. Place 2 drops of iodine solution on the rice.
7. What happened to the color of the iodine?
__________________________________
Part B
1. Place a small quantity of each of the foods, in separate piles, on foil paper.
2. Label each pile of food.
3. Mash each food pile with the mortar and pestle. Clean the mortar and pestle
between the mashing of each food.
4. Using the same procedure as you did with the rice, test each food for starch and
record your results in the following chart.
5. Clean the test tubes thoroughly for use in the next part of the experiment.
Starch Present?
Food Color Yes No
Water
Rice
Carrots
Peanuts
Oranges/ Apple-nose
Butter
Green Vegetable
Candy
Bread
“What’s in My Food” Activity
27
Testing for Simple Carbohydrates (Sugars)
Part A
1. Prepare 5% glucose solution by measuring out 5mL of water with a graduated
cylinder. Measure out 0.45 grams of glucose and add it to the water and mix
thoroughly.
2. Pour the 5mL solution into a test tube and label it S, for sugar solution, and place
it into a test tube rack.
3. Measure out 5mL of water and pour it into a test tube and label it C for control.
4. With a dropper add 5 drops of Benedict solution to each of the 2 test tubes
prepared above.
5. Mix the contents of each tube by swirling them gently.
6. What color is the solution in test tube
S?____________________________________
7. What color is in test tube
C?______________________________________________
8. Carefully place both test tubes into a boiling water bath for 3 minutes. During the
heating, observe the contents of each test tube for any color changes.
*be careful! The water is HOT! Never touch the test tubes used in this experiment
with bare hands.*
9. After 3 minutes remove both test tubes and place them in your test tube rack.
10. Observe the colors of the solutions. Describe what happened to the colors of the
solution in each test tube.
__________________________________________________________________
__________________________________________________________________
Part B
1. Measure out 5mL of water into each of the remaining test tubes in your rack
2. Mash each of the foods with the mortar and pestle and add them to the remaining
test tubes. Clearly label each test tube with the name of the food that it contains.
Clean the mortar and pestle between the mashing of the different foods.
3. With a dropper add 5 drops of Benedict solution to each of the test tubes and mix
the contents by gently swirling them
4. What is the color of the control tube
C?_____________________________________
5. What color are the solutions in the other test
tubes?___________________________
6. Carefully place all test tubes in a boiling hot water bath for 3 minutes. During the
heating observe the contents of each tube for any color changes.
7. After 3 minutes remove the test tubes from the water and
place them in the test tube rack.
8. Observe the color of the solutions. Describe what
happened to the colors of the solutions in each of the
tubes. Be specific about each food.
9. Clean each test tube thoroughly so that they can be used
later in the experiment.

“What’s in My Food” Activity
28
Testing for Lipids (fats)
1. Place two drops of mineral oil on a piece of brown paper. This mineral oil contains
lipids. Place two drops of water on another section of the same paper.
2. Hold the paper up to the light and look through the water spot and the oil spot. Note
that the oil spot is greasy and translucent while the water spot is not. This indicates
the presence of lipids.
3. Reexamine the spots after several minutes. The water spot will evaporate and
disappear. The oil (lipid) spot does not disappear.
4. Test the other foods for the presence of lipids. If the food is a
solid rub it into the brown paper and allow it to dry for a few
minutes. If the spot is still there the food contains lipids the spot
will remain. If it is a liquid proceed to follow steps 1 through 3.
5. Record the results in the following data table.
Food Color Lipids Present?
Yes No
Water
Rice
Carrots
Peanuts
Oranges/Apple-nose
Butter
Green Vegetable
Candy
Bread
Sugar Present?
Food Color Yes No
Water
Rice
Carrots
Peanuts
Oranges/ Apple-
nose
Butter
Green Vegetable
Candy
Bread

“What’s in My Food” Activity
29
Testing for Proteins
1. Describe the color of Biuret’s solution in its stock bottle*.
_____________________________________________________________________
___
*If you do not have Biuret’s solution from a stock bottle receive the answer from the
teacher for this question.
2. Add 5mL of water to each of the 8 test tubes.
3. Mash each of the food with the wooden sticks and add them to the test tubes. Label
each test tube with the name of the food it contains.
4. Add 5mL of *Biuret’s Solution to each of the test tubes. Observe the color changes in
each of the test tubes. Record your results on the following chart.
*If you do not have Biuret’s Solution add 2 drops of 10% NaOH to the test tube. Then
add 10 drops of the 1% CuSO4 solution to the same test tube.
Food Color Proteins Present?
Yes No
Water
Rice
Carrots
Peanuts
Oranges/Apple-nose
Butter
Green Vegetable
Candy
Bread
5. Clean each test tube thoroughly once the experiment is completed.

“What’s in My Food” Activity
30
Pre Test 1. What are some of the main nutrients needed in a daily diet?
_____________________________________________________________________
___
Carbohydrates, Proteins, Lipids, Vitamins and Minerals
2. What is the bodies most preferred source of energy?
_______________________________________________________________________
Complex Carbohydrates
3. The more physical work you perform daily the more complex carbohydrates you must
consume.
True or False
4. Simple carbohydrates supply a significant amount of nutrients and fiber.
True or False
5. What is your favorite food that has a lot of simple carbohydrates?
_____________________________________________________________________
6. Which of the following foods is the best source of carbohydrates?
a. Nuts
b. Rice
c. Mangoes
d. Milk
7. What are the building blocks of proteins?
_____________________________________________________________________
Amino acids
8. Name one thing proteins do in the body.
_____________________________________________________________________
Muscle repair, tissue growth, hormone regulation, metabolism control, illness
defense
9. Which of the following foods is the best source of proteins?
a. Nuts
b. Rice
c. Mangoes
d. Milk
10. What is an important function of lipids?
_____________________________________________________________________
Energy storage

“What’s in My Food” Activity
31
11. How could you tell if a food is abundant in lipids?
_____________________________________________________________________
If the food leaves an oily spot on a piece of paper that doesn’t evaporate.
12. Lipids should be a large part of your diet.
True or False
13. Why would water be used as a control when testing for nutrients?
_____________________________________________________________________
_____________________________________________________________________
_____________________________________________________________________
_____________________________________________________________________
Water would be used as a control in the experiments because it contains none of the
nutrients that are being tested for and therefore will not react with the testing
reagents.

“What’s in My Food” Activity
32
Post Test 1. What are some of the main nutrients needed in a daily diet?
_____________________________________________________________________
Carbohydrates, Proteins, Lipids, Vitamins Minerals
2. What is the bodies most preferred source of energy?
_______________________________________________________________________
Complex Carbohydrates
3. The more physical work you perform daily the more complex carbohydrates you must
consume.
True or False
4. Simple carbohydrates supply a significant amount of nutrients and fiber.
True or False
5. What is your favorite food that has a lot of simple carbohydrates?
_____________________________________________________________________
6. Which of the following foods is the best source of carbohydrates?
a. Nuts
b. Rice
c. Mangoes
d. Milk
7. What are the building blocks of proteins?
_____________________________________________________________________
Amino acids
8. Name one thing proteins do in the body.
_____________________________________________________________________
Muscle repair, tissue growth, hormone regulation, metabolism control, illness
defense
9. Which of the following foods is the best source of proteins?
a. Nuts
b. Rice
c. Mangoes
d. Milk
10. What is an important function of lipids?
_____________________________________________________________________
Energy storage
11. How could you tell if a food is abundant in lipids?
_____________________________________________________________________

“What’s in My Food” Activity
33
If the food leaves an oily spot on a piece of paper that doesn’t evaporate.
12. Lipids should be a large part of your diet.
True or False
13. Why would water be used as a control when testing for nutrients?
_____________________________________________________________________
_____________________________________________________________________
_____________________________________________________________________
_____________________________________________________________________
Water would be used as a control in the experiments because it contains none of the
nutrients that are being tested for and therefore will not react with the testing
reagents.
14. Match each indicator with the nutrient it is used to test for. Place the correct letter on
the line provided next to each listed solution.
Lugol’s Solution ___ c a. Simple Sugars
Benedict’s Solution ___ a b. Proteins
Biuret’s Solution ___ b c. Starch
15. Circle the correct color which indicates a positive result for each solution listed:
Lugol’s Solution Yellow-brown Blue-black
Benedict’s Solution Yellow, orange, red Clear Blue
Biuret’s Solution Blue Purple
16. Did any of the results obtained for each test surprise you? Which ones surprised you?
Why did they surprise you?
_____________________________________________________________________
_____________________________________________________________________
_____________________________________________________________________

“Precipitation Reactions” Activity
34
Precipitation Reactions Adapted from “Department of Chemistry IPST”(สถาบนัสง่เสริมการสอนวิทยาศาสตร์ปละเทคโนโลยี (สสวท.), n.d.)
Teacher preparation
Before running the laboratory activity, the teacher goes over and discusses the
background information with the students. When finished the background information, let the
students do the pre test to check of their knowledge about the subject in this laboratory
activity. The students should do the pre test individually. After the students completed the pre
test, let the students split into groups of 3-4 students and hand in all of materials and
chemicals to each group. Then, have the students begun the laboratory activity. After the
students finished the experiment, the students do the post test which it is also individual to
measure the understanding of the subject matter of this activity.

“Precipitation Reactions” Activity
35
Concept
Double replacement reaction
Properties of Alkali and Alkali Earth metals
Background
To understand the concept of precipitation, first of all we should know some of
physical and chemical properties of alkali and alkaline earth metal.
Group 1 Alkali Metals
The Group 1 elements are all alkali metals that are grouped together on the periodic
table according to their similar properties. Group 1 alkali metals include lithium (Li), sodium
(Na), potassium (K), rubidium (Rb), cesium (Cs), and francium (Fr). These metals, like all
metals, are ductile, malleable, good conductors of heat, and good conductors of electricity.
However, they are softer than most other metals and can easily be cut by a knife. Group 1
alkali metals also differ from most other metals because they have low melting and boiling
temperatures and have low densities. All these metals have one valence electron and in their
ionic state have a +1 charge. These metals are silvery in color and are very reactive. The
reactivity increases descending down the periodic table. The least reactive is lithium and the
most reactive is francium. All group 1 alkali metals are too reactive to be found naturally in
their elemental form and therefore must be obtained from other sources. An example is
sodium which can be found in abundance in salt (NaCl) from sea water. These metals are so
reactive that they cannot be displaced by another element so in order to isolate them
electrolysis of their molten salts must be performed. When storing these chemicals they must
be stored under oil because they react with the oxygen in air which taints the metal.
Group 2 Alkaline Earth Metals
The Group 2 elements are alkaline earth metals that are grouped together on the
period table according to their properties. Group 2 alkaline earth metals include beryllium
(Be), magnesium (Mg), calcium (Ca), strontium (Sr), barium (Ba), and radium (Ra). These
metals are silvery-white in color. They are ductile, malleable, good conductors of heat, and
good conductors of electricity. Alkaline earth metals are highly reactive but not as reactive as
the Group 1 alkali metals. Group 2 metals are denser and harder than group 1 metals and have
stronger metallic bonding due to an additional valence electron. They also have higher
boiling points than the Group 1 alkali metals. Metals in the group 2 column all have 2 valance
electrons and in their ionic state have a +2 charge. The alkaline earth metals become more
electropositive descending the group from beryllium to radium. As with Group 1 metals
Group 2 metals are highly reactive and therefore cannot be found in their elemental form in
nature but can be found in various rock structures. There are various processes involved in
obtaining these metals in their elemental form. Some of the techniques used are precipitation
and electrolysis. Due to their reactivity these elements must be carefully stored.
Precipitation reaction
Precipitation reactions are a type of reaction called double replacement reaction. A
double replacement reaction is a chemical reaction between compounds in which the
elements in the reactants recombine to form two different compounds, each of the products
having one element from each of the reactants. Precipitation reactions occur when ions in
solution react to form a chemical that is not soluble in the solution in which they are mixed.
This causes the chemical produced from the reaction to fall out of solution and form what is

“Precipitation Reactions” Activity
36
called a precipitate. There are certain rules that can be memorized in order to predict weather
mixing two chemicals in a solution will create a precipitate or not.
1. All Nitrates (NO3-), Acetate (C2H3O2
-), Chlorates (ClO3
-), and Perchlorate (ClO4
-)
salts are soluble
2. All Group 1 metal salts are soluble
3. All Ammonium (NH4+) Compounds are soluble
4. All Chloride (Cl-), Bromide (Br
-), and Iodide (I
-) salts are soluble except Silver (Ag
+),
Lead II (Pb+2
) and Mercury I (Hg2+2
) chloride, bromide, or iodide salts which are
insoluble
5. All sulfate (SO4-2
) salts are soluble except Calcium (Ca+2
), Strontium (Sr+2
), Barium
(Ba+2
), Lead II (Pb+2
), Mercury I (Hg2+2
), and Silver (Ag+) sulfates which are
insoluble
6. All Carbonates (CO3-2
), Chromates (CrO4-2
), Oxalates (C2O4-2
), and Phosphates (PO4-
3) are insoluble except those of Group I elements and Ammonium salts which are
soluble
7. All Sulfide (S-2
) salts are insoluble except those of Group 1 and Group 2 elements and
Ammonium (NH4+)
8. All Hydroxides (OH-) and Oxides (O
-2) are insoluble except for Group 1 and Group 2
salts which are soluble.
Materials
MgCl2
CaCl2
NaCl
Na2CO3
Na2HPO4
Na2SO4
KNO3
Water
Test tubes (10 per group)
Test tube rack (1 per group)
Droppers (7 per group)
Graduated cylinder (1 per group
Beakers (1-2 per group)

“Precipitation Reactions” Activity
37
Safety and caution
All chemicals are irritating to the skin, eyes, and harmful if swallowed or inhaled.
Keep potassium nitrate (KNO3) away from source of ignition.
None of the solutions should be disposed of down the drain. The waste solution should be
collected in provided waste container.
Wash hands immediately upon contact with the chemicals. Also, wash hands after the
experiment.

“Precipitation Reactions” Activity
38
Procedure for students
1. Prepare each solution with concentration of 1 M 20 ml. Let molecular weight of H = 1, C
= 12, N = 14, O = 16, Na = 23, Mg = 24, P = 31, S = 32, Cl = 35.5, K = 39, and Ca = 40.
Calculation:
MW MgCl2 = 95 g/mol
𝑔 = 1𝑀 × 20 × 10−3𝑙 × 95 𝑔/𝑚𝑜𝑙 =1.90
Mass of MgCl2 = ………1.9……………… g
MW CaCl2 = 111 g/mol
𝑔 = 1𝑀 × 20 × 10−3𝑙 × 111 𝑔/𝑚𝑜𝑙 =2.22
Mass of CaCl2 = …………2.22……………. g
MW NaCl = 58.5
𝑔 = 1𝑀 × 20 × 10−3𝑙 × 58.5 𝑔/𝑚𝑜𝑙 =1.17
Mass of NaCl = ………1.17………………. g
MW Na2CO3 = 106 g/mol
𝑔 = 1𝑀 × 20 × 10−3𝑙 × 106 𝑔/𝑚𝑜𝑙 =2.12
Mass of Na2CO3 = …………2.12…………….. g
MW Na2HPO4 = 142 g/mol
𝑔 = 1𝑀 × 20 × 10−3𝑙 × 142 𝑔/𝑚𝑜𝑙 = 2.84
“Precipitation Reactions” Activity
39
Mass of Na2HPO4 = …………2.84………….. g
MW Na2SO4 = 142 g/mol
𝑔 = 1𝑀 × 20 × 10−3𝑙 × 142 𝑔/𝑚𝑜𝑙 = 2.84
Mass of Na2SO4 = …………2.84…………… g
MW KNO3 = 101 g/mol
𝑔 = 1𝑀 × 20 × 10−3𝑙 × 101 𝑔/𝑚𝑜𝑙 = 2.02
Mass of KNO3 = …………2.02……………….. g
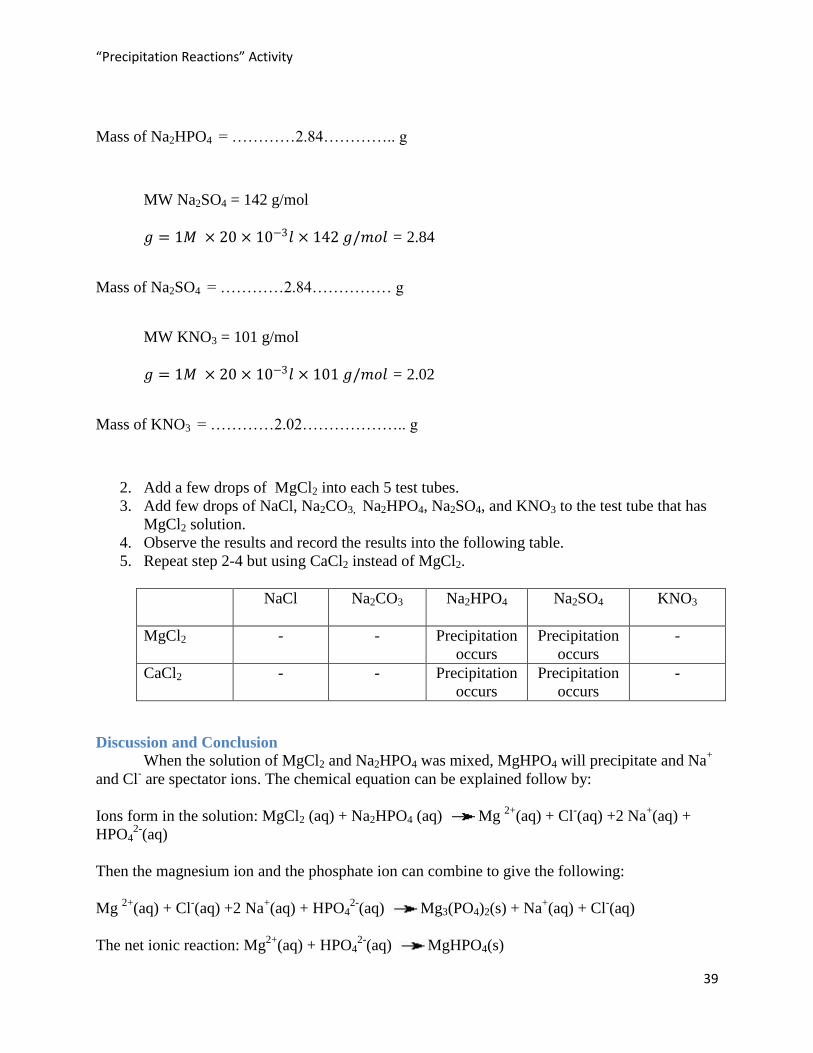
2. Add a few drops of MgCl2 into each 5 test tubes.
3. Add few drops of NaCl, Na2CO3, Na2HPO4, Na2SO4, and KNO3 to the test tube that has
MgCl2 solution.
4. Observe the results and record the results into the following table.
5. Repeat step 2-4 but using CaCl2 instead of MgCl2.
NaCl Na2CO3 Na2HPO4 Na2SO4 KNO3
MgCl2 -
- Precipitation
occurs
Precipitation
occurs
-
CaCl2 -
- Precipitation
occurs
Precipitation
occurs
-
Discussion and Conclusion
When the solution of MgCl2 and Na2HPO4 was mixed, MgHPO4 will precipitate and Na+
and Cl- are spectator ions. The chemical equation can be explained follow by:
Ions form in the solution: MgCl2 (aq) + Na2HPO4 (aq) Mg 2+
(aq) + Cl-(aq) +2 Na
+(aq) +
HPO42-
(aq)
Then the magnesium ion and the phosphate ion can combine to give the following:
Mg 2+
(aq) + Cl-(aq) +2 Na
+(aq) + HPO4
2-(aq) Mg3(PO4)2(s) + Na
+(aq) + Cl
-(aq)
The net ionic reaction: Mg2+
(aq) + HPO42-
(aq) MgHPO4(s)

“Precipitation Reactions” Activity
40
When the solution of MgCl2 and Na2SO4 was mixed, MgSO4 will precipitate and Na+ and
Cl- are spectator ions. The chemical equation can be explained follow by:
Ions form in the solution: MgCl2 (aq) + Na2SO4 (aq) Mg 2+
(aq) + Cl-(aq) +2 Na
+(aq) + SO4
2-
(aq)
Then the magnesium ion and the sulfate ion can combine to give the following:
Mg 2+
(aq) + Cl-(aq) +2 Na
+(aq) + SO4
2-(aq) MgSO4 (s) + Na
+(aq) + Cl
-(aq)
The net ionic reaction: Mg2+
(aq) + SO42-
(aq) MgSO4(s)
When the solution of CaCl2 and Na2HPO4 was mixed, CaHPO4 will precipitate and Na+
and Cl- are spectator ions. The chemical equation can be explained follow by:
Ions form in the solution: CaCl2 (aq) + Na2HPO4 (aq) Ca2+
(aq) + Cl-(aq) +2 Na
+(aq) +
HPO42-
(aq)
Then the magnesium ion and the sulfate ion can combine to give the following:
Ca 2+
(aq) + Cl-(aq) +2 Na
+(aq) + HPO4
2-(aq) CaHPO4 (s) + Na
+ ( (aq) + Cl
-(aq)
The net ionic reaction: Ca2+
(aq) + HPO42-
(aq) CaHPO4(s)
When the solution of CaCl2 and Na2SO4 was mixed, CaSO4 will precipitate and Na+ and
Cl- are spectator ions. The chemical equation can be explained follow by:
Ions form in the solution:
CaCl2 (aq) + Na2SO4 (aq) Ca2+
(aq) + Cl-(aq) +2 Na
+(aq) + SO4
2-(aq)
Then the magnesium ion and the sulfate ion can combine to give the following:
Ca 2+
(aq) + Cl-(aq) +2 Na
+(aq) + SO4
2-(aq) CaSO4 (s) + Na
+ ( (aq) + Cl
-(aq)
The net ionic reaction: Ca2+
(aq) + SO42-
(aq) CaSO4(s)

“Precipitation Reactions” Activity
41
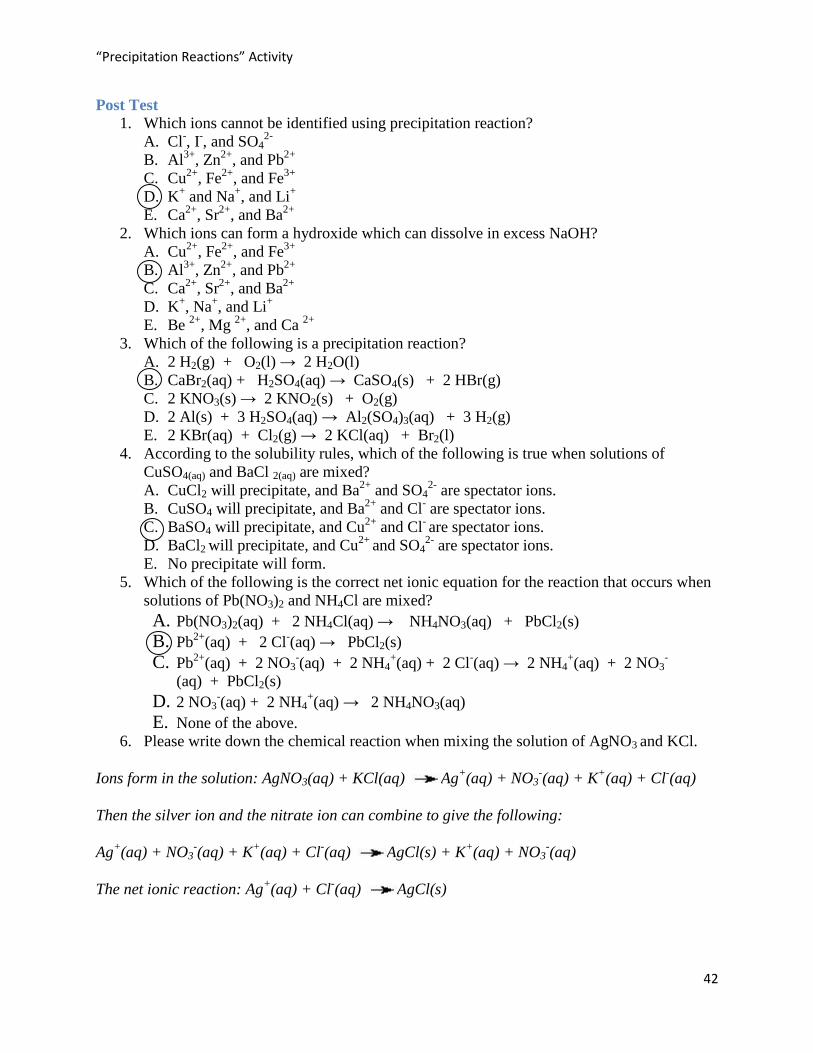
Pre Test
1. Which ions cannot be identified using precipitation reaction?
A. Cl-, I
-, and SO4
2-
B. Al3+
, Zn2+
, and Pb2+
C. Cu2+
, Fe2+
, and Fe3+
D. K+ and Na
+, and Li
+
E. Ca2+
, Sr2+
, and Ba2+
2. Which ions can form a hydroxide which can dissolve in excess NaOH?
A. Cu2+
, Fe2+
, and Fe3+
B. Al3+
, Zn2+
, and Pb2+
C. Ca2+
, Sr2+
, and Ba2+
D. K+, Na
+, and Li
+
E. Be 2+
, Mg 2+
, and Ca 2+
3. Which of the following is a precipitation reaction?
A. 2 H2(g) + O2(l) → 2 H2O(l)
B. CaBr2(aq) + H2SO4(aq) → CaSO4(s) + 2 HBr(g)
C. 2 KNO3(s) → 2 KNO2(s) + O2(g)
D. 2 Al(s) + 3 H2SO4(aq) → Al2(SO4)3(aq) + 3 H2(g)
E. 2 KBr(aq) + Cl2(g) → 2 KCl(aq) + Br2(l)
4. According to the solubility rules, which of the following is true when solutions of
CuSO4(aq) and BaCl 2(aq) are mixed?
A. CuCl2 will precipitate, and Ba2+
and SO42-
are spectator ions.
B. CuSO4 will precipitate, and Ba2+
and Cl- are spectator ions.
C. BaSO4 will precipitate, and Cu2+
and Cl- are spectator ions.
D. BaCl2 will precipitate, and Cu2+
and SO42-
are spectator ions.
E. No precipitate will form.
5. Which of the following is the correct net ionic equation for the reaction that occurs when
solutions of Pb(NO3)2 and NH4Cl are mixed?
A. Pb(NO3)2(aq) + 2 NH4Cl(aq) → NH4NO3(aq) + PbCl2(s)
B. Pb2+
(aq) + 2 Cl-(aq) → PbCl2(s)
C. Pb2+
(aq) + 2 NO3-(aq) + 2 NH4
+(aq) + 2 Cl
-(aq) → 2 NH4
+(aq) + 2 NO3
-
(aq) + PbCl2(s)
D. 2 NO3-(aq) + 2 NH4
+(aq) → 2 NH4NO3(aq)
E. None of the above.
“Precipitation Reactions” Activity
42
Post Test
1. Which ions cannot be identified using precipitation reaction?
A. Cl-, I
-, and SO4
2-
B. Al3+
, Zn2+
, and Pb2+
C. Cu2+
, Fe2+
, and Fe3+
D. K+ and Na
+, and Li
+
E. Ca2+
, Sr2+
, and Ba2+
2. Which ions can form a hydroxide which can dissolve in excess NaOH?
A. Cu2+
, Fe2+
, and Fe3+
B. Al3+
, Zn2+
, and Pb2+
C. Ca2+
, Sr2+
, and Ba2+
D. K+, Na
+, and Li
+
E. Be 2+
, Mg 2+
, and Ca 2+
3. Which of the following is a precipitation reaction?
A. 2 H2(g) + O2(l) → 2 H2O(l)
B. CaBr2(aq) + H2SO4(aq) → CaSO4(s) + 2 HBr(g)
C. 2 KNO3(s) → 2 KNO2(s) + O2(g)
D. 2 Al(s) + 3 H2SO4(aq) → Al2(SO4)3(aq) + 3 H2(g)
E. 2 KBr(aq) + Cl2(g) → 2 KCl(aq) + Br2(l)
4. According to the solubility rules, which of the following is true when solutions of
CuSO4(aq) and BaCl 2(aq) are mixed?
A. CuCl2 will precipitate, and Ba2+
and SO42-
are spectator ions.
B. CuSO4 will precipitate, and Ba2+
and Cl- are spectator ions.
C. BaSO4 will precipitate, and Cu2+
and Cl- are spectator ions.
D. BaCl2 will precipitate, and Cu2+
and SO42-
are spectator ions.
E. No precipitate will form.
5. Which of the following is the correct net ionic equation for the reaction that occurs when
solutions of Pb(NO3)2 and NH4Cl are mixed?
A. Pb(NO3)2(aq) + 2 NH4Cl(aq) → NH4NO3(aq) + PbCl2(s)
B. Pb2+
(aq) + 2 Cl-(aq) → PbCl2(s)
C. Pb2+
(aq) + 2 NO3-(aq) + 2 NH4
+(aq) + 2 Cl
-(aq) → 2 NH4
+(aq) + 2 NO3
-
(aq) + PbCl2(s)
D. 2 NO3-(aq) + 2 NH4
+(aq) → 2 NH4NO3(aq)
E. None of the above.
6. Please write down the chemical reaction when mixing the solution of AgNO3 and KCl.
Ions form in the solution: AgNO3(aq) + KCl(aq) Ag+(aq) + NO3
-(aq) + K
+(aq) + Cl
-(aq)
Then the silver ion and the nitrate ion can combine to give the following:
Ag+(aq) + NO3
-(aq) + K
+(aq) + Cl
-(aq) AgCl(s) + K
+(aq) + NO3
-(aq)
The net ionic reaction: Ag+(aq) + Cl
-(aq) AgCl(s)

“Colors of the Sun” Activity
43
The Colors of the Sun
Teacher Preparation This lab will be conducted over a three week
period of time. The first week will be spent allowing the
plants their initial growth. Weeks two and three will be
spent recording the growth of the plants once a day.
Pre lab instructions
1. Acquire all materials needed for the lab, enough
for one set of materials per group
(see materials list)
2. Teach background information
3. Allow students to discuss or ask questions about
the background information
4. Have students individually fill out pre tests and
hand them in
5. Split students into groups of three
Lab instructions
1. Have students follow laboratory procedures
Post lab instructions
1. Have students clean up their plants
2. Lead a discussion with the students on their observations
3. Have the students hand in observations and measurements
4. Have students individually fill out post tests and hand them in
On the left: plant grown in the dark for 1 week.
On the right: plant grown in the light for 1 week.
“Colors of the Sun” Activity
44
Concepts
Photosynthesis
Sunlight Wave Lengths
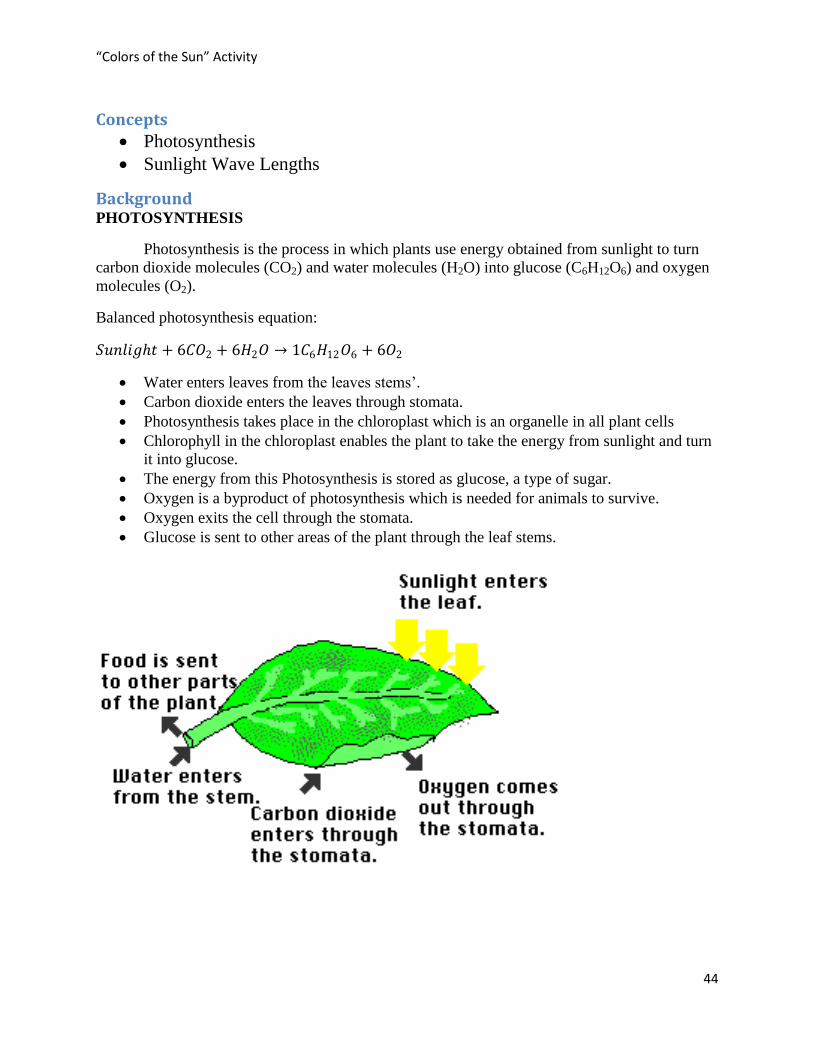
Background PHOTOSYNTHESIS
Photosynthesis is the process in which plants use energy obtained from sunlight to turn
carbon dioxide molecules (CO2) and water molecules (H2O) into glucose (C6H12O6) and oxygen
molecules (O2).
Balanced photosynthesis equation:
𝑆𝑢𝑛𝑙𝑖𝑔ℎ𝑡 + 6𝐶𝑂2 + 6𝐻2𝑂 → 1𝐶6𝐻12𝑂6 + 6𝑂2
Water enters leaves from the leaves stems’.
Carbon dioxide enters the leaves through stomata.
Photosynthesis takes place in the chloroplast which is an organelle in all plant cells
Chlorophyll in the chloroplast enables the plant to take the energy from sunlight and turn
it into glucose.
The energy from this Photosynthesis is stored as glucose, a type of sugar.
Oxygen is a byproduct of photosynthesis which is needed for animals to survive.
Oxygen exits the cell through the stomata.
Glucose is sent to other areas of the plant through the leaf stems.

“Colors of the Sun” Activity
45
LIGHT SPECTRUM
Photosynthesis and Light
White light is separated into the different colors (wavelengths) of light by passing
through a prism. Wavelength is defined as the distance from peak to peak (or trough to trough).
The energy of is inversely proportional to the wavelength: longer wavelengths have less energy
than do shorter ones.
The order of colors is determined by the wavelength of light. Visible light is one small
part of the electromagnetic spectrum. The longest the wavelength of visible light is red. Likewise
the shortest wavelength visible is violet. Wavelengths longer than red are referred to as infrared,
while those shorter than violet are ultraviolet.

“Colors of the Sun” Activity
46
Chlorophyll and Pigments
A pigment is any substance that absorbs light. The color of the pigment comes from the
wavelengths of light reflected (those not absorbed). Chlorophyll, the green pigment common to
all photosynthetic cells, absorbs all wavelengths of visible light except green, which it reflects to
be detected by our eyes. Black pigments absorb all of the wavelengths that strike them. White
pigments/lighter colors reflect all or almost all of the energy striking them. Pigments have their
own characteristic absorption spectra, the absorption pattern of a given pigment.
LIGHT SOURCE
Three principal characteristics of light affect plant growth:
quantity
quality
duration
Quantity
Light quantity refers to the intensity, or concentration, of sunlight. It varies with the
seasons. The maximum amount of light is present in summer and the minimum in winter. Up to a
point, the more sunlight a plant receives, the greater its capacity for producing food via
photosynthesis.
You can manipulate light quantity to achieve different plant growth patterns. Increase
light by surrounding plants with reflective materials, a white background, or supplemental lights.
Decrease it by shading plants with cheesecloth or woven shade cloths.
Quality
Light quality refers to the color (wavelength) of light. Sunlight supplies the complete
range of wavelengths and can be broken up by a prism into bands of red, orange, yellow, green,
blue, indigo, and violet.
Blue and red light, which plants absorb, have the greatest effect on plant growth. Blue
light is responsible primarily for vegetative (leaf) growth. Red light, when combined with blue
light, encourages flowering. Plants look green to us because they reflect, rather than absorb,
green light.
“Colors of the Sun” Activity
47
Knowing which light source to use is important for manipulating plant growth. For
example, fluorescent (cool white) light is high in the blue wavelength. It encourages leafy growth
and is excellent for starting seedlings. Incandescent light is high in the red or orange range, but
generally produces too much heat to be a valuable light source for plants. Fluorescent grow-
lights attempt to imitate sunlight with a mixture of red and blue wavelengths, but they are costly
and generally no better than regular fluorescent lights.
Duration
Duration, or photoperiod, refers to the amount of time a plant is exposed to light.
Photoperiod controls flowering in many plants. Scientists initially thought the length of light
period triggered flowering and other responses within plants. Thus, they describe plants as short-
day or long-day, depending on what conditions they flower under. We now know that it is not
the length of the light period, but rather the length of uninterrupted darkness, that is critical to
floral development.

“Colors of the Sun” Activity
48
Materials 8 seeds per pot (32 per group)
4 pots/water bottles per group. Each pot must be at
least 25 cm tall to allow for plant growth (per
group)
Water
2 pieces of transparent green paper (per group)
2 pieces of transparent red paper (per group)
Student Procedure 1. Wrap the sides of one pot in green colored paper and one in red colored paper, so that all
light going to the plant must go through the paper. Leave two pots unwrapped
2. Place 2 layers of paper towel it the bottom of each of the 4 pots. (dirt can be used in place
of paper towels)
3. Place 8 seeds in each pot on top of the paper towels.
4. Place 2 more layers of paper towels on top of the seeds.
5. Water your seeds enough to moisten the paper towels.
6. Using the colored paper create a top for the green and red colored pots, making sure that
you can remove it easily to water the plants
7. Place the green, red, and one of the plain pots in the sun. Put the remaining pot in a dark
place where it will receive no light.
8. Water the plants daily or as needed
9. Measure and record the plants’ heights and stem colors daily beginning seven days after
planting. Measure for a total of two weeks.
“Colors of the Sun” Activity
49
Pre Test 1. What does a plant need to conduct photosynthesis? Circle all that apply
a. Sunlight,
b. O2
c. CO2
d. H2O
e. Rice
2. What colors of light do plant leaves absorb?
a. All colors
b. Red only
c. Violet
d. All colors but green
e. Green
3. What part of a plant cell is responsible for photosynthesis?
a. The stomata
b. Chloroplasts
c. The stem
d. The roots
4. What color light has the longest wave length?
a. Red
b. Violet
c. Yellow
d. Green
5. What do you think will happen to the plant in the dark?
It will grow quickly at first but then die. While it is alive it will lack much green
coloring.

“Colors of the Sun” Activity
50
Post Test 1. What does a plant need to conduct photosynthesis? Circle all that apply
a. Sunlight,
b. O2
c. CO2
d. H2O
e. Rice
2. What colors of light do plant leaves absorb?
a. All colors
b. Red only
c. Violet
d. All colors but green
e. Green
3. What part of a plant cell is responsible for photosynthesis?
a. The stomata
b. Chloroplasts
c. The stem
d. The roots
4. What color light has the longest wave length?
a. Red
b. Violet
c. Yellow
d. Green
5. Which plant(s) were the healthiest and why?
a. The plants covered by tissue paper
b. The one in the sunlight and the one in the green paper.
c. The plant in the dark
d. The plant in the dark and the plant covered in red paper
Why? This is because the one in the dark and the one in the red were not receiving
enough light.
6. Why did the plant in the dark grow in the way it did?
The plant in the dark grew quickly in the beginning as it was attempting to reach
sunlight, but then died due to a lack of sunlight. While it was alive it should have also
had less green coloring than any of the other plants.
7. Why is the green plant growing almost as well as the plant with no filter?
It is because the green filter is absorbing the light the plant would reflect naturally so
nearly the same amount of light is reaching the plant wrapped in green paper.

51
References
Frede, V. (2008). The seasons explained by refutational modeling activities. Astronomy
Education Review, 7(1), 44-56. Retrieved from
http://scitation.aip.org/getpdf/servlet/GetPDFServlet?filetype=pdf&id=AERSCZ000007000
001000044000001&idtype=cvips&prog=normal;
http://scitation.aip.org/journals/doc/AERSCZ-ft/vol_7/iss_1/44_1.html
Hutton, D. (2009). In Lax S. (Ed.), Interview on possible physics and astronomy laboratory
activities. Worcester, MA: Worcester Polytechnic Institute.
Schott, L. (n.d.). Food testing. New York: Ramapo High School.
สถาบนัสง่เสริมการสอนวิทยาศาสตร์ปละเทคโนโลย ี(สสวท.). (n.d.). หนงัสือประกอบการเรียนการสอนวิชาเคมี มธัยมศึกษาปีที ่4
“Seasons Modeling” Sources:
Basic astronomy. (2010). Retrieved January 11, 2010, from
http://www.astrosimple.com/lesson/index.php?item=astronomy
The Seasons. Retrieved January 11, 2010, from
http://csep10.phys.utk.edu/astr161/lect/time/seasons.html
Weisstein, E. W. (2007). Season. Retrieved January 11, 2010, from
http://scienceworld.wolfram.com/astronomy/Season.html
What causes the seasons? (2007). Retrieved January 11, 2010, from
http://www.weatherquestions.com/What_causes_the_seasons.htm
“Gravity is a Hammer” Sources:
College Board. (2002). Equation tables. Retrieved January 11, 2010, from
http://www.collegeboard.com/prod_downloads/ap/students/physics/info_equation_tables_20
02.pdf
“What’s in My Food?” Sources:
Amino acid structure. Retrieved January 11, 2010, from http://www.aloeveraibs.com/wp-
content/uploads/2008/08/aminoacidstruc.jpg
BodyHealth. (2009). Key facts everyone should know about protein. Retrieved January 11, 2010,
from http://www.bodyhealth.com/html/BioBuilde/key.asp
Buzzle. (2009). Facts about proteins. Retrieved January 11, 2010, from
http://www.buzzle.com/articles/facts-about-proteins.html
Carpi, A. (2003). Carbohydrates. Retrieved January 18, 2010, from
http://www.visionlearning.com/library/module_viewer.php?mid=61
Lipids. Retrieved January 11, 2010, from
http://bioweb.wku.edu/courses/biol115/Wyatt/Biochem/Lipid/lipid1.htm

52
“Precipitation Reaction” Sources:
Bentor, Y. (2009a). Alkali metals. Retrieved January 25, 2010, from
http://www.chemicalelements.com/groups/alkali.html
Bentor, Y. (2009b). Alkaline earth. Retrieved January 25, 2010, from
http://www.chemicalelements.com/groups/alkaline.html
Birk, J. P.Chemical reactions . Retrieved January 25, 2010, from
http://www.chemistryexplained.com/Ce-Co/Chemical-Reactions.html
Group 1 - the alkali metals. Retrieved January 25, 2010, from
http://www.rsc.org/chemsoc/visualelements/Pages/data/intro_groupi_data.html
Group 2- The alkaline earth metals. Retrieved January 25, 2010, from
http://www.rsc.org/chemsoc/visualelements/Pages/data/intro_groupii_data.html
“The Colors of the Sun” Sources:
Farabee, M. J. (2007). Photosynthesis. Retrieved January 18, 2010, from
http://www.emc.maricopa.edu/faculty/farabee/BIOBK/BioBookPS.html
Kusterer, J. M. (2007). What wavelength goes with a color? Retrieved January 18, 2010, from
http://eosweb.larc.nasa.gov/EDDOCS/Wavelengths_for_Colors.html
Microscopes. Retrieved January 18, 2010, from
http://www.biologycorner.com/bio1/microscope.html