interactive map | sudanmapre.lbl.gov/wp-content/uploads/2015/07/sudan... · interactive map |...
TRANSCRIPT

Multi-criteria Analysis for Planning Renewable Energy
(MapRE)
INTERACTIVE MAP | SUDAN Of Southern and Eastern Africa Renewable Energy Zones (SEAREZs)
This interactive PDF map contains locations of high quality wind, solar photovoltaic (PV), and concentrated solar power (CSP) zones and estimated zone attributes important to the site-selection process (e.g., levelized cost of electricity; distance to nearest transmission lines, roads, and load centers; and proximity to load centers). Locations of existing or planned renewable energy power plants, transmission lines, substations, and load centers are also indicated on the map, conditional on data availability. In order to access different data layers and their attributes, this map must be opened using Adobe PDF Readers, which are free to download. This interactive map can be used in conjunction with the SEAREZ Multi-Objective Zone Ranking Tool. Please refer to the accompanying report for methods, assumptions, and references for data sources. Spatial data used in this interactive map can be downloaded from the MapRE (http://mapre.lbl.gov/) or the Global Atlas (http://globalatlas.irena.org/) websites. This map and its supporting study are the results of a collaboration between the International Renewable Energy Agency (IRENA), the Lawrence Berkeley National Laboratory (LBNL), and University of California at Berkeley (UCB) as part of the Africa Clean Energy Corridor Initiative © 2015.

International Renewable Energy Agency Disclaimer:
The designations employed and the presentation of materials herein do not imply the expression of any opinion whatsoever on the part of the International Renewable Energy Agency concerning the legal status of any country, territory, city or area or of its authorities, or concerning the delimitation of its frontiers or boundaries. While this publication promotes the adoption and use of renewable energy, the International Renewable Energy Agency does not endorse any particular project, product or service provider.
Lawrence Berkeley National Laboratory Disclaimer:
This document was prepared as an account of work sponsored by the United States Government. While this document is believed to contain correct information, neither the United States Government nor any agency thereof, nor the Regents of the University of California, nor any of their employees, makes any warranty, express or implied, or assumes any legal responsibility for the accuracy, completeness, or usefulness of any information, apparatus, product, or process disclosed, or represents that its use would not infringe privately owned rights. Reference herein to any specific commercial product, process, or service by its trade name, trademark, manufacturer, or otherwise, does not necessarily constitute or imply its endorsement, recommendation, or favoring by the United States Government or any agency thereof, or the Regents of the University of California. The views and opinions of authors expressed herein do not necessarily state or reflect those of the United States Government or any agency thereof or the Regents of the University of California.
Boundaries and names shown in maps within the publication do not imply official endorsement by the International Renewable Energy Agency, the Lawrence Berkeley National Laboratory, or the University of California at Berkeley. The purpose of this map and its supporting study is to support high-level transmission and generation planning, and not to recommend specific project siting and land use decisions. Acknowledgements: We gratefully acknowledge the Africa Development Bank's Africa Infrastructure Country Diagnostic (AICD) Initiative for the inspiration to create these interactive PDF maps.

HOW TO USE THIS MAP
VIEWING LAYERS a) On the left hand side menu, click on the layers icon.
b) Expand folders you wish to view. Individual layers are classified under three folders - INFRASTRUCTURE, RENEWABLE ENERGY ZONES, and DEVELOPMENT CONSTRAINTS.
c) Each layer within a folder can be turned “on” or “off” by clicking on the “eye” icon. The legend on the right side of the map explains the symbology of each layer.
d) The renewable energy zones for each of the three technologies are colored by the estimated total levelized cost of energy (LCOE) for that technology. The legend on the right side of the map shows the corresponding LCOE costs (USD/MWh) for each color.
VIEWING ATTRIBUTES The detailed attributes of each SEAREZ are embedded in this map. These attributes are described on page 5 of this interactive PDF. Below are two ways to access these attributes:
a) Select Zone ID and retrieve attributes and location. The attribute table can be accessed for a zone by clicking on the Model Tree icon on the left menu. Within the Model Tree, expand the folders of the layers containing the zones and select a zone ID (e.g., “A”). An example Model Tree folder structure is shown here (right). The attributes (e.g. levelized cost of energy for generation, transmission and roads, distance to load centers) for each zone will be displayed on the bottom, left menu, beneath the Model Tree folder structure once you click on the zone ID. An example attribute table is shown here (lower right). You may also locate this zone on the map by right clicking on the zone ID-> Zoom to Selection. This feature is useful for locating zones identified through the Multi-Objective Zone Ranking Tool.
b) Select location and retrieve attributes. Turn on the “Object Analysis Tool.” In Adobe Acrobat Reader X, this tool is under Edit -> Analysis -> Object Data Tool. In Acrobat Pro X, this tool is under Tools -> Analyze -> Object Data Tool. For other versions of Adobe Reader, please refer to Adobe’s documentation to find the Object Analysis Tool. The Model Tree icon will appear on the left menu if it not already available. Once the Object Analysis Tool has been activated, the cursor changes to a “cross”. Move the cursor over a zone (or any other feature in the map), and click multiple times (giving at least a couple of seconds between each click). Each click opens a layer’s folder in order to retrieve the final zone ID and its attributes. The map may highlight all selectable areas in red in between mouse clicks. Only the selected zone should be outlined in red once its attribute table has been retrieved. Please keep in mind that this way of assessing attributes may be slow.
c) If a map has been georeferenced, the latitude and longitude coordinates in decimal degrees can be displayed for any location on the map by accessing the “Geospatial Location Tool,” found in the same menu as the “Object Analysis Tool.”

IJ
AN
AL
CB
DL
H
AR
AF
CD
DO
AB
Q
DI
AV
X
CN
L
CI
T
AQ
AC
Y
AO
P
DN
G
W
BE
AD
BR
AG
AM
CO
CT
AU
E
V
DM
BQ
N
F
D
AA
R
BU
DK
BX
CJCR
CU
BC
DC
BZ
CF
CA
AP
AE
DG
CP
SAK
DF
K
U
Z
DE
CV
DA
O
BP
BJ
AT
A
DH
BH
AJ
BFBG
AH
CE
BB
DJ
AY
DR
CX
C
DB
AI
BK BW
CM
CCCQ
CL
CW
BI
DT
DD
DP
AS
AX
BA
CS
BN
BD
CG
BV
AZ
BY
CK
BO
CH
DQ
AW
BL
B
BS
M
CY
BT
DS
CZ
BM
IH
J
A
E
K
G
D
F
N
Q
S
L
M
DV
IJ
SS
O
IF
ZI
PE
II
B
VK
MO
XI
ITJA
WL
OR
NO
BT
LH
UQ
UE
SA
LI
JW
ZJ
LS
SR
VS
CI
WJ
UT
FI
JU
LV
CK
CF
IH
IQ
IM
IO
ZY
GL
JS
RX
LU
JV
QO
PO
IP
PQ
XH
TY
ZL
YI
YC
ABLRT
IZ
YB
OL
PY
LA
XP
KA
ZF
WK
JP
LX
GF
AAA
IG
NIBQ
QE
YJ
KX
YA
IR
ZK
SP
GX
ZC
KEXKXB
RY
AFC
RQ
NU
QG
UF
UV
SB
C
QB
PZ
ACW
KZ
TF
PN
KF
ZP
JY
TCUK
UR
GK
PI
SL
RC
TW
VW
YO
ZN
QCKU
ABZ
LY
ADC
AFE
XO
ZD
NQ
TI
YF
JT
SV
XN
RZ
PF
ZZ
CA
ID
ZG
SZ
AFA
DX
QD
INXJ
OV
IS
IB
LC
OI
ABP
JR
XL
JI
TE
RF
AEK
DYIK
GP
LB
KS
OS
FF
XC
AEE
LT
PJ
ABA
ADA
YM
XG
YE
TD
ABO
HP
UD
OQ
LZ
GG
JX
KV
KG
IA
ABI
PK
LGEH
JE
AAF
OT
OP
XF
NW
GI
ST
UP
YK
QA
ZH
PH
QF
OU
AAE
LD
AEG
XS
LN
XE
SU
YN
KBRW
PS
AEH
VV
AEJYD
YH ABX
XD
AAH
ABQ
ACT
MS
LQ
OK
ACX
VM
AEU
FE
GV
DK
ABE
AEI
XA
AEF
ADG
AEP
KK
YS
ZQ
PG
ADF
ZB
ACR
YL
KW
OG
KI ED
RM
UH
TQ
ZE
TJ
JL PD
ZT
UI
AAZ
UL
AET
WP
WG
AACAEZ
IW
ABK
SO
ABD
AELAEN
ACZ
SESX
VL
ADB
UA
ABH
PR
OZ
TH
AEYXY
VD
ABC
ADE
OH
AAD
AEW
AAY
SD
ZO
YX
ACS
ACV
AAP
UO
TR
ABM
XQ
XU
SC
FW
WY
AEM
VI
ACQ
HU
ADY
AAI
FS
WS
GN
ACF
RROE
YV
SY
AAX
RU
ZU
ABB
UG TX
GJ
ACL
ZX
ADK
AAU
YR
YG
ACC
GW
OA
SI
FY
ACN
HX
YW
ACD
EE
R
WI
MZ
QP
DN
IE
BU
LF
CL
MN
EY
GE
IL IY
CG
BY
FH
QYCH RD
MW
QV
RP
EQ
GR
JZ
MP
KC
BS EA
RH
QZ RG
DZ
NZ
EW
AEO
NV
OO
NA
GS
MU
WA
MT
MM
EBKY
EK
CB
RB
KT
LJ
BX
LE
NT
NS
MF
EZ
AEV
MA
MR
FM
MY
HF
NB
MK
NN
EI
YP
KR
FK
RA
VU
NY
BR
CD
NX
FG
GT
NP
BZ
OM
QX
HV
ABJ
MQ
AEX
XMPM
ML
NR QW
ER
DDNC
FT
ZM
AFF
SQ
QUIC
MX
BM
PP
QJ
WZ
PC
MI
MD
BW
AZ
LW
MV
DW
QT
AAB
QN
EXBB
JQ
CE
UZ
KQ
ON
MB
FV
RV
PW
WH
EF
BF
MC
KD
ES
ADI
DL
VB
LK
TL
QL
VX
NJ
ABR
BG
KP
ABY
AES
JO
ABG
IU
WB
CY
USTN
EO
ABF
UB
VP
PU
ABN
DS
NK
AER
JKPT
TB
FL
HO
AEQ
VE
ABT
AECQ
ACJACU
RE
VT
VQ
QR
PL
DQ
CWEP
GM
AD
VO
VZ
DU
GQ
AFD
EJ
WV
SN
QM
DP
EU
ADL
NF
EC
RI
QI
QK
TO
LM
TZ
AAG
HS
EV
ADDACP
ACO
NH
HY
JD
PB
BP
HB
PX
FC
NGKL
CC
VN
ACY
AAK
DTBH
VJ
MJ
BI
SW
ZA
TV
GB
CS
BO
CV
WWLL
ABS
ACB
GC
ACI
WN
BV
TM
MG
WO
ABV
TS
ADOADN
OD
DC
EL
RJ
RK
GD
PV
WMUU
KO
CU
UY
JF
WXWQ
EM
VY
IV
JB
GUUW
AFB
FQ
RS
BC KM
NM
YY
SJ
TG
UJ
XV
WF
ACM
FB
FU
IX
WE
ADX
SM
HR
KN
TP
JG
VR
EG
AF
RL
WD
GHUN
OB
VC
SF
ACE
ADH
UC
FP
UM
JJ
KH
NL
TT
XT
FD
WC
OJ
LO
WT
JC
AEA
HE
AQ
LR
XW
VF
GO
BL
AARAAW
Y
RO
ACA
YZ
DO
JM OY
RN
OC
ADP
DF
FZ
BN
TU
AAV
ND
AAQ
ADJ
OX
AAS
ZW
AAM
DR
HZ
PA
ABW
YT
JH
ADM
XZ
ZS
SHTA
ADZ
KJ
HH
XX
AAT
VH
ADS
FX
CX
ZV
ADR
AI
AAL
SK
BE
HW
DM
CT
ABU
TK
EN
QS
WU
YQ
ZR
AAJ
MH
OW
HQ
DG
YU
FR
JN
DA
OF
BD
ET
GA
ADT
SG
FN
DH
AEB
AED
VA
ACG
ADW
AAN
CM
AEC
VG
HC
X
FJ
GY
WR
XR
HN
HD
ACH
GZ
BA
AAO
DJ
LP
ADV
CJ
ADQ
Z
FA
ACK
AFG
AO
ME
CZ
AP
CP
FO
DB
BJ
UX
CO
NE
DE
AJ
AG
CN
AB
ADU
AM
AYP
DI
BK
HI
T
AH
V
AS
AR
AV
CRU
HG
AL
AA
HT
AW
HJ
HA
AT
QH
HK
AX
AN
HM
AFK
AU
AK
AFL
AFH
AC
W
AFJ
AFI
HL
A
HC
IB
Z
GTHI
IC
X
EV
EI
BI
EKDI
IK
P
EJ
DY
DX
BE
DP
AW
ECGYDM
GS
EU
DS
BPDW
HG
AF
DV
BL FR
BUBF
EL
BQ
DJ
BH
BT
BREH
AX
HS
EBED
EE
AY
BC
S
EN
BB
ES
DN
DT
DR
DD
HZ
BA
AN
AT
DU
EW
AS
AH
COCN
AI
BN
CL
FQ
DE
CK
CB
AJ
HOAP
Y
AZ
GV
BJ
FU
AV
IA
DO
DGHW
AC
GQ HQ
BK
EG
GW
ET
R
AE
BD
HL
EF
HA
II
EP
EA
TU
EM
EQ
OV
ER
HVHX
DL
HJ
HK
W
AB
DF
AD
DK
DZ
FX
EO
BX
BG
GU
GZ
HHDH
GF
FY
DQ
GM
BS
HNCI
CFFM
AA
IL
FN
GH
GX
BM
Q
HU
CU
GIFE
HF DB
AL
N
BY
I
AR
BV
IJ
HP
GA
GD
AKGC
AQ
HT
GL
HY
HR
GK
AO
BW
FL
M
FW
HE
FD
FJ
AG
FP
CZ
FS
CGCJ CP
CX
FO
FB
CS
AM
IF
HB
HM
FA
GJ
CM
GN
D
GG
FC
BZ
CWCT
CH
CV
CY
EZ
BO
FKDA
DC
CC
CQ
CE
CD CR
E
FT
AU
GR
J
GE
IG
L
FG
H
FH
IE
CA
IH
FZ
G
K
GP
HD
ID
FV
IM
GB
CF
IN
GO
FF
EYEX
FI
RENEWABLE ENERGY ZONES
DEVELOPMENT CONSTRAINTS
INFRASTRUCTURE
Total Levelized Cost of Electricity
Renewable energy power plants
Wind Solar CSPSolar PV
SubstationsMaximum rating (kV)
Geothermal
WindSolar PVSolar CSP
Water bodies
Operational Potential/proposed
Transmission linesExistin
g
Major cities Roads
(USD/MWh)
Geothermal
WindSolar PV
Solar CSP
SUDAN
Not specified
Planned
Unknown
> 400 301 - 400201 - 300
101 - 20066 - 100
> 500 kV 401 - 500 kV301 - 400 kV201 - 300 kV
101 - 20066 - 100
ExistingPlann
ed
Protected areas
< 5051 - 6061 - 7071 - 8081 - 9091 - 100101 - 110111 - 120121 - 130> 131
< 120121 - 125126 - 130131 - 135136 - 140141 - 145146 - 150151 - 155156 - 160> 161
< 200201 - 205206 - 210211 - 215216 - 220221 - 225226 - 230231 - 235236 - 240> 241
Land use\land cover (solar)Land use\land cover (wind)
Population (>100 persons/km2)
ElevationSlope (solar)Slope (wind)

ATTRIBUTE TABLE DESCRIPTIONS The attribute table, once retrieved, will be displayed on the bottom, left-hand side of the Model Tree menu. Blue highlighted cells indicate attributes that are specific to wind zones, orange highlighted cells indicate attributes specific to solar CSP zones, and yellow highlighted cells indicate attributes specific to solar PV. All other attributes are common between technologies.
ATTRIBUTE NAME DESCRIPTION
zone_identification This is the unique alphabetical identifier for the zones. Zones are labeled on the map using this identifier.
Electricity generation attributes: Estimated annual average electricity generation in MWh for the following:
A) Electricity_generation_discounted_MWhPerYr Solar PV, assuming a 90% land use discount factor.
B) Electricity_generation_discounted_chosenTurbine_MWhPerYr Wind using the optimally selected IEC turbine class, assuming a 75% land use discount factor.
C) Electricity_generation_discounted_classIIturbine_MWhPerYr Wind using IEC Class II turbines, assuming a 75% land use discount factor.
D) Electricity_generation_discounted_noStorage_MWhPerYr Solar CSP without storage, assuming a 90% land use discount factor.
E) Electricity_generation_discounted_6hrsStorage_MWhPerYr Solar CSP with 6 hours of storage, assuming a 90% land use discount factor.
Potential installed capacity attributes: Potential capacity (MW) that could be installed within a zone for the following:
installedCapacity_MW Solar PV or wind, assuming a 90% and 75% land use discount factor, respectively.
installedCapacity_noStorage_MW Solar CSP without storage, assuming a 90% land use discount factor.
installedCapacity_6hrsStorage_MW Solar CSP with 6 hours of storage, assuming a 90% land use discount factor.
area_km2 Total area of the zone in units of square kilometers
Levelized cost of electricity (LCOE) of non-generation components attributes:
Average levelized cost of electricity (in USD/MWh) for the non-generation components of the following (values are only reported if transmission or substation data could be procured):
A) LCOE_transmission_USDperMWh Solar PV, estimated using distance to the nearest transmission line, if available.
B) LCOE_substation_USDperMWh Solar PV, estimated using distance to the nearest substation, if available.
C) LCOE_road_USDperMWh Solar PV, estimated using distance to the nearest road.
D) LCOE_transmission_chosenTurbine_USDperMWh Wind using the optimally selected IEC turbine, estimated using nearest transmission line.
E) LCOE_substation_chosenTurbine_USDperMWh Wind using the optimally selected IEC turbine, estimated using nearest substation.
F) LCOE_road_chosenTurbine_USDperMWh Wind using the optimally selected IEC turbine, estimated using nearest road.
G) LCOE_transmission_6hrsStorage_USDperMWh Solar CSP with 6 hours of storage, estimated using nearest transmission line.
H) LCOE_substation_6hrsStorage_USDperMWh Solar CSP with 6 hours of storage, estimated using nearest substation.
I) LCOE_road_6hrsStorage_USDperMWh Solar CSP with 6 hours of storage, estimated using nearest road.
Levelized cost of electricity (LCOE) of generation component attributes:
Average levelized cost of electricity (in USD/MWh) for generation component of the following technologies (values were estimated using the location’s capacity factor and efficiencies specific to the technology):
A) LCOE_generation_USDperMWh Solar PV
B) LCOE_generation_chosenTurbine_USDperMWh Wind using the optimally selected IEC turbine class.
C) LCOE_generation_classIIturbine_USDperMWh Wind using IEC Class II turbine.
D) LCOE_generation_noStorage_USDperMWh Solar CSP without storage.
E) LCOE_generation_6hrsStorage_USDperMWh Solar CSP with 6 hours of storage.
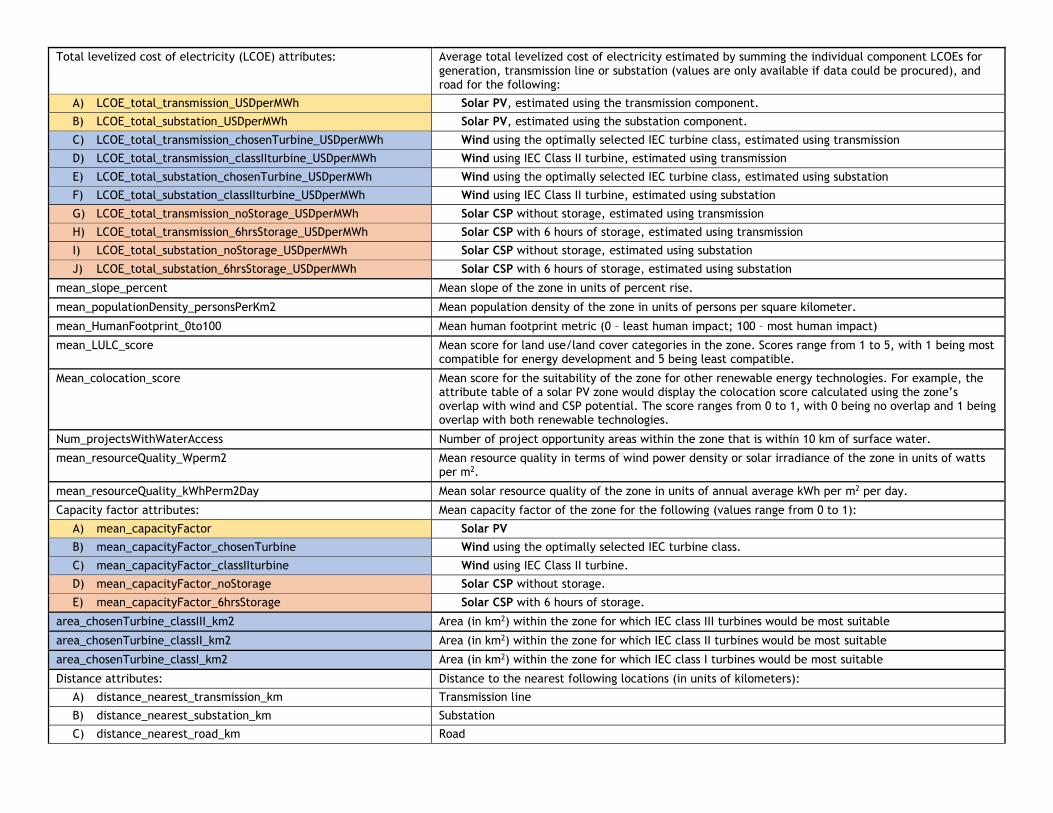
Total levelized cost of electricity (LCOE) attributes: Average total levelized cost of electricity estimated by summing the individual component LCOEs for generation, transmission line or substation (values are only available if data could be procured), and road for the following:
A) LCOE_total_transmission_USDperMWh Solar PV, estimated using the transmission component.
B) LCOE_total_substation_USDperMWh Solar PV, estimated using the substation component.
C) LCOE_total_transmission_chosenTurbine_USDperMWh Wind using the optimally selected IEC turbine class, estimated using transmission
D) LCOE_total_transmission_classIIturbine_USDperMWh Wind using IEC Class II turbine, estimated using transmission
E) LCOE_total_substation_chosenTurbine_USDperMWh Wind using the optimally selected IEC turbine class, estimated using substation
F) LCOE_total_substation_classIIturbine_USDperMWh Wind using IEC Class II turbine, estimated using substation
G) LCOE_total_transmission_noStorage_USDperMWh Solar CSP without storage, estimated using transmission
H) LCOE_total_transmission_6hrsStorage_USDperMWh Solar CSP with 6 hours of storage, estimated using transmission
I) LCOE_total_substation_noStorage_USDperMWh Solar CSP without storage, estimated using substation
J) LCOE_total_substation_6hrsStorage_USDperMWh Solar CSP with 6 hours of storage, estimated using substation
mean_slope_percent Mean slope of the zone in units of percent rise.
mean_populationDensity_personsPerKm2 Mean population density of the zone in units of persons per square kilometer.
mean_HumanFootprint_0to100 Mean human footprint metric (0 – least human impact; 100 – most human impact)
mean_LULC_score Mean score for land use/land cover categories in the zone. Scores range from 1 to 5, with 1 being most compatible for energy development and 5 being least compatible.
Mean_colocation_score Mean score for the suitability of the zone for other renewable energy technologies. For example, the attribute table of a solar PV zone would display the colocation score calculated using the zone’s overlap with wind and CSP potential. The score ranges from 0 to 1, with 0 being no overlap and 1 being overlap with both renewable technologies.
Num_projectsWithWaterAccess Number of project opportunity areas within the zone that is within 10 km of surface water.
mean_resourceQuality_Wperm2 Mean resource quality in terms of wind power density or solar irradiance of the zone in units of watts per m2.
mean_resourceQuality_kWhPerm2Day Mean solar resource quality of the zone in units of annual average kWh per m2 per day.
Capacity factor attributes: Mean capacity factor of the zone for the following (values range from 0 to 1):
A) mean_capacityFactor Solar PV
B) mean_capacityFactor_chosenTurbine Wind using the optimally selected IEC turbine class.
C) mean_capacityFactor_classIIturbine Wind using IEC Class II turbine.
D) mean_capacityFactor_noStorage Solar CSP without storage.
E) mean_capacityFactor_6hrsStorage Solar CSP with 6 hours of storage.
area_chosenTurbine_classIII_km2 Area (in km2) within the zone for which IEC class III turbines would be most suitable
area_chosenTurbine_classII_km2 Area (in km2) within the zone for which IEC class II turbines would be most suitable
area_chosenTurbine_classI_km2 Area (in km2) within the zone for which IEC class I turbines would be most suitable
Distance attributes: Distance to the nearest following locations (in units of kilometers):
A) distance_nearest_transmission_km Transmission line
B) distance_nearest_substation_km Substation
C) distance_nearest_road_km Road
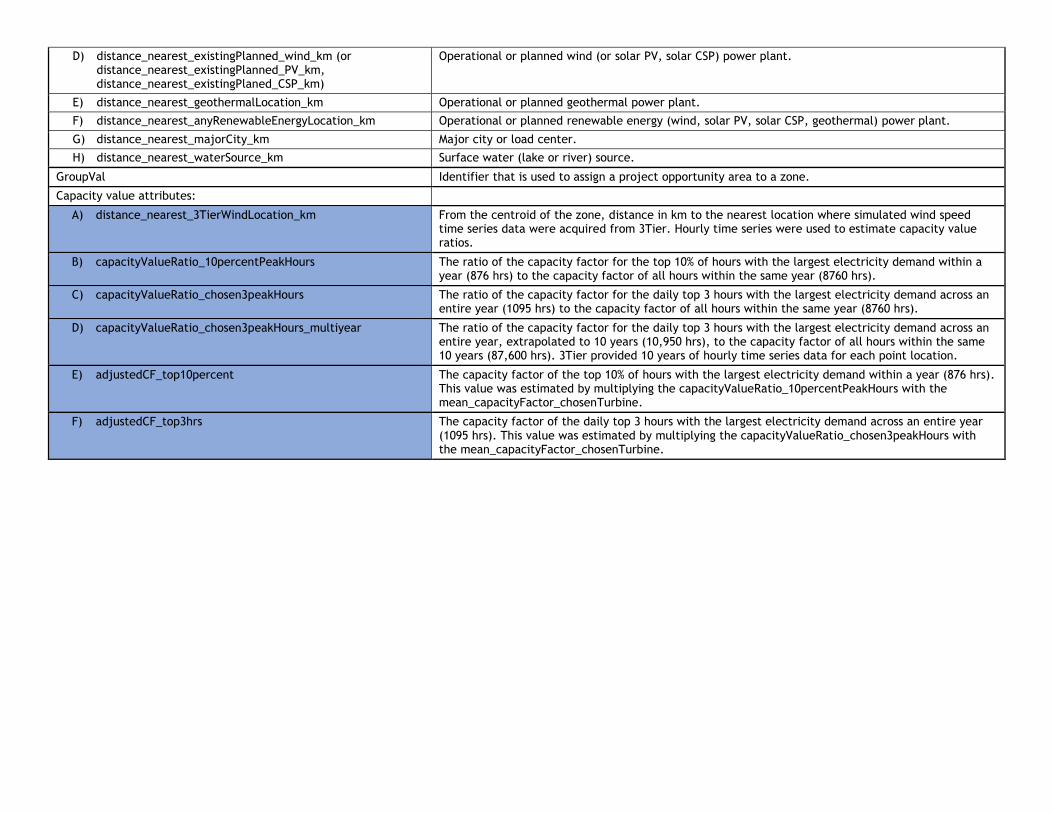
D) distance_nearest_existingPlanned_wind_km (or distance_nearest_existingPlanned_PV_km, distance_nearest_existingPlaned_CSP_km)
Operational or planned wind (or solar PV, solar CSP) power plant.
E) distance_nearest_geothermalLocation_km Operational or planned geothermal power plant.
F) distance_nearest_anyRenewableEnergyLocation_km Operational or planned renewable energy (wind, solar PV, solar CSP, geothermal) power plant.
G) distance_nearest_majorCity_km Major city or load center.
H) distance_nearest_waterSource_km Surface water (lake or river) source.
GroupVal Identifier that is used to assign a project opportunity area to a zone.
Capacity value attributes:
A) distance_nearest_3TierWindLocation_km From the centroid of the zone, distance in km to the nearest location where simulated wind speed time series data were acquired from 3Tier. Hourly time series were used to estimate capacity value ratios.
B) capacityValueRatio_10percentPeakHours The ratio of the capacity factor for the top 10% of hours with the largest electricity demand within a year (876 hrs) to the capacity factor of all hours within the same year (8760 hrs).
C) capacityValueRatio_chosen3peakHours The ratio of the capacity factor for the daily top 3 hours with the largest electricity demand across an entire year (1095 hrs) to the capacity factor of all hours within the same year (8760 hrs).
D) capacityValueRatio_chosen3peakHours_multiyear The ratio of the capacity factor for the daily top 3 hours with the largest electricity demand across an entire year, extrapolated to 10 years (10,950 hrs), to the capacity factor of all hours within the same 10 years (87,600 hrs). 3Tier provided 10 years of hourly time series data for each point location.
E) adjustedCF_top10percent The capacity factor of the top 10% of hours with the largest electricity demand within a year (876 hrs). This value was estimated by multiplying the capacityValueRatio_10percentPeakHours with the mean_capacityFactor_chosenTurbine.
F) adjustedCF_top3hrs The capacity factor of the daily top 3 hours with the largest electricity demand across an entire year (1095 hrs). This value was estimated by multiplying the capacityValueRatio_chosen3peakHours with the mean_capacityFactor_chosenTurbine.