interactive visualization of genomic data - bioconductor · outlineintroduction qt-based...
TRANSCRIPT
Outline Introduction Qt-based Interactive Graphics Canvas Looking Forward: Integration
Interactive Visualization of Genomic DataInterfacing Qt and R
Michael Lawrence
November 17, 2010

Outline Introduction Qt-based Interactive Graphics Canvas Looking Forward: Integration
1 Introduction
2 Qt-based Interactive Graphics CanvasDesignImplementation
3 Looking Forward: IntegrationBioconductorExternal Tools
Typical Genome Browser Plot
chr11:
ENST00000399397
Mammal Cons
RhesusMouse
DogHorse
ArmadilloOpossumPlatypus
LizardChicken
X_tropicalisStickleback
17530000 17535000 17540000 17545000data
Ensembl Gene Predictions
Human ESTs That Have Been Spliced
Vertebrate Multiz Alignment & PhastCons Conservation (28 Species)
user
360.72 _
-74.05 _
0 -
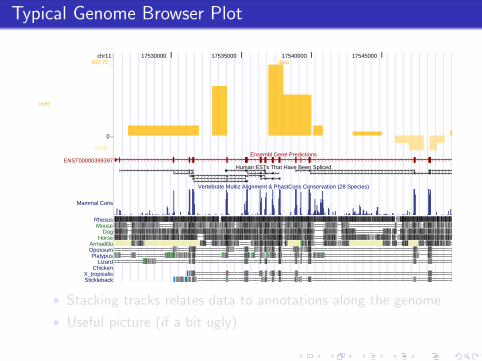
• Stacking tracks relates data to annotations along the genome
• Useful picture (if a bit ugly)
Typical Genome Browser Plot
chr11:
ENST00000399397
Mammal Cons
RhesusMouse
DogHorse
ArmadilloOpossumPlatypus
LizardChicken
X_tropicalisStickleback
17530000 17535000 17540000 17545000data
Ensembl Gene Predictions
Human ESTs That Have Been Spliced
Vertebrate Multiz Alignment & PhastCons Conservation (28 Species)
user
360.72 _
-74.05 _
0 -
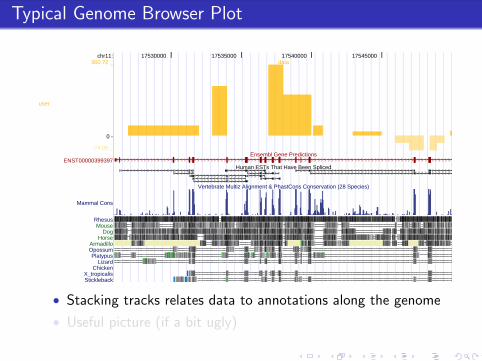
• Stacking tracks relates data to annotations along the genome
• Useful picture (if a bit ugly)
Typical Genome Browser Plot
chr11:
ENST00000399397
Mammal Cons
RhesusMouse
DogHorse
ArmadilloOpossumPlatypus
LizardChicken
X_tropicalisStickleback
17530000 17535000 17540000 17545000data
Ensembl Gene Predictions
Human ESTs That Have Been Spliced
Vertebrate Multiz Alignment & PhastCons Conservation (28 Species)
user
360.72 _
-74.05 _
0 -
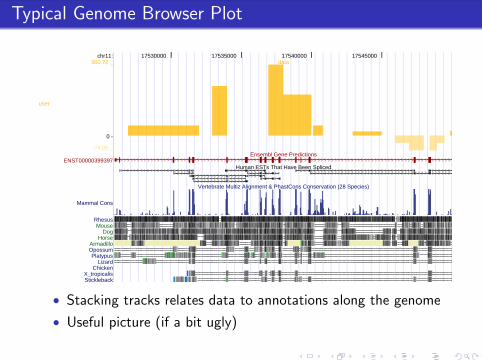
• Stacking tracks relates data to annotations along the genome
• Useful picture (if a bit ugly)
Outline Introduction Qt-based Interactive Graphics Canvas Looking Forward: Integration
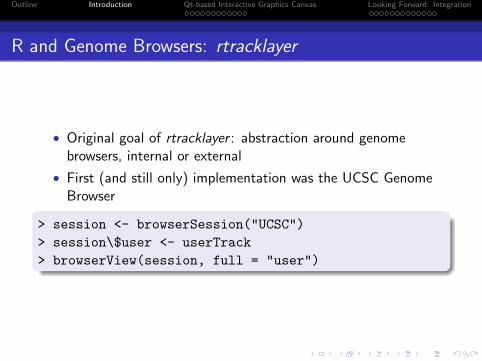
R and Genome Browsers: rtracklayer
• Original goal of rtracklayer : abstraction around genomebrowsers, internal or external
• First (and still only) implementation was the UCSC GenomeBrowser
> session <- browserSession("UCSC")
> session\$user <- userTrack
> browserView(session, full = "user")
Outline Introduction Qt-based Interactive Graphics Canvas Looking Forward: Integration
Thinking Outside the Browser
Genome Browser
• Look at the data in multiple, coordinated views
• Jump to the most interesting parts of the data
• Move beyond the genome axis
Outline Introduction Qt-based Interactive Graphics Canvas Looking Forward: Integration
Thinking Outside the Browser
Genome Browser Data Visualization
• Look at the data in multiple, coordinated views
• Jump to the most interesting parts of the data
• Move beyond the genome axis

Outline Introduction Qt-based Interactive Graphics Canvas Looking Forward: Integration
Thinking Outside the Browser
Genome Browser Data Visualization
• Look at the data in multiple, coordinated views
• Jump to the most interesting parts of the data
• Move beyond the genome axis
Outline Introduction Qt-based Interactive Graphics Canvas Looking Forward: Integration
Thinking Outside the Browser
Genome Browser Data Visualization
• Look at the data in multiple, coordinated views
• Jump to the most interesting parts of the data
• Move beyond the genome axis
Outline Introduction Qt-based Interactive Graphics Canvas Looking Forward: Integration
Thinking Outside the Browser
Genome Browser Data Visualization
• Look at the data in multiple, coordinated views
• Jump to the most interesting parts of the data
• Move beyond the genome axis

Outline Introduction Qt-based Interactive Graphics Canvas Looking Forward: Integration
Interactive Graphics
• Many types of data
• Many types of plots,interactions
• Many preprocessingapproaches, statistics,transformations, ...
Data
X Y Z........................
Color, ...............................
Outline Introduction Qt-based Interactive Graphics Canvas Looking Forward: Integration
Interactive Graphics
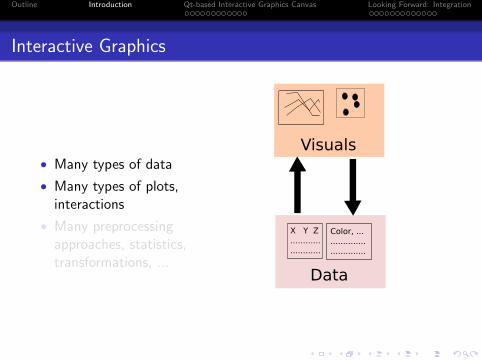
• Many types of data
• Many types of plots,interactions
• Many preprocessingapproaches, statistics,transformations, ...
Visuals
Data
X Y Z........................
Color, ...............................
Outline Introduction Qt-based Interactive Graphics Canvas Looking Forward: Integration
Interactive Graphics
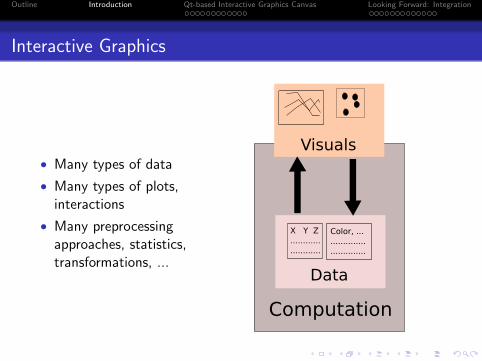
• Many types of data
• Many types of plots,interactions
• Many preprocessingapproaches, statistics,transformations, ...
Visuals
Data
X Y Z........................
Color, ...............................
Computation
Outline Introduction Qt-based Interactive Graphics Canvas Looking Forward: Integration
Interactive Graphics
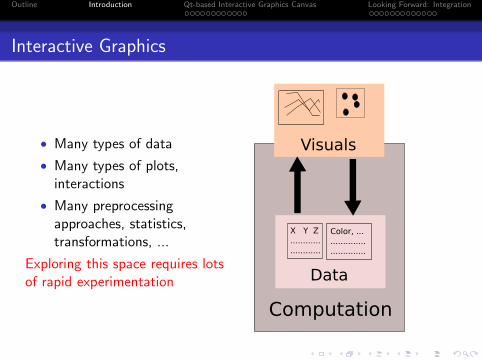
• Many types of data
• Many types of plots,interactions
• Many preprocessingapproaches, statistics,transformations, ...
Exploring this space requires lotsof rapid experimentation
Visuals
Data
X Y Z........................
Color, ...............................
Computation
Outline Introduction Qt-based Interactive Graphics Canvas Looking Forward: Integration
Design
Outline
1 Introduction
2 Qt-based Interactive Graphics CanvasDesignImplementation
3 Looking Forward: IntegrationBioconductorExternal Tools
Outline Introduction Qt-based Interactive Graphics Canvas Looking Forward: Integration
Design
Overview
• Support constructing interactive graphics “from scratch” in R• R draws every graphical primitive• R handles every user event
• Maximize performance• Static graphics: Be lazy, little work as possible• Dynamic graphics: Only redraw what needs to be redrawn• Interactive graphics: Quickly map actions in the plot to actions
on the data
• Leave high-level graphics to other packages (e.g. mosaiq)
Outline Introduction Qt-based Interactive Graphics Canvas Looking Forward: Integration
Design
Optimized Rendering Layer
• Draw each unique glyph only once, blit to buffer
• Use hardware (OpenGL) whenever possible• Rarely-used GL POINT SPRITE mode draws glyphs (small
textures) at roughly same rate as GL POINTS (fastestprimitive)
• Drawing cached as texture through FBO
Outline Introduction Qt-based Interactive Graphics Canvas Looking Forward: Integration
Design
Layered Buffering Strategy
• Plot updates tend to be incremental, only a part of the plotchanges
• Divide the plot elements into layers, such that elements withinthe same layer tend to change together
• Cache each layer in a buffer, only redraw when necessary
• Compose plot by compositing/stacking the layers

Outline Introduction Qt-based Interactive Graphics Canvas Looking Forward: Integration
Design
Spatial Indexing
• Spatial indices (e.g. quad tree) provide fast ( O(log(n)))lookup of data elements from coordinates
• Lazily update spatial index whenever element positions havechanged and R requests a lookup
• Populate spatial index by passing a special renderer to the Rdrawing callback, thus indexing is transparent to R user
• Sometimes additional or separate logic is required (e.g. areaplots, smooth scatter)
Outline Introduction Qt-based Interactive Graphics Canvas Looking Forward: Integration
Implementation
Outline
1 Introduction
2 Qt-based Interactive Graphics CanvasDesignImplementation
3 Looking Forward: IntegrationBioconductorExternal Tools
Outline Introduction Qt-based Interactive Graphics Canvas Looking Forward: Integration
Implementation
Qt
• C++ application library forGUIs, graphics and lots more
• Professionally developed,open-source, maintained byNokia
• Basis of KDE desktop onLinux, MeeGo
• Official installer for all majorplatforms
Outline Introduction Qt-based Interactive Graphics Canvas Looking Forward: Integration
Implementation
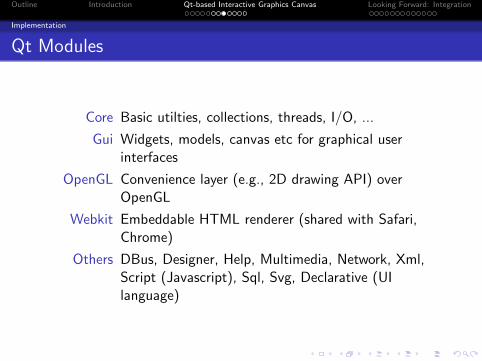
Qt Modules
Core Basic utilties, collections, threads, I/O, ...
Gui Widgets, models, canvas etc for graphical userinterfaces
OpenGL Convenience layer (e.g., 2D drawing API) overOpenGL
Webkit Embeddable HTML renderer (shared with Safari,Chrome)
Others DBus, Designer, Help, Multimedia, Network, Xml,Script (Javascript), Sql, Svg, Declarative (UIlanguage)
Outline Introduction Qt-based Interactive Graphics Canvas Looking Forward: Integration
Implementation
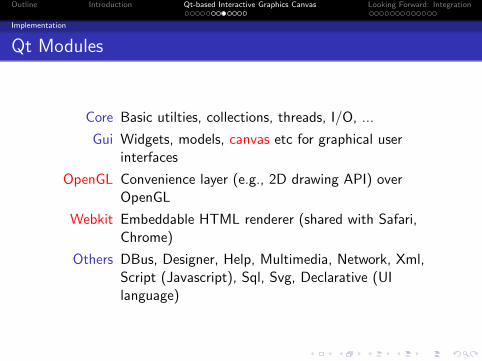
Qt Modules
Core Basic utilties, collections, threads, I/O, ...
Gui Widgets, models, canvas etc for graphical userinterfaces
OpenGL Convenience layer (e.g., 2D drawing API) overOpenGL
Webkit Embeddable HTML renderer (shared with Safari,Chrome)
Others DBus, Designer, Help, Multimedia, Network, Xml,Script (Javascript), Sql, Svg, Declarative (UIlanguage)

Outline Introduction Qt-based Interactive Graphics Canvas Looking Forward: Integration
Implementation
The qtpaint Package
Qt
SmokeGenerator
qtbase
Utilities
Type library
C++ Runtime
R Wrappers
OpenGL
TypeLibrary
qtpaint
Outline Introduction Qt-based Interactive Graphics Canvas Looking Forward: Integration
Implementation
The qtpaint Package
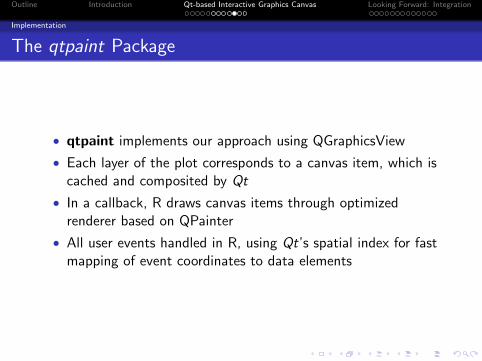
• qtpaint implements our approach using QGraphicsView
• Each layer of the plot corresponds to a canvas item, which iscached and composited by Qt
• In a callback, R draws canvas items through optimizedrenderer based on QPainter
• All user events handled in R, using Qt’s spatial index for fastmapping of event coordinates to data elements
Outline Introduction Qt-based Interactive Graphics Canvas Looking Forward: Integration
Implementation
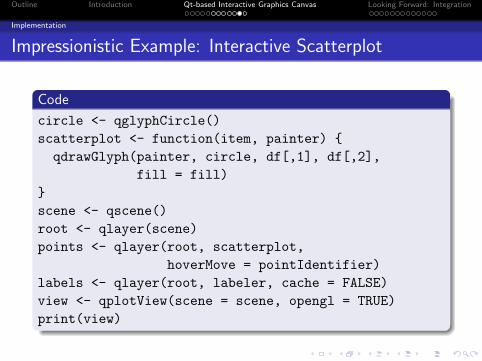
Impressionistic Example: Interactive Scatterplot
Code
circle <- qglyphCircle()
scatterplot <- function(item, painter) {
qdrawGlyph(painter, circle, df[,1], df[,2],
fill = fill)
}
scene <- qscene()
root <- qlayer(scene)
points <- qlayer(root, scatterplot,
hoverMove = pointIdentifier)
labels <- qlayer(root, labeler, cache = FALSE)
view <- qplotView(scene = scene, opengl = TRUE)
print(view)
Outline Introduction Qt-based Interactive Graphics Canvas Looking Forward: Integration
Implementation
VisNAB : VisNAB is Not A Browser
• Toolbox for interactive visualization of genomic data in R
• Joint work with Teng Fei Yin (intern), Nicholas Lewin-Koh
• Leverages Bioconductor infrastructure
Preprocessing ShortRead , BiostringsData Manipulation IRanges
• Relies on plumbr package from GGobi foundation for itsreference-based data model
• Demonstration on ChIP-seq data
Outline Introduction Qt-based Interactive Graphics Canvas Looking Forward: Integration
Bioconductor
Outline
1 Introduction
2 Qt-based Interactive Graphics CanvasDesignImplementation
3 Looking Forward: IntegrationBioconductorExternal Tools
Outline Introduction Qt-based Interactive Graphics Canvas Looking Forward: Integration
Bioconductor
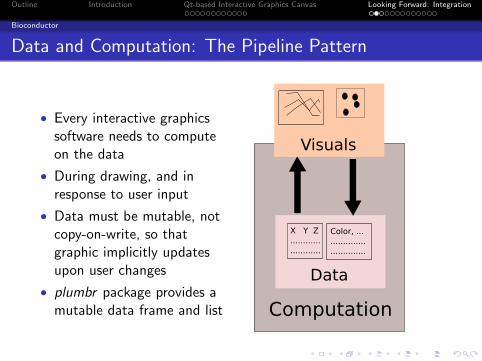
Data and Computation: The Pipeline Pattern
• Every interactive graphicssoftware needs to computeon the data
• During drawing, and inresponse to user input
• Data must be mutable, notcopy-on-write, so thatgraphic implicitly updatesupon user changes
• plumbr package provides amutable data frame and list
Visuals
Data
X Y Z........................
Color, ...............................
Computation
Outline Introduction Qt-based Interactive Graphics Canvas Looking Forward: Integration
Bioconductor
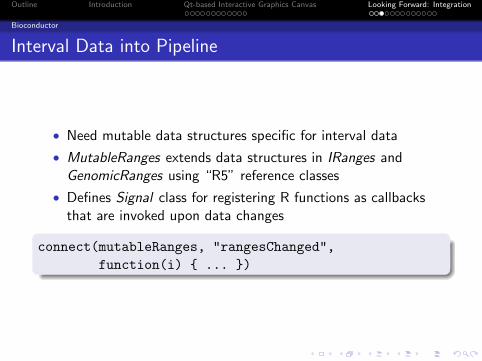
Interval Data into Pipeline
• Need mutable data structures specific for interval data
• MutableRanges extends data structures in IRanges andGenomicRanges using “R5” reference classes
• Defines Signal class for registering R functions as callbacksthat are invoked upon data changes
connect(mutableRanges, "rangesChanged",
function(i) { ... })
Outline Introduction Qt-based Interactive Graphics Canvas Looking Forward: Integration
External Tools
Outline
1 Introduction
2 Qt-based Interactive Graphics CanvasDesignImplementation
3 Looking Forward: IntegrationBioconductorExternal Tools
Outline Introduction Qt-based Interactive Graphics Canvas Looking Forward: Integration
External Tools
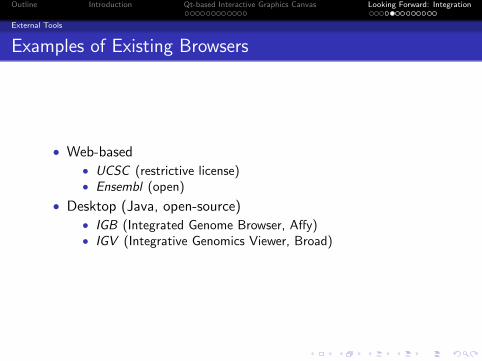
Examples of Existing Browsers
• Web-based• UCSC (restrictive license)• Ensembl (open)
• Desktop (Java, open-source)• IGB (Integrated Genome Browser, Affy)• IGV (Integrative Genomics Viewer, Broad)
Outline Introduction Qt-based Interactive Graphics Canvas Looking Forward: Integration
External Tools
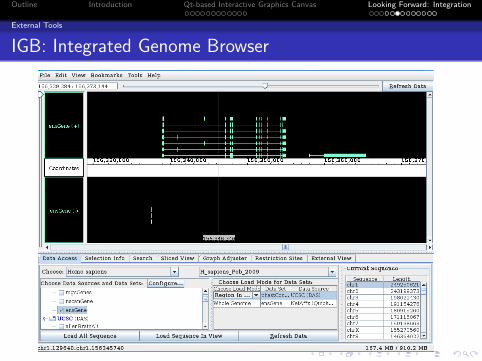
IGB: Integrated Genome Browser
Outline Introduction Qt-based Interactive Graphics Canvas Looking Forward: Integration
External Tools
Key IGB Features
Data All standard track formats, including SAM/BAM,also DAS and QuickLoad
Visualization Many plot types, combining plots, smooth zoom,some limited linked views (slice, external)
Computation Coverage, thresholding, track arithmetic
Outline Introduction Qt-based Interactive Graphics Canvas Looking Forward: Integration
External Tools
Future IGB Features
Adaptability Plugins, more configurable GUI
Visualization Multiple views
Computation More operations on tracks
Outline Introduction Qt-based Interactive Graphics Canvas Looking Forward: Integration
External Tools
IGB + R Integration: Requirements
Data Set genome, load URL, synchronize through shareddata models (mutable ranges)
Visualization Set view range, select features, control tier visibility,respond to changes in range and selection, customize
GUI Add R-driven actions, customize
Outline Introduction Qt-based Interactive Graphics Canvas Looking Forward: Integration
External Tools
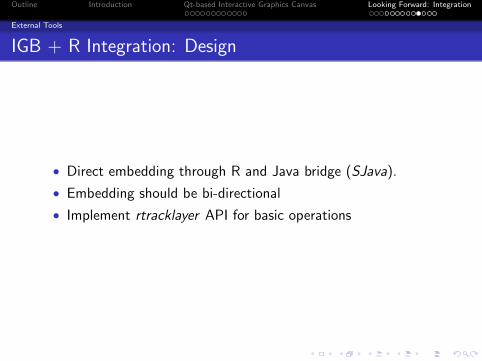
IGB + R Integration: Design
• Direct embedding through R and Java bridge (SJava).
• Embedding should be bi-directional
• Implement rtracklayer API for basic operations
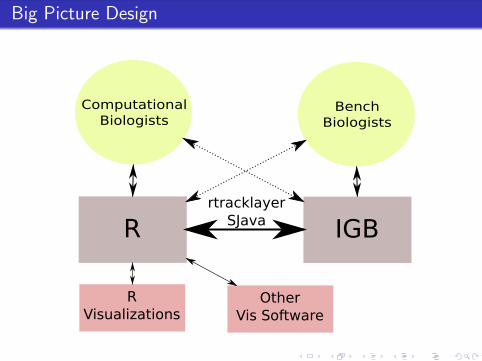
Big Picture Design
rtracklayerSJavaR IGB
ComputationalBiologists
Bench Biologists
R Visualizations
Other Vis Software
Outline Introduction Qt-based Interactive Graphics Canvas Looking Forward: Integration
External Tools
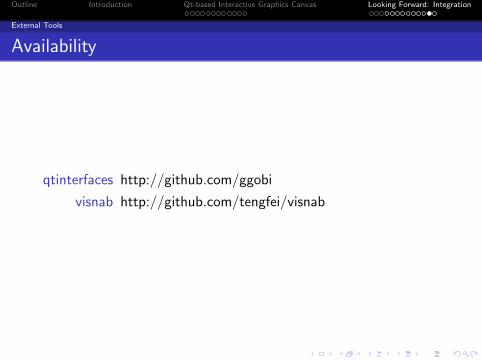
Availability
qtinterfaces http://github.com/ggobi
visnab http://github.com/tengfei/visnab

Outline Introduction Qt-based Interactive Graphics Canvas Looking Forward: Integration
External Tools
Acknowledgements
Deepayan SarkarHadley Wickham
Teng Fei YinNicholas Lewin-KohRobert Gentleman
GGobi Foundation