interactive whiteboard technologies in high school
TRANSCRIPT

INTERACTIVE WHITEBOARD TECHNOLOGIES IN HIGH SCHOOL: A
QUANTITATIVE, QUASI-EXPERIMENTAL COMPARISON OF THEIR
IMPACT ON THE LEVELS OF MEASURE THAT DETERMINE A
RETURN ON INVESTMENT
by
Joseph Michael Schipper
Liberty University
A Dissertation Presented in Partial Fulfillment
Of the Requirements for the Degree
Doctor of Education
Liberty University
2015

2
INTERACTIVE WHITEBOARD TECHNOLOGIES IN HIGH SCHOOL: A
QUANTITATIVE, QUASI-EXPERIMENTAL COMPARISON OF THEIR
IMPACT ON THE LEVELS OF MEASURE THAT DETERMINE A
RETURN ON INVESTMENT
by
Joseph Michael Schipper
Liberty University
A Dissertation Presented in Partial Fulfillment
Of the Requirements for the Degree
Doctor of Education
Liberty University, Lynchburg, VA
2015
APPROVED BY:
Russell G. Yocum, Ed.D., Committee Chair
Jerry L. Woodbrige-Cornell, Ph.D., Committee Member
S. Kambar Khoshaba, Ed.D., Committee Member
Scott Watson, Ph.D., Associate Dean, Advanced Programs

3
ABSTRACT
This quantitative, quasi-experimental, non-equivalent group study will examine the
impact on levels of measure that determine a return on investment (ROI) of differing
forms of interactive whiteboard (IWB) technology utilized with a class\room technology
package consisting of a video projector, a document camera, and a computer at a high
school in a suburban school district in southeastern Virginia. Three forms of IWB will be
compared: a full screen IWB, a mobile interactive whiteboard (MIWB) and a tablet based
whiteboard app (IWBAPP). Student performance and survey data will be analyzed to
determine the impact on students and teachers who were exposed to the three forms of
whiteboard technologies. The ROI levels of measure for the three technologies will be
compared to groups that did not utilize any IWB. The indication of the results will be
discussed further. Additionally, the limitations and suggestions for further research will
be discussed.
Keywords: Interactive Whiteboard, Instructional Technology, Return on
Investment, Quantitative, Technology

Dedication
For Jay who continually makes me proud
And for Cindy, who centers and grounds me, and who accepts and loves me regardless

5
Acknowledgments
Dr. Kambar Khoshaba, who has been a great friend and mentor to me
Dr. Russ Yocum, for his guiding hand and continuous encouragement to “Press On”
The faculty and staff at Liberty for their wonderful instruction as well as the support of
those who have served in the military, including me
And God – who gave me the strength to carry on with this, many times in spite of myself

6
Table of Contents
ABSTRACT ................................................................................................................................. 3
Dedication ................................................................................................................................ 4
Acknowledgments .................................................................................................................... 5
List of Tables .......................................................................................................................... 10
List of Figures ........................................................................................................................ 12
List of Abbreviations .............................................................................................................. 16
CHAPTER ONE: INTRODUCTION ........................................................................................ 17
Background ............................................................................................................................ 17
Problem Statement ................................................................................................................. 18
Purpose Statement .................................................................................................................. 20
Significance of the Study ....................................................................................................... 21
Research Questions ................................................................................................................ 22
Hypotheses ............................................................................................................................. 23
Null Hypotheses ..................................................................................................................... 23
Identification of Variables ...................................................................................................... 23
Definition of Core Terms ....................................................................................................... 24
Research Summary ................................................................................................................. 26
Assumptions and Limitations ................................................................................................. 28
Assumptions ........................................................................................................................... 28
Limitations ............................................................................................................................. 29
CHAPTER TWO: LITERATURE REVIEW ............................................................................ 31
Theoretical Framework .......................................................................................................... 31
Constructivism ....................................................................................................................... 31

7
Technology and Constructivism............................................................................................. 32
Multiple Intelligences ............................................................................................................. 33
Technology and Multiple Intelligences .................................................................................. 35
Review of the Literature ......................................................................................................... 35
Technology in Education ....................................................................................................... 35
Impact of Technology ............................................................................................................ 37
Perception of Technology ...................................................................................................... 40
Use of Interactive Whiteboards .............................................................................................. 44
Mobile Technologies .............................................................................................................. 49
Tablets .................................................................................................................................... 49
Mobile Interactive Whiteboards ............................................................................................. 53
Evaluation of Training ........................................................................................................... 53
Teacher Perception ................................................................................................................. 54
Return on Investment ............................................................................................................. 55
Technology and Student Retention ........................................................................................ 56
Technology and Accountability ............................................................................................. 57
Technology to Provide for 21st Century Skills ....................................................................... 58
Summary ................................................................................................................................ 59
CHAPTER THREE: METHODS .............................................................................................. 61
Design..................................................................................................................................... 61
Questions and Hypotheses ..................................................................................................... 64
Participants ............................................................................................................................. 65
Setting..................................................................................................................................... 67
Instrumentation....................................................................................................................... 67

8
Procedures .............................................................................................................................. 70
Data Analysis ......................................................................................................................... 71
Ethical Considerations............................................................................................................ 72
CHAPTER FOUR: FINDINGS ................................................................................................. 74
Research Questions ................................................................................................................ 74
Hypotheses ............................................................................................................................. 75
Demographics ............................................................................................................................ 75
Descriptive Statistics .................................................................................................................. 76
Assumption Testing ................................................................................................................... 77
Results .................................................................................................................................... 79
Null Hypothesis One .............................................................................................................. 79
Null Hypothesis Two ............................................................................................................. 95
Null Hypothesis Three ......................................................................................................... 105
Null Hypothesis Four ........................................................................................................... 114
Additional Analysis .............................................................................................................. 137
Faculty Survey Descriptives................................................................................................. 137
Additional Responses ........................................................................................................... 138
Narrative Data ...................................................................................................................... 139
Summary .............................................................................................................................. 142
CHAPTER FIVE: DISCUSSION, CONCLUSIONS, AND RECOMMENDATIONS ........ 143
Discussion ................................................................................................................................ 143
Research Hypothesis 1 ......................................................................................................... 143
Research Hypothesis 2 ......................................................................................................... 144
Research Hypothesis 3 ......................................................................................................... 145

9
Research Hypothesis 4 ......................................................................................................... 146
Conclusions .............................................................................................................................. 147
Implications.............................................................................................................................. 148
Limitations ............................................................................................................................... 149
Recommendations for Future Research ................................................................................... 150
Summary .............................................................................................................................. 152
REFERENCES ........................................................................................................................ 153
APPENDICES ......................................................................................................................... 170
Appendix A .......................................................................................................................... 170
Appendix B .......................................................................................................................... 174
Appendix C .......................................................................................................................... 180
Appendix D .......................................................................................................................... 186
Appendix E ........................................................................................................................... 213
Appendix F ........................................................................................................................... 216
Appendix G .......................................................................................................................... 219
Appendix H .......................................................................................................................... 221

10
List of Tables
Table 1. Descriptives ................................................................................................................ 76
Table 2 Assumptions ................................................................................................................. 77
Table 3 Test of Homogeneity of Variances ............................................................................... 78
Table 4 ANOVA Results for Level 1 Measure ........................................................................... 82
Table 5 Test of Homogeneity of Variances minus outliers ....................................................... 82
Table 6 Robust Tests of Equality of Means for Level 1 Measure ............................................. 82
Table 7 Multiple Comparisons for Level 1 Measure ................................................................ 83
Table 8 Tests of Between-Subjects Effects for Level 1 Measures ............................................. 83
Table 9 Hypothesis Test Summary for Level 1 Measures ......................................................... 93
Table 10 Independent Samples Kruskal-Wallis Test for Level 1 Measures.............................. 94
Table 11 Pairwise Comparisons of Technology for Perceived Efficiency ............................... 95
Table 12 Medians - Perceived efficiency .................................................................................. 95
Table 13 Test of Homogeneity of Variances Student Achievement minus outliers ................... 97
Table 14 ANOVA for Level 2 Measure ..................................................................................... 97
Table 15 Multiple Comparisons for Level 2 Measure .............................................................. 98
Table 16 Multiple Comparisons for Level 2 Measure minus outliers ...................................... 98
Table 17 Tests of Between-Subjects Effects for Level 2 Measure ............................................. 99
Table 18 Tests of Between-Subjects Effects for Level 2 Measure minus outliers ..................... 99
Table 19 Hypothesis Test Summary for Level 2 Measure....................................................... 104
Table 20 Independent Samples Kruskal-Wallis Test for Student Achievement ...................... 104
Table 21 Pairwise Comparisons of Technology for Student Achievement ............................. 105
Table 22 Medians – Student Achievement .............................................................................. 105
Table 23 Test of Homogeneity of Variances – Sustained Impact ........................................... 107

11
Table 24 ANOVA for Level 3 Measure ................................................................................... 107
Table 25 Multiple Comparisons for Level 3 Measure ............................................................ 107
Table 26 Tests of Between-Subjects Effects for Level 3 Measure ........................................... 108
Table 27 Tests of Between-Subjects Effects for Level 3 Measure minus outliers ................... 108
Table 28 Hypothesis Test Summary for Level 3 Measure....................................................... 113
Table 29 Independent Samples Kruskal-Wallis Test for Sustained Impact ............................ 114
Table 30 ANOVA for Level 4 Measure ................................................................................... 119
Table 31 Robust Tests of Equality of Means for Level 4 Measure ......................................... 119
Table 32 Multiple Comparisons for Level 4 Measure ............................................................ 119
Table 33 Tests of Between-Subjects Effects for Level 4 Measure ........................................... 120
Table 34 Test of Homogeneity of Variances without outliers ................................................. 121
Table 35 Hypothesis Test Summary for Level 4 Measure....................................................... 133
Table 36 Independent Samples Kruskal-Wallis Test for Level 4 Measures............................ 135
Table 37 Pairwise Comparisons of Technology for Level 4 Measures .................................. 136
Table 38 Medians – Level 4 Measure ..................................................................................... 137
Table 39 Descriptives – Faculty Survey ................................................................................. 138
Table 40 Most helpful technology ........................................................................................... 138
Table 41 Least helpful technology .......................................................................................... 139
Table 42 Initial Coding based on Responses .......................................................................... 140
Table 43 Final Coding based on Initial Framework .............................................................. 141

12
List of Figures
Figure 1. A model of learning, powered by technology (“Transforming American education”,
2010) .......................................................................................................................................... 37
Figure 2. Boxplot – Perceived Learning Contribution and Motivation.................................... 84
Figure 3. Boxplot – Perceived Efficiency ................................................................................ 84
Figure 4. Boxplot – Perceived Negative Effects ...................................................................... 85
Figure 5. Q-Q Plot of Perceived Learning Contribution and Motivation for IWB .................. 85
Figure 6. Q-Q Plot of Perceived Learning Contribution and Motivation for MIWB ............... 86
Figure 7. Q-Q Plot of Perceived Learning Contribution and Motivation for IWBAPP ........... 86
Figure 8. Q-Q Plot of Perceived Efficiency for IWB ............................................................... 87
Figure 9. Q-Q Plot of Perceived Efficiency for MIWB ........................................................... 87
Figure 10. Q-Q Plot of Perceived Efficiency for IWBAPP ...................................................... 88
Figure 11. Q-Q Plot of Perceived Negative Effects for IWB ................................................... 88
Figure 12. Q-Q Plot of Perceived Negative Effects for MIWB ............................................... 89
Figure 13. Q-Q Plot of Perceived Negative Effects for IWBAPP ........................................... 89
Figure 14. Boxplot – Perceived Learning Contribution and Motivation minus outliers .......... 90
Figure 15. Q-Q Plot of Perceived Learning Contribution and Motivation for IWB minus
outliers........................................................................................................................................ 90
Figure 16. Q-Q Plot of Perceived Learning Contribution and Motivation for MIWB minus
outliers........................................................................................................................................ 91
Figure 17. Q-Q Plot of Perceived Learning Contribution and Motivation for IWBAPP minus
outliers........................................................................................................................................ 91
Figure 18. Boxplot – Perceived Efficiency minus outliers....................................................... 92
Figure 19. Q-Q Plot of Perceived Efficiency for IWB minus outliers ..................................... 92

13
Figure 20. Q-Q Plot of Perceived Efficiency for MIWB minus outliers .................................. 93
Figure 21. Q-Q Plot of Perceived Efficiency for IWBAPP minus outliers .............................. 93
Figure 22. Independent Samples Kruskal-Wallis Test for Perceived Learning Contribution and
Motivation .................................................................................................................................. 94
Figure 23. Independent Samples Kruskal-Wallis Test for Perceived Efficiency ..................... 94
Figure 24. Pairwise Comparisons of Technology for Perceived Efficiency ............................ 95
Figure 25. Boxplot – Student Achievement ............................................................................. 99
Figure 26. Q-Q Plot of Student Achievement for IWB .......................................................... 100
Figure 27. Q-Q Plot of Student Achievement for MIWB ...................................................... 100
Figure 28. Q-Q Plot of Student Achievement for IWBAPP .................................................. 101
Figure 29. Q-Q Plot of Student Achievement for NONE ...................................................... 101
Figure 30. Boxplot – Student Achievement minus outliers ................................................... 102
Figure 31. Q-Q Plot of Student Achievement for IWB minus outliers .................................. 102
Figure 32. Q-Q Plot of Student Achievement for MIWB minus outliers .............................. 103
Figure 33. Q-Q Plot of Student Achievement for IWBAPP minus outliers ........................... 103
Figure 34. Q-Q Plot of Student Achievement for NONE minus outliers ............................... 104
Figure 35. Independent Samples Kruskal-Wallis Test for Student Achievement .................. 104
Figure 36. Pairwise Comparisons of Technology for Student Achievement ......................... 105
Figure 37. Boxplot – Sustained Impact .................................................................................. 109
Figure 38. Q-Q Plot of Sustained Impact for IWB ................................................................. 109
Figure 39. Q-Q Plot of Sustained Impact for MIWB ............................................................. 110
Figure 40. Q-Q Plot of Sustained Impact for IWBAPP ......................................................... 110
Figure 41. Q-Q Plot of Sustained Impact for NONE ............................................................. 111
Figure 42. Boxplot – Sustained Impact minus outliers .......................................................... 111
14
Figure 43. Q-Q Plot of Sustained Impact for IWB minus outliers ......................................... 112
Figure 44. Q-Q Plot of Sustained Impact for MIWB minus outliers ..................................... 112
Figure 45. Q-Q Plot of Sustained Impact for IWBAPP minus outliers.................................. 113
Figure 46. Q-Q Plot of Sustained Impact for NONE minus outliers...................................... 113
Figure 47. Independent Samples Kruskal-Wallis Test for Sustained Impact ......................... 114
Figure 48. Boxplot – Effectiveness ........................................................................................ 121
Figure 49. Boxplot – Importance............................................................................................ 121
Figure 50. Boxplot – Satisfaction ........................................................................................... 122
Figure 51. Q-Q Plot of Effectiveness for IWB ....................................................................... 122
Figure 52. Q-Q Plot of Effectiveness for MIWB ................................................................... 123
Figure 53. Q-Q Plot of Effectiveness for IWBAPP ............................................................... 123
Figure 54. Q-Q Plot of Importance for IWB .......................................................................... 124
Figure 55. Q-Q Plot of Importance for MIWB....................................................................... 124
Figure 56. Q-Q Plot of Importance for IWBAPP ................................................................... 125
Figure 57. Q-Q Plot of Satisfaction for IWB ......................................................................... 125
Figure 58. Q-Q Plot of Satisfaction for MIWB ...................................................................... 126
Figure 59. Q-Q Plot of Satisfaction for IWBAPP .................................................................. 126
Figure 60. Q-Q Plot of Satisfaction for NONE ...................................................................... 127
Figure 61. Boxplot – Effectiveness minus outliers ................................................................ 127
Figure 62. Q-Q Plot of Effectiveness for IWB minus outliers ............................................... 128
Figure 63. Q-Q Plot of Effectiveness for MIWB minus outliers ........................................... 128
Figure 64. Q-Q Plot of Effectiveness for IWBAPP minus outliers ........................................ 129
Figure 65. Boxplot – Importance minus outliers .................................................................... 129
Figure 66. Q-Q Plot of Importance for IWB minus outliers .................................................. 130

15
Figure 67. Q-Q Plot of Importance for MIWB minus outliers ............................................... 130
Figure 68. Q-Q Plot of Importance for IWBAPP ................................................................... 131
Figure 69. Boxplot – Satisfaction minus outliers ................................................................... 131
Figure 70. Q-Q Plot of Satisfaction for IWB minus outliers .................................................. 132
Figure 71. Q-Q Plot of Satisfaction for MIWB minus outliers .............................................. 132
Figure 72. Q-Q Plot of Satisfaction for IWBAPP minus outliers .......................................... 133
Figure 73. Q-Q Plot of Satisfaction for NONE minus outliers .............................................. 133
Figure 74. Independent Samples Kruskal-Wallis Test for Effectiveness ............................... 134
Figure 75. Independent Samples Kruskal-Wallis Test for Importance .................................. 134
Figure 76. Independent Samples Kruskal-Wallis Test for Satisfaction ................................. 134
Figure 77. Pairwise Comparisons of Technology for Effectiveness ...................................... 136
Figure 78. Pairwise Comparisons of Technology for Importance ......................................... 136
Figure 79. Pairwise Comparisons of Technology for Satisfaction ......................................... 136

16
List of Abbreviations
Interactive Whiteboard (IWB)
Mobile Interactive Whiteboard (MIWB)
Interactive Whiteboard App (IWBAPP)
Meadow View High School (MVHS)
Bayside Public Schools (BPS)
River View High School (RVHS)
No Child Left Behind (NCLB)
Adequate Yearly Progress (AYP)
Standards of Learning (SOL)
Return on Investment (ROI)
Analysis of Variance (ANOVA)
Institutional Review Boards (IRB)
Interactive White Board Student Survey (IWBSS)
Statistical Package for the Social Sciences (SPSS)

17
CHAPTER ONE: INTRODUCTION
Resnick (2011) found that school systems invest large amounts of money into
instructional technologies. The researcher noted in 2011, schools invested over eight billion
dollars on instructional technologies. Additionally, the study found the expenditures have
shown an average increase of 4.5% each year since 2003 with the greatest single increase in
technology spending (33.98%) being interactive whiteboard (IWB) purchases. By 2013, it was
expected that number will reach 21.9 billion (Keengwe & Schnellert, 2012). This quantitative
study will discover what, if any, impact different forms of instructional technologies, namely
the IWB, have upon measures that are used to determine if there is a positive return on
investment in these technologies. This chapter will present a background and statement of the
problem, the purpose and significance of the study, and a framework of the research to be
performed.
Background
As technology becomes a daily part of life in the developed and developing world, so
too has it become a part of the educational environment. School systems worldwide are
purchasing technologies to be integrated in their classrooms. The rapid development and
adoption of technology worldwide has led to a movement to integrate many of these tools into
the classroom (U.S Department of Education National Center for Education Statistics [USDoE
NCES], 2009). Billions of dollars have been invested by school officials to introduce
interactive whiteboards into classrooms both in the United State and Europe (Moss, et al..,
2007). The use of technology in the classroom has grown as communities accept the
technologies in their day to day lives. Technologies have been shown to be used to increase
differentiation in a variety of different learning theories, most notably constructivism (Jackson,
Gaudet, McDaniel, & Brammer, 2009; McCoog, 2007; Tamim, Bernard, Borokhovski,

18
Abrami, & Schmid, 2011; Dhindsa & Emran, 2011). The effectiveness of some technologies
has been analyzed on individual equipment or in a qualitative fashion (Shenton & Pagett, 2007;
Slay, Siebörger, & Hodgkinson-Williams, 2008). Absent from the literature is a quantitative
study looking at the return to a school system on the investment made involving a classroom
technology package that includes an interactive whiteboard (IWB) and the accompanying
professional development in its effective use. Digregorio and Sobel-Lojeski (2010) have
suggested in their study that future research in this area is needed. Additionally, the literature
is silent on the comparison of the value of an IWB in comparison to a smaller mobile
interactive whiteboard (MIWB) or tablet based interactive whiteboard apps (IWBAPP)
designed to emulate many of the board’s features at a fraction of the cost.
Problem Statement
During the past half-decade, Bayside Public Schools, a suburban school district in
southeastern Virginia (all institutional names are pseudonyms), has been putting classroom
technology packages into every classroom in schools, spending hundreds of thousands of
dollars per school. These technology packages included a system that integrates a ceiling
mounted projector, full-size, wall mounted IWB, and a document camera. The first high
school to receive this package was the newest school, Meadow View High School (MVHS).
MVHS has, since opening, performed very well on all standardized tests, consistently
performing at or near the top among district high schools, ranking second in the district in
math, first in English, science and social studies and having a 97% graduation/completion rate
(“School, School Division”, 2011). This performance appears to have been maintained to the
present day. Two years later, River View High School (RVHS) began the three year
renovation which included the process to install a classroom technology package with an IWB
in each classroom. This process ended in the 2010-2011 school year. Each school has

19
professional development support in the form of training from the district content supervisors,
the divisional instructional technology department, and an on-site technology integration
specialist. The remaining high schools in the district have begun processes to add the
technologies starting in the 2011-2012 school year. During the preceding 5 years, the school
budget has significantly decreased, dropping over twenty percent. To date, the budget
decreases have continued and despite reports of an improved economy, no relief appears in site
(Connors, 2015).
The technology installation in RVHS coincided with improvements in standardized
testing scores between the 2008 and 2011 school years. Although not overall the top
performing school in the city, RVHS has performed most recently in the top three schools
district wide overall, as well as scoring at or above the state average. Additionally, RVHS was
the only high school in the district in the 2010-11 and 2011-2012 school years to meet federal
No Child Left Behind (NCLB) Adequate Yearly Progress (AYP) (“Adequate Yearly Progress”,
2012). While other factors may be impacting the results, the improvement in standardized
testing scores appears to coincide with the installation of the school wide IWBs in RVHS. The
three schools that are preparing to receive the school wide IWBs appear to be performing
consistently, with no noticeable improvement, during the same period that RVHS was showing
improvements. However, despite this apparent connection, there has been no empirical study
to evaluate whether the investment in classroom technology packages that utilize an IWB has
actually provided a positive return on investment of the technology. Additionally, due to the
falling school budgets, the installation of the IWB technologies in all schools has ground to a
halt. There is a goal in the district to complete this installation, but with no relief in sight for
the budget, the school district is searching for alternatives to an IWB that can provide the same
benefits at a significantly lower cost. However, there has been no empirical data shown to

20
support this decision and if any impact can be provided utilizing another less expensive
technology.
Purpose Statement
With the influx and rising fiscal costs of these technologies, it becomes necessary to
determine what, if any, benefit the investment in IWBs may be having for the school system.
The purpose of this quasi-experimental non-equivalent control group study is to compare the
levels of measure used to determine a return on investment of a classroom technology package
that includes an IWB, a MIWB, or an IWBAPP into a classroom for high school students in the
Bayside Public Schools district. The independent variable will be form of technology utilized
(IWB, MIWB, IWBAPP, or no IWB technology) in a Geometry classroom where the teachers
have received an equivalent level of professional development. The dependent variables will
be the level of satisfaction, student achievement, sustained impact, and perceived results as
compared with a non-IWB technology teaching environment.
Moss, et al. (2007) noted that the training of teachers for the effective use of IWBs
should focus on six areas: confidence in the usage, appropriateness of usage, multiple
technologies used in conjunction, support of students with learning disabilities, use for
planning, and development of interactive exercises. Training for the faculty participants in this
study focused on each of these areas. Each member demonstrated to the researcher prior to the
start of the study that they understand how to meet each of these areas. Common lesson plans
for each standard taught to the students in the study which will ensured that the instruction
coincides with the six areas as appropriate. In order to ensure that the IWB, MIWB, and
IWBAPPs are utilized as trained, the faculty participants were observed by the researcher and
required to log instructional activities for each lesson. Lessons will be developed in
conjunction with the school Geometry subject matter experts.

21
Significance of the Study
Billions of dollars have been and are being spent on technologies in schools nationwide
(Moss et al., 2007). The classroom technology package costs approximately $5,000.00 per
classroom plus installation, with the IWB portion valued at $3,000.00. Additionally, there are
personnel investments to support the professional development of the teachers so they can
learn to utilize the equipment effectively. That investment is being made with the
understanding that it will help student achievement and improve the educational environment.
As most school districts nationwide are facing increasing financial difficulties, every penny
spent is being analyzed as to its efficacy. As these technologies are still relatively new, the
body of research data available is limited. Alternative forms of IWB such as the MIWB and
IWBAPP are significantly less expensive (approximately $450.00 and $550.00 for each
respectively as listed on the manufacturer websites) but are much newer and have little or no
research data available concerning the impact on subject achievement or satisfaction.
This study is designed to see if there is any evidence that adding the IWB technology to
a school can be supported as a successful investment. The focus is on the availability of the
equipment in each classroom, the method in which it is utilized, the impact it has on ROI levels
of measure and the type of technology utilized, in this case an IWB. This will be compared to
two other pieces of technology, the MIWB and IWBAPP, which is designed to provide many
of the same features that the IWB does. A control group that utilizes no IWB technology will
also be part of the study. The results of this study could provide evidence that could support
the integration of these new technologies as being a good return on investment. Additionally,
it may provide guidance as to the value provided between an IWB, MIWB, or IWBAPP. This
would help provide schools data to support or reject installing technologies that have
significant financial costs. If no impact is found, then the large financial costs for such a

22
package might be saved and used in ways that are supported by other research. Schools that
would be considering these moves could then research other ways, such as focused use of
technologies or specific training programs that would be more likely to provide positive
impacts.
Research Questions
The primary method utilized by Virginia school districts and the federal government to
measure student and school academic performance is the achievement of the state end-of-
course Standards of Learning (SOL). Additionally, Bayside Public Schools have utilized
citywide benchmark tests and midterm assessments to measure the progress in meeting the
state SOLs in a course. It has been suggested that a possible relationship existed between
RVHS’s improvement in student performance on the SOL test and the installation of IWBs
school wide. Therefore, the research will investigate whether there is a significant difference
in the ROI levels of measure (which include student achievement) between the classroom use
of IWB, MIWB, IWBAPP and no IWB technologies. In order to address this, the study will
look at the following research questions:
1. Is there any difference in the satisfaction level of the class participants dependent upon
their utilization of the IWB, MIWB, IWBAPP, or no IWB technology?
2. Is there any difference in student achievement based on a pre- and post-test between
lessons taught with an IWB, MIWB, IWBAPP, or no IWB technology?
3. Is there any difference in the sustained impact of learning utilizing the technologies
between the IWB, MIWB, IWBAPP, or no IWB technology?
4. Is there any difference perceived by the students and faculty on the end of course results
between the IWB, MIWB, or IWBAPP?

23
Hypotheses
1. Satisfaction levels of the class participants will be significantly different across groups
utilizing the IWB, MIWB, IWBAPP, or no IWB technology.
2. Student achievement levels between the pre- and post-test will be significantly different
across groups utilizing the IWB, MIWB, IWBAPP, or no IWB technology.
3. Sustained impact of learning of the student will be significantly different across groups
utilizing the IWB, MIWB, IWBAPP, or no IWB technology.
4. Perceived results by the class participants will be significantly different across groups
utilizing the IWB, MIWB, or IWBAPP.
Null Hypotheses
1. Satisfaction levels of the class participants will not be significantly different across groups
utilizing the IWB, MIWB, IWBAPP, or no IWB technology.
2. Student achievement levels between the pre- and post-test will not be significantly different
across groups utilizing the IWB, MIWB, IWBAPP, or no IWB technology.
3. Sustained impact of learning of the student will not be significantly different across groups
utilizing the IWB, MIWB, IWBAPP, or no IWB technology.
4. Perceived results by the class participants will not be significantly different across groups
utilizing the IWB, MIWB, or IWBAPP.
Identification of Variables
The independent variables in this study will be the type of technology utilized (MIWB,
IWB, IWBAPP, NONE) in school classrooms accounting for equivalent application of
professional development. Measurement of this variable will be categorical values of 1 for the
IWB, 2 for the MIWB, 3 for the IWBAPP, and 4 for the no-IWB technology (NONE)
instruction.

24
The key dependent variables will be based on the four-levels of training evaluation
measurement used to determine ROI (Phillips & Stone, 2000). The dependent variables will be
the level of satisfaction, student achievement, sustained impact, and perceived results.
Definition of Core Terms
This study utilizes terminology that must be defined to ensure clarification in the
elements presented.
Technology – modern, computer or electronic based tools. These tools are specifically
introduced into the educational environment as ways to engage the student and increase
interactivity with the content.
Classroom technology package – an integrated technology package consisting of a
permanently mounted interactive whiteboard and video projector (either ceiling or wall
mounted), a document camera, and a computer that combines the functioning of the previous
elements.
Interactive whiteboard (IWB) – a classroom display, usually the size of a projector
screen, which allows for interactivity through touch by students and teachers with a computer
(Thomas & Schmid, 2010). For this study, all of the IWBs are manufactured by SMART
Technologies Inc.
Mobile interactive whiteboard (MIWB) – a portable interactive handheld tablet that
allows for interactivity through the use of touch or a stylus by students and teachers with a
computer (U.S. Patent No. 6930673, 2005). For this study, all of the MIWBs are
manufactured by eInstruction Corporation.
App – an application or computer program designed specifically for use on a mobile
computing device or tablet (Fabian & MacLean, 2014).
25
Interactive whiteboard app (IWBAPP) – a tablet based app that serves as a portable
interactive whiteboard (Pilgrim, Bledsoe, & Reily, 2012). For this study, the Doceri app
installed on an Apple iPad was utilized as the IWBAPP.
Document camera - a digital camera mounted in a stand and with an output to a
computer or video projector, providing a real-time image of a subject (Nicholson, 2011). It is
the technological successor to the overhead and opaque projectors. For this study, all of the
document cameras were manufactured by SMART Technologies and designed to interact with
the computer and interactive whiteboard.
Multiple intelligences – nine different modalities of learning based on theory as
described by Gardner (1983). Instruction can be designed to take advantage of these cognitive
abilities to improve learning. Recently, researchers have begun to consider the impact of
digital learning on Gardner’s theory and the possibility of a tenth modality: digital intelligence
(Adams, 2004; Baattro, 2009; Gracious & Shyla, 2012),
Differentiated instruction – instruction that has been tailored to meet the needs and
abilities of the students (Stanford, Crowe, & Flice, 2010).
Virginia State Standards of Learning (SOL) – listing of objectives and skills for each
content area and course of study, mastery of which all passing students are expected to
demonstrate (“Virginia Standards of Learning”, 2011).
SOL Tests – a standardized test created to evaluate a student’s accomplishment of the
state mandated Standards of Learning. This test is administered during the final marking
period of each core subject: English, math, science, and social studies (“Standards of
Learning”, 2011).
Benchmarks – a standardized test created to evaluate a student’s progression toward the
achievement of the standards (Herman, Osmundson, & Dietel, 2010). For this research it will

26
be a benchmark focusing on the Virginia Standards of Learning. This test is administered
midway during the semester of each core subject (English, math, science, social studies).
Research Summary
The installation of the classroom technology packages at RVHS was completed in
2011. IWBs were received by all BPS high schools in 2012, though all were not permanently
installed. District school have all received some Apple iPads, though there has not been any
formally adopted IWBAPP used by the school system. Classes, teachers, instruction,
professional development and testing will be completed, controlling for as many intervening
variables as possible. As the researcher is unable to perform a true experiment due to inability
to truly randomize control for all confounding factors, a quasi-experimental non-equivalent
control group research design is appropriate (Gall, Gall, & Borg, 2007).
In 2012, all BPS high schools received MIWBs for use in their mathematics
classrooms. All teachers have received an introductory course into the basic functioning of the
classroom technology package and its associated equipment. The study evaluated the
satisfaction, student achievement, sustained impact, and perceived results involved in the use
of the technologies. Student pre- and post-performance data utilizing questions designed to
assess achievement of the end-of-course SOL and benchmark tests for a high school Geometry
course in the Bayside Public Schools district was analyzed. Additionally, survey data from
subjects (students and teachers) was analyzed to assess impact and satisfaction based on the
use of the technologies. The subjects of this study are students and teachers who participate in
a Geometry course that is guided by Virginia SOLs in a classroom that utilized an IWB,
MIWB, IWBAPP or no IWB technology. The teachers received equivalent focused training on
the effective use of the study technologies. Each of these ROI factors (satisfaction, student

27
achievement, sustained impact and perceived results) were used to evaluate the differences on
measures used to determine return of investment of the technologies.
The research design for this study is a quasi-experimental non-equivalent control group
design. This type of research is appropriate for four reasons. First, this study cannot select a
true randomization of subjects. The subjects, so as to minimize disruption of the educational
environment, were from intact classes with no randomization, outside of what occurred during
course assignment. Second, there was manipulation of the variables or treatments. Third, the
study was designed to see if there is a relationship between variables. Fourth, the study is
designed to be experimental and as it is impractical to ensure a true randomization of subjects,
a quasi-experimental type of research is a best fit (Gall et al., 2007). After determination of the
population and sample, manipulation of the variable was performed. Participants were
assigned multiple treatments in a counterbalanced design. Gall et al. (2007) note that varying
the treatment across the groups will help to avoid any problems with order affects (p. 426).
Data was collected from appropriate databases and instrumentation and processed to prepare
them for analysis. Additionally, survey result data from teachers and students was drawn and
processed. The performance scores and survey data at the high school was analyzed based on
the form of IWB technology (IWB, MIWB, IWBAPP, and the control of no [NONE] IWB
technologies). As the groups of subjects were predetermined based on course assignment and
the treatments (IWB, MIWB, and IWBAPP) will be compared to a control (NONE), the non-
equivalent control design was appropriate. This design has been used in other educational
technology studies under similar limitation for subject selection (Allison, 2012; Schmidt, 2012;
Thompson, 2012; Shoemaker, 2013).

28
Assumptions and Limitations
Assumptions
This study relies on several assumptions that make it possible to conduct this research.
Each of these assumptions, which will not be directly tested, may be threats to internal and
external validity and reliability of the study. The research study was designed, through the use
of counterbalance and statistical analyses, to minimize the possible impacts of these threats.
The primary assumption is that any impact on the student performance is not as a result
of other forces in the educational environment. School or district wide improvement efforts,
changes in administered tests, rotation of teachers and administrators, and differences in
student socioeconomic status could be spurious factors that may impact the performance of the
students.
Another assumption is that the classroom technology package with IWB technology
was utilized in the classroom, and done so in an effective manner. Random observations and
journaling by teachers were made to ensure that proper usage took place. Despite this, it is not
feasible for the researcher to be in each classroom all of the time to ensure proper usage.
Another assumption is that the teachers have a similar level of knowledge using the
technology at the beginning of the study. All schools receiving the classroom technology
package were required to have their entire faculty attend a two-day training session. This
training detailed the equipment, its proper use and function, and basic examples of how it can
be integrated in the technology. The content of this training program has been consistent
throughout the entire classroom technology package installation process district wide. In
addition to the training, administrators have been tasked with encouraging and observing the
use of the classroom technology packages during instructional time.
29
The design of the study compared student performance from multiple high school
classes at varying points in the instructional process over the same time period. The data from
each of these classes was analyzed to show what, if any, changes in mean student performance
and sustained impact over the entire time period. These changes in means student performance
over the period were compared between the classes as they experience the differing
technologies as separate groups. As each class’ mean change in performance were analyzed
against the other, school wide changes and initiatives were minimized, with the exception of
type of technology used and the level of instruction received. As all the classes were in the
same school, any school wide changes will affect all classes collectively, nullifying those
threats.
Limitations
As this study is quasi-experimental, there are, by the nature of the study, limitations that
are expected. Being a study a single school district with a several differing types of a
technology, generalizability of the results are limited. Efforts were made to minimize the
impact of other confounding factors (i.e. SES, parental involvement, staff familiarity with
classroom technology packages) however it is impossible to account for all outside a true
experimental design.
Additionally, although statistically there may be evidence of a relationship between the
variables, an actual cause and effect relationship cannot be definitively established. Likewise,
the threats that are inherent to research can only be addressed through the sampling and
research analysis design. No other methods to manipulate the treatments or groups can be
made to eliminate reliability and validity threats.
A weakness of the quasi-experimental non-equivalent control group design is a lack of
randomization prior to any treatment. Because of this weakness there are a number of internal

30
threats to validity and reliability that are inherent in this type of research design. The greatest
internal threats include history, instrumentation, and subject characteristics. The impact of
confounding factors is also a threat.
In order to minimize the effect of history threats, increased sample groups were
instituted. The higher number of classes will help ensure that any school wide or higher level
event should impact all schools equally. History effects that may impact individual classrooms
are minimized by the grouping of students from several different classrooms. History effects
that affect one class are not accounted for in this study.
Instrumentation threats would come in the form of changes to the SOL and benchmark
tests, what they measure and how they are normalized. This threat is minimized in that all
groups, including the controls, will be taking the same tests during each cycle. A large sample
size also helps minimize the chances that a group has more members that are taking a changed
test when compared to another group.
Subject characteristics threats are minimized in this study by the grouping of multiple
subjects, grades, and teachers together and drawing class samples for each semester and school
from that pool. Students who may perform strongly on one subject and not another are not as
likely to skew the results of the entire group’s mean performance.
Threats to reliability are diminished in that the measurement of the impact can be
diminished through the use of a larger sample size.
31
CHAPTER TWO: LITERATURE REVIEW
The impact of technology in the lives of students in the United States is difficult to
understate. There has been extensive literature that addresses a great variety of issues
involving the use of technology in elementary and secondary education. This review examines
the technology in education, its impact, a focus on the interactive whiteboard, the evaluation of
technology in education, its impact on retention, prevention of student dropout, teacher
retention and the measurement of the return on investment of the technologies. The theoretical
framework of the researcher during the review has been presented.
Theoretical Framework
Constructivism
This study will be conducted in the theoretical framework of constructivism and
multiple intelligences. Constructivism is a theory of learning where the student creates
knowledge or meaning through the interaction and use of constructs (Shapiro, 2011). The
constructs the learner interacts with or experiences stimulate the building of new knowledge
upon prior knowledge and experiences. One of the earliest recognized constructivists is John
Dewey. Fogarty (1999) notes that Dewey’s active learning environments created situations
where learners can experience life and realistic situations and build new layers of knowledge.
The works of Lev Vygotsky, specifically his theories on social interaction, scaffolding, and the
zone of proximal development, support constructivist learning theories. Personal interactions
lead to an internalization by the individual, which then results in a greater grasp of meaning
and understanding (Fogarty, 1999).
While widely accepted in the field of education, there are those that raise questions
about the efficacy and worldview of constructivist theory. Riegler and Quale (2010) question
whether constructivism in its most broad approach can become more a philosophy rather than

32
an educational theory. Hug (2010) takes a critical eye of constructivism and its extension of
radical constructivism. He states that “constructivism presents itself rather as fragmented
discourse network and not in a single state of conceptual, institutional or personal
consolidation” (p. 62). He also notes that radical constructivism
Constructivism additionally has conflicted with some that take a Judeo-Christian
worldview on education. Van Brummelen (2002) presents compelling arguments that a
“radical constructivist” view is anathema to the view of ultimate truth that is provided through
Christ (p 34). However, these arguments are not the sole viewpoint regarding the ability of
Christian educators to embrace constructivist practices. Henze (2009) suggests that the
student-centered, discovery oriented practices that are inherent to constructivism are also
saddled with “metaphysical and epistemological” trimmings. These beliefs have led some
Christian educators to looks with suspicion on constructivist theory. However, when
constructivism is stripped of these more radical ideas a practical, and even biblically
acceptable, set of methodologies is revealed which includes learners building new concepts and
meaning by tying them to existing knowledge. Cook (2008) noted that Jesus often utilized
metaphors as a means to construct new meaning upon existing knowledge being taught.
Robertson (2008) noted also that Jesus’ teaching methods through parables and open-ended
questions gave the learners the ability to create connections and new meanings.
Technology and Constructivism
Many recent researchers show that technology can be used to effectively support a
constructivist learning environment. Overbay, Patterson, Vasu, and Grable (2010) performed a
study to discover if there is a relationship between the use of technology in the classroom of
teachers and their level of constructivism. North Carolina schools have implemented a
program, IMPACT, to increase the level of student-centered learning in public education. This

33
study was performed on the basis of two surveys that were given 5 months apart. While
considering that this study is not immediately generalizable, it does suggest that teachers who
practice more constructivist learning techniques are more likely to embrace the use of
technology in the classrooms. Another key element that was noted was the inverse relationship
between technology use and the level of education. It suggests that in a high school
constructivist use of technology was less than at the elementary level.
Fox-Turnbull and Snape (2011) demonstrated that the use of technology in teacher
education supported a constructivist approach. The alignment between constructivist learning
method and the gaining of technical knowledge was supported in the body of literature
reviewed by the researchers. By utilizing inquiry learning approaches, learners can develop
meaningful connections between new and prior knowledge. Effectively integrated
technologies can provide significant support and models as well as having the flexibility to
allow for many different content areas to be addressed.
Technology in education does not automatically mean that constructivist learning
environments will take place. Schrand (2008) notes that although there are great amounts of
technology available for use in the classroom effective use of it requires planning. Simply
showing a presentation to learners does not necessarily facilitate active learning. In reality, this
type of limited use of technology does more to stifle active learning than support it.
Multiple Intelligences
Howard Gardner introduced the theory of multiple intelligences that has greatly
impacted the field of education by recognizing the different manners in which learners
comprehend and process the world around them. This theory continues to evolve, once
recognizing seven, now nine separate types of intelligences (Jackson, et al., 2009). These
intelligences support constructivist learning environments as they focus on the experiential

34
manner in which learners gain and construct knowledge. Nine intelligences have been defined:
linguistic, logical-mathematic, spatial, musical, body-kinesthetic, interpersonal, intrapersonal,
naturalist and spiritual. The last is not yet recognized fully as an official intelligence. Gardner
has also stated that more intelligences may exist (Abdallah, 2008). These intelligences help the
student to learn in ways that focus on their strengths and bring pleasure to the process of
learning. “Using MI Theory in the classroom can help teachers to create such an encouraging
atmosphere” (p. 31).
Although the multiple intelligences theory is accepted by a significant number of
educational theorists, it is by no means universally accepted as a valid theory. The theory is
criticized as not able to be fit within a pattern of data that exists. Also, the intelligences are
noted as overlapping to the point where true separation is impossible (Peariso, 2008).
Peariso’s (2008) study found the following:
Collins (1998) points out that some of the strongest doubts of Gardner’s MI theory
come from Gardner himself. Gardner states, ‘The most I can hope to accomplish here
is to provide a feeling for each specific intelligence.’ Gardner goes on, ‘I am painfully
aware that a convincing case for each candidate intelligence remains the task of other
days and other volumes. (p. 10).
The author also notes that numerous researchers, including Gardner, have not required
empirical confirmation of the multiple intelligence theory. Validation, Peariso (2008) argues,
is supported by Gardner based on the results of its use in classrooms, however “Gardner has
never laid down a detailed plan for applying his theory in schools, and the consultants and
publishers who offer training in MI operate independently of him” (p. 12).
35
Technology and Multiple Intelligences
Another major benefit of technologies has been the ability for them to be used to
support Gardner's theory of multiple intelligences (McCoog, 2007). Educational technologies
in the classroom allow, when utilized correctly, for the immediate touching of some, if not all,
of those multiple intelligences recognized by Gardner. McCoog (2007) recognized that the
usage of educational technologies in the classroom can have “a great impact on student
achievement. It. . . helps in the process of differentiating instruction.” The uses of
technologies, including those capable of presenting multimedia experiences, provide a “way”
for students to be “engaged in activity, often collaborative, as they practice, build and create”
(Schrand, 2008).
Jackson, et al. (2009) present a series of suggestions where technologies were shown
through action research to support effective instructions with a framework based on the theory
of multiple intelligences.
Review of the Literature
A thorough review of the literature revealed several themes relating to technology in
education, the impact this has on student achievement, the impact and use of interactive
whiteboards in the classroom, the importance of teacher development in the use of technology,
the evaluation of the value of technologies in education, the return on investment in education,
and the reasons technologies are acquired for education.
Technology in Education
The subject of technology in education has been a subject of evaluation for decades. In
their second-order meta-analysis, Tanim, et al., (2011) evaluated technology studies that have
occurred over the preceding 40 years. Their research showed that technologies have been used
in numerous forms that enable a wide spectrum of formats, learning theories and applications.

36
This analysis provides a picture of the complicated role technologies have played in student
learning. The recommendation of nuance in future studies is to be seriously considered. One
study that has a design model that deals with the analysis of the effectiveness of technology on
achievement was performed by Delen and Bulut (2011). The study demonstrated that the use
of computers and related technologies had an effect on the performance of students in STEM
(science, technology, engineering, mathematics) content.
Technology is not limited to its use in, but also in support of research in education.
Price, Handley, Millar, and O'Donovan (2010) performed a three year study involving
interviews of the sample subjects. The questions involved the effectiveness of feedback and
how it helped the researchers understand the themes revealed in their study. A software
package, NVivo, provided the researchers support between collection of the data and the
analysis. This shows the use of technology to support the researcher in the collection of data
and analysis. Gaotlhobogwe, Laugharne, and Durance (2011) utilized data to assess the
attitudes toward subject areas when analyzing the impact of technologies on the standardized
scores in those areas.
The National Technology Education Plan, published in 2010, goes into great detail of
the benefits of technology in education and lays out a plan for the United States. The plan calls
for “revolutionary transformation rather than evolutionary tinkering” (p. ix). There is
recognition that technology plays roles in everyday lives of people in the U.S., especially the
youth. Students use technologies every day to communicate, interact socially and accomplish
goals. However, the U.S. educational system has not been able to consistently and effectively
harness technologies in ways that “mirror students’ daily lives and the reality of their futures”
(p. x). The plan lays out a path to leverage new and emerging technologies in five ways:
learning, assessment, teaching, infrastructure and productivity. The learning model developed
37
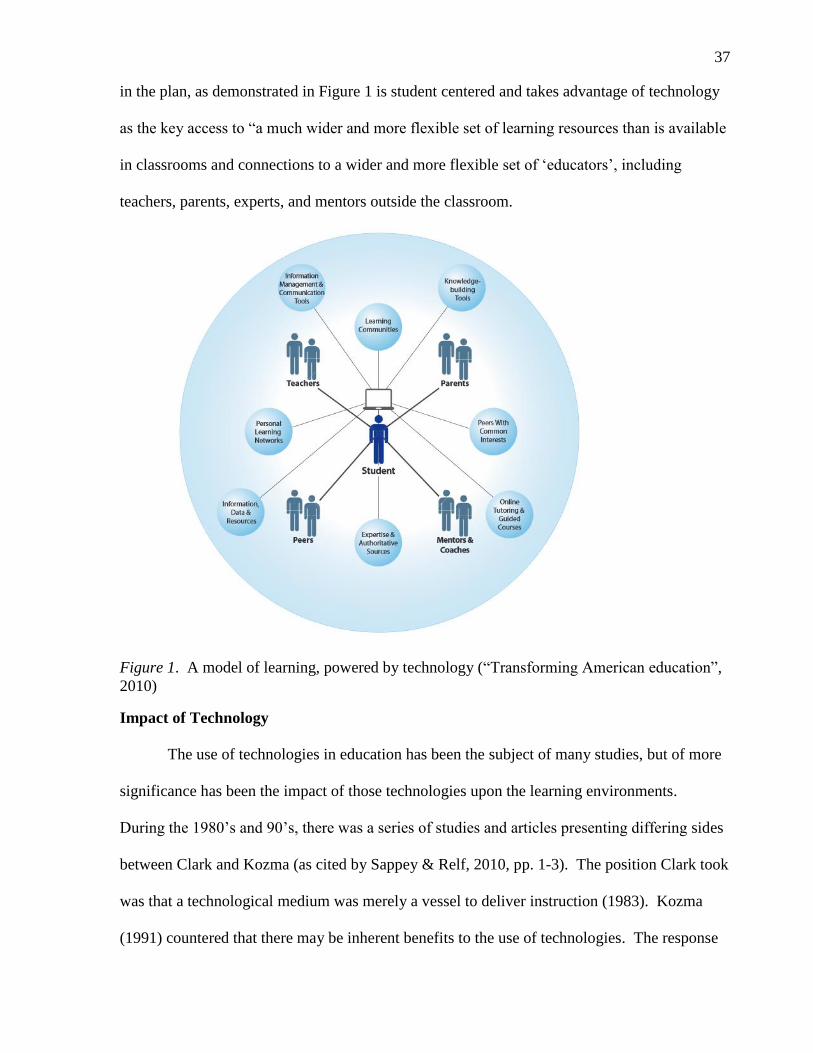
in the plan, as demonstrated in Figure 1 is student centered and takes advantage of technology
as the key access to “a much wider and more flexible set of learning resources than is available
in classrooms and connections to a wider and more flexible set of ‘educators’, including
teachers, parents, experts, and mentors outside the classroom.
Figure 1. A model of learning, powered by technology (“Transforming American education”,
2010)
Impact of Technology
The use of technologies in education has been the subject of many studies, but of more
significance has been the impact of those technologies upon the learning environments.
During the 1980’s and 90’s, there was a series of studies and articles presenting differing sides
between Clark and Kozma (as cited by Sappey & Relf, 2010, pp. 1-3). The position Clark took
was that a technological medium was merely a vessel to deliver instruction (1983). Kozma
(1991) countered that there may be inherent benefits to the use of technologies. The response

38
notes that studies show that computers can “influence the mental representations and cognitive
processes of learners” (p. 199). In response, Clark (1994) claims that Kozma “failed to control
for instructional method” (p. 25), thereby leading to invalid results. Sappey and Relf (2010)
found that this debate between Clark and Kozma continues to influence recent studies
involving “evaluation of the impact of ICT in education” (p. 1)
Tamim, et al. (2011) addresses forty years of the impact of technology on learning in
comparison with those classrooms that do not. Their meta-analysis other elements in learning
like objectives and teacher efficacy other than technology may be more impactful on student
achievement: “it is arguable that it is aspects of the goals of instruction, pedagogy, teacher
effectiveness, subject matter, age level, fidelity of technology implementation, and possibly
other factors that may represent more powerful influences on effect sizes than the nature of the
technology intervention” (p. 17).
Fernandez-Cardenas and Silveyra-De La Garza (2010) conducted a study that suggests
that there is some difference between traditional and interactive technologies in a classroom.
The researchers found that interactive technology use resulted in techniques that allowed for
greater demonstration and scaffolding elements over that utilizing traditional, non-interactive
forms of the technology. Pedagogically there were few differences between uses of the two
types of technology and as it was a single piece of equipment, the inability to be used
interactively by all students affected the socialization of the children. However, it was noted
that this could be overcome by adding additional technologies.
One of the most significant studies into the impact of technology on student
achievement is that of Bebell and Kay (2010). This large scale study took place over a three
year period in Massachusetts. During the three year process students and teachers were
surveyed prior to the start of the initiative. After year one, they were surveyed again.

39
Observations and student exercises were collected pre and post year one to demonstrate
progress. Achievement studies were performed to determine the impact of the practices on
their performance. Interviews with faculty and administration were conducted across the entire
project to gauge progress attitudes and outcomes. “The consensus of the participants (school
leaders, teachers, and students) was overwhelmingly positive towards these educational
opportunities afforded through increased educational technology.” (p. 47).
Research performed by Northcote, Mildenhall, Marshall, and Swan (2010) describes
qualitatively how the technology has potential to impact achievement. Four themes were
identified from participant comments through coding of the data to include the learning that
was associated with the technology, the use of the technology, resources that were suited to and
associated with the use of the studied technologies. The study showed that the impact of
interactivity was present but often fell short of the potential it posed.
This and other research into the use of IWBs for learning purposes suggests that, to be
effective and meaningful, IWBs should be considered as a tool to support the
achievement of learning outcomes for students rather than just a tool for motivation and
presentation purposes. Their potential may yet to be realized (p. 508).
Quantitative studies may help to augment this data.
The use of a well-designed technology was found to significantly impact the
performance or meet the learning style needs of the students (Popescu, 2010). The researcher
evaluated the impression of effectiveness of the system to adapt to the students’ learning styles.
Similarly, O'Dwyer, Russell, Bebell, and Seeley (2008) established a design model that deals
with the analysis of the effectiveness of technology on achievement. Gano (2011) conducted a
study that demonstrated quantitatively and qualitatively the impact of a specific technology on
student achievement. However, each of these studies had significant limitations and revealed a

40
problem with the study of technology impact in education. The consensus is that a large scale,
longitudinal study needs to be performed to “that (a) examine how all types of educational
technologies are used by students, (b) accurately capture students’ myriad uses of technology,
and (c) look beyond state test scores or off-the-shelf norm-referenced tests as a way to assess
the impact of technology. Until such studies are conducted, the conclusions drawn about the
nature of the relationship between technology use and academic achievement will continue to
be questioned by both critics of and advocates for educational technology.” (O’Dwyer, et al.,
2008, p. 42).
Potter and Rockinson-Szapkiw (2012) noted that “effective use of technology does not
necessarily happen just because the technology is available” (p. 23). Their findings indicate
that in order for technology to be impactful for learning, the primary users (teachers) should be
trained and assisted to ensure “alignment of technology integration with student learning” (p.
24). Buchan (2011) noted that the relationship between the acquisition and usage of
technology and its impact falls into a ‘chicken or egg’ scenario. The study found that the
impact of technology will spread beyond the user if it is embraced and that the organization
“will need to prepare to undergo significant transformation in a variety of areas to support the
vision for learning and teaching and the institution’s technology needs of the future” (p. 171).
Eyyam and Yaratan (2014) showed that the impact of technology on both learning achievement
and on the attitudes toward its usage was positively impacted. The researchers, understanding
that the technology needed to be effectively integrated, created lesson plans that were
specifically designed “according to Gagne’s nine instructional events” (p. 35).
Perception of Technology
The perception and acceptance of technology in education environments has and is a
subject of numerous studies in the body of literature. As technologies are adopted by school
41
districts, faculty and students are expected to adapt to the new technologies. These
technologies take many forms, from web based tools such as social networking, class
management systems, and student assessments systems, to hardware such as laptops, tablets,
IWBs, and smartphones. The list of possible technologies is virtually endless.
Numerous studies show that technologies can enhance learning (Barak and Ziv, 2013;
Papastergiou, 2009), improve student engagement (Dunleavy et al. 2009, Farnsworth et al.,
2013) and helping teachers organize and prepare for instruction (Banas, 2010,). Attitudes and
perception of teachers and students toward new technologies is a continuing subject of great
study in the literature. Teacher attitudes in regards to newly adapted technologies vary greatly
depending on a number of factors. The ability of the teacher to understand what justification
there is to the new technology is one such factor. Mishra and Koehler (2006) suggest that there
is a framework that can help describe the level of teacher’s understanding the technology and
the content together. Positive perceptions of technologies may start out at low levels, however
it has been shown that with familiarity and explicit professional development, the attitudes of
acceptance of these technologies improves over time (Rehmat & Bailey, 2014). Koh, King,
and Tsai (2013) suggest several methods of improving understanding and perception of the
technology. These include identifying how technology can help student’s difficulties, how
technology can transform content to address disabilities, learning new strategies, and methods
of planning with technologies. Perotta (2013) noted the importance of institutional attitude
towards new technologies and how it affects teacher attitudes.
There certainly appears to be a link between teachers’ perceptions of supportive
school leadership and their perceptions of beneficial technology use. This is in
keeping with studies that have investigated the factors impacting on technology-
enhanced teaching practices in formal schooling, highlighting the many levels

42
of actors, resources and interests determining opportunities and barriers,
including the broad political aspects and, indeed, the type of school leadership
(p. 325).
In fact, the researcher found “arguably a need to move beyond individualizing and ‘blaming’
certain groups of teachers for not making best use of technology” (p. 325), but to carefully look
at how teachers’ use of technology falls within the “wider contexts of schools as organizations
and the ‘job’ of being a teacher” (p. 326)
Shelton (2014) notes that with increased use of frequency, technology attitudes
improved. The greatest impact found in this study for individual impact on perception was that
of time. “At an individual level, lecturers reacted to new technologies either by directly
evaluating it (by experimentation or through research) or by weighing up the relative benefits
against any costs. The strongest element to “weigh” appeared to be “time.” (p. 758)
Student attitudes toward the use of technologies also change. Rehmat and Bailey
(2014) noted that as students utilized technologies more in the classroom, they were better able
to understand what purpose they served, enjoy their use and improve their attitudes toward
them. As their fluency with the technology improves, so does their perception (Ebenezer,
Columbus, Kaya, Zhang, & Ebenezer, 2011).
Several instruments have been developed in studies that are designed to measure
perceptions and attitudes of both faculty and students and the use of technologies. McCaslin
(2009) created an instrument that is used to measure student acceptance of a particular
technology: a classroom management system. This instrument was based on Davis’ (1989)
Technology Acceptance Model (TAM)and measures four categories associated with
perceptions and attitudes of students. The TAM has been” become a key model in
understanding predictors of human behavior toward potential acceptance or rejection of the

43
technology” (Marangunić & Granić, 2015). The factors that McCaslin’s instrument measured
were the effectiveness, importance, satisfaction and usage of the technology.
Another study that was designed to assess the experiences of teachers in relation to
technology was performed by Flanagan and Shoffner (2013). This study asked three questions
relating to teachers use of technology:
1. How do these secondary English teachers consider technology when
planning for classroom instruction?
2. How do these secondary English teachers use technology in their
classroom instruction?
3. What factors or beliefs influence these secondary English teachers'
planning for and use of technology for classroom instruction? (p. 246)
These responses to these questions fall into four categories of responses. The
categories, “planning for instruction, planning for instruction with technologies, benefits and
challenges to technologies and role of technologies in the classroom” (p. 250) provided critical
data for the researchers regarding how the teachers used, or did not use, the technologies. The
researchers found that the teachers expressed many positives with technologies. These include
differentiation, multimodal teaching, scaffolding, engagement, motivation and new
experiences. The perception that these teachers have had become motivation in their desire to
continue learning more about how to use technologies. In effect, the more they learned about
the technology, the more they liked it and thus the more they wanted to learn. Care was taken
to ensure that “teachers must know how to integrate technology effectively into their
instruction in order to maximize its potential for student learning” (p. 255). A survey that is
based upon these categories can be used to generate questions that can collect narrative data
concerning the use of technologies in a classroom, and “provide opportunities for technology-

44
related instructional decisions beyond the typical stand-alone technology integration course”
(p. 256).
Use of Interactive Whiteboards
One of the most widely touted pieces of technology in education is the interactive
whiteboard. It has been praised as a tool that can enhance student learning (Gregory, 2010),
create a flexible teaching environment (Kaufman, 2009), and student engagement (Glover,
Miller, Averis, & Door, 2007). It also is one of the most costly tools per classroom at a cost
starting at $3,000 which includes installation but does not include the peripheral equipment
(“How to Afford”, 2011). Widespread installation of the boards in classrooms across the globe
has been the focus of school systems and governments, often at great cost (Glover, et al.,
2007). As a result of the level of investment, a number of studies have been performed to
assess the impact and effectiveness of these technologies on student learning and the
educational environment. The ways the boards were utilized, supported, and resourced in a
British school was studied by Shenton and Pagett (2007). Although small in scale, the study
provided data that the use and impact of the boards varied widely. “There has been a huge
financial investment to provide IWBs in school. They have great potential for motivating and
engaging pupils in sophisticated forms of multimodality” (p. 135). The level of impact on
learning considering the use of IWBs has repeatedly been mixed. Akbas and Pektas (2011)
noted that there was no significant difference in the level of academic achievement in
university students between those who were taught with an IWB as opposed to those who were
not. However, the use of an IWB showed a significant increase in student participation,
interest and enthusiasm. “It was also found during the study that lessons conducted with
interactive whiteboards were more fun, had more on-task time and greater participation.” (p.
15)
45
The ways that the IWB can be utilized in differing learning environments has also been
the subject of research. The use of the IWB in a constructivist learning environment was the
subject of research by Dhindsa and Emran (2011). They found that the use of the technology
in a constructivist learning environment was able to minimize achievement gaps based on
gender when compared to traditional teaching methods. The researchers found that “the use of
constructivist teaching approach enriched with interactive white board technology, created a
classroom environment in which all students were actively engaged though out the lesson that
encouraged active learning” (pp. 406-407). The pedagogical approaches utilizing the IWBs
have been observed. Kearney and Schuck (2008) noted that most of the teaching involved
teacher dominated activity, however there were a number of “’dialogic’ exchanges, taking into
account students’ understanding, exploring their ideas and generating new meanings” (p. 9).
Most of the use was in explicit instruction with whole class interactions. The IWB has shown
to be effective in promoting authenticity through rich context. Additionally it was shown to be
beneficial as an organizational tool.
Not all research supports the IWB as an effective and beneficial tool. Slay et al. (2008)
noted a number of issues in their study. The benefits noted by the IWB was the fact that the
content is now visible on a larger screen as opposed to a television or traditional whiteboard, a
perception of benefit of having multimedia content in the classroom and the novelty or
engagement affect. Drawbacks included the lack of comfort or competency with the
technology, the lack of guarantee for an opportunity of interactivity, and the significant cost.
This cost may outweigh the benefit of the technology. Of additional concern was the discovery
that the benefits that may have been attributed to the IWB may have actually been caused by
the laptop/projector.

46
An instrument has been developed to evaluate the perceptions of the IWB in school
setting. Türel (2011) created an IWB student survey to determine “perceptions under three
critical components: learning and motivation, efficiency, and negative effects.” (p. 2448). This
instrument can be used as in a study that will measure these components in relation to IWB
usage.
During the late 1990s through the 2000s, a major effort was made in Britain to adopt
IWBs nationwide. They have been considered to be the early adopt of this technology
worldwide, and as such has been the source of information and focus of studies concerning this
form of technology (Schachter, 2010). Originally, the IWB was designed for business, but its
usefulness in the education realm was discovered quickly, first at the college level, then
following on to K-12 (Lacina, 2009). Britain’s adoption of these technologies was made
without the benefit of a deep body of study and knowledge on the impact they would have on
the students and schools (Moss & Jewitt, 2010). This adoption took place at a point in U.K.
history where advancements in instructional technologies and political will and policy
converged. Promises to improve and upgrade every school in Britain were made by the
incoming parties were laid out in specifics through a number of policies. The final goal was
“does not seem to deter schools from purchasing IWBs, and many schools base their decisions
on benefits listed in descriptive studies, such as greater student engagement and heightened
interest in whole-class lessons” (p. 23). In regards specifically to the IWB technologies,
significant investments were made to accomplish these goals. Schools were upgrading internet
connectivity, equipment (computers, projectors), spaces (computer lab and suites) and IWBs.
Moss and Jewett (2010) performed a study drawing on data over the previous decade to
see what lessons were learned from this massive endeavor in Britain. In their study, one
stipulation noted in their study was that their finding depended on properly used technology,
47
not “the mere absence or presence of technology in the classroom” (p. 24). During their
collection of data it was noted that early on the amount that the technologies were used did not
correlate to the impact that they had on learning. Of higher correlation was how the IWBs
were being used (Harrison et al., 2002). However, this realization came because of the fact
that the IWBs were not being used as effectively. This required a refocusing of the goal of
IWBs in the early 2000s to be “enhanced pedagogic practice with ICT” (Moss & Jewett, 2010,
p. 24) instead of simply having it for basic practices. These findings did not stop other
countries and organizations from adopting IWBs. Lacina (2009) notes that although there is a
lack of inferential studies supporting the effectiveness of IWBs, this “does not seem to deter
schools from purchasing IWBs, and many schools base their decisions on benefits listed in
descriptive studies, such as greater student engagement and heightened interest in whole-class
lessons” (p. 271).
Within a few year of initial adoption, benefits and disadvantages of the initial
technology suites that were becoming evident. Amongst the benefits, students were gaining
skills with technologies, albeit rather basic. However, there were difficulties with the teaching
environment when utilizing the classroom technologies. If not well designed, the rooms often
had poor visibility which “made it hard for teachers to monitor pupil activity or command
attention” (Moss & Jewitt, 2010, p. 26). However as some of the aspects of the suites were
finding difficulty in using in a classroom wide experience, the IWBs showed some promise in
that environment. As IWB technology was improving in the early 2000s to the impressive
touch interface and digital projection, along with the ease of installation in existing spaces,
they replaced some of the original, less classroom friendly elements of the technology suites.
The apparent ease of adaptation to the classroom along with the ease of use let to a fuller
integration of the devices in the curriculum in Britain. It was noted though, that the place that

48
the IWB takes in the classroom was yet fully defined. It seemed to fall in the space between
older technologies (such as blackboards, flipcharts, and the like) and newer ones (PCs, laptops,
tablets). The IWBs ability to adapt to the educational environment specifically was lagging
behind other technologies. This led to companies that develop IWBs, such as SMART, to
solve the problem by developing their own applications to work with the equipment and “by
encouraging practitioners to ‘publish’ and share materials they have developed themselves” (p.
26).
In looking through the data over the span of the technology incentive in Britain, Moss,
and Jewitt (2010) did not find great evidence that the IWB ever provided the effectiveness and
impact directly on education that was originally envisioned by the plan laid out by the
government. However, they did find that, despite clear evidence to the effectiveness, these
technologies were being used, and used heavily. Time and time again it was noted that a
teachers would “start a lesson and over its course filled the IWB with writing, cleaned the
IWB, filled the IWB with writing once again, cleaned the writing off” (p. 32). The IWB was in
many ways a high tech version of a blackboard. The technology, with all its bells and whistles,
was in usage not being used in new and innovative ways, but being adapted by teachers back to
a more traditional form of technology. The authors note that when adopting technologies,
organizations need to take the teachers desires and methods of instruction into serious
consideration. The mere adoption of technologies does not seem to have changed the teaching
methods of teachers, rather these methods, when not met with significant professional
development and preservice training, resulted in the technology being adapted to the methods
of the teachers. Rather than rapidly adopting new technologies, those making policy and
adopting this equipment have to ensure that they “be tested out in specific contexts where
49
demands are made of the technology too, in line with current practice and clear pedagogic
intent” (p. 34).
Mobile Technologies
The traditional IWB is not generally seen as a mobile device as it is traditionally
installed on a wall of a room. The MIWB and IWBAPP technologies, however are mobile
devices designed for quick and easy transport within a space. This mobile feature allows users,
learners in particular, to be able, as noted by Garrison, “to learn anytime, anywhere,
transforming e-learning into mobile learning (m-learning) that has emerged as an innovative
learning approach which takes advantage of the unique features of mobile devices to improve
teaching and learning and create and sustain communities of learners” (as cited in Ishtaiwa,
2014, p. 2).
Many studies have been conducted on mobile devices that concentrate on certain
mobile learning activities. The concentrations are as varied as the mobile devices themselves.
The activities that studies include are texting, emailing, social networking, multimedia (audio,
video, imagery) usage, course and lesson planning, note taking, sharing of resources,
completing assignments, and highlighting of notes and references. These many activities
require both the learner and teacher to be well skilled in the proper use of the equipment and
require careful screening of potential resources. In order to be effective, a well-designed plan
of learning and integration must be created and followed. (Ishtaiwa, 2014)
Tablets
Tablet based personal computer technology is still relatively new, The body of
literature, though rapidly growing, is still limited to many small quantitative studies or
anecdotal reports on benefits to their use. Quantitative studies are not widespread, and those
that address outcomes in educational environments are either focused at the elementary or

50
higher educational levels. There is much less scholarly quantitative research for secondary
(high school) studies of tablets and their impact on education or perceptions of use by students
and faculty at that level. (Horzum, Öztürk, Bektas, Güngören, & Çakir, 2014).
Tablet personal computers, also known as tablets or TPCs, is a portable computing
device with a touch screen that can be used with either a specialized stylus or the user’s fingers
to interact with preloaded programs. These programs, or apps, vary greatly in use and
function, however one of the beneficial features of tablets with apps is the ability to draw,
write, and teach (Gill, 2007). These devices are more flexible to use in a variety of different
environments, they are highly mobile, and are seen to be easier to use by all users in schools,
students, teachers, and administration alike. It is because of these features these forms of
technology are being used in increasing amounts in schools as a means of integrating
technologies into education (Hu, 2011; Hargis, Cavanaugh, Kamali, Soto, 2014).
As discussed by Ishtaiwa (2014), careful planning of resources must be considered
when utilizing mobile technologies. Falloon (2013) echoes this in regards to tablet apps. The
author stresses that, in order for the technology to be engaging and productive, the installed
apps should be fully evaluated. When performing an evaluation, a number of factors should be
considered. These factors include the ability of the app to:
a. communicating learning objectives in ways young students can access and
understand;
b. providing smooth and distraction-free pathways towards achieving goals;
c. including accessible and understandable instructions and teaching
elements;
d. incorporating formative, corrective feedback;
51
e. combining an appropriate blend of game, practice and learning
components;
f. providing interaction parameters matched to the learning characteristics of
the target student group (p. 519)
Many apps are available for free from developers, however care must be taken to
consider whether these versions have all the features required to meet the requirements listed.
It was also noted just because there is a paid version of the app, that fully functional features
were automatically available. Falloon’s (2013) study revealed that many features were not
available in apps regardless of their cost. The lack of the factors listed often left the student
unable to understand the purpose in learning and “diverted from this by a myriad of distractive
or confusing features embedded in the content” (p. 519). It was also found that those apps that
were revealed as the most productive were designed with a deep understanding of pedagogy
and “in many ways mimicked the sort of teaching approaches used by teachers” (p. 519)”
TPCs were also shown to be beneficial for planning, administrative and organizational
tasks, sometimes in dramatic fashion (Winslow, Dickerson, Lee, & Geer, 2012). The tablets
were shows as effective in data collection and informational resources (Boyce, Mishra,
Haverson & Thomas, 2014). These authors noted that during a lesson in nature learning, the
device’s inherent touch based features made it useful in organizing tasks to be performed both
by learners and teachers.
Another benefit in the use of tablets was in differentiation of instruction for special
education. Weng, Savage, and Bouk (2014) noted that the ability for tablets as methods of
delivering video based instruction. These devices, with their high definition screens and
wireless networking capabilities, students could access an endless variety of video based

52
resources on sites. Many of these sites promote collaboration and sharing of resources
amongst teachers.
Chou, Block, and Jeness, (2012) conducted a study that looked at a high school project
that lasted for half a school year to see what benefits and challenges there were in providing
iPads for use in the classrooms. Professional development played a key role in the successes
that were noted in the study. The authors noted that any development must not focus solely on
the technical expertise, but on use of the content and pedagogical techniques involving the
technology. Among the challenges that they noted that occurred more off then was that
Students could get off track while looking up information on the Website or attempt to use
apps that were more entertaining and not central to the task” (p. 21). Amongst the benefits, the
tablets were shown to increase engagement of students and improving the interaction through
discuss in the classroom.
Outside of instruction, numerous uses for the tablets have been found that still support
education. Jahnke and Kumar (2014) notes in their study how iPads are used in the design of
instruction, giving teachers richer and deeper tools that can improve teacher reflection, gain of
digital skills, and make meaningful connections to real life”.
Although there are millions of different apps available, studies that involve specifically
apps designed to emulate elements of IWBs, whether qualitative or quantitative, was not found
in the literature. A number of anecdotal mentions of IWBAPPs (Machun, Trau, Zaid, Wang, &
Ng, 2012; Dunham, 2011)in advertisement or trade publication articles (“Splashtop
Whiteboard App”, 2011; “Educreations Interactive Whiteboard App”, 2012, “50,000
Downloads of Doceri”, 2012) were located in the literature.

53
Mobile Interactive Whiteboards
The research available in the body of literature is very limited. Most of the studies are
associated with a MIWB is tied directly to a full size or traditional IWB, such as the SMART
Board, Promethean or other branded device. A white paper, published by the manufacturer of
the MIWB utilized in this study, relied on a number of studies performed with full size IWBs
as its means to explain the effectiveness of their own device (“IESD White Paper”, 2010).
The author(s) of this paper put forth a possible path that the future of IWB technology
will take. Based on Higgins (2010) findings, they noted that rather than the single touch or
single user IWB technology that currently exists, the future will include networkable IWB
devices that will allow for multiple units being connected and allowing for in truly interactive
experience for student. Miller and Glover (2010) were also mentioned in support of this
prediction. The IESD white paper (2010) stresses that the ability to facilitate “student -
centered instruction and direct student interaction with the technology” (p. 14).
No further research, qualitative, or quantitative, was found using these specific forms of
technology outside of this white paper and other studies that involve traditional IWBs instead
of the MIWB or whiteboard slate.
Evaluation of Training
Training evaluation has been an important part of the design of effective instruction for
almost as long as instruction has been taking place. It also has been very elusive. As noted by
Thistlewaite (2014), truly evaluation at levels that are not well defined by profession, such as
the undergraduate or pre-service levels, is very difficult. As part of the approach known as
ADDIE (analyze/assess, design, develop, implement and evaluate), a model which has a
history almost as elusive as training evaluation (Molenda, 2003), evaluation is seen as a key
and vital part of the development of effective training (Williams, South, Yanchar, Wilson, &

54
Allen, 2011). While much evaluation that occurs in education is ad hoc and informal,
Williams et al (2001) found that as evaluators became more aware of evaluation models and
methods, they could incorporate them into the design of their instruction and environments.
Numerous instruments and methods have been developed and implemented. A widely
recognized and accepted framework is Kirkpatrick and Kirkpatrick’s (2006) four level model
of training evaluation. First created in 1956, it establishes four levels upon which training can
be evaluated: reactions, learning, transfer, and results. The levels have shown to be flexible
and comprehensive. They provide an effective foundation for the successful evaluation of a
training or educational program. Several critical studies have been performed that have
pointed out some limitations of this evaluation system. As noted by Yardley and Doman
(2012), “that the levels could influence the questions asked and results produced, rejected them
as unsuitable for evaluating either ‘soft’ outcomes or continuous learning” (p. 100). However,
despite critiques, numerous studies have adapted Kirkpatrick’s model to evaluation systems in
educational systems (Praslova, 2010; Rouse, 2011; Rajeev & Jayarajan, 2009).
Teacher Perception
Attitudes and perceptions in teachers varied greatly on a number of factors. In order to
better prepare students for life in the 21st century, all educators must be active participants in
creativity while at the same time building communication, collaboration, and critical thinking
skills. Providing preservice teachers practice with technology tools and technology integration
promotes 21st-century learning (Partnership for 21st Century Skills, 2009). Pilgrim and Berry
(2014) noted that preservice teachers were very excited and eager to learn about and use new
technologies. During their training, these teachers were observed being given many
opportunities to learn and incorporate a variety of differing technologies: content specific
applications, video editing packages and voice emulating apps. The preservice teachers not

55
only found that it was enjoyable and engaged the students, they also “noted that the several of
the teachers seemed to learn from the campers when it came to the iMovie presentations)
(p.137).
A number of barriers to positive perception towards technologies have been revealed in
studies. Horzum, et al., (2014) noted that many educators that are not familiar with mobile
technologies or that do not know how to use them effectively in the classroom do not perceive
them as easy to use. Their anxiety and lack of confidence with the equipment paralleled their
lower perception levels.
Chou, Block, & Jeness (2012) noted in their study of high school use of mobile
technologies that an important factor in improving the teachers’ perception of the role of
technologies in their classrooms was providing innovative ideas for iPad integration and
regular, effective professional development opportunities. Horzum, et al., also found that at
tools that were found to be reliable and had valid effect in the classrooms improved the
attitudes of teachers, as well as students towards these technologies.
Return on Investment
The measurement of successful investment in the commercial and business sector is the
return on investment (ROI). This concept has been recently transferred to the educational
sector, especially considering the struggles that communities are having in meeting budgetary
requirements. Boser (2011) reported on one of the largest studies involving return on
investment in education. This yearlong study looked at nearly every major school district in
the United States to measure the achievement of students in relation to money and efforts
invested. The findings raise significant questions about the productivity, focus on investment
and wide variance of spending levels between the states. The ability of government
organizations to measure the ROI on any program is challenging (Al-Raisi & Al-Khouri, 2011)

56
and requires further research to “measure returns from IT investment for the public sector” (p.
38). In the field of education, ROI is very difficult to evaluate, however using Kirkpatrick and
Kirkpatrick’s (2006) model as a base, Phillips (1996) developed a method to measure this
elusive factor. This method is based on four levels of measure that are then taken to create a
fifth level: ROI. The four levels Phillips developed are reaction/satisfaction, learning,
application and impact (2003). Each of these levels requires data that is monetized so that an
ROI can be formulated and calculated. In the evaluation of training and educational
investments, many times the data is considered ‘soft’, meaning that it does not have a direct
monetary value. Additionally, and often most importantly, intangible, non-monetary benefits
to education and training must be considered. These benefits cannot be converted to a
monetary value, but often are as important as benefits that are easily monetized. Such
intangible benefits include increase in satisfaction, commitment, teamwork, and reduction in
conflicts and complaints. These intangible benefits must be considered in the ROI process
(Phillips, 1997).
Technology and Student Retention
Part of assessing the return on investment relating to education is to understand what
improvements the items was expected to make. The literature shows that there are several
reasons that schools and districts make large-scale investments in technologies. Aside from the
previously discussed engagement of students and expected, though not always achieved,
improvement in student performance, another factor is the expectation of improved student
retention. Unfortunately, the research has been mixed regarding the impact of technology on
the retention of information learned in the classroom. Liu and Stengel (2011) studied the
impact of class response systems on students in a mathematics course. This study
demonstrated that students and teachers were more engaged and motivated. The researchers

57
agree that this technology can be effective in a similar educational environment. However,
technologies in another form, multimedia features in computer based learning, showed in
significant impact on the understanding and retention of content. (Baytiyeh & Naja, 2010).
Although engaging, the effect did not appear to last as the researchers had expected. Likewise,
Giles and Baggett (2009) noted that as the novelty effect of a technology wears off, its impact
upon engagement and retention does as well.
Technology and Accountability
Schools and districts have spent much of the decade adapting to the increasing focus
from government on standards-based accountability (Hanushek & Raymond, 2005).
Nationally, the No Child Left Behind Act of 2001 (NCLB) and Elementary and Secondary
Education Act (ESEA) flexibility waiver instituted in 2012 have impacted all states and
districts by setting accountability goals. Many states, including Virginia, have their own
accountability standards, leading schools and districts to achieve meet the requirements of this
two-prong system. Virginia’s SOL program (“Standards of Learning”, 2011) set the minimum
objectives of nearly every level and content area in elementary and secondary education in the
state. Achievement of 70% these standards lead to accreditation of individual schools and
districts. Other factors that schools and districts must meet include graduation rates
(“Standards of Accreditation”, 2011).
Researchers have shown that among the reasons that schools make large-scale
purchases of technologies is to meet these accountability standards and requirements that
federal and state governments have instituted (Resnick, 2011). There is limited literature that
supports or rejects this as a reason for this level of investment. Kronholz (2011) noted that
there was some success in helping students who were at-risk of dropping out to complete their
high school education through the use of blended educational environments that utilized both

58
traditional and online classes. Technologies have also been used to help schools that have
limited resources and high numbers of students that cannot, because of cultural or geographical
limitations, successfully complete the requirements for graduation (Cash, 2011).
Technology to Provide for 21st Century Skills
In order to prepare students for their lives after high school, there has been a growing
focus on the promotion and training of students in the productive use of technologies (Tingen,
Philbeck, & Holcomb, 2011). Four elements have been described as the basis of a framework
for 21 Century Learning. The four elements are core subjects and 21st century themes, life and
career skills, learning and motivation skills, and information, media and technology skills
(Partnership for 21st Century Skills, 2009). The final of these, information, media and
technology skills, recognize the importance of students to be able to access and evaluate
information, create media, and apply technology effectively. There is a need of these skills to
be imparted to the students through the aligning of “21st century standards, assessments,
curriculum, instruction, professional development and learning environments” into educational
systems.
The ability and effectiveness of schools to prepare students for their futures through the
teaching of 21st century skills has been mixed. The format, style of teaching, and level of
interaction of the students played key roles in the degree learners gained 21st century skills.
Technologies that were used more for presentation of information and less for interaction were
of little impact on the students’ achievement of desired skills (Tingen, et al., 2011). However,
the levels of student interaction and teacher integrations abilities and acceptance increased, so
too did the level of skills acquisition (Thomas, Ge, & Greene, 2011). Most notably was the
impact of designing and playing of digital games.

59
Students were not the only stakeholders in the educational environment to acquire 21st
century skills. Teachers were also beneficiaries, whether it was intended or not. Teachers who
used technology more and had increased belief in the benefits of technology became more
adept in its effective use in the classroom (Lambert & Yi, 2010). As with students, digital or
technology-based games provided a complexity which resulted in a positive impact on the 21st
century skills of pre-service teaching candidates (Sardone & Devlin-Scherer, 2010).
Summary
The research in the literature reveals several factors. The use of technologies in
education is growing at a rapid rate. Communities are making significant investments into
technologies in schools under the assumption that this equipment will help their students be
more successful and ready for modern society. Amongst the most sought after and expensive
technologies is the IWB. The cost for this technology is very high; at least $5,000.00 per
classroom, and, like many technologies, the research reveals that the impact on the students is
mixed. It has been challenging for researchers to design and measure effectively the impact on
achievement of technologies. The greatest impact of any technology appears to be in the area
of interest, engagement, and novelty.
The great cost of investment in technologies in the classroom has been justified by the
belief that it provides for improvement in student achievement. While the research shows that
this is not necessarily a reality, there are some benefits that are evident. In addition to the
engagement effect, technologies in the classroom have shown, when utilized effectively, to
benefit the students at risk of dropping out, the acquisition of 21st century skills, and the
retention of teachers through professional improvements.
Evaluating the use of technology, and specifically the interactive whiteboard, in
education has been difficult. The instruments, levels of training, and pedagogical approaches

60
all play a role. Additionally the ability to discern what impact the technology alone has played
puts the validity of many studies into question. Qualitative studies abound, however, solid
quantitative studies involving the impact of interactive whiteboards are fewer. The importance
for school districts to invest wisely has raised the importance of evaluating the return on
investments in technologies in the classroom, especially ones with significant costs like the
IWB.
Other forms of whiteboard technologies, such as the mobile whiteboard slate (MIWB)
or tablet based whiteboard app (IWBAPP) provide many features that traditional IWBs have, at
a fraction of the cost. However, there are no scholarly studies that measure the impact,
effectiveness, or perceptions of these technologies in the classrooms with the exception of
those that fall upon studies if traditional IWBs.
The research reveals a gap in that quantitative studies involving impact of school wide
interactive whiteboards are few, small scale, mostly at lower grade levels and outside of United
States. These studies rarely evaluate the value of these technologies when considering the cost,
and do not consider technological alternatives that may provide the same instructional tools to
a school at a fraction of the cost.

61
CHAPTER THREE: METHODS
The purpose of the study was to discover if there is sufficient statistical evidence to
support the decision to invest heavily in a technology and radically alter the teaching
environment by incorporating a classroom technology package with an IWB into all
classrooms within RVHS or Bayside Public Schools. This chapter will discuss the research
design and questions, definition of the variables, descriptions of the participants and sampling
method, the research procedures, and a description of the data analysis.
Design
The installation of the classroom technology package with IWBs at RVHS was
completed in 2011. MIWBs were received by all high schools in 2012. Classes, teachers,
instruction, professional development, and testing were completed, controlling for as many
intervening variables as possible. As the researcher was unable to perform a true experiment
due to inability to truly randomize control for all confounding factors, a quasi-experimental
non-equivalent control group research design was appropriate (Gall et al., 2007).
The population from which samples were drawn is Bayside Public School District high
school students who attend Geometry classes and who will participate in district
benchmark/midterm assessments and statewide end-of-course SOL tests at the completion of
all levels of Geometry. As the population from which the samples were drawn must come
from the school district, and it is highly unlikely that classes could be arranged to fit the study,
Gall et al. (2007) state that convenience sampling would be appropriate. The authors describe
a convenience sample as one where “the researcher selects a sample that suits the purpose of
the study and that is convenient” (p. 175). The sampling was taken from this population as the
students will be assigned to classes based on the requirements of scheduling. They were
grouped into students that were in classes that had the IWB, MIWB, IWBAPP, or no IWB
62
technology utilized while learning certain skills in the course. The sample was divided into
group based on the treatments of technology. Samples of student data were drawn from
students of the same grade, attending the same courses, and taking the same tests. The teachers
were first provided the technology equivalent levels professional development in the
technology. The difference between the groups was those students who were in classrooms
that had the IWB, the MIWB, the IWBAPP, and no IWB during the instruction on a particular
skill or standard. Each class was then rotated to have the other three different technology
applications for three other different skills: one skill per technology application. The rotation
ensured independence of observations in that for each of the four skills or standards a group of
students had each type of technology application. Additionally each type of technology
application had a group of students assigned that learned a differing skill. The students
received instruction from teachers and were assessed on to measure their student achievement
and sustained impact levels. Students and teachers were also surveyed using a Likert-scale to
assess the level of satisfaction and perceived results (Appendices A - C). The results of the
previous four measurements were utilized to analyze the impact on the levels of measure that
determine ROI between each type of IWB technology.
The data for the study was collected from several locations. These schools are in a 4-
by-4 block scheduling, which means they complete four classes in four quarters, twice a year.
Each of the two semesters marks the start of a completely new set of classes. Pre- and post-test
assessments (Appendix D) were created in conjunction with a BPS Geometry content area
subject matter expert, utilizing questions from normed and validated test banks designed to
assess readiness for the Virginia Geometry SOLs. The pre- and post-assessments did not use
identical questions to minimize instrumentation threats, however they did assess identical
skills. Post-performance data were collected at different times to ensure that the levels of

63
measure for student achievement and sustained impact were properly considered. The student
achievement measure was assessed at or near the end of the lesson instruction, the sustained
impact measure at the end of the entire transformations unit to test lasting impact of the
instruction. The test scores are maintained in a database/spreadsheet that record the students’
study identification data, SOLs that were measured, and the performance results.
Student course performance, attendance, and class assignment data were drawn from
the school district’s student database (StarStudent). StarStudent securely houses all the
necessary student data, to include teacher, class assigned, dates attended, and standardized test
scores. Survey results were collected utilizing a paper survey. Results were transcribed into a
spreadsheet program. The data output from the varied sources were then processed utilizing
spreadsheet and database software. Processing reported the school, classroom, course, pre-test
scores, post-test scores, and piece of technology utilized for each subject, and the level of
professional development received by the teacher. Additionally, survey results were collected
and processed.
The processed data was then entered into the Statistical Package for the Social Sciences
(SPSS) software package so that descriptive and inferential analyses could be applied. The
variance of the each of the levels for the strata was then analyzed using a one-way analysis of
variance (ANOVA). The results of the analysis would determine whether or not there is
evidence that the type of technology utilized in a classroom resulted in a statistically
significantly different impact in each of the dependent variables involving performance data.
Additionally, the survey results were collected and analyzed to see if there was any difference
in the level of satisfaction and perceived results based on the type of technology utilized. Each
of these data points were utilized on an instrument based on the five-level training evaluation
to determine if there is a positive return on investment for these technologies.

64
Questions and Hypotheses
The research questions are:
1. Is there any difference in the satisfaction level of the class participants dependent upon
their utilization of the IWB, MIWB, or IWBAPP?
2. Is there any difference in student achievement based on a pre- and post-test between
lessons taught with an IWB, MIWB, IWBAPP, or no IWB technology?
3. Is there any difference in the sustained impact of learning utilizing the technologies
between the IWB, MIWB, IWBAPP, or no IWB technology?
4. Is there any difference perceived by the students and faculty on the end of course results
between the IWB, MIWB, or IWBAPP, or no IWB technology?
The research hypotheses are:
1. Satisfaction levels of the class participants will be significantly different across groups
utilizing the IWB, MIWB, or IWBAPP.
2. Student achievement levels between the pre- and post-test will be significantly different
across groups utilizing the IWB, MIWB, IWBAPP, or no IWB technology.
3. Sustained impact of learning of the student will be significantly different across groups
utilizing the IWB, MIWB, IWBAPP, or no IWB technology.
4. Perceived results by the class participants will be significantly different across groups
utilizing the IWB, MIWB, IWBAPP, or no IWB technology.
The null hypotheses are:
1. Satisfaction levels of the class participants will not be significantly different across groups
utilizing the IWB, MIWB, or IWBAPP.
2. Student achievement levels between the pre- and post-test will not be significantly different
across groups utilizing the IWB, MIWB, IWBAPP, or no IWB technology.

65
3. Sustained impact of learning of the student will not be significantly different across groups
utilizing the IWB, MIWB, IWBAPP, or no IWB technology.
4. Perceived results by the class participants will not be significantly different across groups
utilizing the IWB, MIWB, IWBAPP, or no IWB technology.
Participants
The population for this study is students in a River View High School in the Bayside
Public Schools district in southeast Virginia. Student racial demographics in the district are
50% white, 33% black or African American, 8% Hispanic, 6% two or more races, 3% or less
for Asian, Native American, or Pacific Islander. Students that are eligible for special education
benefits make up approximately 16% of the population. Approximately 37% of students are
eligible for free and reduced lunches (“Fall Membership”, 2015). Students who took advanced
placement (AP) or international baccalaureate (IB) courses comprised approximately 5% of the
population (“Advance programs participation”, 2014).
The sampling frame will narrow the population with the following characteristics:
During the study, students selected must:
Attend at least one full semester of courses
Enrolled full time
Grades 9-12
Attended high school at a BPS district school.
Be a first time participant in the course
Student who are enrolled that are repeating the course will be eliminated from
the final data analysis
Convenience sampling was utilized in this study. Lund (2012) defines this type of
sampling as data that is gathered due to the ease of access. Convenience samples were taken
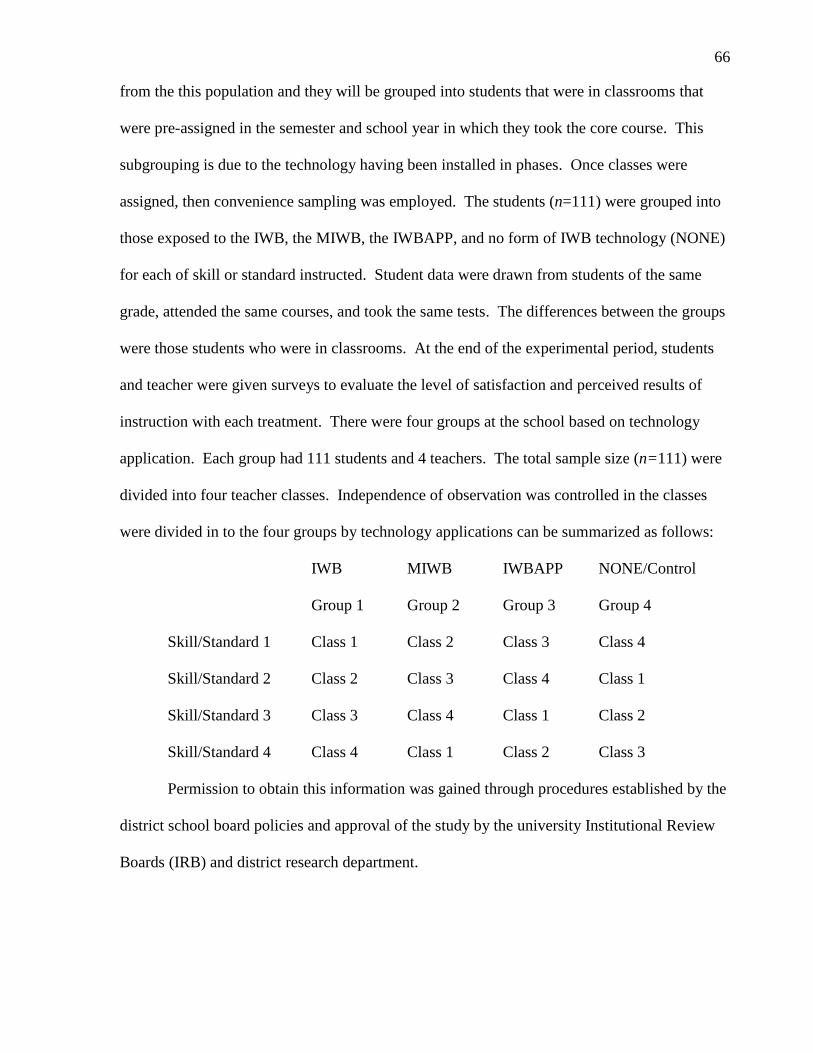
66
from the this population and they will be grouped into students that were in classrooms that
were pre-assigned in the semester and school year in which they took the core course. This
subgrouping is due to the technology having been installed in phases. Once classes were
assigned, then convenience sampling was employed. The students (n=111) were grouped into
those exposed to the IWB, the MIWB, the IWBAPP, and no form of IWB technology (NONE)
for each of skill or standard instructed. Student data were drawn from students of the same
grade, attended the same courses, and took the same tests. The differences between the groups
were those students who were in classrooms. At the end of the experimental period, students
and teacher were given surveys to evaluate the level of satisfaction and perceived results of
instruction with each treatment. There were four groups at the school based on technology
application. Each group had 111 students and 4 teachers. The total sample size (n=111) were
divided into four teacher classes. Independence of observation was controlled in the classes
were divided in to the four groups by technology applications can be summarized as follows:
IWB MIWB IWBAPP NONE/Control
Group 1 Group 2 Group 3 Group 4
Skill/Standard 1 Class 1 Class 2 Class 3 Class 4
Skill/Standard 2 Class 2 Class 3 Class 4 Class 1
Skill/Standard 3 Class 3 Class 4 Class 1 Class 2
Skill/Standard 4 Class 4 Class 1 Class 2 Class 3
Permission to obtain this information was gained through procedures established by the
district school board policies and approval of the study by the university Institutional Review
Boards (IRB) and district research department.
67
Setting
The study took place at RVHS in the BPS school district. The school is a suburban
public high school in southeastern Virginia. High school Geometry core content courses were
utilized focusing on selected skills or standards that were taught to all students. The
classrooms were equipped with an IWB, MIWB, or IWBAPP, and a classroom technology
package that consisted of a video projector, a document camera, and a laptop computer that
integrates the equipment. Four skills or standards were selected to be taught by the teachers.
Each teacher was designated as highly qualified, holding at least a master’s degree, have at
least one year of experience teaching the content and received equivalent training in the
effective use of an IWB, MIWB, and IWBAPP. Lessons were created following Pitler,
Hubbell, and Kuhn’s (2012) model for effective use of technology in classroom instruction.
The IWB utilized was the SMART BoardTM
600 Series model. The MIWB was the
eInstruction Mobi ViewTM
instructional tablet. The IWBAPP was DoceriTM
app and was
installed on an Apple iPadTM
3. Each IWB application was attached to a system allowing
imaging to be projected. Each student group had one skill or standard taught using an IWB,
one with a MIWB, one with the IWBAPP, and one with no form of IWB technology.
Instrumentation
This study utilized four forms of instrumentation (Appendices A-D) that relate to the
four levels of measure used to determine return on investment in training designed by Phillips
and Stone (2000). The assessment instruments utilized validated and normed questions
designed to prepare students for SOLs or benchmarks/midterms (“Standards of Learning”,
2011, “Benchmark Assessment”, 2012). Additionally, using guidance from the Kirkpatrick
and Kirkpatrick (2006) and Phillips and Stone (2000) training evaluation models, five-point

68
Likert scale surveys were used to measure the level of satisfaction and perceived results.
Content specific pre- and posttests were utilized to gather results.
The first, or level 1, measure to determine the return on investment according to
Phillips and Stone (2000), is the “participant reaction and/or satisfaction” (Chapter 5, Location
1073). Phillips notes that the most common methods of acquiring this information are through
the use of interviews or questionnaires (surveys). The literature revealed a significant variety
of survey instruments that measured participant satisfaction with technologies. Türel (2011)
developed a survey instrument, the Interactive White Board Student Survey (IWBSS), to
“evaluate the IWB use based on perceptions of students who have been taught with IWBs” (p.
2441). This survey measures three factors of satisfaction: perceived learning contribution and
motivation, perceived efficiency, and perceived negative effects. This survey was shown to be
both valid and reliable instrument as a measure of IWB use in classrooms. The survey
instrument was utilized for the IWB, MIWB, and IWBAPP applications of technology. See
Appendix A for questions that were presented on this instrument.
In the review of the literature, it has been noted by numerous authors that the most
significant impact of the IWB technologies on learning is through its ability to engage the
student (Tanim et al., 2011; Glover et al., 2007). In determining the return on investment in
training, the second element noted by Phillips and Stone (2000) is in measuring the learning
that takes place in the training (Chapter 5, Location 1194). The measurement of this is through
a demonstration that the student can show that they have gained the knowledge that was
addressed in the standards or objectives. This can be done through skills testing. Holderied
(2011) performed a study to measure the impact of a technology, specifically an interactive
‘clicker’ on learning due to its engagement of the students. The study design was similar in
that it compared the short term impact on learning that the technology had when compared to a

69
class that did not use the technology. The questions were taken from the bank of valid and
reliable questions that are used to prepare students for the Virginia SOL and district benchmark
exams. The post test will be given prior to the benchmark exam so that there is no possibility
of the students being exposed to a question that they may have seen on a prior examination.
See Appendix D for questions that were presented on this instrument.
The intent of level 3 is to measure the impact of the training over time. Like the
previous research question, this can be done through formal skills testing. Again, Holderied’s
(2011) design to measure the impact of a technology on learning due to its effect on student
engagement when compared to a class that did not use the technology can be used as a model
for this study. The questions were taken from the bank of valid and reliable questions that are
used to prepare students for the Virginia SOL and district benchmark exams. The post test was
given at the end of the unit, but prior to the final exam review so that there is no possibility of
the students being exposed to a question that they may have seen on a prior examination or
learning utilizing a different technology. See Appendix D for questions that were presented on
this instrument.
Level 4 data is used to determine the impact that the training and technology had upon
instruction (Phillips & Stone, 2000). The imparting of learning upon students is a significant
goal of the educational system and any method of teaching should positively impact this.
Measures of data at this level will be used to determine the perception of efficacy of the
technology in the classroom. Phillips & Stone (2000) stress the importance of finding reliable
sources of level 4 data. Amongst those that they recommend are participants, supervisors, and
subordinates (Chapter 6 Location 1897). In this study, these would be the faculty and students.
McCaslin (2009) developed a valid and reliable survey based on the Technology
Acceptance Model (Davis, 1989) that is designed to measure perceptions that teachers have in

70
the effectiveness, importance, and satisfaction of technologies in the classrooms. The surveys
found in Appendices B and C was designed using McCaslin’s instrument as a model. As this
study will have a small group of faculty participants, narrative data about their experiences will
be gathered. Four questions, based on the categorical findings by Flanagan and Shoffner
(2013) were added to the faculty survey as shown in Appendix B.
Phillips & Stone (2000) have developed a comprehensive program to effectively
measure ROI in training. The ROI is calculated on data collected from the previous four data
measurements. This final measure, although displayed in consistent monetary forms, varies
depending on the organization’s needs, implementation timing, institutional support and
performance measures (Chapter 10 location 2857). Due to this great variance between every
type of organization, performing a final ROI was not performed in this study.
Procedures
The data for the study was collected from several locations. Student performance,
attendance, and class assignment data will be drawn from the school district’s student database
(StarStudent). StarStudent securely houses all the necessary student data, to include teacher,
class assigned, dates attended, and standardized test scores. Survey results will be collected
utilizing paper surveys and transcribed into a spreadsheet program, Microsoft Exel. Post-
assessment results were gathered from the classrooms utilizing the school system’s grade
recording database, GradeQuick and scoring program, Zipgrade. The data output from the
varied sources were then processed utilizing spreadsheet software. Processing reported the
school, classroom, course, content pre- and post-test scores, assessment taken, assessment
score and piece of technology utilized for each subject, and the level of professional
development received by the teacher. Additionally, survey results were collected and
processed.
71
Data Analysis
After the data was collected from the storage areas, data processing combined the data
so that it is sorted first into the four research questions (satisfaction, student achievement,
sustained impact, perceived results). Then the data was parsed based on which technology
application (IWB, MIWB, IWBAPP, NONE) to which it applies. The data for assessments
was organized into pre and post application of technology and the difference between each
assessment was calculated for each participant. Additionally, the results of the survey for each
class were collected and sorted according to which technology has been applied to the survey
which it applies.
The process data would then be entered into SPSS so that descriptive and inferential
analyses can be applied. Because the goal was to compare a single, continuous variable (the
difference in pre and post test scores, or survey scores) to one variable with multiple (>2)
independent groups, a one-way analysis of variance (ANOVA) was appropriate for this study
(Howell, 2011). Significance was set at the p<.05.
Tests for meeting statistical assumptions were performed. A boxplot analysis was
performed to ensure the absence of significant outliers. A Q-Q plot analysis was performed to
test for a normal distribution and linearity of relationships. Homogeneity of the variance
matrices was checked utilizing Levene’s test. The design ensured the independence of
observation. Due to of the lower number of teachers (n=4), only descriptive and qualitative
data will be drawn from their instruments.
The first analysis was for level 1 measure data and was intended to show if there was
any significant difference in the mean participant satisfaction levels between the students based
on technology application (IWB, MIWB, IWBAPP). The survey addressed three factors of
satisfaction: perceived learning contribution and motivation, perceived efficiency, and

72
perceived negative effects. Next, the analysis focused on level 2 data to show if there was any
significant difference in the impact of the technologies by analyzing the mean student
achievement among the students based on technology application (IWB, MIWB, IWBAPP,
NONE). The next step in the analysis involved level 3 data: the sustained impact of the
application. End of unit assessment data was analyzed to determine if there was any
significant difference in the student performance between the applications of technologies.
The last analysis element, level 4, was analyzed to determine if there is any significant
difference in the perceived results based on the technology application. The survey addressed
three factors of perceived results: effectiveness, importance, and satisfaction.
The research questions (RQ1, RQ4) that relate to the satisfaction and perceptions of the
participants, as determined by responses using survey instruments, only involve those students
who were exposed to IWB, MIWB, or IWBAPP, with the exception of the satisfaction factor
of the perception of results surveys which also included NONE. The questions were designed
to require the participants to have interaction with one of the technologies. The questions
(RQ2, RQ3) that measure the impact of the technologies on learning were designed to
determine if there are any differences between the three technologies and will utilize the no-
technology application as a control.
Ethical Considerations
Protection of all identities of individuals, schools, and organizations are of primary
concern amongst the ethical considerations in this study. Pseudonyms are utilized for each
category described to ensure this protection. All identifying information in the data will be
either removed or replace with codes before analysis. When possible, identifying information
will be removed by the district prior to the researcher gathering the data. All participants will
have to sign statements of consent or assent explaining the purpose, procedures, and ethical

73
considerations of the study prior to its start. (See Appendices E - G) Participation in this study
will be completely voluntary in nature. All participants will be informed of their right to
withdraw at any time. All data will be secured and only accessible to the researcher. Physical
data will be stored in a lockable cabinet. Electronic data will be collected and stored in a
secure, password protected medium. No part of the study will be carried out until it is
approved in its entirety by the university and district IRBs.

74
CHAPTER FOUR: FINDINGS
The purpose of the study was to discover if there is sufficient statistical evidence to
support the decision to invest heavily in a technology and radically alter the teaching
environment by incorporating a classroom technology package with an IWB into all
classrooms within RVHS or Bayside Public Schools. This chapter will present the findings of
the data analyses performed on each of the four research questions and summarize the final
results.
Research Questions
The primary method utilized by Virginia school districts and the federal government to
measure student and school academic performance is the achievement of the state end-of-
course Standards of Learning (SOL). Additionally, Bayside Public Schools have utilized
citywide benchmark tests and midterm assessments to measure the progress in meeting the
state SOLs in a course. It has been suggested that a possible relationship existed between
RVHS’s improvement in student performance on the SOL test and the installation of IWBs
school wide. Therefore, the research will investigate whether there is a significant difference
in the ROI levels of measure (which include student achievement) between the classroom use
of IWB, MIWB, and IWBAPP technologies. In order to address this, the study will look at the
following research questions:
1. Is there any difference in the satisfaction level of the class participants dependent upon
their utilization of the IWB, MIWB, or IWBAPP?
2. Is there any difference in student achievement based on a pre- and post-test between
lessons taught with an IWB, MIWB, IWBAPP, or no IWB technology?
3. Is there any difference in the sustained impact of learning utilizing the technologies
between the IWB, MIWB, IWBAPP, or no IWB technology?
75
4. Is there any difference perceived by the students and faculty on the end of course results
between the IWB, MIWB, IWBAPP, or no IWB technology?
Hypotheses
1. Satisfaction levels of the class participants will be significantly different for a classroom
between an IWB, MIWB, or IWBAPP.
2. Student achievement levels between the pre- and post-test will be significantly different for
a classroom between an IWB, MIWB, IWBAPP, or no IWB technology.
3. Sustained impact of learning of the student will be significantly different for a classroom
between an IWB, MIWB, IWBAPP, or no IWB technology.
4. Perceived results by the class participants will be significantly different for a classroom
between an IWB, MIWB, IWBAPP, or no IWB technology.
Demographics
The participants of this study (student n = 111, faculty n = 4) are either enrolled in or
employed by RVHS in the BPS district in southeast Virginia. The average student participant
age was 15.5 (range 14 – 18) and average grade level was 10.1 (range 9 – 12). Gender
distribution was 48% male, 52% female. Student participant demographics were calculated
from data drawn from the BPS student database. Student participant racial demographics are
51% black or African American, 36% white, 5% Hispanic, 4% Asian, 3% two or more races,
and 2% Native Hawaiian or Pacific Islander. Student participants that are eligible for special
education benefits make up approximately 14% of the sample. Approximately 26% of student
participants are eligible for free and reduced lunches. Faculty participants are all female and
have average age of 35.8 (range 23 – 58). All hold master’s degrees. Three teachers identify
as white/Caucasian, one as African American. Average faculty experience teacher is 12.8
years (range 2 - 30) with an average of 13.8 semesters teaching Geometry (range 3 – 30).
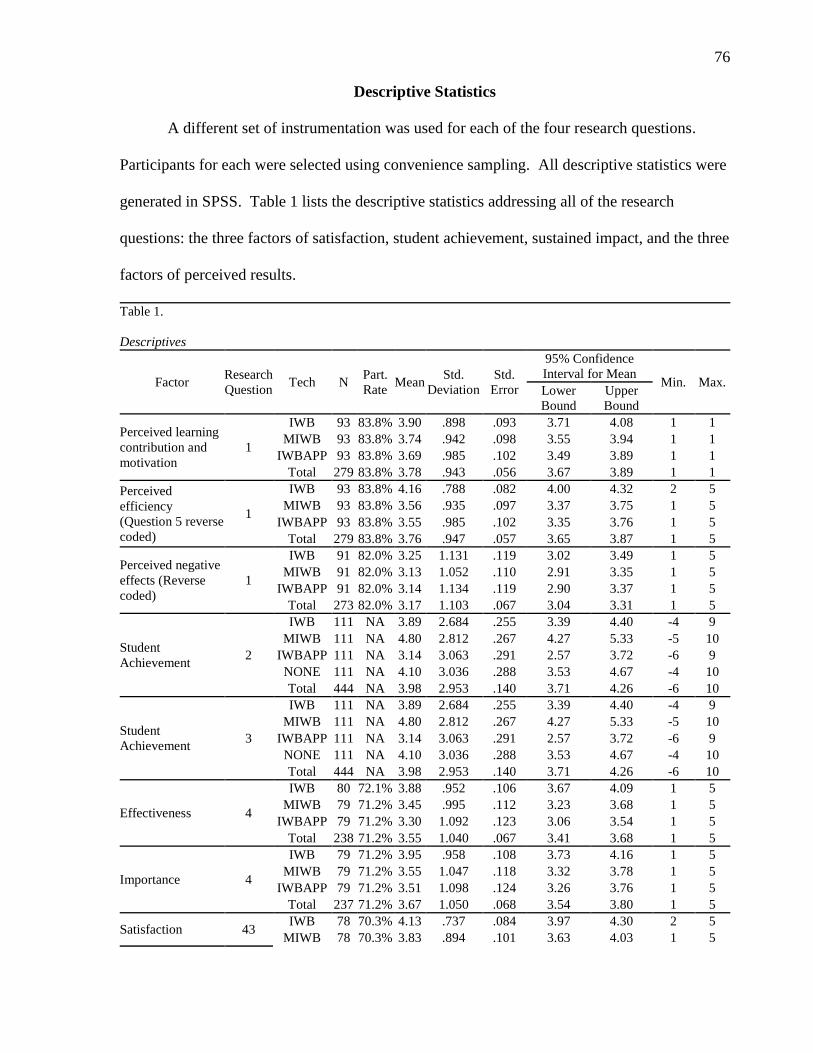
76
Descriptive Statistics
A different set of instrumentation was used for each of the four research questions.
Participants for each were selected using convenience sampling. All descriptive statistics were
generated in SPSS. Table 1 lists the descriptive statistics addressing all of the research
questions: the three factors of satisfaction, student achievement, sustained impact, and the three
factors of perceived results.
Table 1.
Descriptives
Factor Research
Question Tech N
Part.
Rate Mean
Std.
Deviation
Std.
Error
95% Confidence
Interval for Mean Min. Max.
Lower
Bound
Upper
Bound
Perceived learning
contribution and
motivation
1
IWB 93 83.8% 3.90 .898 .093 3.71 4.08 1 1
MIWB 93 83.8% 3.74 .942 .098 3.55 3.94 1 1
IWBAPP 93 83.8% 3.69 .985 .102 3.49 3.89 1 1
Total 279 83.8% 3.78 .943 .056 3.67 3.89 1 1
Perceived
efficiency
(Question 5 reverse
coded)
1
IWB 93 83.8% 4.16 .788 .082 4.00 4.32 2 5
MIWB 93 83.8% 3.56 .935 .097 3.37 3.75 1 5
IWBAPP 93 83.8% 3.55 .985 .102 3.35 3.76 1 5
Total 279 83.8% 3.76 .947 .057 3.65 3.87 1 5
Perceived negative
effects (Reverse
coded)
1
IWB 91 82.0% 3.25 1.131 .119 3.02 3.49 1 5
MIWB 91 82.0% 3.13 1.052 .110 2.91 3.35 1 5
IWBAPP 91 82.0% 3.14 1.134 .119 2.90 3.37 1 5
Total 273 82.0% 3.17 1.103 .067 3.04 3.31 1 5
Student
Achievement 2
IWB 111 NA 3.89 2.684 .255 3.39 4.40 -4 9
MIWB 111 NA 4.80 2.812 .267 4.27 5.33 -5 10
IWBAPP 111 NA 3.14 3.063 .291 2.57 3.72 -6 9
NONE 111 NA 4.10 3.036 .288 3.53 4.67 -4 10
Total 444 NA 3.98 2.953 .140 3.71 4.26 -6 10
Student
Achievement 3
IWB 111 NA 3.89 2.684 .255 3.39 4.40 -4 9
MIWB 111 NA 4.80 2.812 .267 4.27 5.33 -5 10
IWBAPP 111 NA 3.14 3.063 .291 2.57 3.72 -6 9
NONE 111 NA 4.10 3.036 .288 3.53 4.67 -4 10
Total 444 NA 3.98 2.953 .140 3.71 4.26 -6 10
Effectiveness 4
IWB 80 72.1% 3.88 .952 .106 3.67 4.09 1 5
MIWB 79 71.2% 3.45 .995 .112 3.23 3.68 1 5
IWBAPP 79 71.2% 3.30 1.092 .123 3.06 3.54 1 5
Total 238 71.2% 3.55 1.040 .067 3.41 3.68 1 5
Importance 4
IWB 79 71.2% 3.95 .958 .108 3.73 4.16 1 5
MIWB 79 71.2% 3.55 1.047 .118 3.32 3.78 1 5
IWBAPP 79 71.2% 3.51 1.098 .124 3.26 3.76 1 5
Total 237 71.2% 3.67 1.050 .068 3.54 3.80 1 5
Satisfaction 43 IWB 78 70.3% 4.13 .737 .084 3.97 4.30 2 5
MIWB 78 70.3% 3.83 .894 .101 3.63 4.03 1 5
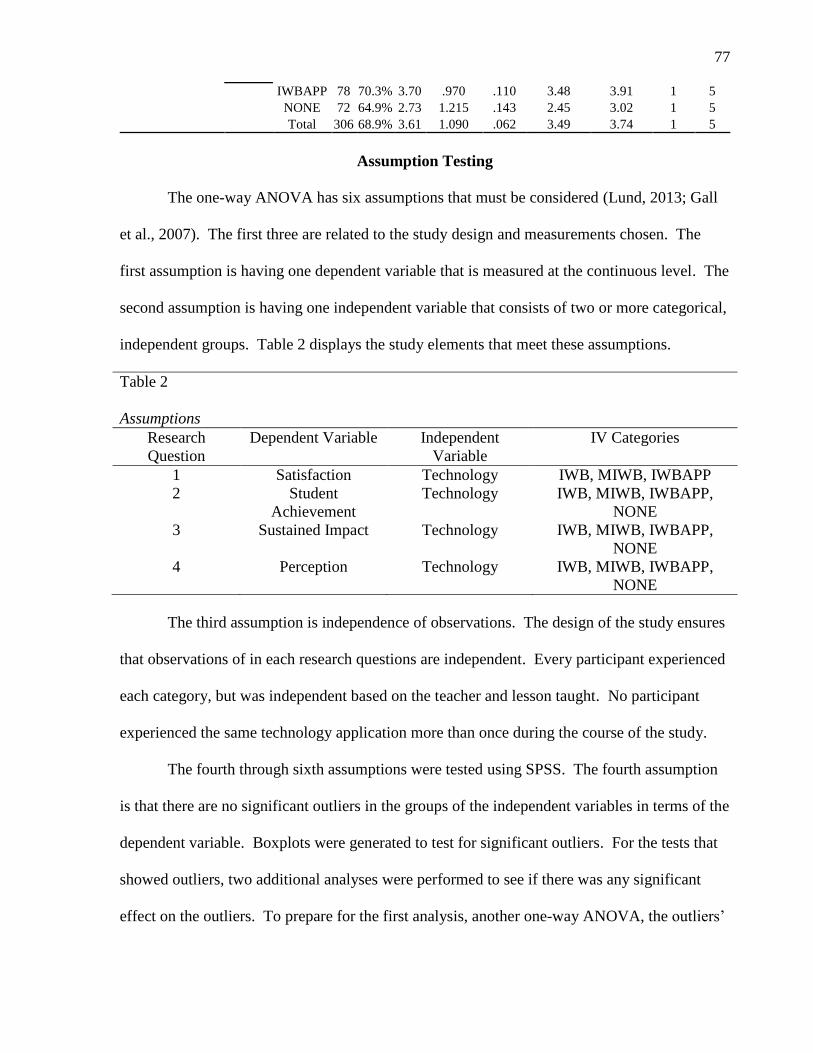
77
IWBAPP 78 70.3% 3.70 .970 .110 3.48 3.91 1 5
NONE 72 64.9% 2.73 1.215 .143 2.45 3.02 1 5
Total 306 68.9% 3.61 1.090 .062 3.49 3.74 1 5
Assumption Testing
The one-way ANOVA has six assumptions that must be considered (Lund, 2013; Gall
et al., 2007). The first three are related to the study design and measurements chosen. The
first assumption is having one dependent variable that is measured at the continuous level. The
second assumption is having one independent variable that consists of two or more categorical,
independent groups. Table 2 displays the study elements that meet these assumptions.
Table 2
Assumptions
Research
Question
Dependent Variable Independent
Variable
IV Categories
1 Satisfaction Technology IWB, MIWB, IWBAPP
2 Student
Achievement
Technology IWB, MIWB, IWBAPP,
NONE
3 Sustained Impact Technology IWB, MIWB, IWBAPP,
NONE
4 Perception Technology IWB, MIWB, IWBAPP,
NONE
The third assumption is independence of observations. The design of the study ensures
that observations of in each research questions are independent. Every participant experienced
each category, but was independent based on the teacher and lesson taught. No participant
experienced the same technology application more than once during the course of the study.
The fourth through sixth assumptions were tested using SPSS. The fourth assumption
is that there are no significant outliers in the groups of the independent variables in terms of the
dependent variable. Boxplots were generated to test for significant outliers. For the tests that
showed outliers, two additional analyses were performed to see if there was any significant
effect on the outliers. To prepare for the first analysis, another one-way ANOVA, the outliers’

78
values were modified slightly so that they matched the next closest value within the normal
range, yet maintaining their rank in relation to their values. (Ghosh & Vogt, 2012 as cited by
Lund, 2013). Next, as recommended by Lund 2013, a non-parametric Kruskill-Wallis H test
was performed on the original, unmodified data. The results of both tests, as shown below,
were used to determine that the outliers did not cause alter the outcomes of the findings.
The fifth assumption is that the dependent variable should be normally distributed for
each group of the independent variable. Normality for all groups was determined by visual
inspection of Q-Q plots.
The sixth assumption is having homogeneity of variances. The results of assumption
testing are listed by each research question in Table 3. All of the analyses revealed homogeneity
of variance with the exception of the perceived efficiency factor for research question 1 and the
satisfaction factor for research question 4 (p < .05). For the tests that showed a violation of
homogeneity of variance, a Welch’s ANOVA test was run, along with the Games-Howell post
hoc test (Lund, 2013). Those findings are found in the results section for each null hypothesis.
Table 3
Test of Homogeneity of Variances
Research Question / Factor Levene
Statistic df1 df2 Sig.
1
Perceived learning contribution and
motivation .397 2 276 .673
Perceived efficiency 3.162 2 276 .044
Perceived negative effects (Reverse
Coded) .353 2 270 .703
2 Student Achievement .456 3 440 .713
3 Sustained Impact .675 3 440 .568
4
Effectiveness .793 2 235 .454
Importance .718 2 234 .489
Satisfaction 10.583 3 302 .000
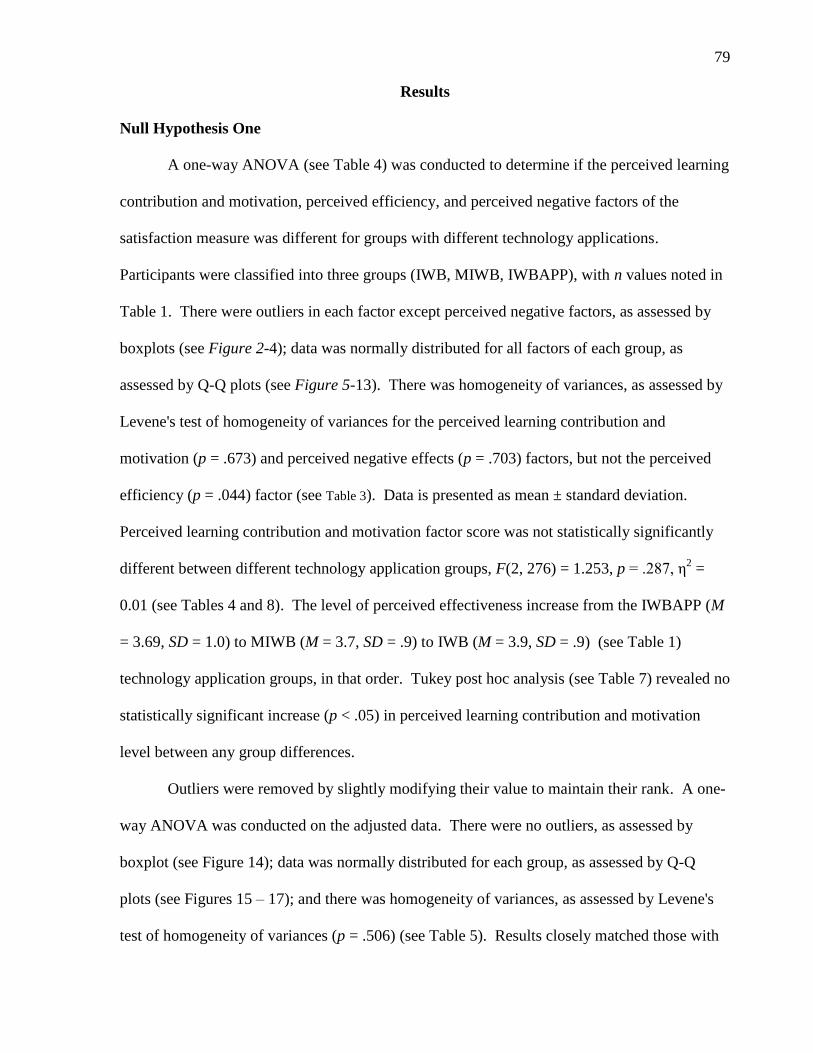
79
Results
Null Hypothesis One
A one-way ANOVA (see Table 4) was conducted to determine if the perceived learning
contribution and motivation, perceived efficiency, and perceived negative factors of the
satisfaction measure was different for groups with different technology applications.
Participants were classified into three groups (IWB, MIWB, IWBAPP), with n values noted in
Table 1. There were outliers in each factor except perceived negative factors, as assessed by
boxplots (see Figure 2-4); data was normally distributed for all factors of each group, as
assessed by Q-Q plots (see Figure 5-13). There was homogeneity of variances, as assessed by
Levene's test of homogeneity of variances for the perceived learning contribution and
motivation (p = .673) and perceived negative effects (p = .703) factors, but not the perceived
efficiency (p = .044) factor (see Table 3). Data is presented as mean ± standard deviation.
Perceived learning contribution and motivation factor score was not statistically significantly
different between different technology application groups, F(2, 276) = 1.253, p = .287, η2 =
0.01 (see Tables 4 and 8). The level of perceived effectiveness increase from the IWBAPP (M
= 3.69, SD = 1.0) to MIWB (M = 3.7, SD = .9) to IWB (M = 3.9, SD = .9) (see Table 1)
technology application groups, in that order. Tukey post hoc analysis (see Table 7) revealed no
statistically significant increase (p < .05) in perceived learning contribution and motivation
level between any group differences.
Outliers were removed by slightly modifying their value to maintain their rank. A one-
way ANOVA was conducted on the adjusted data. There were no outliers, as assessed by
boxplot (see Figure 14); data was normally distributed for each group, as assessed by Q-Q
plots (see Figures 15 – 17); and there was homogeneity of variances, as assessed by Levene's
test of homogeneity of variances (p = .506) (see Table 5). Results closely matched those with

80
outliers in that perceived learning contribution and motivation level was not statistically
significantly different between different technology application groups, F(2, 276) = 1.571, p =
.210, η2 = 0.11 (see Tables 4 and 8). The level of perceived learning contribution and
motivation increase from the IWBAPP (M = 3.7, SD = .9) to MIWB (M = 3.8, SD = .9) to IWB
(M = 3.9, SD = .8) technology application groups, in that order. Tukey post hoc analysis (see
Table 7) revealed no statistically significant increase (p < .05) in perceived learning
contribution and motivation factor level between any group differences.
Perceived efficiency factor score contains one question (5) that was reverse coded to
accommodate the negative statement (Gall et al. 2007, Lund 2013). This factor was
statistically significantly different between different technology application groups, Welch's
F(2, 15.576) = 182.196, p < .0005, η2 = 0.01 (see Tables 6 and 8). The level of perceived
efficiency increased from the IWBAPP (M = 3.6, SD = 1.0) to MIWB (M = 3.6, SD = 1.0) to
IWB (M = 4.2, SD = .8) (see Table 1) technology application groups, in that order. Games-
Howell post hoc analysis (see Table 7) revealed that the mean increase from IWBAPP to IWB
(.6, 95% CI[.3, .9, p < .0005) was statistically significant, as well as the increase from the
MIWB to IWB (.6, 95% CI[.3,.9], p < .0005) groups. No other group differences were
statistically significant. The effect size was small (see Table 8).
Outliers were removed by slightly modifying their value to maintain their rank. A one-
way ANOVA was conducted on the adjusted data. There were no outliers, as assessed by
boxplot (see Figure 18); data was normally distributed for each group, as assessed by Q-Q
plots (see Figures 19-21); and there was not homogeneity of variances (Table 5), as assessed
by Levene's test of homogeneity of variances (p = .014). Results closely matched those with
outliers in that importance level was statistically significantly different between different
technology application groups, Welch's F(2, 18.164) = 181.337, p < .0005, η2 = .01 (see

81
Tables 6 and 8). The level of perceived efficiency increase from the IWBAPP (M = 3.6, SD =
.9) to MIWB (M = 3.6, SD = .9) to IWB (M = 4.2, SD = .7) technology application groups, in
that order. Games-Howell post hoc analysis (see Table 7) revealed that the mean increase from
IWBAPP to IWB (.6, 95% CI[.3, .9], p < .0005) was statistically significant, as well as the
increase from the MIWB to IWB (.6, 95% CI[.3,.9], p < .0005) groups. No other group
differences were statistically significant. The effect size was small (see Table 8).
Perceived negative effects factor score questions were reverse coded to accommodate
the negatively scaled items (Gall et al. 2007, Lund 2013). There was not a statistically
significantly different between different technology application groups, F(2, 270) = .341, p =
.711, η2 = 0.04 (see Tables 4 and 8). The level of perceived negative effects increased from
the MIWB (M = 3.1, SD = 1.1) to IWBAPP (M = 3.1, SD = 1.1) to IWB (M = 3.2, SD = 1.1)
(see Table 1) technology application groups, in that order. Tukey post hoc analysis (see Table
7) revealed no group differences that were statistically significant.
As there were outliers in the original data, a non-parametric test, Kruskal-Wallis H, was
run to determine if there were differences in perceived learning contribution and motivation
and perceived efficiency factor levels between three groups of participants with different
technology applications. Distributions of were similar for all groups, as assessed by visual
inspection of a boxplot (see Figures 22 – 23). The distributions of all factors demonstrated that
there were statistically significantly different between perceived efficiency groups, (χ2(2) =
27.176, p < .0005) but not perceived learning contribution and motivation (χ2(2) = 2.770, p =
.250) (see Tables 9 – 10). Subsequently, pairwise comparisons on perceived efficiency were
performed using Dunn's (1964) procedure with a Bonferroni correction for multiple
comparisons. Statistical significance was accepted at the p < .0167 level. The post hoc
analysis revealed statistically significant differences in satisfaction scores between the

82
IWBAPP (Mdn = 3.6) and IWB (Mdn = 4.2) (p < .0005) groups, and MIWB (Mdn = 3.5) and
IWB (p < .0005) groups, but not between any other groups (see Figure 24 and Tables 11 – 12).
The group means for the perceived efficiency factor were statistically significantly
different; therefore we can reject the null hypothesis and accept the alternative hypothesis.
Table 4
ANOVA Results for Level 1 Measure
Sum of
Squares df
Mean
Square F Sig.
Perceived learning contribution and motivation
Between
Groups 2.226 2 1.113 1.253 .287
Within
Groups 245.118 276 .888
Total 247.345 278
Perceived negative effects (Reverse Coded)
Between
Groups .834 2 .417 .341 .711
Within
Groups 330.343 270 1.223
Total 331.177 272
Perceived learning contribution and motivation
minus outliers
Between
Groups 2.406 2 1.203 1.571 .210
Within
Groups 211.343 276 .766
Total 213.748 278
Table 5
Test of Homogeneity of Variances minus outliers
Levene Statistic df1 df2 Sig.
Perceived learning contribution and motivation minus outliers .682 2 276 .506
Perceived efficiency minus outliers 4.306 2 276 .014
Table 6
Robust Tests of Equality of Means for Level 1 Measure
Statistica df1 df2 Sig.
Perceived efficiency (Question 5 reverse coded) Welch 15.576 2 182.196 .000
Perceived efficiency minus outliers (Question 5
reverse coded) Welch 18.164 2 181.337 .000
a. Asymptotically F distributed.

83
Table 7
Multiple Comparisons for Level 1 Measure
Dependent Variable (I)
Technology
(J)
Technology
Mean
Difference (I-
J)
Std.
Error Sig.
95% Confidence
Interval
Lower
Bound
Upper
Bound
Perceived learning
contribution and motivation
Tukey
HSD
IWB MIWB .157 .138 .493 -.17 .48
IWBAPP .211 .138 .282 -.12 .54
MIWB IWB -.157 .138 .493 -.48 .17
IWBAPP .054 .138 .920 -.27 .38
IWBAPP IWB -.211 .138 .282 -.54 .12
MIWB -.054 .138 .920 -.38 .27
Perceived efficiency (Question
5 reverse coded)
Games-
Howell
IWB MIWB .599
* .127 .000 .30 .90
IWBAPP .607* .131 .000 .30 .92
MIWB IWB -.599
* .127 .000 -.90 -.30
IWBAPP .008 .141 .998 -.32 .34
IWBAPP IWB -.607
* .131 .000 -.92 -.30
MIWB -.008 .141 .998 -.34 .32
Perceived negative effects
(reverse coded)
Tukey
HSD
IWB MIWB .119 .164 .748 -.27 .51
IWBAPP .115 .164 .762 -.27 .50
MIWB IWB -.119 .164 .748 -.51 .27
IWBAPP -.004 .164 1.000 -.39 .38
IWBAPP IWB -.115 .164 .762 -.50 .27
MIWB .004 .164 1.000 -.38 .39
Perceived learning
contribution and motivation
minus outliers
Tukey
HSD
IWB MIWB .171 .128 .379 -.13 .47
IWBAPP .215 .128 .215 -.09 .52
MIWB IWB -.171 .128 .379 -.47 .13
IWBAPP .045 .128 .936 -.26 .35
IWBAPP IWB -.215 .128 .215 -.52 .09
MIWB -.045 .128 .936 -.35 .26
Perceived efficiency minus
outliers (Question 5 reverse
coded)
Games-
Howell
IWB MIWB .610
* .120 .000 .33 .89
IWBAPP .613* .124 .000 .32 .91
MIWB IWB -.610
* .120 .000 -.89 -.33
IWBAPP .003 .135 1.000 -.32 .32
IWBAPP IWB -.613
* .124 .000 -.91 -.32
MIWB -.003 .135 1.000 -.32 .32
*. The mean difference is significant at the 0.05 level.
Table 8
Tests of Between-Subjects Effects for Level 1 Measures
Dependent Variable Source Type III Sum
of Squares df
Mean
Square F Sig.
Partial Eta
Squared
Perceived learning contribution and
motivation Tech 2.406 2 1.203 1.571 .210
.011
Perceived learning contribution and
motivation minus outliers Tech 2.406 2 1.203 1.571 .210 .011
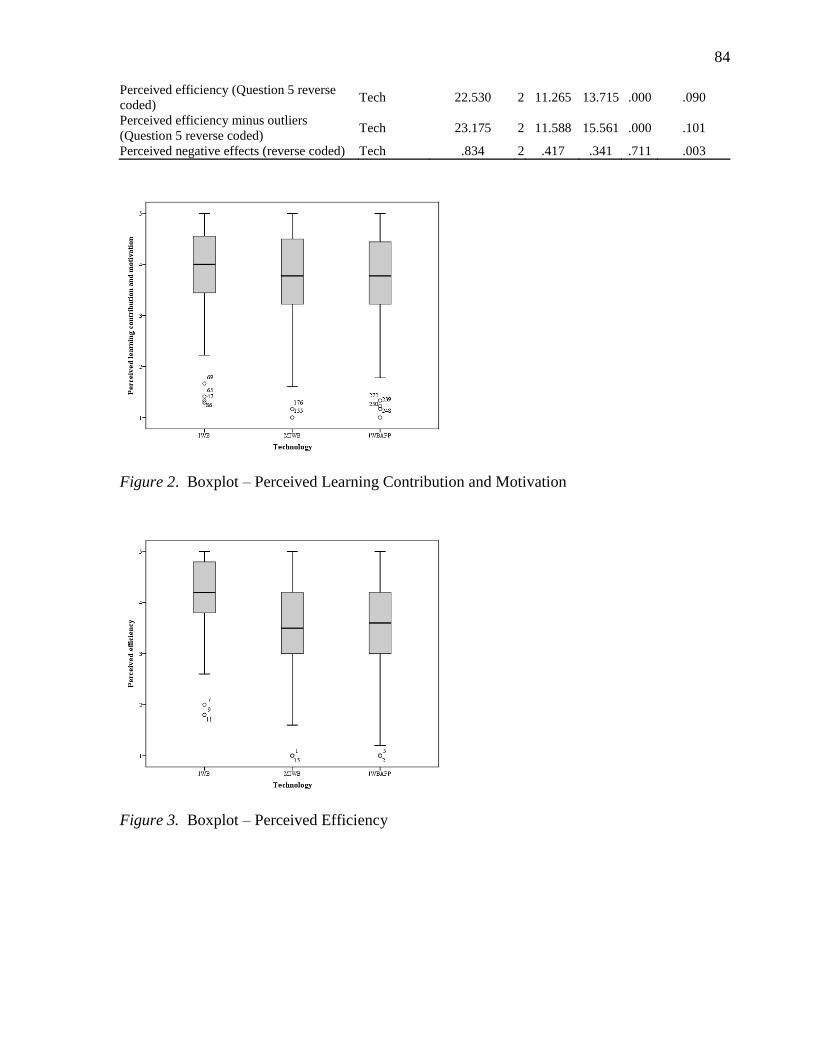
84
Perceived efficiency (Question 5 reverse
coded) Tech 22.530 2 11.265 13.715 .000 .090
Perceived efficiency minus outliers
(Question 5 reverse coded) Tech 23.175 2 11.588 15.561 .000 .101
Perceived negative effects (reverse coded) Tech .834 2 .417 .341 .711 .003
Figure 2. Boxplot – Perceived Learning Contribution and Motivation
Figure 3. Boxplot – Perceived Efficiency
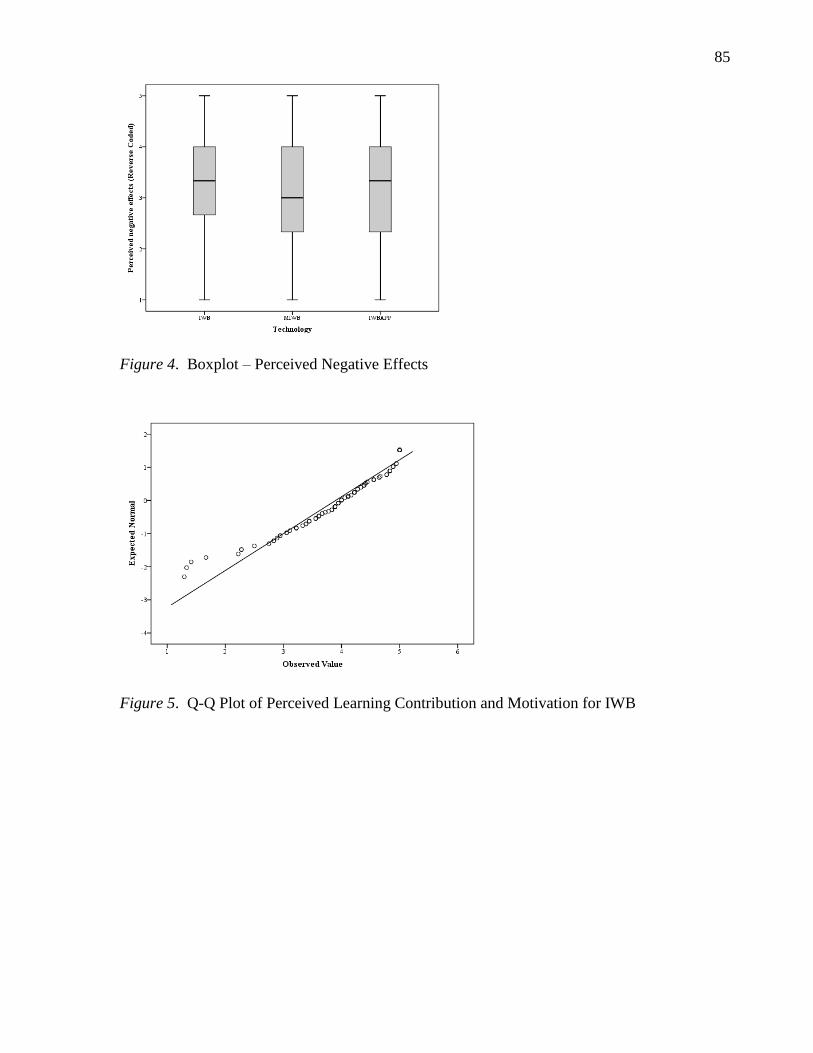
85
Figure 4. Boxplot – Perceived Negative Effects
Figure 5. Q-Q Plot of Perceived Learning Contribution and Motivation for IWB

86
Figure 6. Q-Q Plot of Perceived Learning Contribution and Motivation for MIWB
Figure 7. Q-Q Plot of Perceived Learning Contribution and Motivation for IWBAPP

87
Figure 8. Q-Q Plot of Perceived Efficiency for IWB
Figure 9. Q-Q Plot of Perceived Efficiency for MIWB

88
Figure 10. Q-Q Plot of Perceived Efficiency for IWBAPP
Figure 11. Q-Q Plot of Perceived Negative Effects for IWB
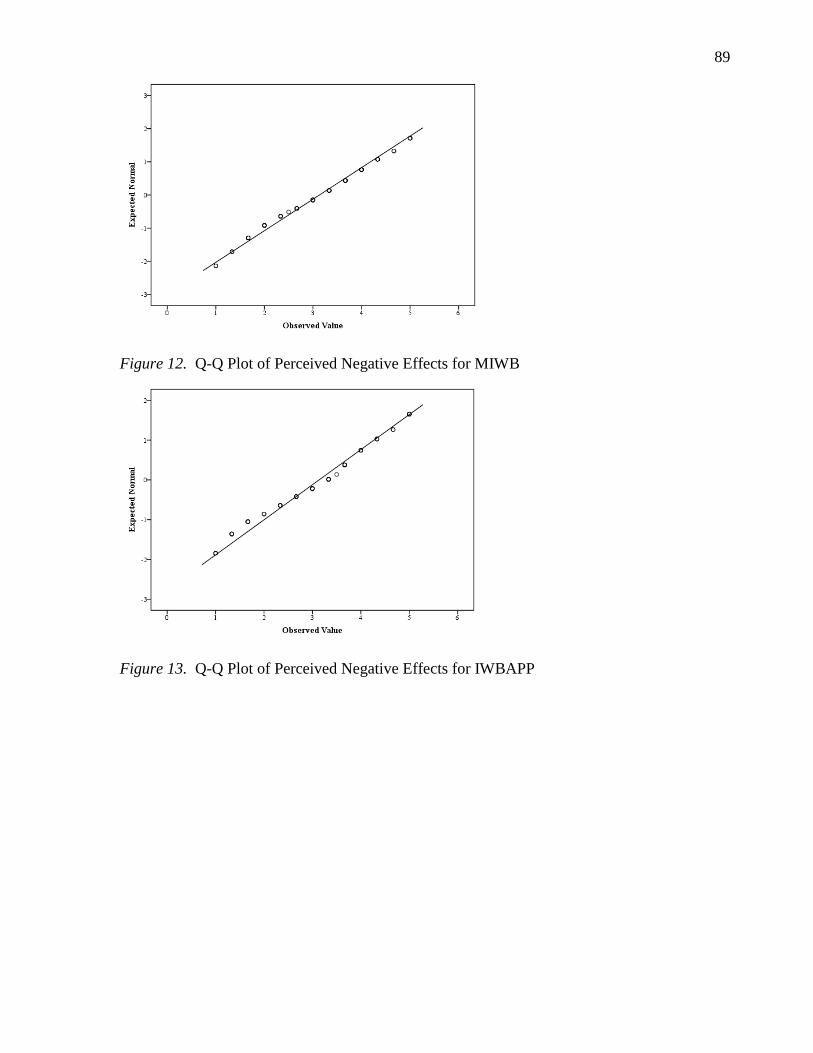
89
Figure 12. Q-Q Plot of Perceived Negative Effects for MIWB
Figure 13. Q-Q Plot of Perceived Negative Effects for IWBAPP
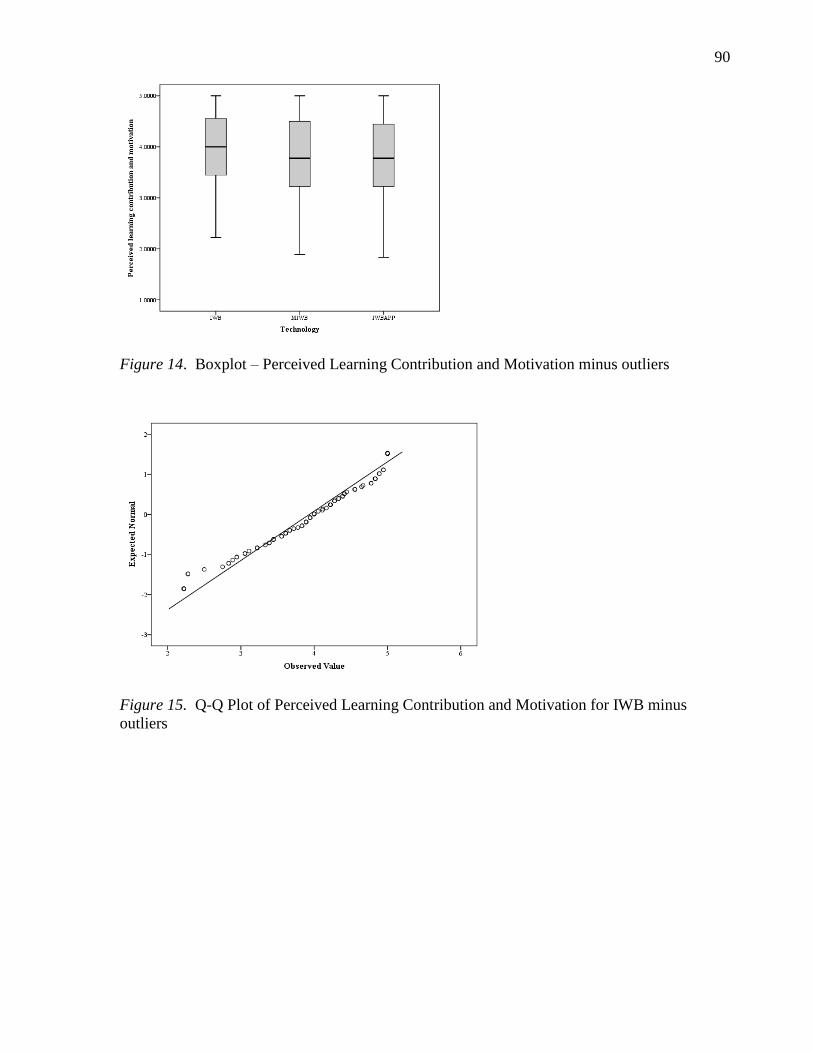
90
Figure 14. Boxplot – Perceived Learning Contribution and Motivation minus outliers
Figure 15. Q-Q Plot of Perceived Learning Contribution and Motivation for IWB minus
outliers

91
Figure 16. Q-Q Plot of Perceived Learning Contribution and Motivation for MIWB minus
outliers
Figure 17. Q-Q Plot of Perceived Learning Contribution and Motivation for IWBAPP minus
outliers
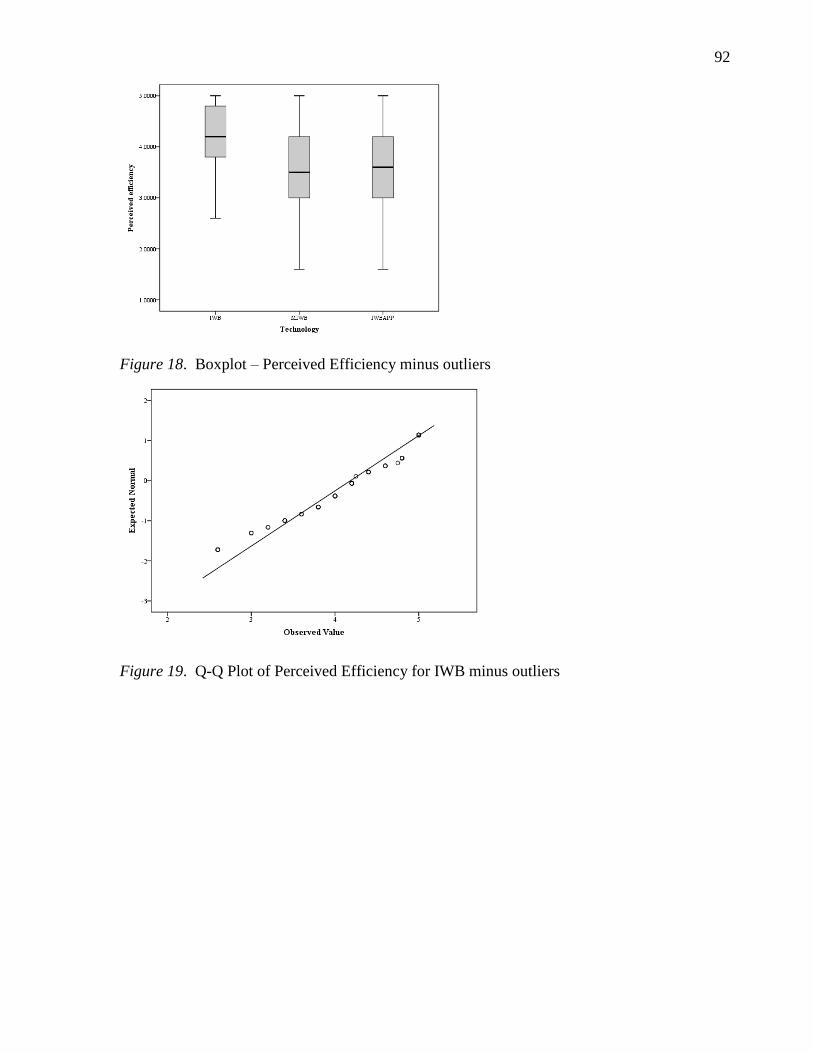
92
Figure 18. Boxplot – Perceived Efficiency minus outliers
Figure 19. Q-Q Plot of Perceived Efficiency for IWB minus outliers

93
Figure 20. Q-Q Plot of Perceived Efficiency for MIWB minus outliers
Figure 21. Q-Q Plot of Perceived Efficiency for IWBAPP minus outliers
Table 9
Hypothesis Test Summary for Level 1 Measures
Null Hypothesis Test Sig Decision
1 The distribution of Perceived Learning
Contribution and Motivation Factor is the
same across categories of technology
Independent
Samples Kruskal-
Wallis Test
.000 Reject the null
hypothesis
2 The distribution of Perceived Efficiency
factor is the same across categories of
technology
Independent
Samples Kruskal-
Wallis Test
.250 Retain the null
hypothesis
Asymptotic significances are displayed. The significance level is .05.

94
Figure 22. Independent Samples Kruskal-Wallis Test for Perceived Learning Contribution and
Motivation
Figure 23. Independent Samples Kruskal-Wallis Test for Perceived Efficiency
Table 10
Independent Samples Kruskal-Wallis Test for Level 1 Measures
Factor Total N Test Statistic Degrees of
Freedom
Asymptotic Sig. (2
Sided Test)
Perceived Learning Contribution 279 2.770 2 .250
Perceived Efficiency 279 27.176 2 .000
1. The test statistic is adjusted for ties
2. Multiple comparisons for Perceived Learning Contribution are not performed because the
overall test does not show significant differences across samples.

95
Figure 24. Pairwise Comparisons of Technology for Perceived Efficiency
Table 11
Pairwise Comparisons of Technology for Perceived Efficiency
Factor Sample 1 – Sample 2 Test Statistic Std. Error Std. Test Statistic Sig. Adj. Sig.
Perceived Efficiency
MIWB-IWBAPP -2.156 11.792 -.183 .855 1.000
MIWB-IWB 54.349 11.793 4.609 .000 .000
IWBAPP-IWB 52.054 11.793 4.414 .000 .000
Each row tests the null hypothesis that the Sample 1 and Sample 2 distributions are the same.
Asymptotic significances (2-sided tests) are displayed. The significance level is .05
Table 12
Medians - Perceived efficiency
Technology Median N
IWB 4.20 93
MIWB 3.50 93
IWBAPP 3.60 93
Total 3.80 279
Null Hypothesis Two
A one-way ANOVA was conducted to determine if the student achievement level was
different for groups with different technology applications. Data were classified into four
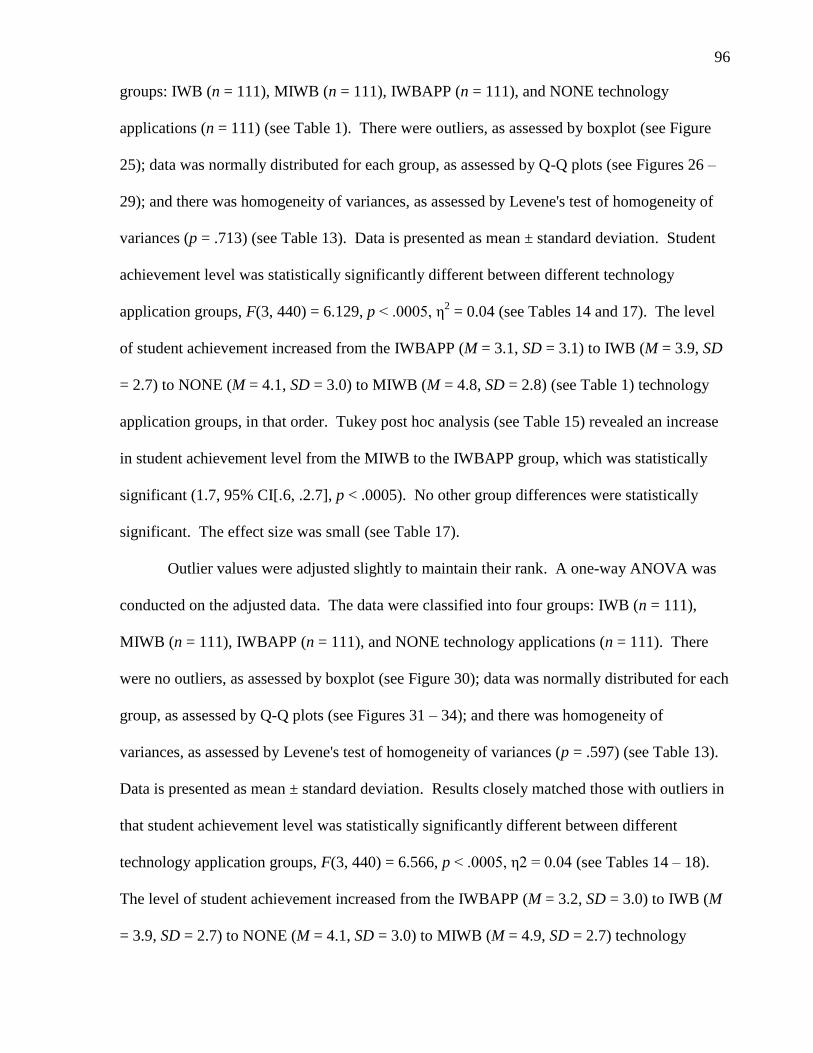
96
groups: IWB (n = 111), MIWB (n = 111), IWBAPP (n = 111), and NONE technology
applications (n = 111) (see Table 1). There were outliers, as assessed by boxplot (see Figure
25); data was normally distributed for each group, as assessed by Q-Q plots (see Figures 26 –
29); and there was homogeneity of variances, as assessed by Levene's test of homogeneity of
variances (p = .713) (see Table 13). Data is presented as mean ± standard deviation. Student
achievement level was statistically significantly different between different technology
application groups, F(3, 440) = 6.129, p < .0005, η2 = 0.04 (see Tables 14 and 17). The level
of student achievement increased from the IWBAPP (M = 3.1, SD = 3.1) to IWB (M = 3.9, SD
= 2.7) to NONE (M = 4.1, SD = 3.0) to MIWB (M = 4.8, SD = 2.8) (see Table 1) technology
application groups, in that order. Tukey post hoc analysis (see Table 15) revealed an increase
in student achievement level from the MIWB to the IWBAPP group, which was statistically
significant (1.7, 95% CI[.6, .2.7], p < .0005). No other group differences were statistically
significant. The effect size was small (see Table 17).
Outlier values were adjusted slightly to maintain their rank. A one-way ANOVA was
conducted on the adjusted data. The data were classified into four groups: IWB (n = 111),
MIWB (n = 111), IWBAPP (n = 111), and NONE technology applications (n = 111). There
were no outliers, as assessed by boxplot (see Figure 30); data was normally distributed for each
group, as assessed by Q-Q plots (see Figures 31 – 34); and there was homogeneity of
variances, as assessed by Levene's test of homogeneity of variances (p = .597) (see Table 13).
Data is presented as mean ± standard deviation. Results closely matched those with outliers in
that student achievement level was statistically significantly different between different
technology application groups, F(3, 440) = 6.566, p < .0005, η2 = 0.04 (see Tables 14 – 18).
The level of student achievement increased from the IWBAPP (M = 3.2, SD = 3.0) to IWB (M
= 3.9, SD = 2.7) to NONE (M = 4.1, SD = 3.0) to MIWB (M = 4.9, SD = 2.7) technology

97
application groups, in that order. Tukey post hoc analysis (see Table 16) revealed an increase
in student achievement level from the MIWB to the IWBAPP group, which was statistically
significant (1.7, 95% CI[.7, 2.7], p < .0005). No other group differences were statistically
significant. The effect size was small (see Table 18).
As there were outliers in the original data, a Kruskal-Wallis H test was run to determine
if there were differences in student achievement levels between three groups of participants
with different technology applications. Distributions of student achievement scores were not
similar for all groups, as assessed by visual inspection of a boxplot (see Figure 35). The
distributions of effectiveness scores score were statistically significantly different between
groups, χ2(3) = 18.190, p < .0005 (See Tables 19 – 20). Subsequently, pairwise comparisons
were performed using Dunn's (1964) procedure with a Bonferroni correction for multiple
comparisons. Statistical significance was accepted at the p < .0083 level. This post hoc
analysis revealed statistically significant differences in student achievement scores between the
IWBAPP (Mdn = 4.0) and MIWB (Mdn = 3.0) (p < .0005), but not between any other groups
(See Figure 36 and Tables 21 – 22).
The group means were statistically significantly different in all tests (p < .0005) and,
therefore, we can reject the null hypothesis and accept the alternative hypothesis.
Table 13
Test of Homogeneity of Variances Student Achievement minus outliers
Levene Statistic df1 df2 Sig.
Student Achievement .456 3 440 .713
Student Achievement minus outliers .628 3 440 .597
Table 14
ANOVA for Level 2 Measure
Sum of Squares df Mean Square F Sig.
Student Achievement Between Groups 154.944 3 51.648 6.129 .000
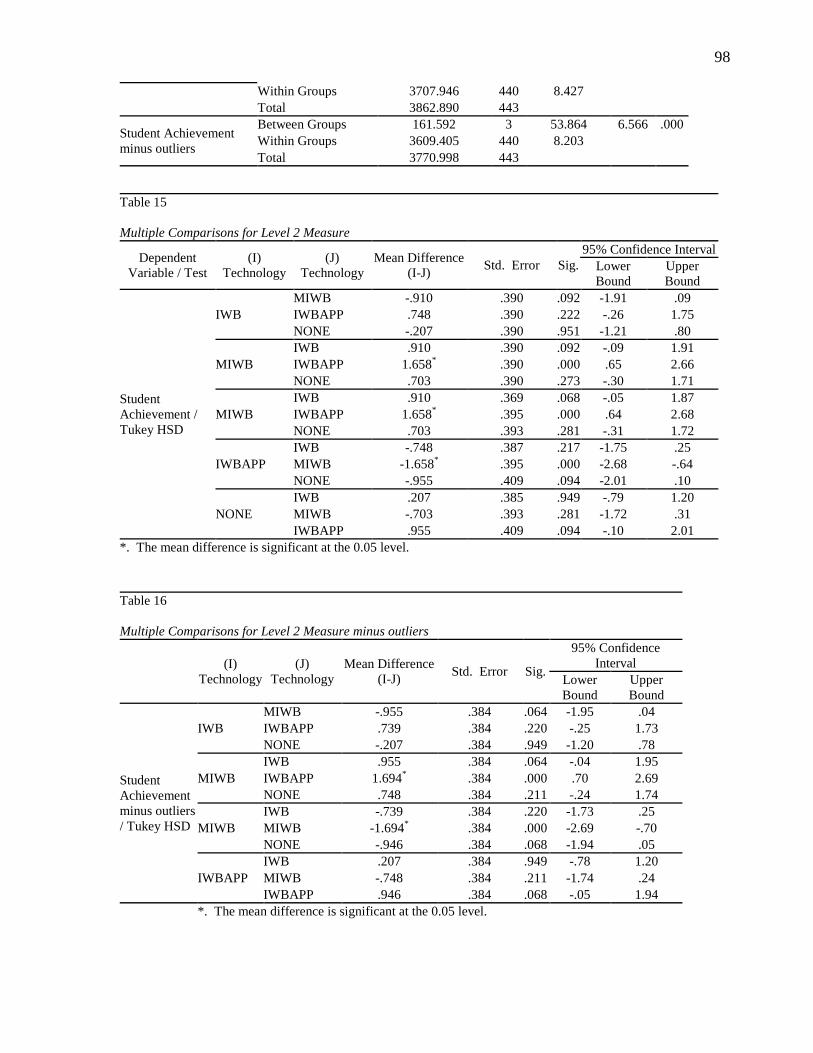
98
Within Groups 3707.946 440 8.427
Total 3862.890 443
Student Achievement
minus outliers
Between Groups 161.592 3 53.864 6.566 .000
Within Groups 3609.405 440 8.203
Total 3770.998 443
Table 15
Multiple Comparisons for Level 2 Measure
Dependent
Variable / Test
(I)
Technology
(J)
Technology
Mean Difference
(I-J) Std. Error Sig.
95% Confidence Interval
Lower
Bound
Upper
Bound
Student
Achievement /
Tukey HSD
IWB
MIWB -.910 .390 .092 -1.91 .09
IWBAPP .748 .390 .222 -.26 1.75
NONE -.207 .390 .951 -1.21 .80
MIWB
IWB .910 .390 .092 -.09 1.91
IWBAPP 1.658* .390 .000 .65 2.66
NONE .703 .390 .273 -.30 1.71
MIWB
IWB .910 .369 .068 -.05 1.87
IWBAPP 1.658* .395 .000 .64 2.68
NONE .703 .393 .281 -.31 1.72
IWBAPP
IWB -.748 .387 .217 -1.75 .25
MIWB -1.658* .395 .000 -2.68 -.64
NONE -.955 .409 .094 -2.01 .10
NONE
IWB .207 .385 .949 -.79 1.20
MIWB -.703 .393 .281 -1.72 .31
IWBAPP .955 .409 .094 -.10 2.01
*. The mean difference is significant at the 0.05 level.
Table 16
Multiple Comparisons for Level 2 Measure minus outliers
(I)
Technology
(J)
Technology
Mean Difference
(I-J) Std. Error Sig.
95% Confidence
Interval
Lower
Bound
Upper
Bound
Student
Achievement
minus outliers
/ Tukey HSD
IWB
MIWB -.955 .384 .064 -1.95 .04
IWBAPP .739 .384 .220 -.25 1.73
NONE -.207 .384 .949 -1.20 .78
MIWB
IWB .955 .384 .064 -.04 1.95
IWBAPP 1.694* .384 .000 .70 2.69
NONE .748 .384 .211 -.24 1.74
MIWB
IWB -.739 .384 .220 -1.73 .25
MIWB -1.694* .384 .000 -2.69 -.70
NONE -.946 .384 .068 -1.94 .05
IWBAPP
IWB .207 .384 .949 -.78 1.20
MIWB -.748 .384 .211 -1.74 .24
IWBAPP .946 .384 .068 -.05 1.94
*. The mean difference is significant at the 0.05 level.

99
Table 17
Tests of Between-Subjects Effects for Level 2 Measure
Dependent Variable: Student Achievement
Source Type III Sum of
Squares df Mean Square F Sig.
Partial Eta
Squared
Corrected Model 154.944a 3 51.648 6.129 .000 .040
Intercept 7048.110 1 7048.110 836.358 .000 .655
Group 154.944 3 51.648 6.129 .000 .040
Error 3707.946 440 8.427
Total 10911.000 444
Corrected Total 3862.890 443
a. R Squared = .040 (Adjusted R Squared = .034)
Table 18
Tests of Between-Subjects Effects for Level 2 Measure minus outliers
Dependent Variable: Student Achievement minus outliers
Source Type III Sum of
Squares df Mean Square F Sig.
Partial Eta
Squared
Corrected Model 161.592a 3 53.864 6.566 .000 .043
Intercept 7096.002 1 7096.002 865.029 .000 .663
Group 161.592 3 53.864 6.566 .000 .043
Error 3609.405 440 8.203
Total 10867.000 444
Corrected Total 3770.998 443
a. R Squared = .043 (Adjusted R Squared = .036)
Figure 25. Boxplot – Student Achievement
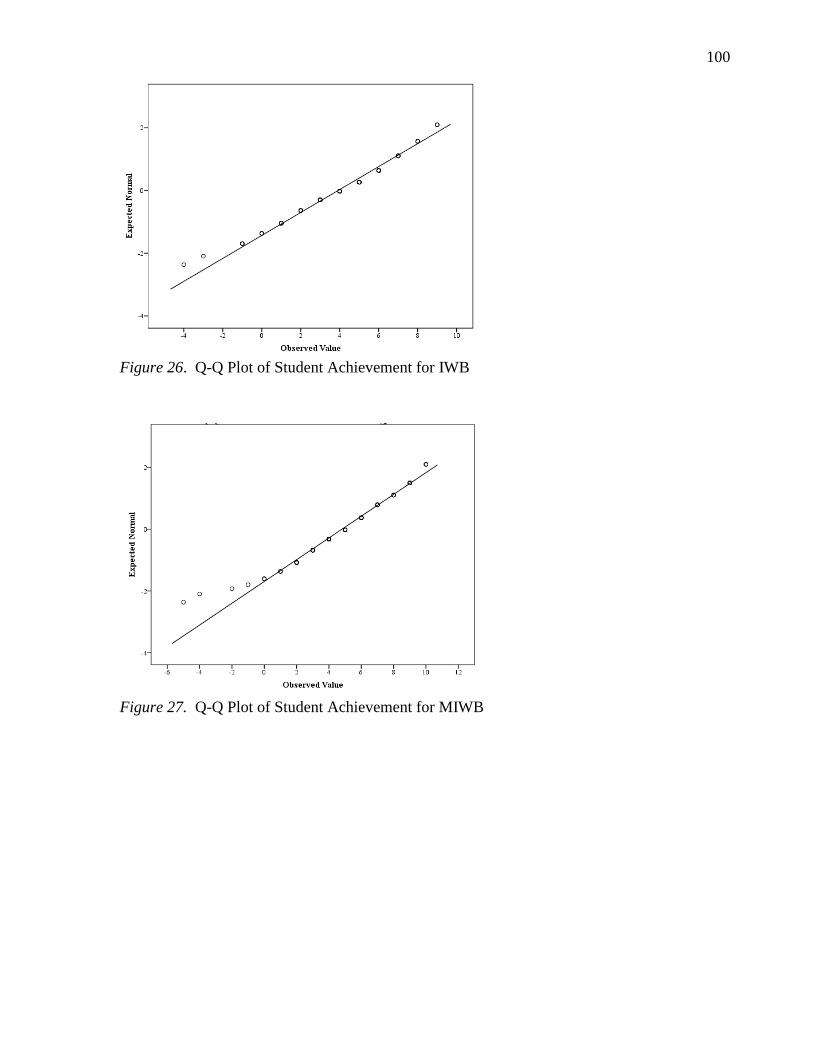
100
Figure 26. Q-Q Plot of Student Achievement for IWB
Figure 27. Q-Q Plot of Student Achievement for MIWB

101
Figure 28. Q-Q Plot of Student Achievement for IWBAPP
Figure 29. Q-Q Plot of Student Achievement for NONE

102
Figure 30. Boxplot – Student Achievement minus outliers
Figure 31. Q-Q Plot of Student Achievement for IWB minus outliers

103
Figure 32. Q-Q Plot of Student Achievement for MIWB minus outliers
Figure 33. Q-Q Plot of Student Achievement for IWBAPP minus outliers

104
Figure 34. Q-Q Plot of Student Achievement for NONE minus outliers
Table 19
Hypothesis Test Summary for Level 2 Measure
Null Hypothesis Test Sig Decision
1 The distribution of Student
Achievement is the same across
categories of technology
Independent Samples
Kruskal-Wallis Test
.000 Reject the null
hypothesis
Asymptotic significances are displayed. The significance level is .05.
Figure 35. Independent Samples Kruskal-Wallis Test for Student Achievement
Table 20
Independent Samples Kruskal-Wallis Test for Student
Achievement
Total N Test Statistic Degrees of
Freedom
Asymptotic Sig. (2
Sided Test)
444 18.190 3 .000
1. The test statistic is adjusted for ties
105
Figure 36. Pairwise Comparisons of Technology for Student Achievement
Table 21
Pairwise Comparisons of Technology for Student Achievement
Sample 1 – Sample 2 Test Statistic Std. Error Std. Test Statistic Sig. Adj. Sig.
IWBAPP-IWB 29.838 17.127 1.742 .081 .489
IWBAPP-NONE -44.315 17.127 -2.588 .010 .058
IWBAPP-MIWB 71.559 17.127 4.179 .000 .000
IWB-NONE -14.477 17.127 -.845 .398 1.000
IWB-MIWB -41.721 17.127 -2.436 .015 .089
NONE-MIWB 27.243 17.127 1.591 .112 .670
Each row tests the null hypothesis that the Sample 1 and Sample 2 distributions are the same.
Asymptotic significances (2-sided tests) are displayed. The significance level is .05
Table 22
Medians – Student Achievement
Technology Median N
IWB 4.00 111
MIWB 5.00 111
IWBAPP 3.00 111
NONE 5.00 111
Total 4.00 444
Null Hypothesis Three
A one-way ANOVA was conducted to determine if the sustained impact level was
different for groups with different technology applications. Data were classified into four
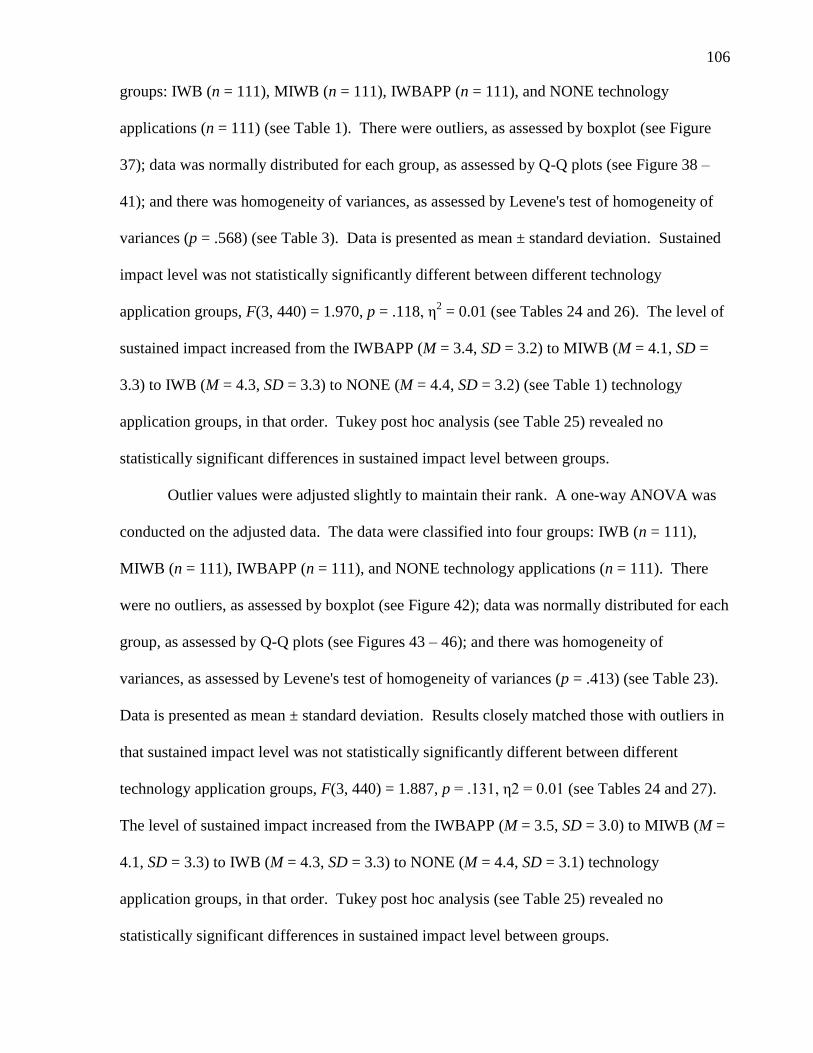
106
groups: IWB (n = 111), MIWB (n = 111), IWBAPP (n = 111), and NONE technology
applications (n = 111) (see Table 1). There were outliers, as assessed by boxplot (see Figure
37); data was normally distributed for each group, as assessed by Q-Q plots (see Figure 38 –
41); and there was homogeneity of variances, as assessed by Levene's test of homogeneity of
variances (p = .568) (see Table 3). Data is presented as mean ± standard deviation. Sustained
impact level was not statistically significantly different between different technology
application groups, F(3, 440) = 1.970, p = .118, η2 = 0.01 (see Tables 24 and 26). The level of
sustained impact increased from the IWBAPP (M = 3.4, SD = 3.2) to MIWB (M = 4.1, SD =
3.3) to IWB (M = 4.3, SD = 3.3) to NONE (M = 4.4, SD = 3.2) (see Table 1) technology
application groups, in that order. Tukey post hoc analysis (see Table 25) revealed no
statistically significant differences in sustained impact level between groups.
Outlier values were adjusted slightly to maintain their rank. A one-way ANOVA was
conducted on the adjusted data. The data were classified into four groups: IWB (n = 111),
MIWB (n = 111), IWBAPP (n = 111), and NONE technology applications (n = 111). There
were no outliers, as assessed by boxplot (see Figure 42); data was normally distributed for each
group, as assessed by Q-Q plots (see Figures 43 – 46); and there was homogeneity of
variances, as assessed by Levene's test of homogeneity of variances (p = .413) (see Table 23).
Data is presented as mean ± standard deviation. Results closely matched those with outliers in
that sustained impact level was not statistically significantly different between different
technology application groups, F(3, 440) = 1.887, p = .131, η2 = 0.01 (see Tables 24 and 27).
The level of sustained impact increased from the IWBAPP (M = 3.5, SD = 3.0) to MIWB (M =
4.1, SD = 3.3) to IWB (M = 4.3, SD = 3.3) to NONE (M = 4.4, SD = 3.1) technology
application groups, in that order. Tukey post hoc analysis (see Table 25) revealed no
statistically significant differences in sustained impact level between groups.

107
As there were outliers in the original data, a Kruskal-Wallis H test was run to determine
if there were differences in sustained impact levels between three groups of participants with
different technology applications. Distributions of sustained impact scores were similar for all
groups, as assessed by visual inspection of a boxplot (see Figure 47). The distributions of
effectiveness scores score were not statistically significantly different between groups, χ2(3) =
6.679, p = .083 (see Tables 28 – 29).
The group means were not statistically significantly different in all tests and, therefore,
we can retain the null hypothesis and reject the alternative hypothesis.
Table 23
Test of Homogeneity of Variances – Sustained Impact
Levene
Statistic df1 df2 Sig.
Sustained Impact .675 3 440 .568
Sustained Impact minus
outliers .956 3 440 .413
Table 24
ANOVA for Level 3 Measure
Sum of
Squares df
Mean
Square F Sig.
Sustained Impact
Between Groups 62.169 3 20.723 1.970 .118
Within Groups 4629.423 440 10.521
Total 4691.592 443
Sustained Impact minus
outliers
Between Groups 57.881 3 19.294 1.887 .131
Within Groups 4498.667 440 10.224
Total 4556.547 443
Table 25
Multiple Comparisons for Level 3 Measure
Tukey HSD
Dependent Variable (I)
Technology
(J)
Technology
Mean Difference
(I-J) Std. Error Sig.
95% Confidence
Interval
Lower
Bound
Upper
Bound
Sustained Impact IWB MIWB .144 .435 .987 -.98 1.27

108
IWBAPP .865 .435 .195 -.26 1.99
NONE -.081 .435 .998 -1.20 1.04
MIWB
IWB -.144 .435 .987 -1.27 .98
IWBAPP .721 .435 .349 -.40 1.84
NONE -.225 .435 .955 -1.35 .90
IWBAPP
IWB -.865 .435 .195 -1.99 .26
MIWB -.721 .435 .349 -1.84 .40
NONE -.946 .435 .133 -2.07 .18
NONE
IWB .081 .435 .998 -1.04 1.20
MIWB .225 .435 .955 -.90 1.35
IWBAPP .946 .435 .133 -.18 2.07
Sustained Impact minus
outliers
IWB
MIWB .144 .429 .987 -.96 1.25
IWBAPP .820 .429 .225 -.29 1.93
NONE -.108 .429 .994 -1.21 1.00
MIWB
IWB -.144 .429 .987 -1.25 .96
IWBAPP .676 .429 .394 -.43 1.78
NONE -.252 .429 .936 -1.36 .85
IWBAPP
IWB -.820 .429 .225 -1.93 .29
MIWB -.676 .429 .394 -1.78 .43
NONE -.928 .429 .136 -2.03 .18
NONE
IWB .108 .429 .994 -1.00 1.21
MIWB .252 .429 .936 -.85 1.36
IWBAPP .928 .429 .136 -.18 2.03
Table 26
Tests of Between-Subjects Effects for Level 3 Measure
Dependent Variable: Sustained Impact
Source Type III Sum of Squares df Mean Square F Sig. Partial Eta Squared
Corrected Model 62.169a 3 20.723 1.970 .118 .013
Intercept 7305.408 1 7305.408 694.337 .000 .612
Group 62.169 3 20.723 1.970 .118 .013
Error 4629.423 440 10.521
Total 11997.000 444
Corrected Total 4691.592 443
a. R Squared = .013 (Adjusted R Squared = .007)
Table 27
Tests of Between-Subjects Effects for Level 3 Measure minus outliers
Dependent Variable: Sustained Impact minus outliers
Source Type III Sum of
Squares df Mean Square F Sig.
Partial Eta
Squared
Corrected Model 57.881a 3 19.294 1.887 .131 .013
Intercept 7370.453 1 7370.453 720.880 .000 .621
Group 57.881 3 19.294 1.887 .131 .013
Error 4498.667 440 10.224
Total 11927.000 444
Corrected Total 4556.547 443
a. R Squared = .013 (Adjusted R Squared = .006)
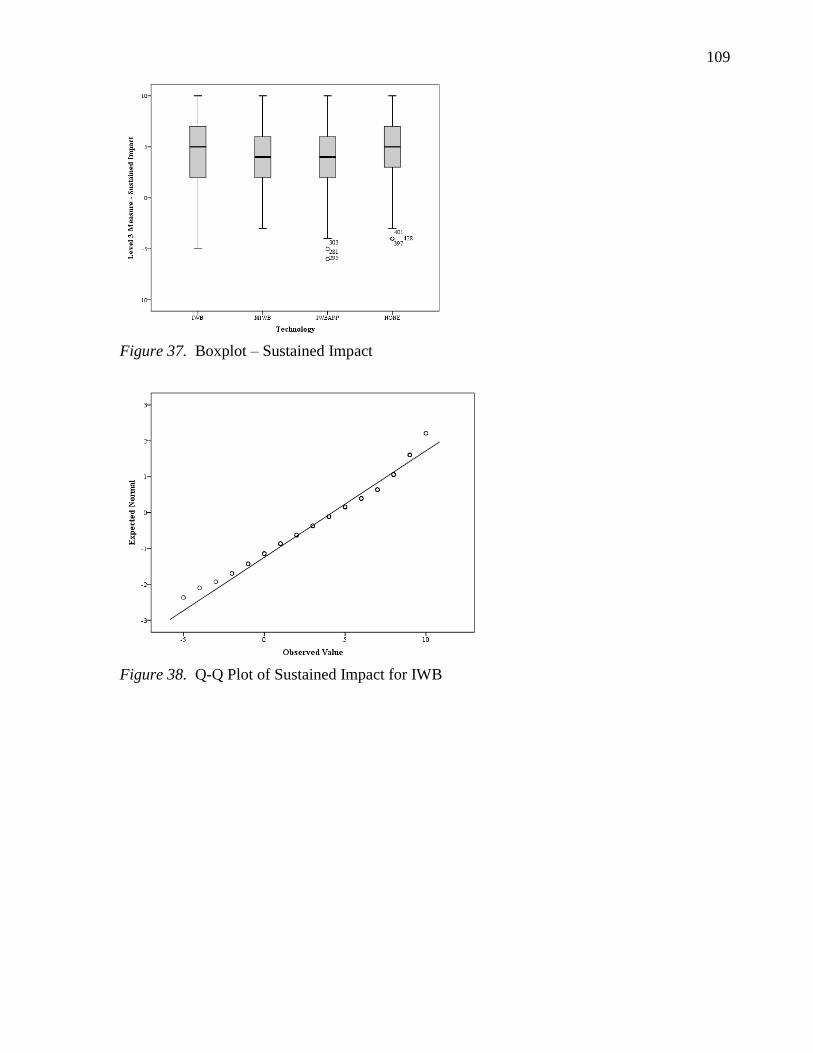
109
Figure 37. Boxplot – Sustained Impact
Figure 38. Q-Q Plot of Sustained Impact for IWB

110
Figure 39. Q-Q Plot of Sustained Impact for MIWB
Figure 40. Q-Q Plot of Sustained Impact for IWBAPP
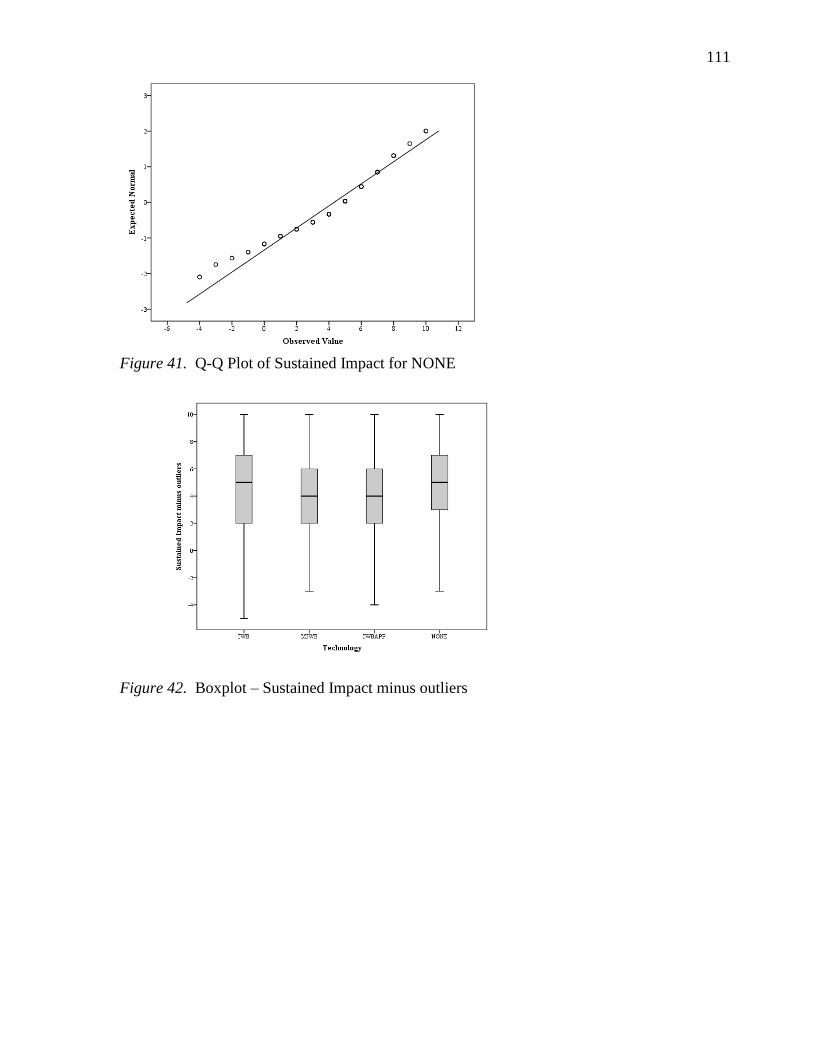
111
Figure 41. Q-Q Plot of Sustained Impact for NONE
Figure 42. Boxplot – Sustained Impact minus outliers

112
Figure 43. Q-Q Plot of Sustained Impact for IWB minus outliers
Figure 44. Q-Q Plot of Sustained Impact for MIWB minus outliers

113
Figure 45. Q-Q Plot of Sustained Impact for IWBAPP minus outliers
Figure 46. Q-Q Plot of Sustained Impact for NONE minus outliers
Table 28
Hypothesis Test Summary for Level 3 Measure
Null Hypothesis Test Sig Decision
1 The distribution of Sustained
Impact is the same across
categories of technology
Independent Samples
Kruskal-Wallis Test
.083 Retain the null
hypothesis
Asymptotic significances are displayed. The significance level is .05.

114
Figure 47. Independent Samples Kruskal-Wallis Test for Sustained Impact
Table 29
Independent Samples Kruskal-Wallis Test for Sustained Impact
Total N Test Statistic Degrees of
Freedom
Asymptotic Sig. (2
Sided Test)
444 6.679 3 .083
1. The test statistic is adjusted for ties
2. Multiple comparisons are not performed because the overall
test does not show significant differences across samples.
Null Hypothesis Four
A one-way ANOVA was conducted to determine if the effectiveness, importance, and
satisfaction factors of the perceived results level different for groups with different technology
applications. Participants were classified into three or four groups (IWB, MIWB, IWBAPP,
NONE), depending on factor, with n values noted in Table 1. There were outliers in each
factor, as assessed by boxplot (see Figures 48 – 50); data was normally distributed for all
factors of each group, as assessed by Q-Q plots (see Figures 51 – 60). There was homogeneity
of variances, as assessed by Levene's test of homogeneity of variances for the effectiveness (p
= .454) and importance (p = .489) factors, but not the satisfaction (p < .0005) factor (see Table
3). Data is presented as mean ± standard deviation.
115
Effectiveness factor score was statistically significantly different between different
technology application groups, F(2, 235) = 6.960, p = .001, η2 = 0.06 (see Tables 30 and 33).
The level of perceived effectiveness increase from the IWBAPP (M = 3.3, SD = 1.1) to MIWB
(M = 3.5, SD = 1.0) to IWB (M = 3.9, SD = 1.0) (see Table 1) technology application groups,
in that order. Tukey post hoc analysis (see Table 32) revealed an increase in effectiveness
level from the MIWB to the IWB group, which was statistically significant (.4, 95% CI[.0, .8],
p = .023). There was also an increase from the IWBAPP to the IWB group which was
statistically significant (.6, 95% CI[.2, 1.0], p = .001). The effect size was small (see Table
33). No other group differences were statistically significant.
Outliers were removed by slightly modifying their value to maintain their rank. A one-
way ANOVA was conducted on the adjusted data. There were no outliers, as assessed by
boxplot (see Figure 61); data was normally distributed for each group, as assessed by Q-Q
plots (see Figures 62 – 64); and there was homogeneity of variances, as assessed by Levene's
test of homogeneity of variances (p = .358) (see Table 34). Results closely matched those with
outliers in that effectiveness level was statistically significantly different between different
technology application groups, F (2, 235) = 7.466, p = .001, η2 = 0.06 (see Tables 30 – 33).
The level of perceived effectiveness increase from the IWBAPP (M = 3.3, SD = 1.1) to MIWB
(M = 3.5, SD = 1.0) to IWB (M = 3.9, SD = .9) technology application groups, in that order.
Tukey post hoc analysis (see Table 32) revealed an increase in effectiveness level from the
MIWB to the IWB group, which was statistically significant (.4, 95% CI[.1, .8], p = .018).
There was also an increase from the IWBAPP to the IWB group which was statistically
significant (.6, 95% CI[.2, 1.0], p = .001). The effect size was small (see Table 33). No other
group differences were statistically significant.

116
Importance factor score was statistically significantly different between different
technology application groups, F (2, 234) = 4.297, p = .015, η2 = 0.04 (see Tables 30 and 33).
The level of perceived importance increase from the IWBAPP (M = 3.5, SD = 1.1) to MIWB
(M = 3.6, SD = 1.0) to IWB (M = 4.0, SD = 1.0) (see Table 1) technology application groups,
in that order. Tukey post hoc analysis (see Table 32) revealed an increase in effectiveness
level from the IWBAPP to the IWB group, which was statistically significant (.4, 95% CI[.1,
.8], p = .02). There was also an increase from the MIWB to the IWB group (.4, 95% CI[.0, .8],
p = .04), but no other group differences were statistically significant. The effect size was small
(see Table 33).
Outliers were removed by slightly modifying their value to maintain their rank. A one-
way ANOVA was conducted on the adjusted data. There were no outliers, as assessed by
boxplot (see Figure 65); data was normally distributed for each group, as assessed by Q-Q
plots (see Figures 66-68); and there was homogeneity of variances, as assessed by Levene's test
of homogeneity of variances (p = .249) (see Table 34). Results closely matched those with
outliers in that importance level was statistically significantly different between different
technology application groups, F (2, 234) = 5.170, p = .006, η2 = .04 (see Tables 30 and 33).
The level of perceived importance increase from the IWBAPP (M = 3.5, SD = 1.1) to MIWB
(M = 3.6, SD = 1.0) to IWB (M = 4.0, SD = .9) technology application groups, in that order.
Tukey post hoc analysis (see Table 32) revealed an increase in effectiveness level from the
IWBAPP to the IWB group, which was statistically significant (.5, 95% CI[.1, .9], p = .01) as
well as from the MIWB to the IWB group (.4, 95% CI[.1, .8], p = .02), but not with any other
group differences. The effect size was small (see Table 33).
Satisfaction factor score was statistically significantly different between different
technology application groups, Welch's F(3, 164.026) = 23.908, p < .0005, η2 = 0.23 (see

117
Tables 31 and 33). The level of perceived satisfaction increased from the NONE (M = 2.7, SD
1.2) to IWBAPP (M = 3.7, SD = 1.0) to MIWB (M = 3.8, SD = .9) to IWB (M = 4.1, SD = .7)
(see Table 1) technology application groups, in that order. Games-Howell post hoc analysis
(see Table 32) revealed that the mean increase from IWBAPP to IWB (.4, 95% CI[.1, .8, p =
.01) was statistically significant, as well as the increases from the NONE to IWBAPP (1.0,
95% CI[.5, 1.4], p < .0005), MIWB (1.1, 95% CI[.6, 1.6], p < .0005), and IWB (1.4, 95%
CI[.1, 1.8], p < .0005) groups. The effect size was large (see Table 34). No other group
differences were statistically significant.
Outliers were removed by slightly modifying their value to maintain their rank. A one-
way ANOVA was conducted on the adjusted data. There were no outliers, as assessed by
boxplot (see Figure 69); data was normally distributed for each group, as assessed by Q-Q
plots (see Figures 70 – 73); and there was not homogeneity of variances, as assessed by
Levene's test of homogeneity of variances (p < .0005) (see Table 34). Results closely matched
those with outliers in that importance level was statistically significantly different between
different technology application groups, Welch's F(3, 163.668) = 24.534, p < .0005, η2 = .23
(see Tables 31 and 33). The level of perceived importance increase from the NONE (M = 2.7,
SD = 1.2) to IWBAPP (M = 3.7, SD = 1.0) to MIWB (M = 3.8, SD = .9) to IWB (M = 4.1, SD =
.7) technology application groups, in that order. Games-Howell post hoc analysis (see Table
32) revealed an increase in effectiveness level from the IWBAPP to the IWB group, which was
statistically significant (.4, 95% CI[.1, 1.0], p = .01) as well as the increases from the NONE to
IWBAPP (1.0, 95% CI[.5, 1.4], p < .0005), MIWB (1.1, 95% CI[.6, 1.6], p < .0005), and IWB
(1.4, 95% CI[.1, 1.8], p < .0005) groups. No other group differences were statistically
significant. The effect size was large (see Table 34).

118
As there were outliers in the original data, a non-parametric test, Kruskal-Wallis H, was
run to determine if there were differences in effectiveness, importance, and satisfaction levels
between three or four groups of participants with different technology applications.
Distributions of effectiveness scores were similar for all groups (see Figure 74), as assessed by
visual inspection of a boxplot, but not for importance and satisfaction scores (see Figures 75 –
76). The distributions of all factors demonstrated that there were statistically significantly
different between groups, (effectiveness - χ2(2) = 14.601, p = .001; importance - χ
2(2) = 9.096,
p = .011; satisfaction - χ2(3) = 54.401, p < .0005) (see Tables 35 – 36). Subsequently, pairwise
comparisons were performed using Dunn's (1964) procedure with a Bonferroni correction for
multiple comparisons. Statistical significance was accepted at the p < .0167 level for
effectiveness and importance factors and at the p < .0083 for the satisfaction factor. The
effectiveness factor post hoc analysis revealed statistically significant differences in
satisfaction scores between the IWBAPP (Mdn = 3.4) and IWB (Mdn = 4.0) (p < .002) groups,
and MIWB (Mdn = 3.6) and IWB (p = .034) groups, but not between any other groups (see
Figure 77 and Tables 37-38). The importance post hoc analysis revealed statistically
significant differences in satisfaction scores between the IWBAPP (Mdn = 3.6) and IWB (Mdn
= 4.2) (p = .042) groups and MIWB (Mdn = 3.8) and IWB (p = .071) groups, but not between
any other groups (see Figure 78 and Tables 37-38). The satisfaction factor post hoc analysis
revealed statistically significant differences in satisfaction scores between the IWBAPP (Mdn =
3.9) and IWB (Mdn = 4.2) (p = .042) groups and between the NONE (Mdn = 3.0) and
IWBAPP (p < .0005), MIWB (Mdn = 4.2) (p < .0005) and IWB (p < .0005) groups, but not
between any other groups (see Figure 79 and Tables 37-38).
The group means for the each factor were statistically significantly different in all tests
and, therefore, we can reject the null hypothesis and accept the alternative hypothesis.
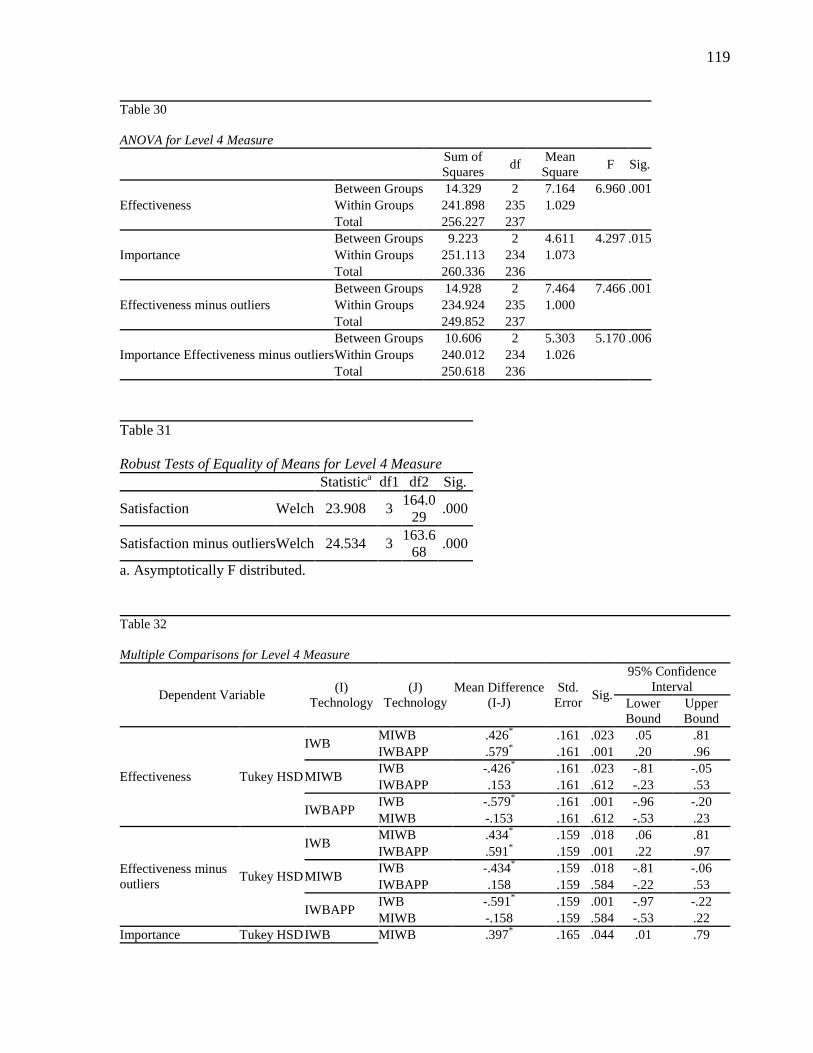
119
Table 30
ANOVA for Level 4 Measure
Sum of
Squares df
Mean
Square F Sig.
Effectiveness
Between Groups 14.329 2 7.164 6.960 .001
Within Groups 241.898 235 1.029
Total 256.227 237
Importance
Between Groups 9.223 2 4.611 4.297 .015
Within Groups 251.113 234 1.073
Total 260.336 236
Effectiveness minus outliers
Between Groups 14.928 2 7.464 7.466 .001
Within Groups 234.924 235 1.000
Total 249.852 237
Importance Effectiveness minus outliers
Between Groups 10.606 2 5.303 5.170 .006
Within Groups 240.012 234 1.026
Total 250.618 236
Table 31
Robust Tests of Equality of Means for Level 4 Measure
Statistica df1 df2 Sig.
Satisfaction Welch 23.908 3 164.0
29 .000
Satisfaction minus outliers Welch 24.534 3 163.6
68 .000
a. Asymptotically F distributed.
Table 32
Multiple Comparisons for Level 4 Measure
Dependent Variable (I)
Technology
(J)
Technology
Mean Difference
(I-J)
Std.
Error Sig.
95% Confidence
Interval
Lower
Bound
Upper
Bound
Effectiveness Tukey HSD
IWB MIWB .426
* .161 .023 .05 .81
IWBAPP .579* .161 .001 .20 .96
MIWB IWB -.426
* .161 .023 -.81 -.05
IWBAPP .153 .161 .612 -.23 .53
IWBAPP IWB -.579
* .161 .001 -.96 -.20
MIWB -.153 .161 .612 -.53 .23
Effectiveness minus
outliers Tukey HSD
IWB MIWB .434
* .159 .018 .06 .81
IWBAPP .591* .159 .001 .22 .97
MIWB IWB -.434
* .159 .018 -.81 -.06
IWBAPP .158 .159 .584 -.22 .53
IWBAPP IWB -.591
* .159 .001 -.97 -.22
MIWB -.158 .159 .584 -.53 .22
Importance Tukey HSD IWB MIWB .397* .165 .044 .01 .79

120
IWBAPP .437* .165 .023 .05 .83
MIWB IWB -.397
* .165 .044 -.79 -.01
IWBAPP .039 .165 .969 -.35 .43
IWBAPP IWB -.437
* .165 .023 -.83 -.05
MIWB -.039 .165 .969 -.43 .35
Importance minus
outliers Tukey HSD
IWB MIWB .428
* .161 .023 .05 .81
IWBAPP .467* .161 .011 .09 .85
MIWB IWB -.428
* .161 .023 -.81 -.05
IWBAPP .039 .161 .968 -.34 .42
IWBAPP IWB -.467
* .161 .011 -.85 -.09
MIWB -.039 .161 .968 -.42 .34
Satisfaction Games-
Howell
IWB
MIWB .303 .131 .101 -.04 .64
IWBAPP .437* .138 .010 .08 .80
NONE 1.402* .166 .000 .97 1.83
MIWB
IWB -.303 .131 .101 -.64 .04
IWBAPP .134 .149 .806 -.25 .52
NONE 1.099* .175 .000 .64 1.56
IWBAPP
IWB -.437* .138 .010 -.80 -.08
MIWB -.134 .149 .806 -.52 .25
NONE .965* .181 .000 .50 1.43
NONE
IWB -1.402* .166 .000 -1.83 -.97
MIWB -1.099* .175 .000 -1.56 -.64
IWBAPP -.965* .181 .000 -1.43 -.50
Satisfaction minus
outliers
Games-
Howell
IWB
MIWB .310 .130 .083 -.03 .65
IWBAPP .445* .137 .008 .09 .80
NONE 1.410* .165 .000 .98 1.84
MIWB
IWB -.310 .130 .083 -.65 .03
IWBAPP .134 .149 .806 -.25 .52
NONE 1.099* .175 .000 .64 1.56
IWBAPP
IWB -.445* .137 .008 -.80 -.09
MIWB -.134 .149 .806 -.52 .25
NONE .965* .181 .000 .50 1.43
NONE
IWB -1.410* .165 .000 -1.84 -.98
MIWB -1.099* .175 .000 -1.56 -.64
IWBAPP -.965* .181 .000 -1.43 -.50
*. The mean difference is significant at the 0.05 level.
Table 33
Tests of Between-Subjects Effects for Level 4 Measure
Dependent Variable Type III Sum of
Squares df Mean Square F Sig.
Partial Eta
Squared
Effectiveness 14.329 2 7.164 6.960 .001 .056
Effectiveness minus outliers 14.928 2 7.464 7.466 .001 .060
Importance 9.223 2 4.611 4.297 .015 .035
Importance minus outliers 10.606 2 5.303 5.170 .006 .042
Satisfaction 81.316 3 27.105 29.150 .000 .225
Satisfaction minus outliers 81.942 3 27.314 29.619 .000 .227

121
Table 34
Test of Homogeneity of Variances without outliers
Levene Statistic df1 df2 Sig.
Effectiveness 1.032 2 235 .358
Importance 1.397 2 234 .249
Satisfaction 11.113 3 302 .000
Figure 48. Boxplot – Effectiveness
Figure 49. Boxplot – Importance

122
Figure 50. Boxplot – Satisfaction
Figure 51. Q-Q Plot of Effectiveness for IWB

123
Figure 52. Q-Q Plot of Effectiveness for MIWB
Figure 53. Q-Q Plot of Effectiveness for IWBAPP

124
Figure 54. Q-Q Plot of Importance for IWB
Figure 55. Q-Q Plot of Importance for MIWB
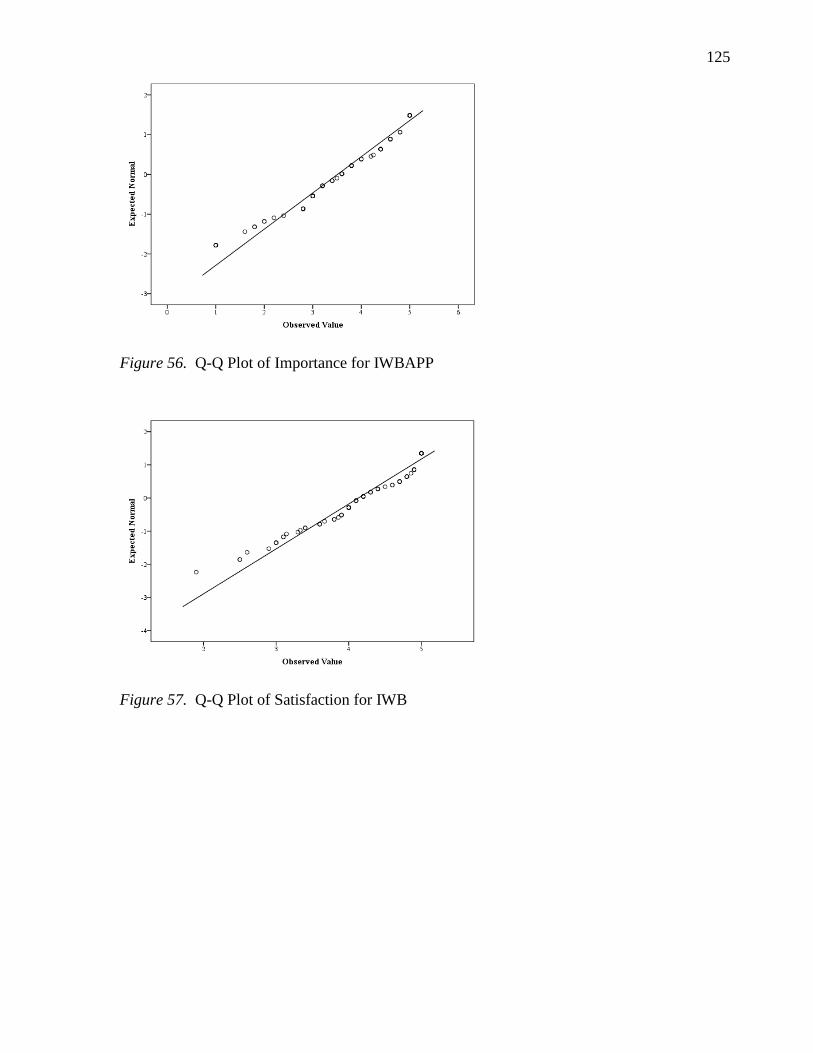
125
Figure 56. Q-Q Plot of Importance for IWBAPP
Figure 57. Q-Q Plot of Satisfaction for IWB
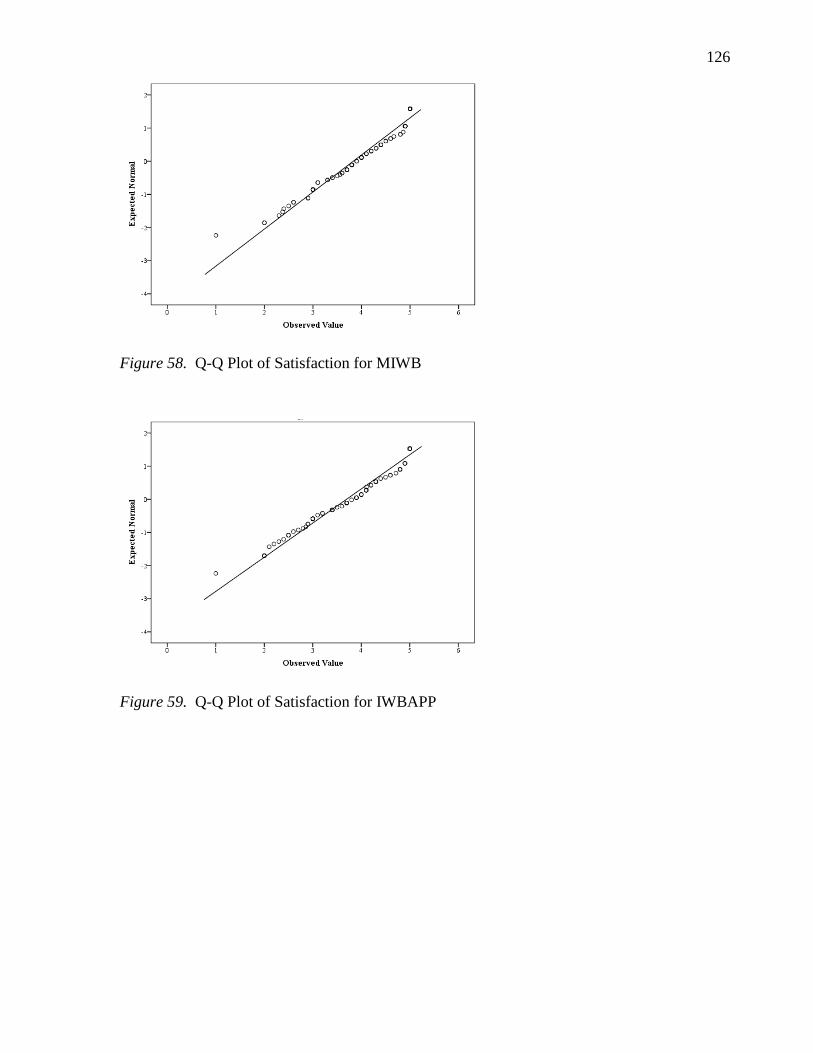
126
Figure 58. Q-Q Plot of Satisfaction for MIWB
Figure 59. Q-Q Plot of Satisfaction for IWBAPP
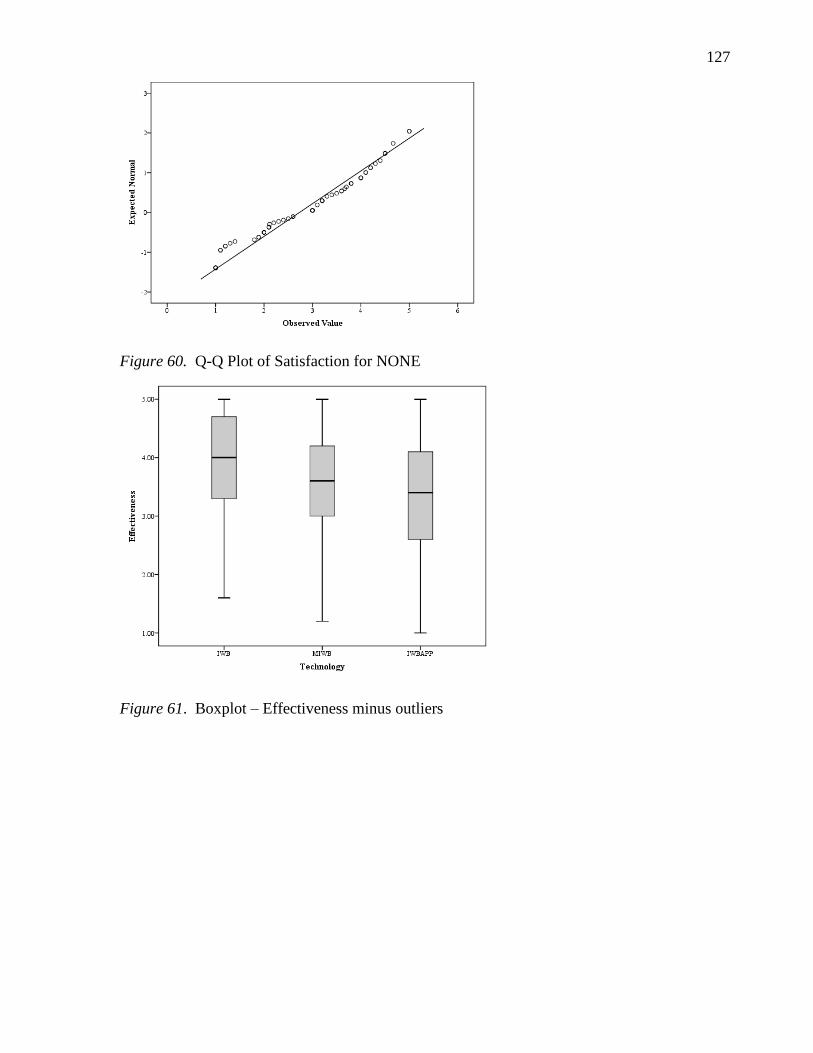
127
Figure 60. Q-Q Plot of Satisfaction for NONE
Figure 61. Boxplot – Effectiveness minus outliers

128
Figure 62. Q-Q Plot of Effectiveness for IWB minus outliers
Figure 63. Q-Q Plot of Effectiveness for MIWB minus outliers
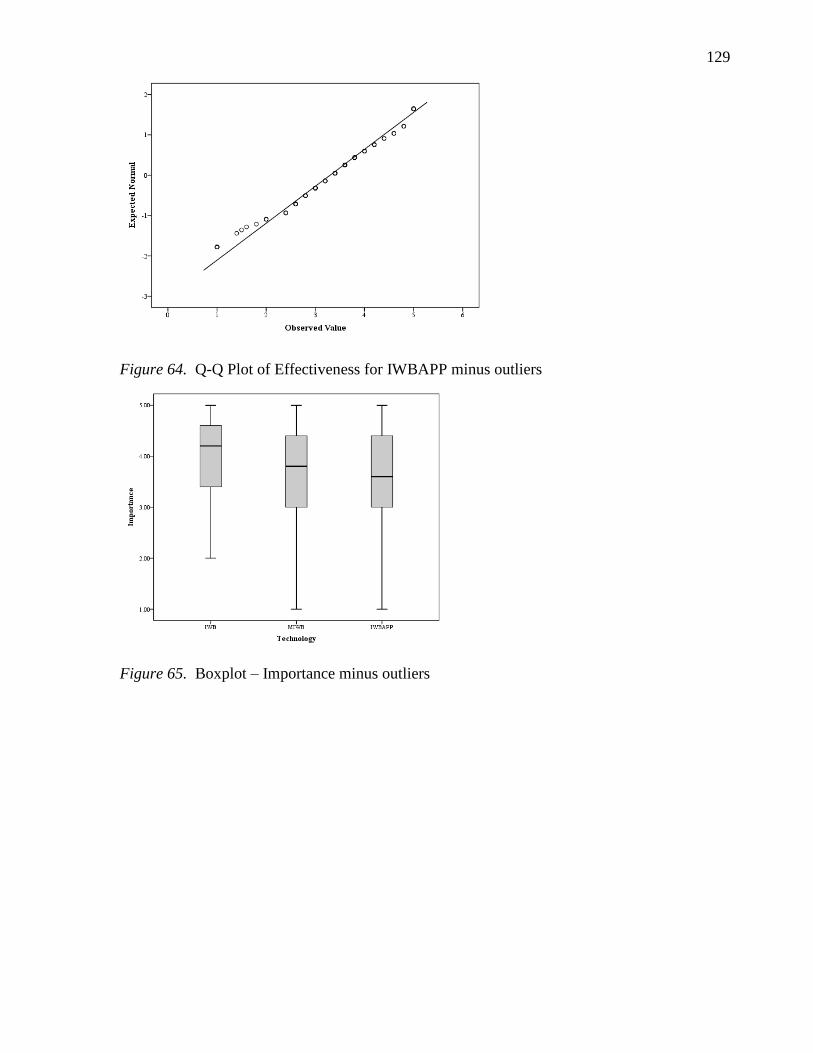
129
Figure 64. Q-Q Plot of Effectiveness for IWBAPP minus outliers
Figure 65. Boxplot – Importance minus outliers

130
Figure 66. Q-Q Plot of Importance for IWB minus outliers
Figure 67. Q-Q Plot of Importance for MIWB minus outliers

131
Figure 68. Q-Q Plot of Importance for IWBAPP
Figure 69. Boxplot – Satisfaction minus outliers

132
Figure 70. Q-Q Plot of Satisfaction for IWB minus outliers
Figure 71. Q-Q Plot of Satisfaction for MIWB minus outliers
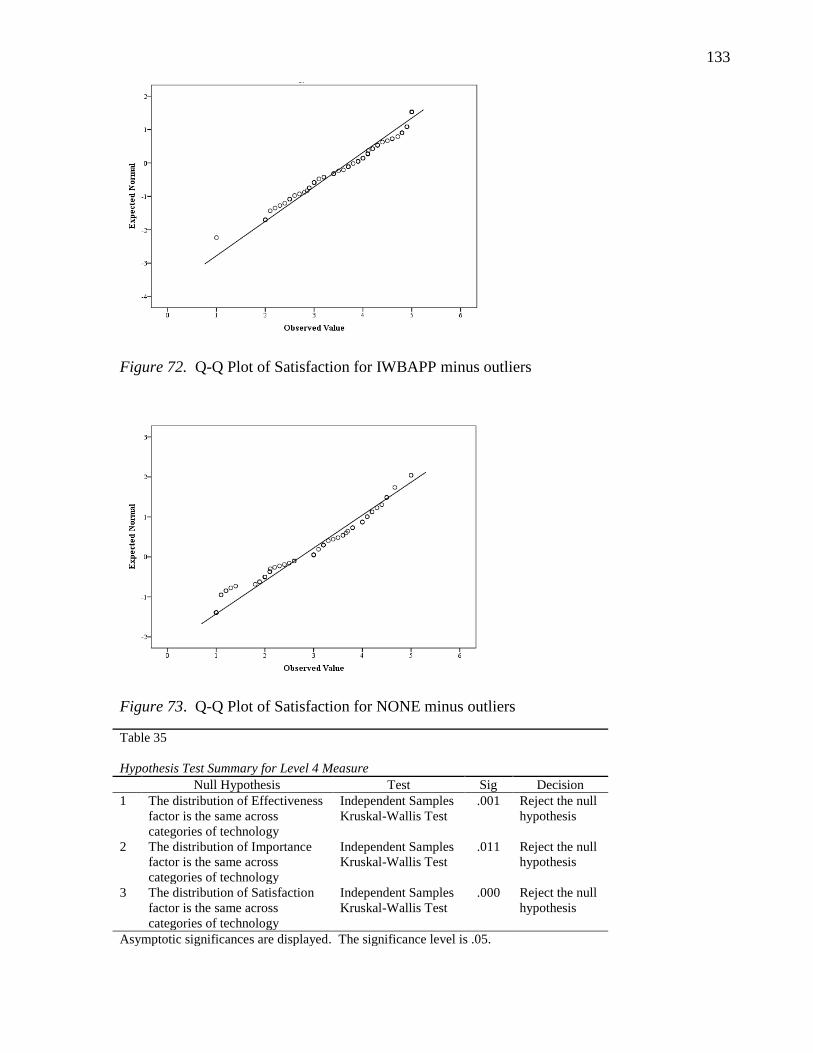
133
Figure 72. Q-Q Plot of Satisfaction for IWBAPP minus outliers
Figure 73. Q-Q Plot of Satisfaction for NONE minus outliers
Table 35
Hypothesis Test Summary for Level 4 Measure
Null Hypothesis Test Sig Decision
1 The distribution of Effectiveness
factor is the same across
categories of technology
Independent Samples
Kruskal-Wallis Test
.001 Reject the null
hypothesis
2 The distribution of Importance
factor is the same across
categories of technology
Independent Samples
Kruskal-Wallis Test .011 Reject the null
hypothesis
3 The distribution of Satisfaction
factor is the same across
categories of technology
Independent Samples
Kruskal-Wallis Test .000 Reject the null
hypothesis
Asymptotic significances are displayed. The significance level is .05.

134
Figure 74. Independent Samples Kruskal-Wallis Test for Effectiveness
Figure 75. Independent Samples Kruskal-Wallis Test for Importance
Figure 76. Independent Samples Kruskal-Wallis Test for Satisfaction
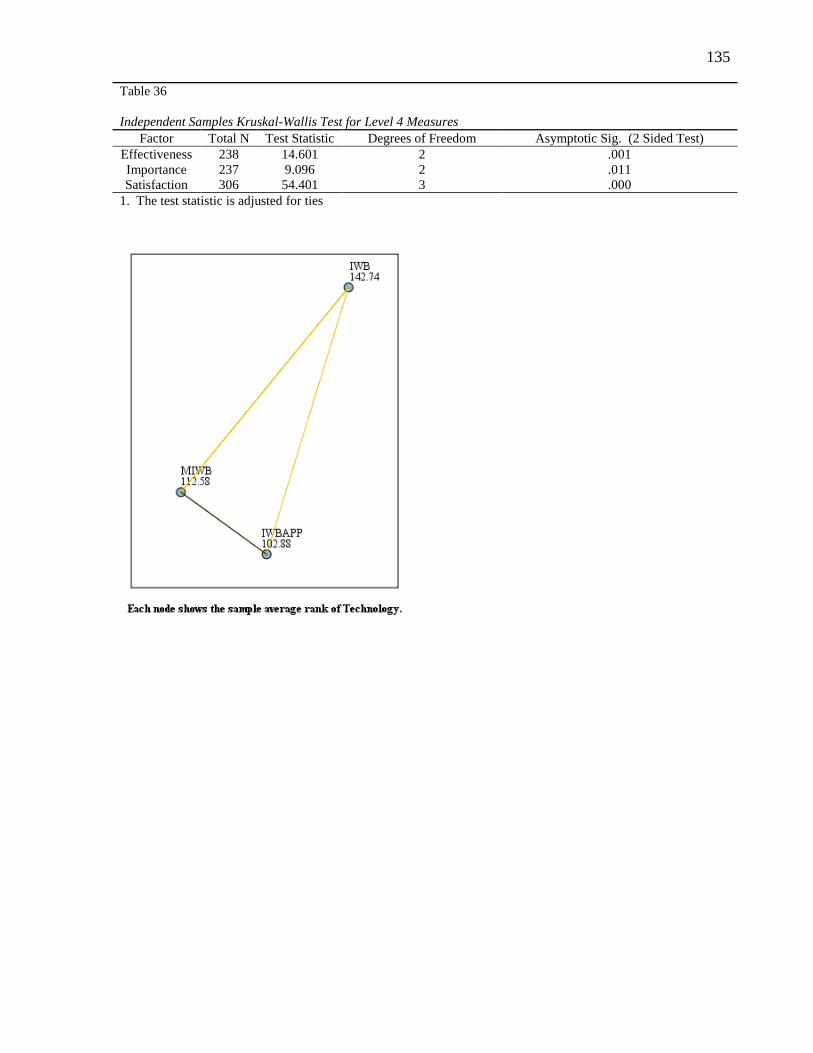
135
Table 36
Independent Samples Kruskal-Wallis Test for Level 4 Measures
Factor Total N Test Statistic Degrees of Freedom Asymptotic Sig. (2 Sided Test)
Effectiveness 238 14.601 2 .001
Importance 237 9.096 2 .011
Satisfaction 306 54.401 3 .000
1. The test statistic is adjusted for ties
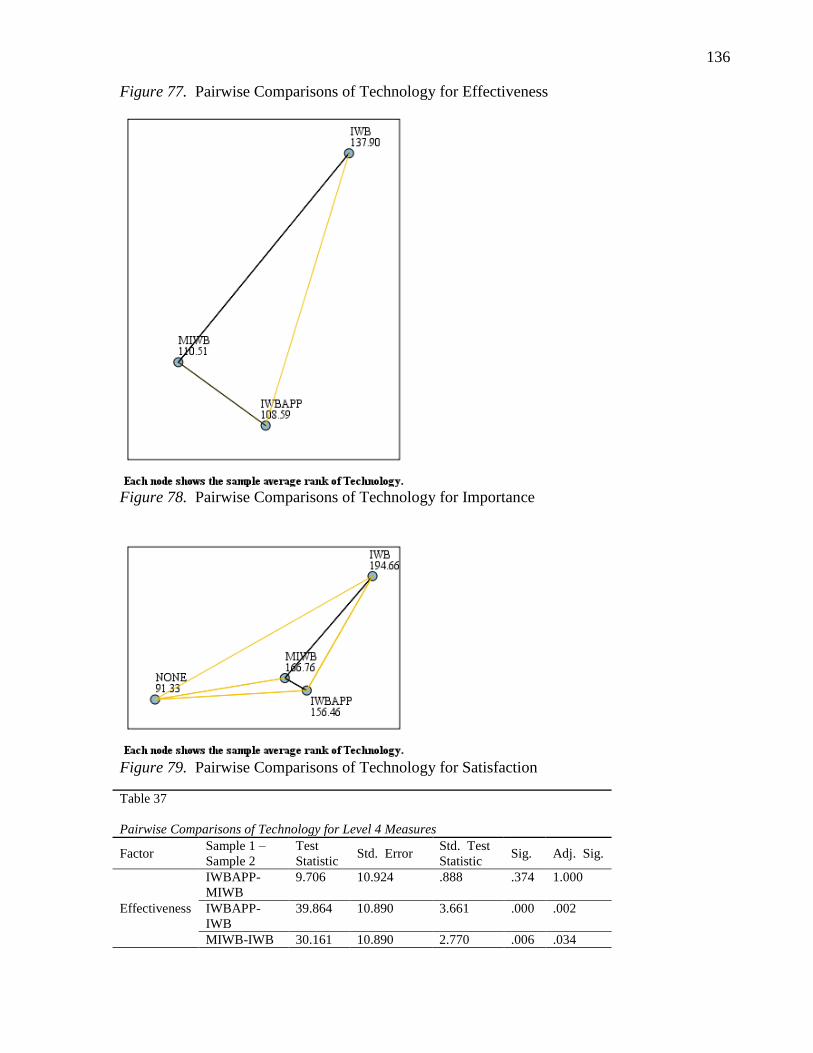
136
Figure 77. Pairwise Comparisons of Technology for Effectiveness
Figure 78. Pairwise Comparisons of Technology for Importance
Figure 79. Pairwise Comparisons of Technology for Satisfaction
Table 37
Pairwise Comparisons of Technology for Level 4 Measures
Factor Sample 1 –
Sample 2
Test
Statistic Std. Error
Std. Test
Statistic Sig. Adj. Sig.
Effectiveness
IWBAPP-
MIWB
9.706 10.924 .888 .374 1.000
IWBAPP-
IWB
39.864 10.890 3.661 .000 .002
MIWB-IWB 30.161 10.890 2.770 .006 .034

137
Importance
IWBAPP-
MIWB
1.911 10.872 .176 .860 1.000
IWBAPP-
IWB
29.304 10.872 2.695 .007 .042
MIWB-IWB 27.392 10.872 2.519 .012 .071
Satisfaction
NONE-
IWBAPP
65.128 14.442 4.510 .000 .000
NONE-
MIWB
75.429 14.442 5.223 .000 .000
NONE-IWB 103.327 14.442 7.155 .000 .000
IWBAPP-
MIWB
10.301 14.150 .728 .467 1.000
IWBAPP-
IWB
38.199 14.150 2.700 .007 .042
MIWB-IWB 27.897 14.150 1.972 .049 .292
Each row tests the null hypothesis that the Sample 1 and Sample 2 distributions are the
same.
Asymptotic significances (2-sided tests) are displayed. The significance level is .05
Table 38
Medians – Level 4 Measure
Technology Effectiveness Importance Satisfaction
IWB Median 4.0000 4.2000 4.2000
N 80 79 78
MIWB Median 3.6000 3.8000 3.9000
N 79 79 78
IWBAPP Median 3.4000 3.6000 3.8500
N 79 79 78
NONE Median 3.0000
N 72
Total Median 3.6000 3.8000 3.8000
N 238 237 306
Additional Analysis
Faculty Survey Descriptives
Faculty participants also completed a survey on their perceptions of the results of the
technology. (see Appendix B). As there were only four participants, only their descriptive
statistics will be presented (see Table 39). The questions were, like the student survey,
computed to three factors: effectiveness, importance, and satisfaction. The IWB was graded
highest in each factor (effectiveness – M = 4.67, importance – M = 4.33, satisfaction M =

138
4.19). The lowest effectiveness (M = 2.53) and importance (M = 3.73) scores were with the
MIWB. The lowest satisfaction score (M = 2.67) was with both the MIWB and NONE.
Table 39
Descriptives – Faculty Survey
Mean Std. Deviation Median Range Minimum Maximum N
IWB
Effectiveness 4.60 .231 4.60 0 4 5 4
Importance 4.25 .526 4.10 1 4 5 4
Satisfaction 4.83 .049 4.90 1 5 5 4
MIWB
Effectiveness 2.30 .808 2.10 2 2 3 4
Importance 3.05 .1.427 3.50 3 1 4 4
Satisfaction 3.10 .523 3.25 1 2 4 4
IWBAPP
Effectiveness 2.60 1.143 2.60 3 1 4 4
Importance 3.30 1.545 4.00 3 1 4 4
Satisfaction 3.20 .408 3.35 1 3 4 4
NONE Satisfaction 2.67 1.436 2.1 3 2 4 3
Additional Responses
Both the faculty and student surveys asked participants to select the technology
application that they found most and least helpful in the study. All participants found the IWB
most helpful, with 52.9% of students and 100% of faculty choosing that option. Students
found the IWBAPP (45.5%) least helpful while faculty found the MIWB (36.4%) least helpful
Table 40
Most helpful technology
Participant Technology Frequency Percent
Student
IWB 45 52.9
MIWB 23 27.1
IWBAPP 17 20.0
Faculty
IWB 4 100
MIWB 0 0
IWBAPP 0 0
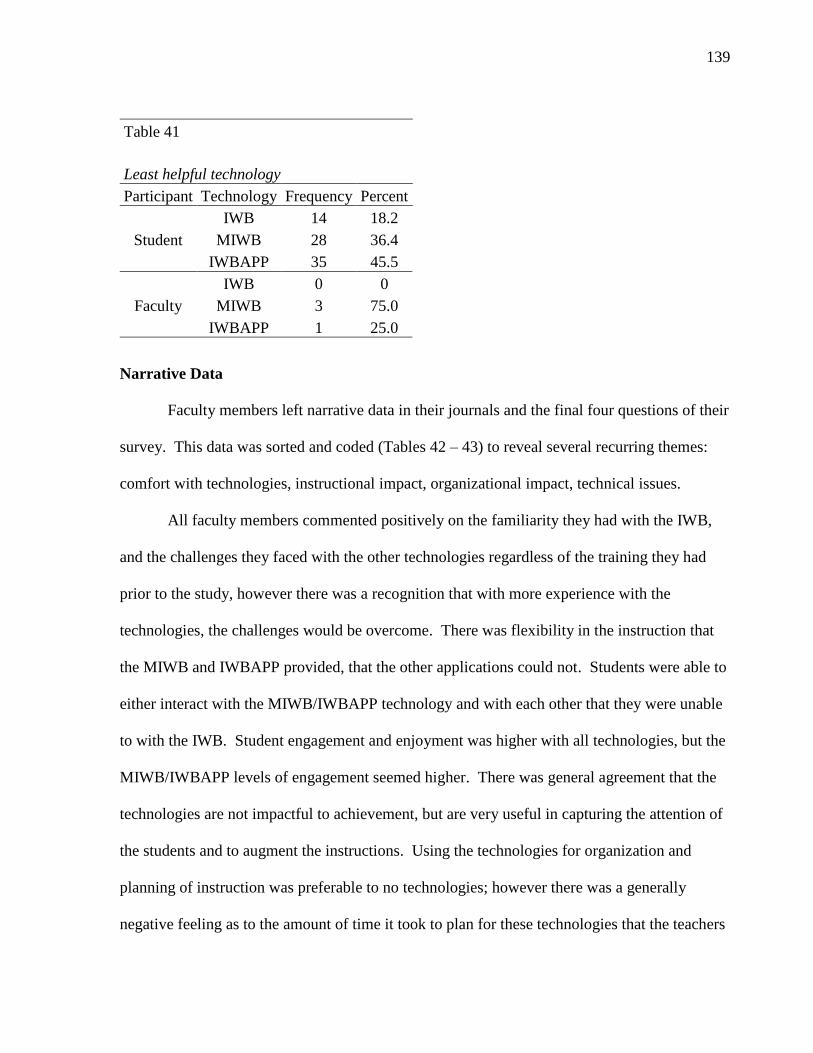
139
Table 41
Least helpful technology
Participant Technology Frequency Percent
Student
IWB 14 18.2
MIWB 28 36.4
IWBAPP 35 45.5
Faculty
IWB 0 0
MIWB 3 75.0
IWBAPP 1 25.0
Narrative Data
Faculty members left narrative data in their journals and the final four questions of their
survey. This data was sorted and coded (Tables 42 – 43) to reveal several recurring themes:
comfort with technologies, instructional impact, organizational impact, technical issues.
All faculty members commented positively on the familiarity they had with the IWB,
and the challenges they faced with the other technologies regardless of the training they had
prior to the study, however there was a recognition that with more experience with the
technologies, the challenges would be overcome. There was flexibility in the instruction that
the MIWB and IWBAPP provided, that the other applications could not. Students were able to
either interact with the MIWB/IWBAPP technology and with each other that they were unable
to with the IWB. Student engagement and enjoyment was higher with all technologies, but the
MIWB/IWBAPP levels of engagement seemed higher. There was general agreement that the
technologies are not impactful to achievement, but are very useful in capturing the attention of
the students and to augment the instructions. Using the technologies for organization and
planning of instruction was preferable to no technologies; however there was a generally
negative feeling as to the amount of time it took to plan for these technologies that the teachers

140
had less familiarity with. Finally, there were a number of technical issues. The IWBAPP was
mentioned by half the teachers with regards to it staying connected to the system. Difficulty
with the MIWB when working with graphs and tools, however it was noted that this may be
overcome with a change in configuration settings.
Table 42
Initial Coding based on Responses
Narrative comments and responses Initial Framework
IWBAPP
Complicated to use on this particular day. It kept losing connection
Losing connection throughout the lesson
MIWB
More difficult to change tools, but moving the toolbar and changing the
configuration helped
On graphs in future
I would change settings
Technical Issues
IWBAPP
Remembering about the transparency screen to write on was rather difficult
Preparing a warm-up on Doceri was difficult due to my inability
One student made a mistake and found eraser by himself to correct
One student accidentally closed program
MIWB
Students and teacher struggled to write neatly , bit frustrating for us to not be able
to see exactly where the pen would be writing
If it were used on a regular basis, it would be useful to get students to show their
work and collaboratively work on problems
The Mobiview was hard to operate when working on graphs
Found it more difficult to graph on the mobiview than on doceri
I am sure the students would get used to it eventually
Mastery issues
IWB
Used on a regular basis.
Felt more comfortable using it because of the extended usage
I am extremely familiar using
Students were comfortable coming up and interacting with the technology
No need to "reinvent the wheel"
Students are very comfortable with the technology
ALL TECHS
I’m “old school”
I rely more on basics than technology
Familiarity
IWBAPP
Easy to write on and clear for the students to see
Easily able to plot points and write on the screen and weren't distracted by the
technology
Visual benefits
IWBAPP
Able to roam the hall and take pictures of different symmetries
MIWB
That students didn't have to get out of their seats in order to use the Mobi-view
Flexibility
IWBAPP
Easily able to plot points and write on the screen and weren't distracted by the
Student engagement

141
technology
Students really enjoyed this lesson
Able to roam the hall and take pictures of different symmetries
Student comments: fun, better than regular, thumbs up, I liked it
IWB
Student engagement is excellent because they've had many opportunities to work
with
My students enjoy the games that are "pre-made" on the SMART software
MIWB
Challenged each other as to who could draw the better lines or create the better
images
NONE
Without any technology at all, they grumbled
ALL TECHS
Change up the pace to everyday instruction
IWBAPP
Good to show examples with
Remembering about the transparency screen to write on was rather difficult.
Interaction
MIWB/IWBAPP
Time consuming using new things
NONE
The lesson takes much longer without technology
Without my SMART board was a bit more work than I am used to
You need to have a lot more manipulative handy when there is no technology
IWBAPP/MIWB
When not efficient uses too much time to create lessons
Finding the appropriate materials for these apps/tech was very hard
Efficiency
ALL TECHS
I do not believe that the tech always helped me involve all students nor did it
make them think critically,
Problem getting productive student involvement (no distractions)
Technology should be used to enhance learning
To clearly present new info in a way that is user friendly
Give students a more fun way to interact with material
Involvement of students…key to increase knowledge of content
Impact on learning
Table 43
Final Coding based on Initial Framework
Final Framework Initial Framework
1. Comfort with
technologies
Mastery issues
Familiarity
2. Instructional Impact
Flexibility
Impact on learning
Student engagement
Interaction
3. Organizational
Impact
Efficiency
Visual benefits
4. Technical Issues Technical Issues

142
Summary
Four measures that are used to determine return on investment in a school or school
system were looked at using data from high school geometry classes exposed to four
applications of whiteboard technology. The data from the first measure, satisfaction level,
revealed that there was a small but significant difference in favor of the IWB over the other
technologies. This difference was evident in two factors that make up satisfaction: learning
contribution/motivation and efficiency. A third factor, negative effects of the technology, was
shown to have no significant difference between any of the technology applications. The
second measure, immediate impact on student achievement, revealed a small but significant
difference in favor of the MIWB over the IWBAPP. No other significant difference between
technology applications was noted. The study of the data also revealed that there was no
significant difference between any of the technology applications, including no IWB
technology, on the third measure: the sustained impact on learning. The final measure,
perceived results, revealed a statistically significant difference in the IWB over any other
application of the technology. This difference was small for two factors of perceived results:
effectiveness and importance. However, there was a large difference when no IWB technology
application was included in the analysis of the satisfaction factor of perceived results.
Feedback from the all participants revealed that they thought the IWB helped them most in the
class while the IWBAPP helped them the students the least, while the teachers found the
MIWB least helpful. These findings will be discussed further in the next chapter with a focus
on conclusions, implications, limitations of the study and recommendations for future research.

143
CHAPTER FIVE: DISCUSSION, CONCLUSIONS, AND RECOMMENDATIONS
Discussion
The review of the literature in chapter two shows that many communities are ready to
make investments in technologies in the classroom (Glover et al., 2007; Schachter, 2010). One
of the most commonly forms is the IWB, which is a very significant investment (Moss &
Jewett, 2010; “How to Afford”, 2011). Quantitative research on IWBs are limited (Lacina
2009) and the review showed that there was no research that compares whether different forms
of IWB technology provides a difference in value to a school system. The purpose of this
quasi-experimental non-equivalent control group study is to compare the levels of measure
used to determine a return on investment of a classroom technology package that includes
forms of IWB technology in a classroom for high school students in the Bayside Public
Schools district. Four levels of measure were used: satisfaction level, student achievement,
sustained impact, and perception of results (Phillips & Stone, 2000). Three different forms of
IWB technology (IWB, MIWB, IWBAPP) were applied, as well as no form of IWB
technology for the pre and posttest and satisfaction factor measures. The results of this study
are not able to prove causality.
Research Hypothesis 1
The first of four research hypotheses was that the satisfaction based on certain
perceptions of the study participants will be significantly different for a classroom between an
IWB, MIWB, or IWBAPP. Participants were given a technology survey (see Appendix A)
based on the IWBSS instrument developed by Türel (2011) and asked to provide feedback on
their satisfaction with each the forms of technology. The questions addressed three perception
factors: learning contribution and motivation, importance, and negative effects. Participants’
satisfaction in regards to all three technologies for each of the factors was positive, averaging
144
higher than the middle value of 3 on each factor in the survey. This finding is not surprising,
as there is much in the literature that supports a positive outlook and general satisfaction with
technologies in the classroom (Tamim, et al., 2011; Bebel & Kay, 2010; Eyyam & Yaratan,
2014). The results of the statistical analysis revealed that only for the efficiency factor was
there a small statistically significant positive difference between the participant’s satisfaction
with the IWB and both the IWBAPP and MIWB. Rehmat and Bailey (2014) noted that
perceptions of newer technologies may start out at lower levels, but in time they may become
accepted. The IWB, which has been used at RVHS for a few years, may have benefited from
these perceptions over the newer technologies (IWBAPP/MIWB), therefore resulting in
slightly higher satisfaction levels.
Research Hypothesis 2
The second hypothesis was that student achievement levels will be significantly
different for a classroom between an IWB, MIWB, IWBAPP, or no IWB technology.
Participants were given pre- and post-test assessments that were created from test banks that
are aligned to the Virginia SOLs. Post assessments were given within one day of the
completion of the lessons, so that short term impact could be measured. All of the technology
applications showed positive improvement in student achievement. The analysis revealed a
small statistically significant positive difference on student achievement between the MIWB
and IWBAPP applications, but not between any others. These finding are interesting in that
there was a difference, albeit small, in immediate student achievement only between the two
newly introduced forms of technology. These results may be related to the degree to which the
technology was embraced and, as noted by Potter and Rockinson-Szapkiw (2012), which may
have impacted the level of achievement. As noted by the results from the surveys, students
found the IWBAPP the least helpful. This may signal that the students did not fully embrace

145
this technology which had some impact their performance. Also of interest, but fully in line
with the body of literature, no single technology showed any significant difference in
immediate impact in student achievement when compared to no technology being used.
Although attitudes and perceptions of technology often change over time (Shelton, 2014;
Ebenerzer, et al., 2011; Koh, King & Tsai, 2013), the meta-analysis of forty years of research
by Tamim, et al. (2011) demonstrated that the teachers’ efficacy and the course objectives may
be more impactful than the technology.
Research Hypothesis 3
The third hypothesis was that sustained impact of learning level of the students will be
significantly different for a classroom between an IWB, MIWB, IWBAPP, or no IWB
technology. Like with the student achievement level, participants were given pre- and post-test
assessments that were created from test banks that are aligned to the Virginia SOLs. Post
assessments were given at the end of the transformations unit, but prior to the unit review, so
that impact of the technologies over time could be measured. All of the technology
applications showed positive improvement in student achievement. The analysis revealed no
statistically significant difference on student achievement between any technology
applications. As with the prior hypothesis, this result was not surprising in light of the body of
research (Tamim, et al., 2011; O’Dwyer, et al., 2008, Gano, 2011) which shows that the use of
technology’s impact on achievement has not been definitively established. It was interesting
that the apparent benefit that the MIWB demonstrated over the IWBAPP in immediate student
impact dissolved over time. As noted by Moss & Jewett (2010), the impact of the IWB
technologies were less directly impactful on student achievement and more in how the content
was presented and how it engaged the students

146
Research Hypothesis 4
The fourth hypothesis was that the perception of results level of the class participants
will be significantly different for a classroom between an IWB, MIWB, IWBAPP, or no IWB
technology. Participants were given a technology survey (see Appendices B and C) based on
instruments and findings by McCaslin (2009) and Flanagan and Shoffner (2013) and asked to
provide feedback on their perception of results with each the forms of technology. The
questions addressed three factors that determine the manner in which they perceived the
results: effectiveness, importance, and satisfaction. Participants’ attitudes toward the three
technologies in each of the factors averaged higher than the middle value of 3 on each survey.
Only the no technology (NONE) application averaged below 3 when it was included in the
satisfaction factor of the survey. The results of the statistical analysis revealed that for each
factor, there was a small, statistically significant positive difference between the participant’s
satisfaction with the IWB and the IWBAPP. Additionally, there was a small, statistically
significant positive difference in the effectiveness factor of the satisfaction level between the
IWB and MIWB. There was also a large, statistically significant positive difference between
each form of IWB technology and no technology application. These findings mirror results
found in prior studies. Horzum, et al. (2014) noted the anxiety and lack of confidence that
individuals have with new equipment as barriers to positive perceptions toward technologies.
As noted earlier, Rehmat and Bailey’s (2014) findings that perceptions of new technologies
often may start out low, however over time as they become more experienced and develop a
greater understanding, those perceptions can improve. Strongly supported by the literature is
the perception that any technology is preferable to no technology, as seen in the results here. A
number of studies in the review of literature noted that perceptions and attitudes were almost

147
always positive, even if they started out low (Bebell & Kay, 2010; Mishra & Koehler, 2006;
Barak & Ziv, 2013; Dunleavy, et al., 2009; Farnsworth, et al., 2013)
Conclusions
This study looked at elements that are used to determine a return on investment for
IWB technologies in an educational environment. The research findings support prior studies
that show little to no benefit to any form of IWB technology as it relates directly to student
achievement on assessments. The only difference in student performance on any of the
assessments in the study was between the MIWB and IWBAPP, and that effect was small and
short lasting. Long term impact on performance showed no difference between any of the
IWB technologies, including no IWB technology. Student perceptions, satisfaction, and
attitudes toward the technologies were generally positive, especially when compared to an
environment with no IWB technology. There were small differences in attitudes and
perceptions between the IWB technology and the MIWB and IWBAPP technologies. Faculty
participants expressed more satisfaction and a higher perception of the results with the IWB
technology than the MIWB, IWBAPP, or NONE.
Although no single form of technology demonstrated any direct impact to actual
student performance, immediate or sustained, the attitudes of satisfaction for any technology
was much higher than an environment where no IWB technology was used. All of the IWB
technology forms showed positive impact on both achievement and attitude. Students and
faculty in this study obviously were more satisfied in an environment where this specific form
of technology was available. The technologies were able to be utilized to incorporate
multimodal learning strategies, helping to address the multiple intelligences that can improve
the learning environment (McCoog, 2007). The features of the technology, when used

148
effectively, were shown to be engaging the students and encouraged interaction and
collaboration, which are supported by other research (Schrand, 2008; Jackson et al., 2009).
Within the limitations of environment of this study, each form provides nearly identical
value to the educational impact in the school. The differences in perceptions of results and
satisfaction were positive in regards to the IWB over the other technologies, however as noted
this could be associated with the participants not being as familiar with the MIWB or
IWBAPP. As noted in the review, when an actual ROI is calculated, the institution performing
it will weigh and assign values to each level of measure (Kirkpatrick & Kirkpatrick 2006;
Philips & Stone, 2000). The most significant difference demonstrated in this study for these
forms of technology ultimately may be the actual fiscal investment required for procurement.
Implications
This study adds to the existing body of knowledge by looking at different value
measures that impact decisions that may be made when investing in instructional technologies.
Although limited in generalizability, this study provides a framework in which educational
institutions can determine what, if any, form of IWB technology would be of best fit to the
needs of their students, staff, and community.
Faculty could find that the results of this study helpful when deciding what forms of
technology may most effective when planning out lessons. If there are multiple forms of IWB
technology available to them, teachers may want to select ones that provide students more
opportunities to interact, not only with the technology, but through those items with other
students (Northcote, et al., 2010). Additionally, the ability for the differing forms of the
technology to incorporate multiple forms of media and interaction can give teachers more
options to address individual learning styles and encourage student oriented learning (Overbay,
et al., 2010)

149
The findings may be helpful to administrators and directorial staff in two major ways:
equipment procurement and professional development planning. The study showed, within its
limited scope, each form of technology had the same impact, and nearly the same levels of
satisfaction and perceived results. When decisions are made by this district to outfit their
remaining schools with forms of IWB technology, serious consideration can be made for the
more mobile and less expensive forms (IWBAPP, MIWB). As shown in the literature,
effective professional development must be calculated into any plan. The IWB showed a small
but higher acceptance by the participants, but the difference may be overcome with a well
thought out and executed professional development program for any of the newer technologies
(Perotta, 2013; Koh, King, & Tsai, 2013; Rehmat & Bailey, 2014; Shelton, 2014).
Students and parents could use the findings in this study to support, along with
additional research, decisions to encourage their districts to choose forms of technology that
are shown to be as effective as others, as well as ones that are perceived positively. In a desire
for parents and students to be prepared for the 21st century (Partnership for 21
st Century Skills,
2009), having exposure to differing forms of effective and satisfying technologies could help
them to acquire desired skills (Thomas, Ge, & Greene, 2011).
Limitations
There are several limitations to this study that must be considered. The most significant
is the lack of random selection. Participants were chosen through convenience sampling as
they were enrolled in or teaching a Geometry course at the time of the study.
The study format lends itself to issues of internal validity. The greatest concern of
internal validity for this form of research is in history, maturation, pretesting, and
instrumentation (Gall et al., 2007, p. 398). Attempts to minimize these threats were made in
the research design. The selection of a single, SOL aligned subject taught at the same time for

150
all participants minimized history violations. The limited length of the study greatly reduced
any impact from maturation. Pre and post assessments were designed to ensure that, although
the participants were tested in the same skills, they did not see the exact same questions with
the same answers. All survey instruments were drawn from validity tested research and all
questions for the pre and post assessments were drawn from recognized, Virginia SOL
Geometry aligned test banks.
External validity factors also impact this study. Population and ecological validity
factors are extant as the study involved a Geometry classroom studying a unit on
transformations in a suburban high school in southeastern Virginia. Additionally, there may be
Hawthorne (novelty) effects concerning the MIWB and IWB, as the participants did not have
as much experience and time with these technologies as with the IWB, even though the
participants were given several weeks prior to the study to become familiar with those forms of
technology. There was also, within the time restraints of this study, no reasonable way to
provide levels of professional development in the MIWB and IWBAPP as compared to the
IWB, with which all faculty participants indicated having over 2 years of experience
Recommendations for Future Research
Abundant qualitative research for IWB technology exists; however, there is limited
quantitative research at the secondary education level in the body of literature. Additional,
MIWB studies are almost non-existent. The increasing use of tablets in education is leading to
more research in their use, but it is still relatively new and comparisons to forms of IWB
technologies is also very limited. Finally, studies that are used to determine what factors
should be considered of greatest value to institutions when selecting IWB technologies needs
to be broadened.
151
Recommendation 1
This study should be repeated in other secondary education institutions involving other
disciplines. Interaction of setting and treatment would be tested through this type of research.
Recommendation 2
Perform research studies that compare returns on investment measures for other types
of technologies that have multiple forms, such as differing tablets or computers.
Recommendation 3
Testing these technologies over a longer period of time, with more in-depth
professional development could provide greater understanding of the differences between the
forms of technology.
Recommendation 4
Research showing what value there are in these different technologies in their use in
other tasks. Specifically, research should be performed to see if the tablet, which has IWB
emulating capabilities, proves to be of greater value because of its ability to multitask in other
educational tasks.
Recommendation 5
As technologies may not directly impact achievement, but do have appear to have an
engagement effect, studies can be performed that compare students’ attitudes toward the entire
school experience when they are taught in a technology rich environment as opposed to those
who do not.
Recommendation 6
The conclusions drawn showed that the newly introduced technologies (MIWB,
IWBAPP) were significantly lower performing on some of the satisfaction and perception
factors. Studies that focus on the quality and depth of professional development on the

152
satisfaction and perception factors would be helpful. The studies would compare basic training
(learning functional tasks) as opposed to professional development that focuses on the training
that involves effective instructional techniques and modeling.
Summary
Interactive white board technologies, like other devices, do not automatically improve
student achievement. However, with proper planning, professional development, experience,
and acceptance by school and district personnel, these technologies can become important
assets to enhance the learning experience. In this study, one teacher utilized the IWBAPP to
have students leave the classroom and explore the school for examples of geometric symmetry.
Another teacher used the MIWBs to have groups of students interact in real time with the
formulas, adding a bit of enjoyable competition to complete the skills quickly and most
completely. The IWB was used by teachers to play premade learning games to grab the
attention of the students. Each of these technology forms were used to positively engage the
students, with no single one showing an overwhelming advantage over another. Schools and
systems, which have and continue to face reduced budgets must make critical and data driven
decisions when procuring instructional technologies. The findings of this study can provide a
method that would be used to determine a return on investment, as well as data driven guidance
on which IWB technology best meets the needs of the systems’ stakeholders.

153
REFERENCES
50,000 downloads of Doceri 2.0 iPad whiteboard, screencasting app. (2012, September 27).
Marketwire. Retrieved from http://doceri.com/news/news8.php
Abdallah, M. (2008). Multiple ways to be smart: Gardener's theory of multiple intelligences
and its educational implications in English teaching and oral communication.
Retrieved from http://www.eric.ed.gov/PDFS/ED502634.pdf.
Adams, N. B. (2004). Digital intelligence fostered by technology. Journal of Technology
Studies, 30(2), 93-97.
Akbas, O., & Pektas, H. (2011). The effects of using an interactive whiteboard on the
academic achievement of university students. Asia-Pacific Forum on Science Learning
and Teaching, 12(2). Retrieved from http://www.ied.edu.hk/apfslt/v12_issue2/
akbas/index.htm.
Allison, T. M. H. (2012). The impact of classroom performance system-based instruction with
peer instruction upon student achievement and motivation in eighth grade math
students. (Order No. 3494418, Liberty University). ProQuest Dissertations and
Theses, , 187. Retrieved from http://search.proquest.com/docview/921880883?
accountid=12085. (921880883).
Al-Raisi, A., & Al-Khouri, A. (2011). Public value and ROI in the government sector.
Advances in Management, 3(2), 33-38.
Baatro, A. M. (2009). Multiple intelligences and constructionism in the digital era. In Chen,
J., Moran, S., and Gardner, H. (Eds.), Multiple Intelligences Around the World (279-
287). San Francisco, CA: Jossey-Bass.

154
Banas, J. R. (2010). Teachers' Attitudes toward technology: Considerations for designing
preservice and practicing teacher instruction. Community & Junior College Libraries,
16(2), 114-127.
Barak M, & Ziv S (2013) Wandering: a web-based platform for the creation of location-based
interactive learning objects. Computers & Education, 6(2), 159–170
Baytiyeh, H., & Naja, M. K. (2010). Do multimedia features promote understanding and
retention. International Journal of Instructional Media, 37(1), 43-53.
Bebell, D., & Kay, R. (2010). One to one computing: A summary of the quantitative results
from the Berkshire wireless learning initiative. Journal of Technology, Learning, and
Assessment, 9(2),1-60. Retrieved from http://www.eric.ed.gov/PDFS/EJ873676.pdf.
Benchmark Assessment Solutions. (2012). Retrieved from
http://www.cssg.com/#!benchmark-assessment-solutions.
Boser, U. (2011). Return on educational investment: A district-by-district evaluation of U.S.
educational productivity. The Center for American Progress. Lanham, United States,
Lanham: Retrieved from http://search.proquest.com/docview/840762329?
accountid=12085
Boyce C. J., Mishra, C., Halverson, K. J., & Thomas, A. K., (2014). Getting students outside:
Using technology as a way to stimulate engagement. Journal of Science, Education,
and Technology, 23(6), 815-826
Buchan, J. F. (2011). The chicken or the egg? Investigating the transformational impact of
learning technology. Research in Learning Technology, 19(1), 155-172.
doi:10.1080/21567069.2011.586674
Cash, T. (2011). Rural Alaska mentoring project (RAMP). International Journal on School
Disaffection, 8(1), 35-37.
155
Chou, C. C., Block, L., & Jesness, R. (2012). A case study of mobile learning pilot project in
K-12 schools. Journal of Educational Technology Development and Exchange, 5(2),
11-26.
Clark, R. E. (1983). Reconsidering research on learning from media. Review of Educational
Research, 53(4), 445-459.
Clark, R. E. (1994). Media will never influence learning. Educational Technology Research
& Development, 42(2), 21-29.
Connors, M. (2015, January 15). Chesapeake schools chief fires salvo on funding.
Pilotonline.com. Retrieved from http://hamptonroads.com/2015/01/chesapeake-
schools-chief-fires-salvo-funding.
Cook, R. (2008). Implications of social constructivism for leaders. Retrieved from
http://www.midwestacademy.org/Proceedings/2008/papers/Cook_47.pdf.
Davis, F. D. (1989). Perceived usefulness, perceived ease of use, and user acceptance of
information technology. MIS Quarterly, 13, 318-340.
Delen, E., & Bulut, O. (2011). The relationship between students' exposure to technology and
their achievement in science and math. Turkish Online Journal of Educational
Technology, 10(3), 311-317.
Dhindsa, H., & Emran, S. H. (2011). Using interactive whiteboard technology-rich
constructivist learning environment to minimize gender differences in chemistry
achievement. International Journal of Environmental and Science Education, 6(4),
393-414.
Digregorio, P., & Sobel-Lojeski, K. (2010). The effects of interactive whiteboards (IWBs) on
student performance and learning: A literature review. Journal Of Educational
Technology Systems, 38(3), 255-312. doi:10.2190/ET.38.3.b

156
Dunham, G. (2011). The Future at Hand: Mobile Devices and Apps in Clinical Practice. The
ASHA Leader. Retrieved from http://www.asha.org/Publications/leader/2011/
110405/The-Future-at-Hand--Mobile-Devices-and-Apps-in-Clinical-
Practice.htm?sf1281106=1
Dunleavy M, Dede C,, & Mitchell R (2009) Affordances and limitations of immersive
participatory augmented reality simulations for teaching and learning. Journal of
Science Education and Technology, 18(1), 7–22
Ebenezer, J., Columbus, R., Kaya, O. N., Zhang, L., & Ebenezer, D. L. (2012). One science
teacher’s professional development experience: A case study exploring changes in
students’ perceptions of their fluency with innovative technologies. Journal of Science
Education and Technology, 21(1), 22-27
Educreations Interactive whiteboard app. (2012). Learning & Leading with Technology,
39(6), 43.
Eyyam, R., & Yaratan, H. S. (2014). Impact of use of technology in mathematics lessons on
student achievement and attitudes. Social Behavior & Personality: An International
Journal, 42(1)315-425. doi:10.2224/sbp.2014.42.0.S31
Fabian, K., & MacLean, D. (2014). Keep taking the tablets? Assessing the use of tablet
devices in learning and teaching activities in the Further Education sector. Research in
Learning Technology, 22, 1-14. doi:10.3402/rlt.v22.22648
Falloon, G. (2013), Young students using iPads: App design and content influences on their
learning pathways, Computers & Education, 68, 505-521.
Farnsworth E. J., Chu M., Kress W. J., Neill A. K., Best J. H., Pickering J., . . . Ellison A.M.
(2013). Next-generation field guides. Bioscience, 63(11), 891–899
157
Fernandez-Cardenas, J., & Silveyra-De La Garza, M. (2010). Disciplinary knowledge and
gesturing in communicative events: A comparative study between lessons using
interactive whiteboards and traditional whiteboards in Mexican schools. Technology,
Pedagogy and Education, 19(2), 173-193.
Flanagan, S. & Shoffner, M. (2013). Teaching with(out) technology: Secondary English
teachers and classroom technology use. Contemporary Issues in Technology and
Teacher Education. 13 (3), 242-261.
Fogarty, R. (1999). Architects of the intellect. Educational Leadership, 57(3), 76-78.
Fox-Turnbull, W., & Snape, P. (2011). Technology teacher education through a constructivist
approach. Design and Technology Education, 16(2), 45-56.
Gall, M. D., Gall, J. P., & Borg, W. R. (2007). Educational research: An introduction (8th
ed.). New York, NY: Pearson.
Gano, L. R. (2011). Fitting technology to the mathematics pedagogy: Its effect on students'
academic achievement. Journal of College Teaching & Learning, 8(11), 29-38.
Gaotlhobogwe, M., Laugharne, J., & Durance, I. (2011). The potential of multivariate
analysis in assessing students' attitude to curriculum subjects. Educational Research,
53(1), 65-83.
Gardner, H. (1983). Frames of mind: The theory of multiple intelligences. New York: Basic
Books. (New editions 1993, 2004, 2011).
Giles, R. M., & Baggett, P. V. (2009). Investigating technologies in teacher education: Does
PowerPoint enhance retention or influence attitudes? SRATE Journal, 18(1), 44-52.
Gill, T. G. (2007). Teaching brief: Using the tablet PC for instruction. Decision Sciences
Journal of Innovative Education, 5(1), 183-190.
158
Glover, D., Miller, D., Averis, D., & Door, V. (2007). The evolution of an effective pedagogy
for teachers using the interactive whiteboard in mathematics and modern languages: An
empirical analysis from the secondary sector. Learning, Media and Technology, 32(1),
5-20. doi: 10.1080/17439880601141146.
Gracious, F., & Shyla, F. (2012). Multiple intelligence and digital learning awareness of
prospective B.Ed teachers. Turkish Online Journal Of Distance Education (TOJDE),
13(2), 112-118.
Gregory, S. (2010). Enhancing student learning with interactive whiteboards: Perspective of
teachers and students. Australian Educational Computing, 25(2), 31-34. Retrieved
from EBSCOhost.
Hanushek, E. A., & Raymond, M. E. (2005). Does school accountability lead to improved
student performance?. Journal of Policy Analysis and Management, 24(2), 297-327.
Hargis, J., Cavanaugh, C., Kamali, T., & Soto, M. (2014). A federal higher education iPad
mobile learning initiative: Triangulation of data to determine early effectiveness.
Innovative Higher Education, 39(1), 45-57
Harrison, C., Comber, C., Fisher, T., Haw, K., Lewin, C., & Lunzer, E. (2002). ImpaCT2:
The impact of information and communication technologies on pupil learning and
attainment. A report to the DfES. ICT in Schools Research and Evaluation Series No 7.
Coventry, UK: BECTA.
Henze, M. (2009). Demystifying 'constructivism' teasing unnecessary baggage from useful
pedagogy. Christian Education Journal, 6, 1, 87(25).
Herman, J. L., Osmundson, E., & Dietel, R. (2010). Benchmark assessments for improved
learning (AACC Report). Los Angeles, CA: University of California.

159
Higgins, S. (2010). The impact of interactive whiteboards on classroom interaction and
learning in primary schools in the UK. In M. Thomas & E. C. Schmid (Eds.),
Interactive whiteboards for education: Theory, research and practice (pp. 86 101).
New York: Information Science Reference.
Holderied, A. C. (2011). Instructional design for the active: Employing interactive
technologies and active learning exercises to enhance information literacy. Journal of
Information Literacy, 5(1), 23-32.
Horzum, M. B., Öztürk, E., Bektas, M., Güngören, Ö. C., & Çakir, Ö. (2014). Secondary
school students tablet computer acceptance and readiness: A structural equation
modelling. Egitim Ve Bilim, 39(176), 81-94
Howell, D. C. (2011). Fundamental statistics for the behavioral sciences (7th ed.). Belmont,
CA: Thomson/Wadsworth.
How to afford interactive whiteboards. (2011). Technology & Learning, 31(8), 44-46.
Hu, W. (2011). Math that moves: Schools embrace the iPad. New York Times. Retrieved
from http://www.nytimes.com/2011/01/05/education/05tablets.htm
Hug, T. (2010). Radical constructivism mainstreaming: A desirable endeavor? Critical
considerations using examples from educational studies and learning theory.
Constructivist Foundations, 6(1), 58-64.
IESD White Paper: What the research says: Using eInstruction’s ® Mobi™ system to support
effective instruction , (2010). Retrieved from http://www.einstruction.com/files/default
files/downloads/Insight 360 research Basis-whitepaper.pdf.
Ishtaiwa, F. (2014). Mobile technology as a learning tool: use and effects. International
Journal of Information and Communication Technology Education, 10(4), 1-15

160
Jackson, A., Gaudet, L., McDaniel, L., & Brammer, D. (2009). Curriculum integration: The
use of technology to support learning. Journal of College Teaching & Learning, 6(7),
71-78.
Jahnke, I., & Kumar, S. (2014). Digital didactical designs: teachers' integration of iPads for
learning-centered processes. Journal of Digital Learning in Teacher Education, 30(3),
81-88.
Kaufman, D. (2009). How does the use of interactive whiteboards affect teaching and
learning? Distance Learning, 6(2), 23-33. doi: 1903519791.
Kaye, S. T., Timmons, D. E., Eckert, B., Doubrava, D., & Jacobs, W. (2005). U.S. Patent No.
6,930,673. Washington, DC: U.S. Patent and Trademark Office.
Kearney, M., & Schuck, S. (2008). Exploring pedagogy with interactive whiteboards in
Australian schools. Australian Educational Computing, 23(1), 8-13.
Keengwe, J., & Schnellert, G. (2012). Digital technology integration in American public
schools. International Journal of Information and Communication Technology
Education, 8(3), 36-44.
Kirkpatrick, D. L. (1959). Techniques for evaluating training programs. Journal of the
American Society of Training Directors, 13, 3–9.
Kirkpatrick, D. L. (1976). Evaluation of training. In R. L. Craig (Ed.), Training and
development handbook: A guide to human resource development (2nd ed., pp. 301 –
319). New York: McGraw-Hill.
Kirkpatrick, D. L. (1996). Invited reaction: reaction to Holton article. Human Resource
Development Quarterly, 7 ,23 –25.
Kirkpatrick, D., & Kirkpatrick, J. (2006). Evaluating Training Programs : The Four Levels.
San Francisco, CA: Berrett-Koehler.

161
Koh, J. H., Ling, Chai, C. S., & Tsai, C. (2013). Examining practicing teachers' perceptions of
technological pedagogical content knowledge (TPACK) pathways: A structural
equation modeling approach. Instructional Science, 41(4), 793-809
Kozma, R. B. (1991). Learning with media. Review of Educational Research, 61(2), 179-211.
Kronholz, J. (2011). Getting at-risk teens to graduation: Blended learning offers a second
chance. Education Next, 11(4), 24-31.
Lacina, J. (2009). Technology in the classroom interactive whiteboards: creating higher-level,
technological thinkers? Childhood Education, 85(4), 270-272.
Lambert, J., & Yi, G. (2010). 21st century paradigms for pre-service teacher technology
preparation. Computers in the Schools, 27(1), 54-70.
doi:10.1080/07380560903536272.
Liu, W. C., & Stengel, D. N. (2011). Improving student retention and performance in
quantitative courses using clickers. International Journal for Technology in
Mathematics Education, 18(1), 51-58.
Lund Research Ltd. (2013). One-way ANOVA in SPSS Statistics. Laerd Statistics Premium.
Retrieved from https://statistics.laerd.com/premium/owa/one-way-anova-in-spss.php
Lund Research Ltd. (2012). Convenience sampling explained. Lærd Dissertation. Retrieved
from http://dissertation.laerd.com/convenience-sampling.php
Machun, P. A., Trau, C., Zaid, N., Wang, M., & Ng, J. (2012). MOOCs: Is there an app for
that? Expanding mobilegogy through an analysis of MOOCS and iTunes university. In
Proceedings of the The 2012 IEEE/WIC/ACM International Joint Conferences on Web
Intelligence and Intelligent Agent Technology, 3, 321-325. DOI=10.1109/WI-
IAT.2012.179
162
Marangunić, N., Granić, A. (2015). Technology acceptance model: a literature review from
1986 to 2013. Universal Access in the Information Society. 14(1), 81-95.
McCaslin, J. B. (2009). Student perceptions of blackboard using the technology acceptance
model (Doctoral Dissertation). Retrieved from ProQuest Dissertations and Theses
database, (UMI 304918048).
McCoog, I. (2007). Integrated instruction: Multiple intelligences and technology. Clearing
House: A Journal of Educational Strategies, Issues and Ideas, 81(1), 25-28. Retrieved
from EBSCOhost.
Miller, D., & Glover, D. (2010). Interactive whiteboards: A literature survey. In M. Thomas
& E. C. Schmid (Eds.), Interactive whiteboards for education: Theory, research and
practice (pp. 1 19). New York: Information Science Reference.
Mishra, P., & Koehler, M. (2006). Technological pedagogical content knowledge: A
framework for teacher knowledge. The Teachers College Record, 108(6), 1017-1054.
Molenda, M. (2003). In search of the elusive ADDIE model. Performance Improvement,
42(5), 34.
Moss, G., Armstrong, V., Jewitt, C., Levacic, R., Cardini, A., & Castle, F. (2007). The
interactive whiteboards, pedagogy and pupil performance evaluation: An evaluation of
the Schools Whiteboard Expansion (SWE) Project: London Challenge. Institute of
Education. Retrieved from http://www.ioe.ac.uk/Full_report.pdf.
Moss, G., & Jewitt, C. (2010). Policy, pedagogy and interactive whiteboards: What lessons
can be learnt from early adoption in England? In M. Thomas, & E. Schmid (Eds.)
Interactive Whiteboards for Education: Theory, Research and Practice (pp. 20-36).
Hershey, PA: Information Science Reference. doi:10.4018/978-1-61520-715-2.ch002
Nicholson, D. (2011). Using a visualiser in primary science. Primary Science, 118, 23-25.

163
Northcote, M., Mildenhall, P., Marshall, L., & Swan, P. (2010). Interactive whiteboards:
Interactive or just whiteboards?. Australasian Journal of Educational Technology,
26(4), 494-510.
O'Dwyer, L. M., Russell, M., Bebell, D., & Seeley, K. (2008). Examining the relationship
between students' mathematics test scores and computer use at home and at school.
Journal of Technology, Learning, and Assessment, 6(5), 1-46.
Overbay, A., Patterson, A., Vasu, E., & Grable, L. (2010). Constructivism and technology
use: Findings from the Impacting Leadership Project. Educational Media
International, 47(2), 103-120.
Papastergiou, M. (2009). Digital game-based learning in high school computer science
education: impact on educational effectiveness and student motivation. Computers and
Education, 5(2), 1–12
Partnership for 21st Century Skills. (2009). Framework for 21st century learning, Retrieved
from http://www.p21.org/overview
Peariso, J. F. (2008). Multiple intelligences or multiply misleading: The critic's view of the
multiple intelligences theory. Retrieved from http://www.eric.ed.gov/PDFS/
ED500515.pdf.
Perrotta, C. (2013). Do school-level factors influence the educational benefits of digital
technology? A critical analysis of teachers' perceptions. British Journal of Educational
Technology, 44(2), 1467-8535
Phillips, J. J. (1996). ROI: The search for best practices. Training & Development, 50(2), 42.
Phillips, J. J. (1997). Handbook of training evaluation and measurement methods (3rd
ed.).
Houston, TX: Gulf Publishing Company.

164
Phillips, J. J. (2003). Return on investment in training and performance improvement
programs (2nd
ed.). Burlington, MA: Butterworth-Heinemann.
Phillips, J. J., & Stone, R. D. (2000). How to measure training results. [Kindle Version].
doi:10.1036/0071406263.
Pilgrim, J., & Berry, J. (2014). Technology integration with teacher candidates in a summer-
camp setting. Journal of Digital Learning in Teacher Education, 30(4), 131-138.
Pilgrim, J., Bledsoe, C., & Reily, S. (2012). New technologies in the classroom. Delta Kappa
Gamma Bulletin, 78(4), 16-22.
Pitler, H., Hubbell, E.R , & Kuhn, M. (2012). Using technology with classroom instruction
that works (2nd ed.). [Adobe PDF file]. Denver, CO: Mid-continent Research for
Education and Learning.
Popescu, E., (2010). Adaptation provisioning with respect to learning styles in a web-based
educational system: An experimental study. Journal of Computer Assisted Learning,
26, 243–257 doi: 10.1111/j.1365-2729.2010.00364.x.
Potter, S. L., & Rockinson-Szapkiw, A. J. (2012). Technology integration for instructional
improvement: The impact of professional development. Performance Improvement,
51(2), 22-27.
Praslova, L. (2010). Adaptation of Kirkpatrick’s four level model of training criteria to
assessment of learning outcomes and program evaluation in higher education.
Educational Assessment, Evaluation and Accountability, 22(3), 215-225.
Price, M., Handley, K., Millar, J., & O'Donovan, B. (2010). Feedback: All that effort, but
what is the effect? Assessment & Evaluation in Higher Education, 35(3), 277-289.
Rajeev, P., Madan, & Jayarajan, K. (2009). Revisiting Kirkpatrick’s model - an evaluation of
an academic training course. Current Science (Bangalore), 96(2), 272-276.
165
Rehmat, A. P. & Bailey, J. M. (2014). Technology integration in a science classroom:
Preservice teachers’ perceptions. Journal of Science Education and Technology, 23(6)
744-755
Resnick, R. M. (2011). School market size, growth and the shift to digital resources in K-12
classrooms. Publishing Research Quarterly, 27(2), 169. doi:10.1007/s12109-011-
9209-4.
Riegler, A., & Quale, A. (2010). Editorial: Can radical constructivism become a mainstream
endeavor?. Constructivist Foundations, 6(1), 1-5.
Robertson, W. (2008). The greatest constructivist educator ever: the pedagogy of Jesus Christ
in the gospel of Matthew in the context of the 5es. Christian Perspectives in
Education, 1(2).
Rouse, D. (2011). Employing Kirkpatrick’s evaluation framework to determine the
effectiveness of health information management courses and programs. Perspectives in
Health Information Management,8(Spring), 1c.
Sappey, J., & Relf, S. (2010). Digital technology education and its impact on traditional
academic roles and practice. Journal of University Teaching & Learning Practice,
7(1), 1-17.
Sardone, N. B., & Devlin-Scherer, R. (2010). Teacher candidate responses to digital games:
21st-century skills development. Journal of Research on Technology in Education,
42(4), 409-425.
Schachter, R. (2010). Learning from Great Britain: Classrooms in the U.K. have had
interactive whiteboards (IWBs) for years. Here's how teachers make the most of them.
Instructor (1990), 119(6), 57-60.

166
Schrand, T. (2008). Tapping into active learning and multiple intelligences with interactive
multimedia: A low-threshold classroom approach. College Teaching, 56(2), 78-84.
Retrieved from EBSCOhost.
Schmidt, S. (2012). The rush to online: Comparing students' learning outcomes in online and
face-to-face accounting courses. (Doctoral Dissertation) Retrieved from ProQuest
Dissertations and Theses (Order No. 3524459, University of South Dakota).
docview/1039150240?accountid=12085. (1039150240).
Shapiro, B. L. (2011). Towards a transforming constructivism: Understanding learners'
meanings and the messages of learning environments. Journal Of Educational
Thought, 45(2), 165-201.
Shelton, C. (2014). “Virtually mandatory”: A survey of how discipline and institutional
commitment shape university lecturers’ perceptions of technology. British Journal of
Educational Technology, 45(4), 748–759
Shenton, A., & Pagett, L. (2007). From “bored” to screen: The use of the interactive
whiteboard for literacy in six primary classrooms in England. Literacy, 41(3), 129-136.
Shoemaker, T. L. (2013). Effect of computer-aided instruction on attitude and achievement of
fifth grade math students. (Doctoral Dissertation) Retrieved from ProQuest
Dissertations and Theses (Order No. 3595355, Liberty University).
Slay, H., Siebörger, I., & Hodgkinson-Williams, C. (2008). Interactive whiteboards: Real
beauty or just “lipstick”?, Computers & Education, 51(3), 1321-1341.
Splashtop Inc.; (2011). Splashtop whiteboard app turns iPads into an interactive whiteboard.
Technology & Business Journal, 2356. Retrieved from http://search.proquest.com/
docview/875351075?accountid=12085

167
Stanford, P., Crowe, M. W., & Flice, H. (2010). Differentiating with technology. Teaching
Exceptional Children Plus, 6(4), 1-9.
Tamim, R., Bernard, R., Borokhovski, E., Abrami, P., & Schmid, R. (2011). What forty years
of research says about the impact of technology on learning: A second-order meta-
analysis and validation study. Review of Educational Research, 81, 4-28.
doi:10.3102/0034654310393361
Thistlethwaite, J. (2014), Evaluation, outcomes and education. The Clinical Teacher, 11(6)
409–410.
Thomas, M., & Schmid, E. (2010). Interactive Whiteboards for Education: Theory, Research
and Practice. Hershey, PA: Information Science Reference.
Thomas, M. K., Ge, X., & Greene, B. A. (2011). Fostering 21st century skill development by
engaging students in authentic game design projects in a high school computer
programming class. Journal of Educational Computing Research, 44(4), 391-408.
Thompson, A. C. (2012). The effect of enhanced visualization instruction on first grade
students' scores on the North Carolina standard course assessment. (Doctoral
Dissertation) Retrieved from ProQuest Dissertations and Theses (Order No. 3522564,
Liberty University).
Tingen, J., Philbeck, L., & Holcomb, L. B. (2011). Developing classroom web sites for 21st
century learning. Kappa Delta Pi Record, 47(2), 88-90.
Türel, Y. K. (2011). An interactive whiteboard student survey: Development, validity and
reliability. Computers & Education, 57(4), 2441-2450.
Türel, Y. K., & Johnson, T. E. (2012). Teachers' belief and use of interactive whiteboards for
teaching and learning. Educational Technology & Society, 15 (1), 381–394.

168
U.S. Department of Education, National Center for Education Statistics. (2009). Teachers’
use of educational technology in U.S. public schools: 2009 (NCES Publication No.
2010-040). Retrieved from http://nces.ed.gov/pubsearch/pubsinfo.asp?pubid=2010040.
U.S. Department of Education (2010). Transforming American education: Learning powered
by technology National Education Technology Plan 2010. Retrieved from
http://www.ed.gov/sites/default/files/netp2010.pdf.
Van Brummelen, H. (2002). Steppingstones to curriculum. Colorado Springs, Colorado:
Purposeful Design Publications.
Virginia Department of Education (2015). Fall Membership. [Web Page]. Retrieved from
http://bi.vita.virginia.gov/doe_bi/rdPage.aspx?rdReport=Main&subRptName=Fallmem
bership.
Virginia Department of Education (2014). Advanced programs participation by school report.
[Excel File]. Retrieved from http://www.doe.virginia.gov/statistics_
reports/advanced/index.shtml.
Virginia Department of Education (2012). Adequate yearly progress (AYP) reports. [Web
Page]. Retrieved from http://www.doe.virginia.gov/statistics_reports/accreditation_
federal_reports/ayp/.
Virginia Department of Education (2011). School, School Division, and State Report Cards.
[Web Page]. Retrieved from https://p1pe.doe.virginia.gov/reportcard/.
Virginia Department of Education (2011). Standards of Accreditation. [Web Page]. Retrieved
from http://www.doe.virginia.gov/boe/accreditation/index.shtml.
Virginia Department of Education (2011). Standards of Learning (SOL) & Testing. [Web
Page]. Retrieved from http://www.doe.virginia.gov/testing/.

169
Virginia Department of Education (2011). Virginia Standards of Learning & Common Core
State Standards. [Web Page]. Retrieved from
http://www.doe.virginia.gov/testing/common_core/index.shtml.
Weng, P., Savage, M. N., & Bouck, E. C. (2014). iDIY: Video-based instruction using iPads.
Teaching Exceptional Children, 47(1), 11-19.
Williams, D. D., South, J. B., Yanchar, S. C., Wilson, B. G., Allen, S. (2011). How do
instructional designers evaluate? A qualitative study of evaluation in practice.
Educational Technology Research and Development, 59(6), 885-907
Winslow, J., Dickerson, J., Lee, C., & Geer, G. (2012). Mobile technologies: Tools for
organizational learning and management in schools: iPrincipals: Analyzing the use of
iPads by school administrators. International Education Studies, 5(4), 188-195.
Yardley, S., & Dornan, T. (2012). Kirkpatrick’s levels and education ‘evidence’. Medical
Education, 46(1), 97–106

170
APPENDICES
Appendix A
Student Survey of Reaction and Satisfaction with interactive whiteboards (IWB), mobile
interactive whiteboards (MIWB), interactive whiteboard app (IWBAPP) or no IWB
technology usage
Scale: 1 – Strongly Disagree
2 – Disagree
3 – Neither agree nor disagree
4 – Agree
5 – Strongly agree
Question
1. What is your Study ID? (see cover page) _____«StudyID»____
2. I believe the listed technology is useful for student learning. (Check one for each type of
technology.)
Type 1 2 3 4 5
IWB
MIWB
IWBAPP
3. I believe it is necessary for my teachers to use the listed technology in class. (Check one for each
type of technology.)
Type 1 2 3 4 5
IWB
MIWB
IWBAPP
4. The listed technology can be used for all classes. (Check one for each type of technology.)
Type 1 2 3 4 5
IWB
MIWB
IWBAPP
5. The content of my classes is not suitable for the listed technology use. (Check one for each type of
technology.)
Type 1 2 3 4 5
IWB
MIWB
IWBAPP
6. I think that the courses are efficient with the listed technology. (Check one for each type of
technology.)
Type 1 2 3 4 5
IWB
MIWB
IWBAPP

171
7. The listed technology use increases my interest in class. (Check one for each type of technology.)
Type 1 2 3 4 5
IWB
MIWB
IWBAPP
8. The listed technology use makes it easier for me to remember what I learned in class. (Check one
for each type of technology.)
Type 1 2 3 4 5
IWB
MIWB
IWBAPP
9. I can understand the lessons taught with the listed technology better. (Check one for each type of
technology.)
Type 1 2 3 4 5
IWB
MIWB
IWBAPP
10. The listed technology increases the interactivity. (Check one for each type of technology.)
Type 1 2 3 4 5
IWB
MIWB
IWBAPP
11. The listed technology makes the class entertaining. (Check one for each type of technology.)
Type 1 2 3 4 5
IWB
MIWB
IWBAPP
12. The listed technology makes me learn concepts more easily. (Check one for each type of
technology.)
Type 1 2 3 4 5
IWB
MIWB
IWBAPP
13. I can focus on the course content when the listed technology is used. (Check one for each type of
technology.)
Type 1 2 3 4 5
IWB
MIWB
IWBAPP

172
14. I believe that if my teachers use the listed technology more often, I will enjoy lessons. (Check one
for each type of technology.)
Type 1 2 3 4 5
IWB
MIWB
IWBAPP
15. I can learn better when my teacher uses the listed technology. (Check one for each type of
technology.)
Type 1 2 3 4 5
IWB
MIWB
IWBAPP
16. I feel comfortable when the listed technology is being used.
(Check one for each type of technology.)
Type 1 2 3 4 5
IWB
MIWB
IWBAPP
17. The listed technology increases my attention towards the course.
(Check one for each type of technology.)
Type 1 2 3 4 5
IWB
MIWB
IWBAPP
18. The listed technology increases my motivation towards the course. (Check one for each type of
technology.)
Type 1 2 3 4 5
IWB
MIWB
IWBAPP
19. I get opportunities to discuss the topics taught with the listed technology with my classmates.
(Check one for each type of technology.)
Type 1 2 3 4 5
IWB
MIWB
IWBAPP
20. The listed technology helps us learn together. (Check one for each type of technology.)
Type 1 2 3 4 5
IWB
MIWB
IWBAPP

173
21. The listed technology helps me learn faster. (Check one for each type of technology.)
Type 1 2 3 4 5
IWB
MIWB
IWBAPP
22. The listed technology makes learning exciting. (Check one for each type of technology.)
Type 1 2 3 4 5
IWB
MIWB
IWBAPP
23. I look forward to my teachers using the listed technology in class. (Check one for each type of
technology.)
Type 1 2 3 4 5
IWB
MIWB
IWBAPP
24. We have technical issues (i.e. pauses, video issues, pen/Touch/stylus problems) with the listed
technology. (Check one for each type of technology)
Type 1 2 3 4 5
IWB
MIWB
IWBAPP
25. During use of the listed technology, there is a lot of noise in class.
(Check one for each type of technology)
Type 1 2 3 4 5
IWB
MIWB
IWBAPP
26. The listed technology was exciting at the beginning but not anymore.
(Check one for each type of technology.)
Type 1 2 3 4 5
IWB
MIWB
IWBAPP
27. I learn more when I review topics, which were taught through the listed technology, at home.
(Check one for each type of technology)
Type 1 2 3 4 5
IWB
MIWB
IWBAPP
Türel, Y. K. (2011). An interactive whiteboard student survey: Development, validity and reliability.
Computers & Education, 57(4), 2441-2450. Adapted with permission
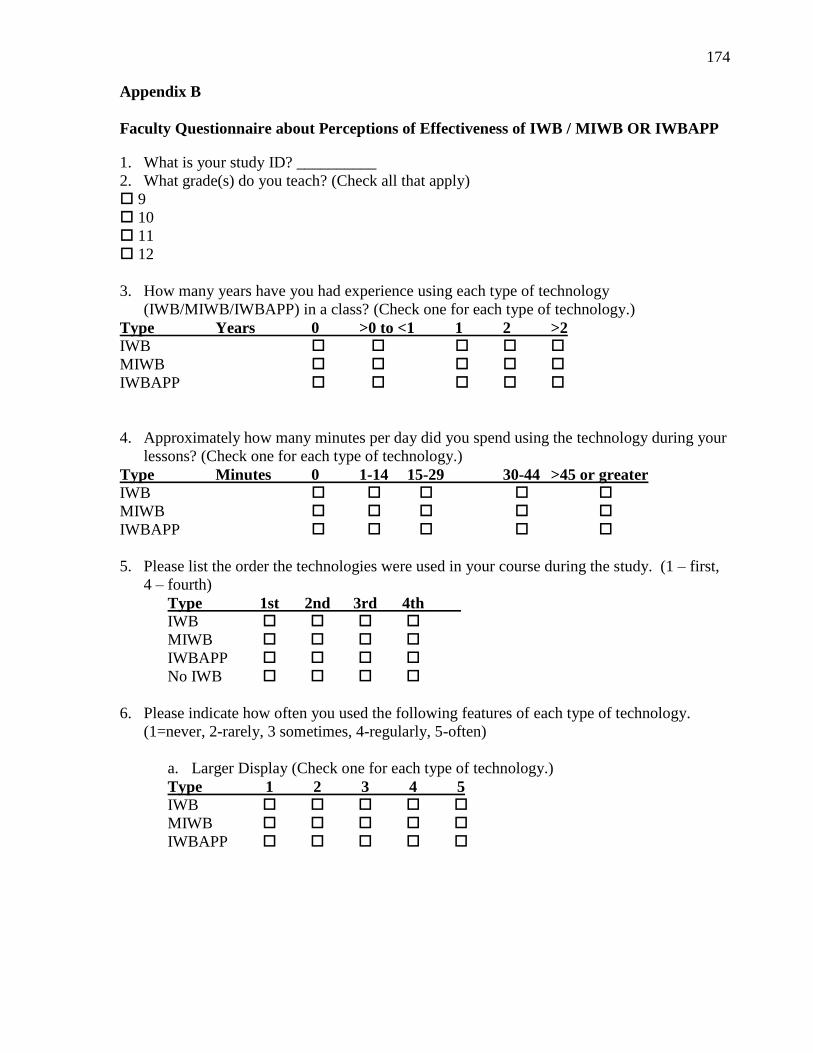
174
Appendix B
Faculty Questionnaire about Perceptions of Effectiveness of IWB / MIWB OR IWBAPP
1. What is your study ID? __________
2. What grade(s) do you teach? (Check all that apply)
9
10
11
12
3. How many years have you had experience using each type of technology
(IWB/MIWB/IWBAPP) in a class? (Check one for each type of technology.)
Type Years 0 >0 to <1 1 2 >2
IWB
MIWB
IWBAPP
4. Approximately how many minutes per day did you spend using the technology during your
lessons? (Check one for each type of technology.)
Type Minutes 0 1-14 15-29 30-44 >45 or greater
IWB
MIWB
IWBAPP
5. Please list the order the technologies were used in your course during the study. (1 – first,
4 – fourth)
Type 1st 2nd 3rd 4th
IWB
MIWB
IWBAPP
No IWB
6. Please indicate how often you used the following features of each type of technology.
(1=never, 2-rarely, 3 sometimes, 4-regularly, 5-often)
a. Larger Display (Check one for each type of technology.)
Type 1 2 3 4 5
IWB
MIWB
IWBAPP

175
b. Interactive activities (Check one for each type of technology.)
Type 1 2 3 4 5
IWB
MIWB
IWBAPP
c. Using touch or pen directly with information (Check one for each type of
technology.)
Type 1 2 3 4 5
IWB
MIWB
IWBAPP
d. Use of multimedia: i.e. audio/video/images/text (Check one for each type of
technology.)
Type 1 2 3 4 5
IWB
MIWB
IWBAPP
e. Manipulating objects on boards (Check one for each type of technology.)
Type 1 2 3 4 5
IWB
MIWB
IWBAPP
7. Please rate the effectiveness of the following features for the class. (1-low, 5, high)
f. Larger Display (Check one for each type of technology.)
Type 1 2 3 4 5
IWB
MIWB
IWBAPP
g. Interactive activities (Check one for each type of technology.)
Type 1 2 3 4 5
IWB
MIWB
IWBAPP
h. Using touch or pen directly with information (Check one for each type of
technology.)
Type 1 2 3 4 5
IWB
MIWB
IWBAPP

176
i. Use of multimedia: i.e. audio/video/images/text (Check one for each type of
technology.)
Type 1 2 3 4 5
IWB
MIWB
IWBAPP
j. Manipulating objects on boards (Check one for each type of technology.)
Type 1 2 3 4 5
IWB
MIWB
IWBAPP
8. Please rate the levels of importance of the following features in improving your learning.
(1-low, 5-high)
a. Larger Display (Check one for each type of technology.)
Type 1 2 3 4 5
IWB
MIWB
IWBAPP
b. Interactive activities (Check one for each type of technology.)
Type 1 2 3 4 5
IWB
MIWB
IWBAPP
c. Using touch or pen directly with information (Check one for each type of
technology.)
Type 1 2 3 4 5
IWB
MIWB
IWBAPP
d. Use of multimedia (audio/video/images/text) (Check one for each type of
technology.)
Type 1 2 3 4 5
IWB
MIWB
IWBAPP
e. Manipulating objects on boards (Check one for each type of technology.)
Type 1 2 3 4 5
IWB
MIWB
IWBAPP

177
9. I would want to teach another course that uses each type of technology. (Check one for
each type of technology.)
Strongly Neither Agree Strongly
Disagree Disagree nor Disagree Agree Agree
Type 1 2 3 4 5
IWB
MIWB
IWBAPP
No IWB
10. The information presented on the listed technologies meets my needs. (Check one for each
type of technology.)
Strongly Neither Agree Strongly
Disagree Disagree nor Disagree Agree Agree
Type 1 2 3 4 5
IWB
MIWB
IWBAPP
No IWB
11. The listed technology is a useful instructional tool. (Check one for each type of
technology.)
Strongly Neither Agree Strongly
Disagree Disagree nor Disagree Agree Agree
Type 1 2 3 4 5
IWB
MIWB
IWBAPP
No IWB
12. The listed technology improved my teaching experience. (Check one for each type of
technology.)
Strongly Neither Agree Strongly
Disagree Disagree nor Disagree Agree Agree
Type 1 2 3 4 5
IWB
MIWB
IWBAPP
No IWB

178
13. The listed technology is user friendly and easy to use. (Check one for each type of
technology.)
Strongly Neither Agree Strongly
Disagree Disagree nor Disagree Agree Agree
Type 1 2 3 4 5
IWB
MIWB
IWBAPP
No IWB
14. I am satisfied with the listed technology. (Check one for each type of technology.)
Strongly Neither Agree Strongly
Disagree Disagree nor Disagree Agree Agree
Type 1 2 3 4 5
IWB
MIWB
IWBAPP
No IWB
15. I would like to see the listed technology used more. (Check one for each type of
technology.)
Strongly Neither Agree Strongly
Disagree Disagree nor Disagree Agree Agree
Type 1 2 3 4 5
IWB
MIWB
IWBAPP
No IWB
16. I enjoy using the listed technology. (Check one for each type of technology.)
Strongly Neither Agree Strongly
Disagree Disagree nor Disagree Agree Agree
Type 1 2 3 4 5
IWB
MIWB
IWBAPP
No IWB
17. The listed technology use in my class has increased student involvement in this class.
(Check one for each type of technology.)
Strongly Neither Agree Strongly
Disagree Disagree nor Disagree Agree Agree
Type 1 2 3 4 5
IWB
MIWB
IWBAPP
No IWB
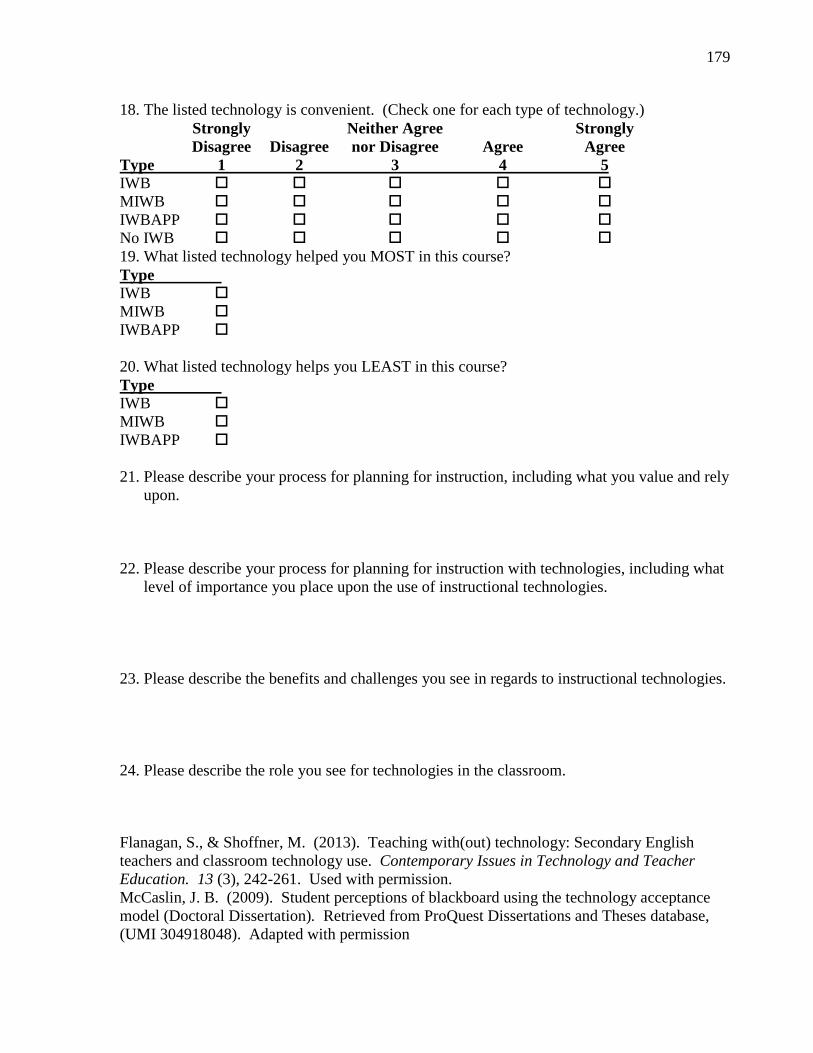
179
18. The listed technology is convenient. (Check one for each type of technology.)
Strongly Neither Agree Strongly
Disagree Disagree nor Disagree Agree Agree
Type 1 2 3 4 5
IWB
MIWB
IWBAPP
No IWB
19. What listed technology helped you MOST in this course?
Type
IWB
MIWB
IWBAPP
20. What listed technology helps you LEAST in this course?
Type
IWB
MIWB
IWBAPP
21. Please describe your process for planning for instruction, including what you value and rely
upon.
22. Please describe your process for planning for instruction with technologies, including what
level of importance you place upon the use of instructional technologies.
23. Please describe the benefits and challenges you see in regards to instructional technologies.
24. Please describe the role you see for technologies in the classroom.
Flanagan, S., & Shoffner, M. (2013). Teaching with(out) technology: Secondary English
teachers and classroom technology use. Contemporary Issues in Technology and Teacher
Education. 13 (3), 242-261. Used with permission.
McCaslin, J. B. (2009). Student perceptions of blackboard using the technology acceptance
model (Doctoral Dissertation). Retrieved from ProQuest Dissertations and Theses database,
(UMI 304918048). Adapted with permission

180
Appendix C
Student Questionnaire about Perceptions of Effectiveness of IWB / MIWB OR IWBAPP
1. What is your Study ID? (see cover page)_____________________
2. How many years have you had experience with the each type of technology
(IWB/MIWB/IWBAPP) in a class? (Check one for each type of technology.) Type Years 0 >0 to <1 1 2 >2
IWB
MIWB
IWBAPP
3. Approximately how many minutes per day did you or your teacher spend using the
technology during your lesson? (Check one for each type of technology.) Type Minutes 0 1-14 15-29 30-44 >45 or greater
IWB
MIWB
IWBAPP
4. Please list the order the technologies were used in your course during the study. (1 – first,
4 – fourth) Type 1st 2nd 3rd 4th
IWB
MIWB
IWBAPP
No IWB
5. Please indicate how often you used the following features of each type of technology.
(1=never, 2-rarely, 3 sometimes, 4-regularly, 5-often)
a. Larger Display (Check one for each type of technology.) Type 1 2 3 4 5
IWB
MIWB
IWBAPP
b. Interactive activities (Check one for each type of technology.) Type 1 2 3 4 5
IWB
MIWB
IWBAPP

181
c. Using touch or pen directly with information (Check one for each type of
technology.) Type 1 2 3 4 5
IWB
MIWB
IWBAPP
d. Use of multimedia: i.e. audio/video/images/text (Check one for each type of
technology.) Type 1 2 3 4 5
IWB
MIWB
IWBAPP
e. Manipulating objects on boards (Check one for each type of technology.) Type 1 2 3 4 5
IWB
MIWB
IWBAPP
6. Please rate the effectiveness of the following features for the class. (1-low, 5, high)
a. Larger Display (Check one for each type of technology) Type 1 2 3 4 5
IWB
MIWB
IWBAPP
b. Interactive activities (Check one for each type of technology.) Type 1 2 3 4 5
IWB
MIWB
IWBAPP
c. Using touch or pen directly with information (Check one for each type of
technology.) Type 1 2 3 4 5
IWB
MIWB
IWBAPP

182
d. Use of multimedia: i.e. audio/video/images/text (Check one for each type of
technology.) Type 1 2 3 4 5
IWB
MIWB
IWBAPP
e. Manipulating objects on boards (Check one for each type of technology.) Type 1 2 3 4 5
IWB
MIWB
IWBAPP
7. Please rate the levels of importance of the following features in improving your learning.
(1-low, 5-high)
a. Larger Display (Check one for each type of technology.) Type 1 2 3 4 5
IWB
MIWB
IWBAPP
b. Interactive activities (Check one for each type of technology.) Type 1 2 3 4 5
IWB
MIWB
IWBAPP
c. Using touch or pen directly with information (Check one for each type of
technology.) Type 1 2 3 4 5
IWB
MIWB
IWBAPP
d. Use of multimedia (audio/video/images/text) (Check one for each type of
technology.) Type 1 2 3 4 5
IWB
MIWB
IWBAPP
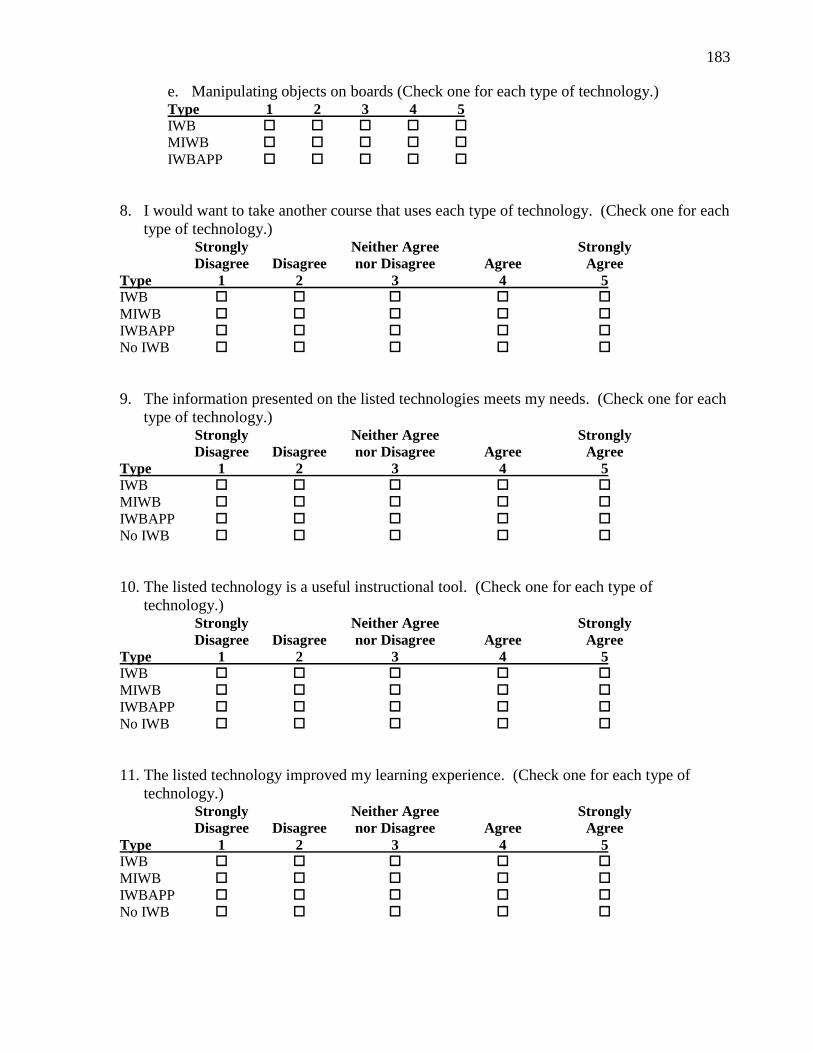
183
e. Manipulating objects on boards (Check one for each type of technology.) Type 1 2 3 4 5
IWB
MIWB
IWBAPP
8. I would want to take another course that uses each type of technology. (Check one for each
type of technology.) Strongly Neither Agree Strongly
Disagree Disagree nor Disagree Agree Agree
Type 1 2 3 4 5
IWB
MIWB
IWBAPP
No IWB
9. The information presented on the listed technologies meets my needs. (Check one for each
type of technology.) Strongly Neither Agree Strongly
Disagree Disagree nor Disagree Agree Agree
Type 1 2 3 4 5
IWB
MIWB
IWBAPP
No IWB
10. The listed technology is a useful instructional tool. (Check one for each type of
technology.) Strongly Neither Agree Strongly
Disagree Disagree nor Disagree Agree Agree
Type 1 2 3 4 5
IWB
MIWB
IWBAPP
No IWB
11. The listed technology improved my learning experience. (Check one for each type of
technology.) Strongly Neither Agree Strongly
Disagree Disagree nor Disagree Agree Agree
Type 1 2 3 4 5
IWB
MIWB
IWBAPP
No IWB
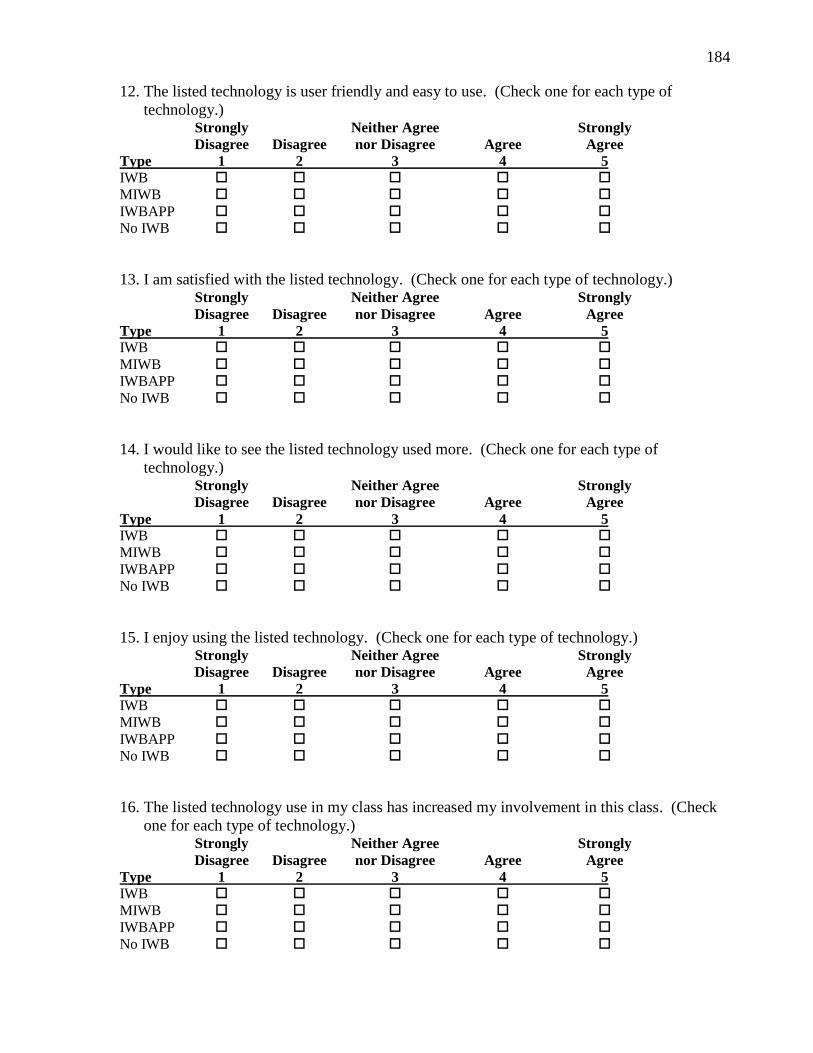
184
12. The listed technology is user friendly and easy to use. (Check one for each type of
technology.) Strongly Neither Agree Strongly
Disagree Disagree nor Disagree Agree Agree
Type 1 2 3 4 5
IWB
MIWB
IWBAPP
No IWB
13. I am satisfied with the listed technology. (Check one for each type of technology.) Strongly Neither Agree Strongly
Disagree Disagree nor Disagree Agree Agree
Type 1 2 3 4 5
IWB
MIWB
IWBAPP
No IWB
14. I would like to see the listed technology used more. (Check one for each type of
technology.) Strongly Neither Agree Strongly
Disagree Disagree nor Disagree Agree Agree
Type 1 2 3 4 5
IWB
MIWB
IWBAPP
No IWB
15. I enjoy using the listed technology. (Check one for each type of technology.) Strongly Neither Agree Strongly
Disagree Disagree nor Disagree Agree Agree
Type 1 2 3 4 5
IWB
MIWB
IWBAPP
No IWB
16. The listed technology use in my class has increased my involvement in this class. (Check
one for each type of technology.) Strongly Neither Agree Strongly
Disagree Disagree nor Disagree Agree Agree
Type 1 2 3 4 5
IWB
MIWB
IWBAPP
No IWB

185
17. The listed technology is convenient. (Check one for each type of technology.) Strongly Neither Agree Strongly
Disagree Disagree nor Disagree Agree Agree
Type 1 2 3 4 5
IWB
MIWB
IWBAPP
No IWB
18. What listed technology helped you MOST in this course? Type
IWB
MIWB
IWBAPP
19. What listed technology helps you LEAST in this course? Type
IWB
MIWB
IWBAPP
McCaslin, J. B. (2009). Student perceptions of blackboard using the technology acceptance model
(Doctoral Dissertation). Retrieved from ProQuest Dissertations and Theses database, (UMI
304918048). Adapted with permission

186
Appendix D
Pre- and Post-Assessments
Name: ___________________________________ Transformations Pre-Test Part 1: Translations

187

188

189
9. Use the preimage AB to answer the following questions.
a. Plot the coordinates of A’ and B’ under the
translation T(x,y) (x+5, y-2).
b. Find the length of AB (rounded to the nearest tenth) _________
c. What do you know about the length of A’B’? Explain.
_____________________________________________________________________________
______________
10. Given the translation T(x,y) (x-4, y+1), find
a. the image of (2, -1) _________________
b. the preimage of (3,4) ________________

190
Part 2: Reflections

191

192

193
Part 3: Dilations
____ 1. The dashed-lined figure is a dilation image of the solid-lined figure. Is the
dilation an enlargement, or a reduction? What is the scale factor of the dilation?
A.
; reduction C. 6; enlargement
B. 3; enlargement D. 3; reduction
____ 2. The dashed-lined triangle is a dilation image of the solid-lined triangle. Is the
dilation an enlargement or a reduction? What is the scale factor of the dilation?
4 8–4–8 x
4
8
–4
–8
y

194
A. enlargement; 2 B. reduction; 2 C.
reduction; D.
reduction;
____ 3. The dashed triangle is a dilation image of the solid triangle. What is the scale
factor?
A.
B.
C.
D. 2
____ 4. A blueprint for a house has a scale of 1 : 10. A wall in the blueprint is 7 in.
What is the length of the actual wall?
A. 70 feet B. 5.83 in. C. 840 feet D. 5.83 feet
____ 5. A microscope shows you an image of an object that is 200 times the object’s
actual size. So the scale factor of the enlargement is 200. An insect has a body length of 9
millimeters. What is the body length of the insect under the microscope?
4 8–4–8 x
4
8
–4
–8
y
4 8–4–8 x
4
8
–4
–8
y

195
A. 1,800 centimeters C. 180 millimeters
B. 18,000 millimeters D. 1,800 millimeters
6. The dashed-lined figure is a dilation image of the solid-lined figure. Is the
dilation an enlargement, or a reduction? What is the scale factor of the dilation?
7. The dashed-lined triangle is a dilation image of the solid-lined triangle. Is the dilation an
enlargement or a reduction? What is the scale factor of the dilation?
8. The dashed triangle is a dilation image of the solid triangle. What is the scale
factor?
4 8–4–8 x
4
8
–4
–8
y
4 8–4–8 x
4
8
–4
–8
y

196
9. A blueprint for a house has a scale of 1 : 20. A wall in the blueprint is 4 in.
What is the length of the actual wall?
10. What are the images of the vertices of for a dilation with center (0, 0) and scale
factor 2? Graph the
image of .
4 8–4–8 x
4
8
–4
–8
y

197
Part 4: Symmetry
____ 1. Which letter has at least one line of symmetry?
a. F b. W c. Z d. S
____ 2. How many lines of symmetry does the figure have?
a. 3 b. 2 c. 1 d. 0
____ 3. Which letter has rotational symmetry?
a. S b. D c. L d. U
A
B
C
4 8–4–8 x
4
8
–4
–8
y
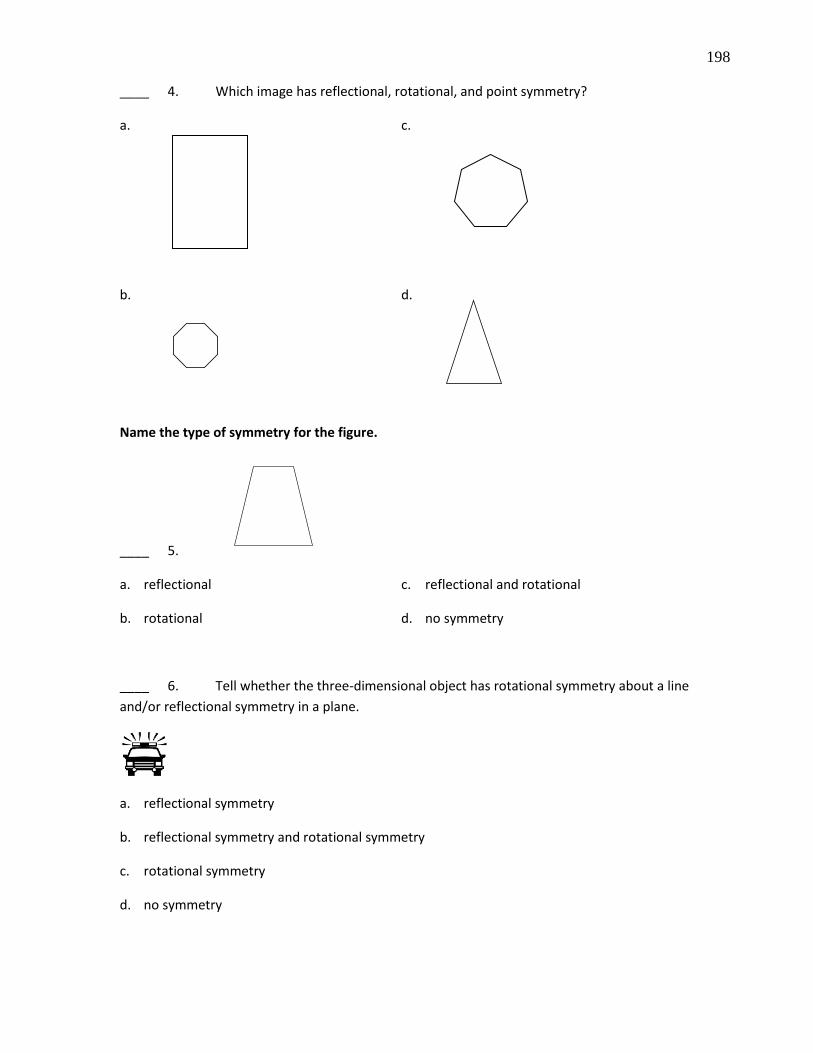
198
____ 4. Which image has reflectional, rotational, and point symmetry?
a.
c.
b.
d.
Name the type of symmetry for the figure.
____ 5.
a. reflectional c. reflectional and rotational
b. rotational d. no symmetry
____ 6. Tell whether the three-dimensional object has rotational symmetry about a line
and/or reflectional symmetry in a plane.
a. reflectional symmetry
b. reflectional symmetry and rotational symmetry
c. rotational symmetry
d. no symmetry

199
____ 7. Tell whether the three-dimensional object has rotational symmetry about a line
and/or reflectional symmetry in a plane.
a. reflectional symmetry
b. reflectional symmetry and rotational symmetry
c. rotational symmetry
d. no symmetry
8. Does the tessellation have reflectional symmetry? Explain.
9. Tell what type(s) of symmetry the figure has. If it has line symmetry, sketch the line(s) of
symmetry. If it has rotational symmetry, tell the angle of rotation.
10. Determine how many lines of symmetry a square has. Include a sketch to support your answer

200
Post-Assessment
Name: ____________________
Multiple Choice
Identify the choice that best completes the statement or answers the question.
____ 1. Which of these transformations are isometries?
(I) parallelogram EFGH parallelogram XWVU
(II) hexagon CDEFGH hexagon YXWVUT
(III) triangle EFG triangle VWU
a. I only b. II and III only c. I and III only d. I, II, and III
In the diagram, figure RQTS is the image of figure DEFC.
____ 2. Name the image of .
a. b. c. d.
____ 3. What translation rule can be used to describe the result of the composition of
and ?
C
D
F
E
T
S
R
S
R
Q

201
a. c.
b. d.
____ 4. What image is the translation of given by the translation rule ?
a.
c.
b.
d.
A
BC 8–8 x
8
–8
y
A
BCA'
B'C'
8–8 x
8
–8
y
A
BC
A'
B'C'
8–8 x
8
–8
y
A
BC
A'
B'C'
8–8 x
8
–8
y
A
BC
A'
B'C'
8–8 x
8
–8
y

202
Use the diagram.
____ 5. Find the translation rule that describes the translation B D.
a. c.
b. d.
____ 6. Describe in words the translation represented by the
translation rule .
a. 4 units to the right and 2 units up
b. 4 units to the right and 2 units down
c. 4 units to the left and 2 units up
d. 2 units to the left and 4 units up
____ 7. Use a translation rule to describe the translation that is 2 units to the left and 6 units up.
a. c.
b. d.
____ 8. What is a rule that describes the translation ?
a. c.
b. d.
9. Use the preimage AB to answer the following questions.
d. Plot the coordinates of A’ and B’ under the
translation T(x,y) (x+4, y-1).
e. Find the length of AB (rounded to the nearest tenth) _________
AB
C
D
A'B'
C'
D'
8–8 x
8
–8
y
A
B
C
D
E
4 8–4–8 x
4
8
–4
–8
y

203
f. What do you know about the length of A’B’? Explain.
10. Given the translation T(x,y) (x-3, y+4), find
a. the image of (3, -4) _________________
b. the preimage of (1,2) ________________
____ 1. Which of these transformations are isometries?
(I) parallelogram EFGH parallelogram XWVU
(II) hexagon CDEFGH hexagon YXWVUT
(III) triangle EFG triangle VWU
a. I only b. II and III only c. I and III only d. I, II, and III
____ 2. Write a rule to describe the transformation that is a reflection across the y-axis.
a. (x, y) (–x, y) c. (x, y) (y, x)
b. (x, y) (x, –y) d. (x, y) (–x, –y)
____ 3. The vertices of a triangle are P(3, –6), Q(–4, –5), and R(4, 6). Name the vertices of the image reflected
across the line y = x.
a.
c.
b.
d.
____ 4. The vertices of a triangle are P(8, 7), Q(–1, –1), and R(4, 3). Name the vertices of the image reflected
across the x-axis.
a.
c.
b.
d.
____ 5. The vertices of a triangle are P(–3, –5), Q(5, –5), and R(–8, –6). Name the vertices of the image
reflected across the y-axis.

204
a.
c.
b.
d.
____ 6. Write a rule to describe the transformation that is a reflection across the x-axis.
a. (x, y) (–x, y) c. (x, y) (x, –y)
b. (x, y) (y, x) d. (x, y) (–x, –y)
____ 7. Which graph shows a triangle and its reflection image in the x-axis?
a.
c.
b.
d.
2 4–2–4 x
2
4
–2
–4
y

205
Short Answer
8. Graph points A(1, 4), B(5, 3), and C(1, 1). Graph image of reflected across the line y -axis
Write the coordinates of A’(___,___), B’(___,___), C’(___,___).
9. Draw the image of reflected across the y=x. Graph the image and give the coordinates A’
(___,___), B’(___,___), C’(___,___)
10. Find the image of C first reflected across line l, then across line m.
C
A
B
2 4–2–4 x
2
4
–2
–4
y

206
____ 1. Which letter has at least one line of symmetry?
a. G b. J c. L d. B
____ 2. How many lines of symmetry does the figure have?
a. 3 b. 2 c. 1 d. 0
____ 3. Which letter has rotational symmetry?
a. R b. I c. J d. B
____ 4. Which image has reflectional, rotational, and point symmetry?
a.
c.

207
b.
d.
Name the type of symmetry for the figure.
____ 5.
a. reflectional c. reflectional and rotational
b. rotational d. no symmetry
____ 6. Tell whether the three-dimensional object has rotational symmetry about a line and/or reflectional
symmetry in a plane.
a. reflectional symmetry
b. reflectional symmetry and rotational symmetry
c. rotational symmetry
d. no symmetry
____ 7. Tell whether the three-dimensional object has rotational symmetry about a line and/or reflectional
symmetry in a plane.
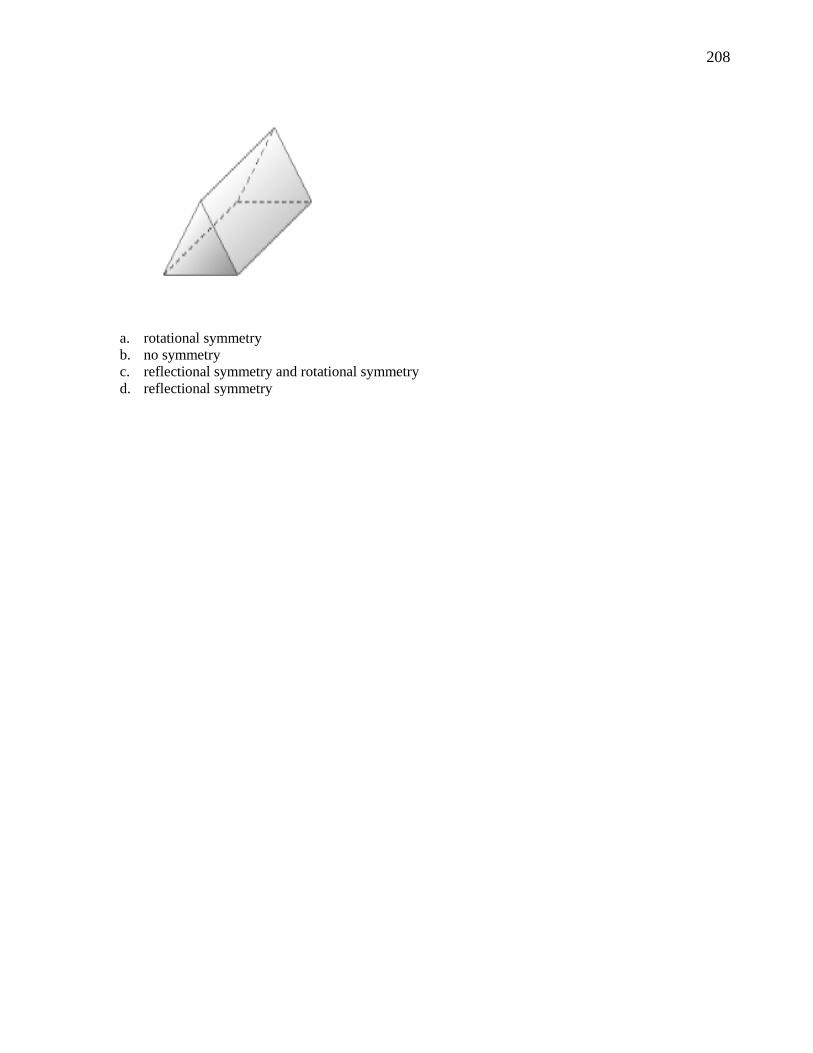
208
a. rotational symmetry
b. no symmetry
c. reflectional symmetry and rotational symmetry
d. reflectional symmetry

209
Short Answer
8. Does the tessellation have reflectional symmetry? Explain.
9. Tell what type(s) of symmetry the figure has. If it has line symmetry, sketch the line(s) of symmetry.
If it has rotational symmetry, tell the angle of rotation.
10. Determine how many lines of symmetry a rectangle has. Include a sketch to support your answer.
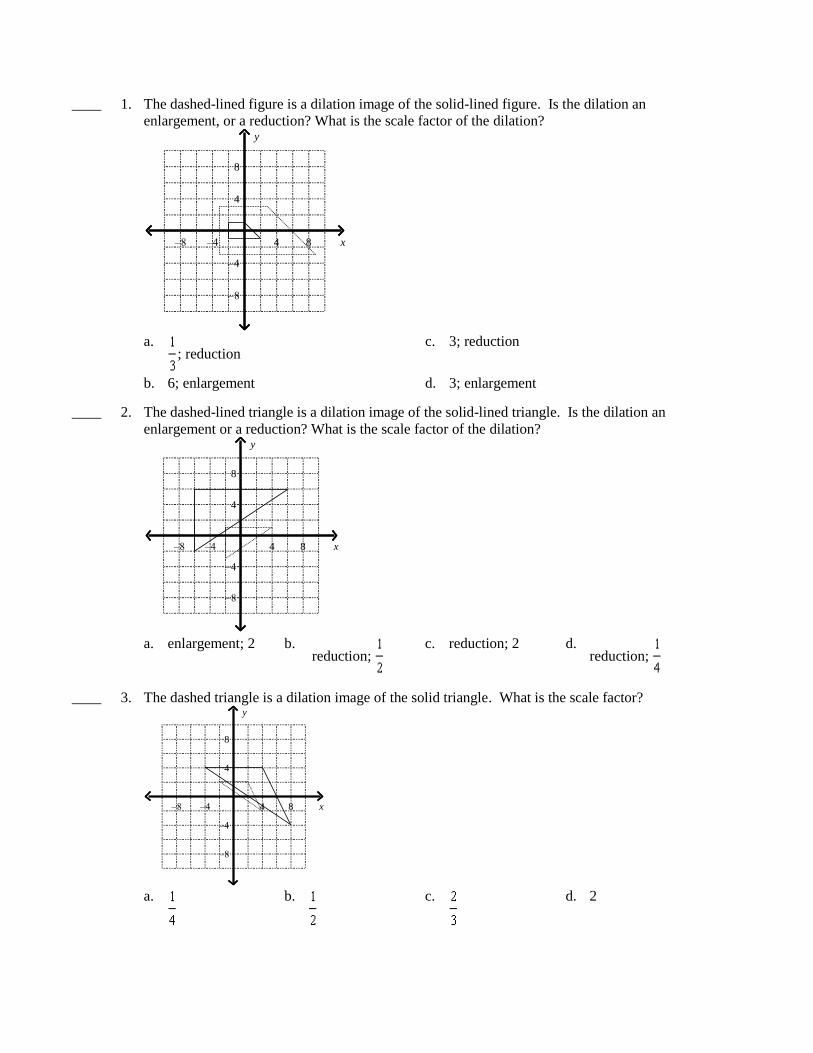
____ 1. The dashed-lined figure is a dilation image of the solid-lined figure. Is the dilation an
enlargement, or a reduction? What is the scale factor of the dilation?
a.
; reduction c. 3; reduction
b. 6; enlargement d. 3; enlargement
____ 2. The dashed-lined triangle is a dilation image of the solid-lined triangle. Is the dilation an
enlargement or a reduction? What is the scale factor of the dilation?
a. enlargement; 2 b.
reduction; c. reduction; 2 d.
reduction;
____ 3. The dashed triangle is a dilation image of the solid triangle. What is the scale factor?
a.
b.
c.
d. 2
4 8–4–8 x
4
8
–4
–8
y
4 8–4–8 x
4
8
–4
–8
y
4 8–4–8 x
4
8
–4
–8
y

211
____ 4. A blueprint for a house has a scale of 1 : 10. A wall in the blueprint is 4 in. What is the length of
the actual wall?
a. 3.33 in. b. 40 feet c. 3.33 feet d. 480 feet
____ 5. A microscope shows you an image of an object that is 180 times the object’s actual size. So the
scale factor of the enlargement is 180. An insect has a body length of 9 millimeters. What is the
body length of the insect under the microscope?
a. 16,200 millimeters c. 1,620 millimeters
b. 1,620 centimeters d. 162 millimeters
Short Answer
6. The dashed-lined figure is a dilation image of the solid-lined figure. Is the dilation an
enlargement, or a reduction? What is the scale factor of the dilation?
7. The dashed-lined triangle is a dilation image of the solid-lined triangle. Is the dilation an
enlargement or a reduction? What is the scale factor of the dilation?
4 8–4–8 x
4
8
–4
–8
y
4 8–4–8 x
4
8
–4
–8
y

212
8. The dashed triangle is a dilation image of the solid triangle. What is the scale factor?
9. A blueprint for a house has a scale of 1 : 20. A wall in the blueprint is 8 in. What is the length of
the actual wall?
10. A microscope shows you an image of an object that is 200 times the object’s actual size. So the
scale factor of the enlargement is 200. An insect has a body length of 5 millimeters. What is the body length
of the insect under the microscope?
4 8–4–8 x
4
8
–4
–8
y

213
Appendix E
214

215
216
Appendix F

217

218

219
Appendix G
220
221
Appendix H
Permissions to Use and Publish Study Instruments / Assessments
1. Permission for Survey Instrument (see Appendix A)
Re: Permission request to utilize and adapt survey instrument items
Schipper, Joseph Michael
Mon 4/20/2015 10:06 AM
Sent Items
To: Yalin Kilic Turel <[email protected]>;
Thanks so much for this. My university wanted specific permission for publication, and I
think your reply will be sufficient. If by some chance it is not, I will send you back a
draft letter. Hopefully we are good now and I will be able to move forward with
publication.
I will be sending you an electronic copy of both the dissertation and the journal article
based on this study as soon as they are accepted for publishing.
Have a great day.
Joe
________________________________________
From: Yalin Kilic Turel <[email protected]>
Sent: Monday, April 20, 2015 2:36 AM
To: Schipper, Joseph Michael
Subject: Re: Permission request to utilize and adapt survey instrument items
Hi Joseph,
I have already given permission to use the instrument in anyway you want. If you need a
special permission letter please send me a draft so that I can, if neccessary, modify and
sign and send it to you.
Good luck!
Yalın
2015-04-17 21:40 GMT+03:00 Schipper, Joseph Michael <[email protected]>:
Dr. Turel,
Thank you again for allowing me to a modified version of your IWBSS on a survey
instrument used in my dissertation. I have successfully conducted the study and defended
the dissertation. I am now in the process of publishing it, and my university would like
me to ensure that I have your permission to reproduce the instruments that use your

222
modified survey. I noted that the items were used with your permission on the
instrument, now I will need your permission in order to publish the dissertation.
Again, thank you so very much for allowing me to use them in my study and I look
forward to hearing from you. Once I have completed my journal article based on the
study, I would be glad to forward a copy to you.
Joe Schipper
________________________________________
From: Yalin Kilic Turel <[email protected]>
Sent: Friday, May 16, 2014 1:16 PM
To: Schipper, Joseph Michael
Subject: Re: Permission request to utilize and adapt survey instrument items
Hi Joseph,
You can freely use and modify my instrument for your dissertation.
Good luck with your study.
Please let me off you need further help.
Best,
YALIN
16 May 2014 19:53 tarihinde "Schipper, Joseph Michael" <[email protected]>
yazdı:
Dear Dr. Türel,
I am a doctoral student from Liberty University writing my dissertation tentatively titled
"Interactive Whiteboard Technologies: A Quantitative, Quasi-Experimental Comparison
of their Impact on the Levels off Measure that Determine a Return on Investment" under
the direction of my dissertation committee chaired by Dr. R. Yocum. During my
literature review I came across your 2011 article "An interactive whiteboard student
survey: Development, validity and reliability".
I am asking permission to utilize the table 5 items as a survey instrument in my
dissertation.
I also am asking to minimally modify all the items either by replacing the acronym IWB
with MIWB (for mobile interactive whiteboard) or IWBAPP (for Interactive Whiteboard
App) as I am comparing three different types of IWB technology.
Finally I am requesting permission to minimally modify items 5, 9, 10 and 12 by
removing the word "more" from the items. The reason for this was based on feedback
from a member of my dissertation committee to avoid leading respondent toward a
positive outcome.
I would like to use your work under the following conditions:
223
• I will use the survey items only for my research study and will not sell or use it
with any compensated development activities.
• I will include an acknowledgement statement of your work on all copies of the
instrument.
• I will send my research study and one copy of reports, articles, and the like that
make use of these survey data promptly to your attention.
The expected date of completion for my study is June 2015.
If these are acceptable terms and conditions, please indicate so by reply to this e-mail. If
you have any questions or require additional information please let me know.
I was very excited to find your study on your survey instrument and look forward to the
findings it will provide in my research.
Sincerely,
Joseph Schipper
Doctoral Candidate
Liberty University
Lynchburg, Virginia
USA
--
********************************************
Yalin Kilic TUREL, PhD
Associate Professor
Firat University, College of Education
Dept. Head of Computer Education & Instructional Technologies
Elazig / TURKIYE
Doç. Dr. Yalın Kılıç TÜREL
Fırat Üniversitesi, Eğitim Fakültesi
Bilgisayar ve Öğretim Teknolojileri Eğitimi Bölüm Başkanı
Elazığ / TÜRKİYE
2. Permission for Survey Instrument (see Appendix B)
Re: Permission request to utilize response categories for basis of survey questions
Schipper, Joseph Michael
Mon 4/20/2015 10:06 AM
Sent Items
To: Flanagan, Sara M <[email protected]>;
Cc: [email protected] <[email protected]>;
Thanks so much for this. My university wanted specific permission for publication, and I
think your reply will be sufficient. If by some chance it is not, I will send you back a
draft letter. Hopefully we are good now and I will be able to move forward with
publication.
224
I will be sending you an electronic copy of both the dissertation and the journal article
based on this study as soon as they are accepted for publishing.
Have a great day.
Joe
________________________________________
From: Flanagan, Sara M <[email protected]>
Sent: Friday, April 17, 2015 10:48 PM
To: Schipper, Joseph Michael
Subject: Re: Permission request to utilize response categories for basis of survey
questions
That is fine with me! Do you need an official letter?
----
Sara Flanagan, Ph.D.
Assistant Professor
University of Kentucky
Department of Early Childhood, Special Education, and Rehabilitation Counseling
229 Taylor Education Building
Lexington, KY 40506
859.257.4713
Sent from my iPad
On Apr 17, 2015, at 2:34 PM, Schipper, Joseph Michael <[email protected]>
wrote:
Drs. Flanagan and Shoffner,
Thank you again for allowing me to use your categories to create questions for a survey
instrument used in my dissertation. I have successfully conducted the study and defended
the dissertation. I am now in the process of publishing it, and my university would like
me to ensure that I have your permission to reproduce the instruments that use your
categories. I noted that the categories were used with your permission on the instrument,
now I will need your permission in order to publish the dissertation.
Again, thank you so very much for allowing me to use them in my study and I look
forward to hearing from you.
Joe Schipper
________________________________________
From: Flanagan, Sara M <[email protected]>

225
Sent: Monday, October 20, 2014 3:21 PM
To: Schipper, Joseph Michael
Subject: RE: Permission request to utilize response categories for basis of survey
questions
Hi Joseph,
You are more than welcome to use those categories from the paper. Please let me know if
you have any questions about it.
Have a great day,
Sara Flanagan
________________________________________
From: Schipper, Joseph Michael [[email protected]]
Sent: Monday, October 20, 2014 1:19 PM
To: Flanagan, Sara M; [email protected]
Subject: Permission request to utilize response categories for basis of survey questions
Dear Drs. Flanagan and Shoffner,
I am a doctoral student from Liberty University writing my dissertation tentatively titled
"Interactive Whiteboard Technologies: A Quantitative, Quasi-Experimental Comparison
of their Impact on the Levels of Measure that Determine a Return on Investment" under
the direction of my dissertation committee chaired by Dr. R. Yocum. During my
literature review I came across your 2013 article "Teaching with(out) technology:
Secondary English Teachers and Classroom Technology Use”.
I am asking permission to utilize your five response categories as a basis for a portion of
a survey instrument in my dissertation.
In my study I am comparing three different types of interactive whiteboard technologies.
I will be utilizing a survey with faculty participants that will include questions that ask
for their experiences in working with the technologies.
I would like to use your work under the following conditions:
• I will use the survey items based on your categories only for my research study
and will not sell or use it with any compensated development activities.
• I will include an acknowledgement statement of your work on all copies of the
instrument and in the dissertation, as well as any articles written based on the findings.
The expected date of completion for my study is May 2015.
If these are acceptable terms and conditions, please indicate so by reply to this e-mail. If
you have any questions or require additional information please let me know.
I was very excited to find your study and look forward to the data based on your
categories will provide in my research.

226
Sincerely,
Joseph Schipper
Doctoral Candidate
Liberty University
Lynchburg, Virginia
USA
3. Permission for Survey Instrument (see Appendices B and C)
Re: Permission request to utilize and adapt survey instrument items
McCaslin, James B (Southcentral) <[email protected]>
Fri 4/17/2015 2:46 PM
Inbox
To: Schipper, Joseph Michael <[email protected]>;
Congratulations, Dr. Schipper!
I am happy to provide my permission so that you can publish your dissertation. I look
forward to reading it.
Thanks,
Dr. J
Dr. James B. McCaslin
Vice President of Outreach and Community Development
Southcentral Kentucky Community & Technical College
175 Davis Drive
Franklin, KY 42134-6222
(270) 901-1104
Sent from my iPad
On Apr 17, 2015, at 1:37 PM, Schipper, Joseph Michael <[email protected]>
wrote:
Dr. McCaslin,
Thank you again for allowing me to a modified version of your Appendix A items on a
survey instrument used in my dissertation. I have successfully conducted the study and
defended the dissertation. I am now in the process of publishing it, and my university
would like me to ensure that I have your permission to reproduce the instruments that use
your items. I noted that the items were used with your permission on the instrument, now
I will need your permission in order to publish the dissertation.
Again, thank you so very much for allowing me to use them in my study and I look
forward to hearing from you. Once I have completed my journal article based on the
study, I would be glad to forward a copy to you.
227
Joe Schipper
________________________________________
From: McCaslin, James B (Southcentral) <[email protected]>
Sent: Wednesday, July 9, 2014 12:47 PM
To: Schipper, Joseph Michael
Subject: Re: Permission request to utilize and adapt survey instrument items
Greetings, Mr. Schipper,
Your proposed study seems particularly relevant to today's instructional technology
landscape. I would be happy for you to modify the survey instrument as you and your
Chair deem appropriate. Once your inquiry is complete, I would very much like to see
your results.
Best of luck to you,
Dr. J
Dr. James B. McCaslin
Vice President of Outreach and Community Development
Southcentral Kentucky Community & Technical College
175 Davis Drive
Franklin, KY 42134-6222
(270) 901-1104
Sent from my iPad
On Jul 8, 2014, at 9:32 AM, "Schipper, Joseph Michael" <[email protected]>
wrote:
Dear Dr. McCaslin,
I am a doctoral student from Liberty University writing my dissertation tentatively titled
"Interactive Whiteboard Technologies: A Quantitative, Quasi-Experimental Comparison
of their Impact on the Levels of Measure that Determine a Return on Investment" under
the direction of my dissertation committee chaired by Dr. R. Yocum. During my
literature review I came across your 2009 dissertation "Student Perceptions of
Blackboard using the Technology Acceptance Model".
I am asking permission to utilize the Appendix A items as a survey instrument in my
dissertation.
I also am asking to modify many of the items either by replacing the type of technologies
with three specific forms of technology: the IWB, MIWB (for mobile interactive
whiteboard) or IWBAPP (for Interactive Whiteboard App). In my study I am comparing
three different types of IWB technology. I will also be utilizing this survey with faculty
and students for their perceptions.

228
I would like to use your work under the following conditions:
• I will use the survey items only for my research study and will not sell or use it
with any compensated development activities.
• I will include an acknowledgement statement of your work on all copies of the
instrument and in the dissertation and any articles written based on the findings.
The expected date of completion for my study is June 2015.
If these are acceptable terms and conditions, please indicate so by reply to this e-mail. If
you have any questions or require additional information please let me know.
I was very excited to find your study on your survey instrument and look forward to the
findings it will provide in my research.
Sincerely,
Joseph Schipper
Doctoral Candidate
Liberty University
Lynchburg, Virginia
USA

229
4. Permission for Assessment Instruments (see Appendix D)
Note: Signatures redacted to protect participant identities. Unredacted permission form
on file with researcher and available upon request.