intercell small cell protocol stack log viewer tool …
TRANSCRIPT

INTERCELL SMALL CELL PROTOCOL STACK LOG VIEWER TOOL GUIDE

Protocol stack User Guide Log Viewer Tool
Revision History
Revision Date Change DescriptionRev 1.0.0 11/12/15 Initial releaseRev 1.0.1 12/09/15 Add log server start/stopRev 1.0.2 05/09/16 Add log analyzer, update to 1.4.2

Protocol stack User Guide Log Viewer Tool
Table of Contents
Section 1: Introduction.......................................................................................................1Purpose and Scope........................................................................................................1Glossary of Terms..........................................................................................................2System overview............................................................................................................2
Section 2: Getting started..................................................................................................5Installation of Tool..........................................................................................................5Installation of wireshark..................................................................................................5Installation of Microsoft .NET Framework......................................................................5Firewall setting...............................................................................................................5
Section 3: Main User interface..........................................................................................6Main Tracer Window......................................................................................................7
Toolbar........................................................................................................................7File open.....................................................................................................................7Records Clear.............................................................................................................8File Save.....................................................................................................................8Filtering.......................................................................................................................8Search Tool..............................................................................................................10Excel-like column filtering.........................................................................................11Goto line...................................................................................................................12Line Mark..................................................................................................................12
Main Event Window.....................................................................................................12Main Event filter........................................................................................................13Main Event Message list..........................................................................................13UE specific Message list..........................................................................................13
Struct description Window...........................................................................................13Tree view of Message..............................................................................................14S1/X2/NAS Message decoder..................................................................................15User Graph...............................................................................................................15
Section 4: Log server.......................................................................................................16Functions of log server.................................................................................................16Start/Stop log server....................................................................................................17Options of the log server..............................................................................................17Configuration of the board...........................................................................................17Priority between ePerview and log server...................................................................18Open dump log file.......................................................................................................19Online filter setting.......................................................................................................19
Section 5: Cell status display...........................................................................................21Section 6: PM report........................................................................................................22Section 7: KPI analyze.....................................................................................................23
Functions of KPI analyze module................................................................................23KPI template management..........................................................................................23Check the KPI..............................................................................................................24Management of KPI test results...................................................................................27

Protocol stack User Guide Log Viewer Tool
Section 8: Log analyzer...................................................................................................28Functions of Log analyzer............................................................................................28Configuration of Log analyzer......................................................................................28
L2 Measurement configuration.................................................................................28Counter Measurement configuration........................................................................28
Report generation of Log analyzer..............................................................................30Online control of the analyzer......................................................................................31Offline control of the analyzer......................................................................................32
List of Tables
TABLE 1: GLOSSARY OF TERMS...........................................................................................................................2TABLE 2: PARAMETERS FOR THE TOOL CONNECTION..............................................................................18
List of Figures
FIGURE 1: SYSTEM ARCH OF EPERVIEW LOG VIEWER TOOL........................................................................3FIGURE 2: SOFT OVERVIEW OF THE TOOL..........................................................................................................4FIGURE 3: OVERVIEW OF LOG DLL........................................................................................................................4FIGURE 4: FIREWALL SETTING...............................................................................................................................5FIGURE 5: MAIN USER INTERFACE........................................................................................................................6FIGURE 6: FILTERING INTERFACE.........................................................................................................................8FIGURE 7: SIMPLE EXAMPLE OF REGEX EXPRESSION.....................................................................................9FIGURE 8: COMPLEX EXAMPLE OF REGEX EXPRESSION................................................................................9FIGURE 9: SEARCH STRING FROM THE DISPLAYED EVENT NAME/TRACE STRING...............................10FIGURE 10: SEARCH SPECIFIC FIELD FROM MESSAGE BUFFER...................................................................10FIGURE 11: COLUMN AND MESSAGE FILTERING............................................................................................12FIGURE 12: STRUCT DESCRIPTION WINDOW....................................................................................................14FIGURE 13: USER GRAPH EXAMPLE....................................................................................................................15FIGURE 14: LOG SERVER WINDOW......................................................................................................................16FIGURE 15: ONLINE FILTER SETTING..................................................................................................................19FIGURE 16: SAVE THE DEFAULT FILTER SETTING..........................................................................................20FIGURE 17: CELL STATUS DISPLAY.....................................................................................................................21FIGURE 18: GRAPH DISPLAY OF MULTI FIELDS...............................................................................................21FIGURE 19: PM REPORT ANALYZE WINDOW....................................................................................................22FIGURE 20: KPI TEMPLATE EXAMPLE.................................................................................................................23FIGURE 21: OPEN TEMPLATE FILE.......................................................................................................................23FIGURE 22: ADD A KPI ITEM..................................................................................................................................24FIGURE 23: RESULT OF THE KPI CHECK.............................................................................................................25FIGURE 24: BATCH ADD ITEMS.............................................................................................................................25FIGURE 25: LOG FOLDER EXAMPLE FOR BATCH PROCESS...........................................................................26FIGURE 26: KPI RESULT MANAGEMENT............................................................................................................27FIGURE 27: KPI RESULT SUMMARY.....................................................................................................................27FIGURE 28:L2 MEASUREMENT CONFIGURATION EXAMPLE........................................................................28FIGURE 29: STRING TYPE COUNTER CONFIGURATION EXAMPLE..............................................................29FIGURE 30: EVENT TYPE COUNTER CONFIGURATION EXAMPLE...............................................................29FIGURE 31: SEQUENCE TYPE COUNTER CONFIGURATION EXAMPLE.......................................................30FIGURE 32: FORMAT EXAMPLE OF REPORT FILE.............................................................................................30FIGURE 33: ONLINE SERVER SETTING................................................................................................................31FIGURE 34: OFFLINE ANALYZER WINDOW.......................................................................................................32

Protocol stack User Guide Log Viewer Tool
FIGURE 35: JUMP TO THE RECORD......................................................................................................................33

Protocol stack User Guide Log Viewer Tool
Section 1: Introduction
Purpose and Scope
This document describes the log viewer tool for the Intercell’s LTE small cell protocol stack software. The guide is intended to be used by customers who wish to evaluate Intercell’s LTE small cell protocol stack software and/or to develop around it. This document discusses all the components that make up the log viewer tool.
Note: the document is based the current version of the tool, in case of any contradiction between this document and the log viewer tool you have received from Intercell, please contact Intercell for the latest guide document.
Note: The log viewer tool is developed for the LTE protocol stack software, so for the customers who wish to evaluate and/or use Intercell LTE L1 software and hardware only, please use another tool named ePerview. And because the log file format is same, so the Tool can open the log file captured by the ePerview as well as vice versa.
Glossary of Terms
Table 1: Glossary of Terms
Term Description
LTE Long Term Evolution
PM performance management module of protocol stack
KPI Key Performance Indicator
PS Protocol Stack
ePerview Debug tool for BRCM LTE L1 software and hardware
NAS Non Access Stratum
S1 Interface between Femto cell and MME
X2 Interface between Femto cells
RRC Radio Resource Control
RLC Radio Link Control
MAC Medium Access Control
PDCP Packet Data Convergence Control
Wireshark free software to capture/analyze packet, it is used to decode theS1/X2/NAS/RRC message

Protocol stack User Guide Log Viewer Tool
System overview
The log viewer tool application enables debugging, monitoring and validating the Intercell LTE Femtocell Protocol stack and L1/DSP/PHY software/hardware. The application is referred to throughout the document as Tool.
The Tool runs on a Windows PC, is connected to the LTE Femto Cell board using an Ethernet connection. The Tool communicates to the log service thread which runs on the CPUH core within the BCM617xx Device.
The Tracer thread runs within CPUH and Tracer thread runs within CPUL collect the log and send the log to the log service thread, the log service thread then sends the log to the Tcp server within the Tool using TCP socket.
Figure 1: System arch of log viewer tool
The Tool application consists of five main modules:1. GUI module which displays all the user interface elements, such as Menu bar, tool bar,
tracer windows and status bar2. Log server module which listens the TCP port for CPUL tracer connection and CPUH tracer
connection. And the module manages multi TCP connections from different boards.3. Log auto save module which saves the log received from log server to local hard disk or FTP
server4. Log analyzer module which analyze the received log records and generate report according
to the pre-defined configuration

Protocol stack User Guide Log Viewer Tool
5. log decode DLL records all the information of message structure of PS/L1 and it provides themessage decode APIs to log view tool
Figure 2: Soft overview of the Tool
The log DLL is generated by the Struct parser application developed with C#. The parser application uses the C header files and Config files as inputs and outputs a XML file which contains the structure information of all the messages. Finally the XML file and the C# API source files are compiled into a single DLL file.
Figure 3: overview of Log DLL

Protocol stack User Guide Log Viewer Tool

Protocol stack User Guide Log Viewer Tool
Section 2: Getting started
Installation of Tool
No installer for the Tool, so just copy the release folder to the Windows PC, and run the ePerviewLogViewer.exe file under the release folder.
Multi versions can be run on one PC, no need to uninstall the old version.
Installation of wireshark
To decode the S1/X2/RRC/NAS message, please make sure Wireshark is installed on the PC. If no Wireshark installed, please download latest version from www.wireshark.org and install it on the PC.
Installation of Microsoft .NET Framework
The Tool needs the Microsoft .NET Framework 4.5 or later version. Please download from the Microsoft website and install it.
Firewall setting
The tool listens the TCP ports 7777/1111/5555 for CPUH, CPUL and Log analyzer. So make sure that the Tool is allowed to communicate through Windows Firewall.
Figure 4: firewall setting
Protocol stack User Guide Log Viewer Tool
Section 3: Main User interface
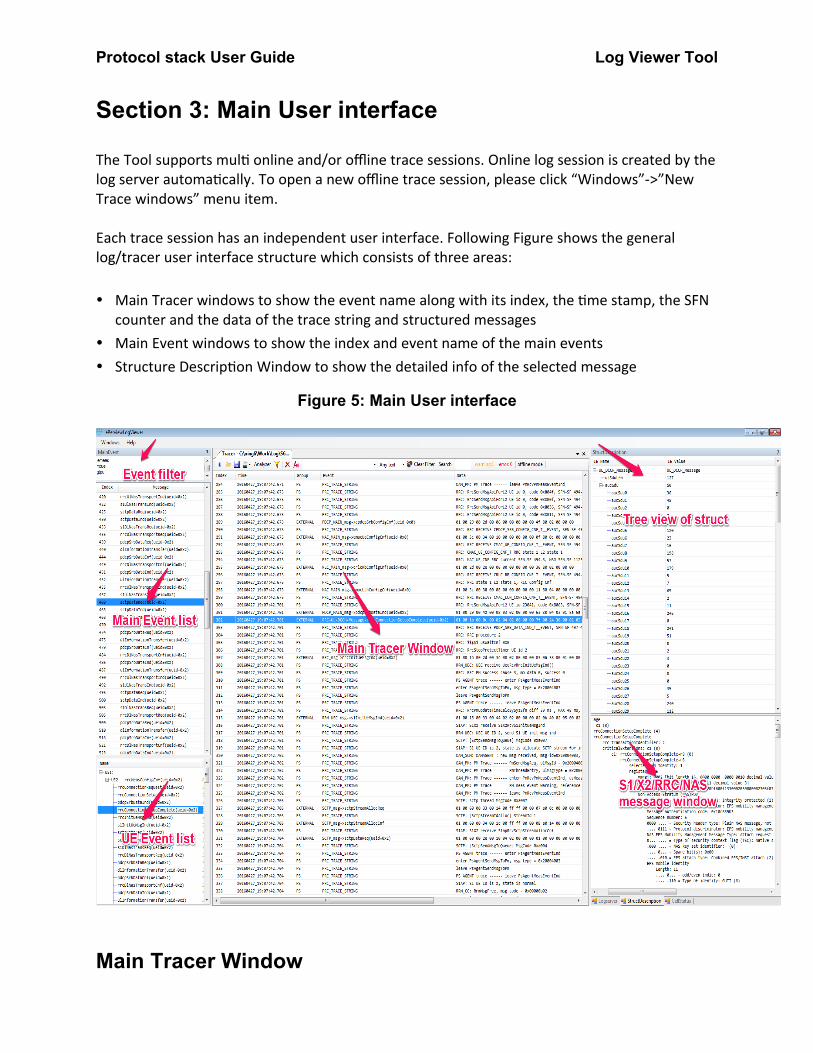
The Tool supports multi online and/or offline trace sessions. Online log session is created by thelog server automatically. To open a new offline trace session, please click “Windows”->”New Trace windows” menu item.
Each trace session has an independent user interface. Following Figure shows the general log/tracer user interface structure which consists of three areas:
Main Tracer windows to show the event name along with its index, the time stamp, the SFN counter and the data of the trace string and structured messages
Main Event windows to show the index and event name of the main events Structure Description Window to show the detailed info of the selected message
Figure 5: Main User interface
Main Tracer Window

Protocol stack User Guide Log Viewer Tool
This window is to display all the records included in the Trace/log files.
Toolbar
The tool bar of main tracer windows contains the following buttons:
Pause or resume online display, for online mode only
Open one or multi Trace files
Save trace records to a file
Open file from recent file list
Start offline Log analyzer
Offline filter button
Clear all records
Font setting
Filter select/input box
Filter option selection list
Clear Filter
Search button
Go to line number box
Warning numbers in the traces
Error numbers in the traces
Offline/online mode status
File open
There are three ways to open one or multi Trace files.1. Click the File open icon then select one or multi files2. Drop one or multi files to the Trace window3. Click the Recent file list icon then select one
The records of opened files will be appended to the end of the current record list.
Records Clear
To clear the current all records, clicking the Clear all button. It clear the displayed records only, the opened files are not cleared.

Protocol stack User Guide Log Viewer Tool
File Save
To save the records of current tracer window, clicking the File save button and select the file name from the File Save Dialog.
Filtering
The filtering tool supports to display the messages match the search text.
Figure 6: Filtering interface
The Clear button is to clear the filtering operation.The Filter input box can record max 24 history records.
Hotkey: Enter key
Three Filter options: Any Text: no any restriction Prefix: to search the string start from search text Regex: to search with Regex expression
Regex expression is very powerful for the string search. Its detailed guide is out of the scope of this document. Please find the reference of C# Regex expression from the following Microsoft URL: https://msdn.microsoft.com/en-us/library/az24scfc.aspx
Following are the simple examples: (req|cnf)$ find the messages end with "Req" or "Cnf" (req|cnf) find the messages contain "Req" or "Cnf"
Figure 7: simple example of Regex expression

Protocol stack User Guide Log Viewer Tool
Following is a complex example to filter the S1/X2 and DCCH message of ueid=0x2. (sctpDataReq\(ueid=0x2\)|sctpDataInd\(ueid=0x2\)|DCCH-Message.*\(ueid=0x2\))$
Figure 8: complex example of Regex expression
Search Tool
Protocol stack User Guide Log Viewer Tool
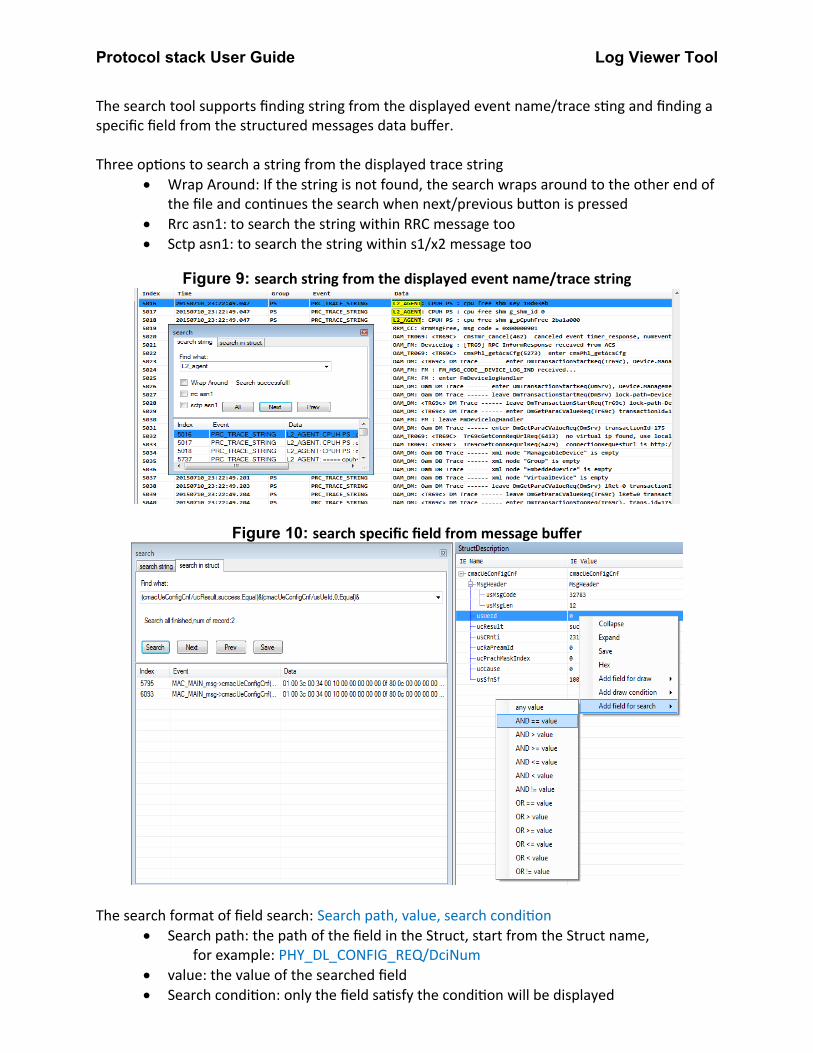
The search tool supports finding string from the displayed event name/trace sting and finding a specific field from the structured messages data buffer.
Three options to search a string from the displayed trace string Wrap Around: If the string is not found, the search wraps around to the other end of
the file and continues the search when next/previous button is pressed Rrc asn1: to search the string within RRC message too Sctp asn1: to search the string within s1/x2 message too
Figure 9: search string from the displayed event name/trace string
Figure 10: search specific field from message buffer
The search format of field search: Search path, value, search condition Search path: the path of the field in the Struct, start from the Struct name,
for example: PHY_DL_CONFIG_REQ/DciNum value: the value of the searched field Search condition: only the field satisfy the condition will be displayed

Protocol stack User Guide Log Viewer Tool
None : any value is ok, no condition Equal : == the selected value Greater : > the selected value GreaterEqual : >= the selected value LessEqual : <= the selected value Less : < the selected value NotEqual : != the selected value
And Search tool supports multi search fields within one Struct. Multi AND and OR conditions aresupported and all the OR conditions are treated as one AND condition. Only the messages that satisfy the conditions will be displayed. The AND condition ends with ‘&’ and OR condition ends with ‘|’. For example: (PHY_DL_CONFIG_REQ/DciNum,1,GreaterEqual)& (PHY_DL_CONFIG_REQ/SfnSf,3845,None)&
Note: The search Tool does not support to search the fields of different Structs.
Please add the search field from the tree list view window by following steps:1. Open the message in tree list view2. Select the field and click the right button of Mouse, then select the “Add field for search” 3. Select one or multi search conditions if exist4. Modify the search text manually if necessary
Click Search button then the search Tool starts the search processing.Save button can save all the searched records to a file.
Hot Key: ctrl+F to open the search window F3 to find the next Shift + F3 to find the previous
Excel-like column filtering
The Tool supports the excel-like column filtering All the columns except Index can be hidden/displayed All the messages of every column can be hidden/displayed
Figure 11: column and message filtering

Protocol stack User Guide Log Viewer Tool
Goto line
The Tool supports to jump to specific line by input line number to the Go to line number box and press Enter key.
Hot Key: Go to line number box will get focus by using ctrl+g or ctrl+G
Line Mark
A line/record can be marked with yellow color and be navigated by the hot keys.
Hot Keys: ctrl+m or ctrl+M or ctrl+F2 : mark/clear the current line shift+M or shift+m or shift+F2 : jump to the previous marked line M or m or F2 : jump to the next marked line
Main Event Window
Main Event is to display the Main Event message included in the Trace/file.Currently main Events include
messages between the modules of PS messages between PS and L1/DSP
Main Event filter

Protocol stack User Guide Log Viewer Tool
The main event filter list determines which message will be displayed or which message will notbe displayed. So there are two kinds of filters:
Include filter: only the records which contain the filter text will be displayed. The filter text string starts with prefix ”+”. For example:
“+RRC-UL-CCCH-Message” to display UL-CCCH message “+RRC-DL-CCCH-Message” to display DL-CCCH message
“+RRC-UL-DCCH-Message” to display UL-DCCH message “+RRC-DL-CCCH-Message” to display DL-DCCH message “+SCTP_Msg” to display S1/X2 message
Exclude filter: do not display the records which contain the filter text. The filter text string starts with prefix”-” or no prefix. For example:
“l2meas” do not display all the records which contain “l1meas”
Note: Include filter has higher priority, if include filters exist, the exclude filter will be ignored.
Note: Input only one filter text string in each line. The new setting will be applied after mouse leaves the Text box area.
Main Event Message list
This area is used to display all or filtered Main event messages with a list.It is a navigation list of the Main trace window, only index and event name are displayed. By double clicking on the specific event, the Main trace window will jump to that event.
UE specific Message list
This area is used to display the Main event messages of every UE. It is convenient to trace the procedures of a specific UE.
Struct description Window
The Struct description is to display the decoded content of the one structured event. It consists of two areas: tree view of message and S1/X2/NAS Message decoder.
Tree view of Message

Protocol stack User Guide Log Viewer Tool
Double clicking a message in Main Event or Main trace window, the detailed decoded description of the message will be displayed in the tree view window and S1/X2/RRC/NAS message windows if exist.
Figure 12: Struct Description Window
Items of the submenu of the Tree view window. Collapse: collapse the tree view Expand: expand the tree view Save: Save the tree view to a XML file Hex/Dec: Display the value with Hex or Dec format Add field for draw: for User graph draw Add draw condition: for User graph draw Add field for search: for Field Search in the struct
Hot Key: ctrl+c to save one line of the tree view to system clip board

Protocol stack User Guide Log Viewer Tool
S1/X2/NAS Message decoder
The s1/X1 included in the sctp data and the NAS message included in the RRC message will be decoded to this window.
Hot Key: ctrl+a to select all the contents and ctrl+c to save the decode contents to the system clip board
Note: It is impossible to decode the ciphered NAS message. So for debug purpose please disable the NAS encryption if possible.
User Graph
The Tool supports to draw the graph of any fields in an event from struct description window. Two operations for the user graph draw:
Add field for draw: the selected field of the records which meet all the condition will be drawn in the graph
Add draw condition: just add a draw condition, the selected field will not be drawn in the graph
Following is an example in which PHY_UL_DCI_PDU0/Mcs is drawn with the two conditions: rnti==63 and sfnsf <= 3960
Figure 13: User Graph example
Section 4: Log server
Protocol stack User Guide Log Viewer Tool
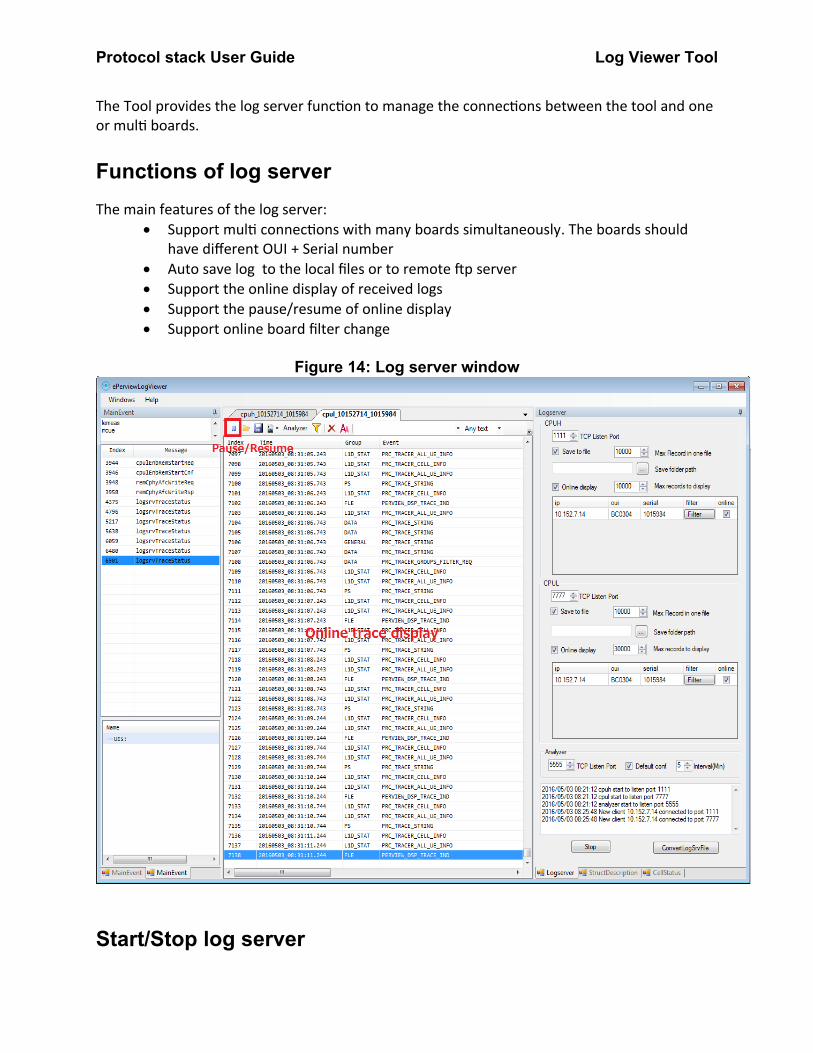
The Tool provides the log server function to manage the connections between the tool and one or multi boards.
Functions of log server
The main features of the log server: Support multi connections with many boards simultaneously. The boards should
have different OUI + Serial number Auto save log to the local files or to remote ftp server Support the online display of received logs Support the pause/resume of online display Support online board filter change
Figure 14: Log server window
Start/Stop log server
Protocol stack User Guide Log Viewer Tool
To start the log server, click the “Start” button on Log server Tab.To stop the log server, click the “Stop” button on Log server Tab.
Options of the log server
The log server listen one TCP port defined by the “TCP listen port” for CPUL connection, one TCP port defined by the “TCP listen port” for CPUH connection and one TCP port defined by the “TCP listen port” for the online log analyzer.
When a new TCP connection arrives, the Tool opens a new Trace window to display the received the log records if “Online display” option enabled. By changing the “online” check box it possible to disable or enable the online display of a specific connection.
The Tool saves the records to files if “Save to file” option enabled.
The “Max Records in one file” option determines the size of one log file. A new log file will be created after the record number reaches the threshold.
The “Max Records to display” option determines the max size of online display. The main tracerwindow will clear all the records and start from index 0 after the record number reaches the threshold.
The “Save folder path” option is used to set a default folder for the CPUH/CPUL log files.
Configuration of the board
The path in the Device.xml is /Device/X_OUI_DebugMgmt/Traces/LogServer
Table 2: Parameters for the Tool connection
Parameter Description
ConnectingPolicy When to connect to logserver, “Always”: try to connect to log server since power on.
“ConfigChanged”:do not connect to log server until new configuration available
IPAddress IP of Host PC on which the Tool runs
CpuhPort TCP listen port of CPUH
CpulPort TCP listen port of CPUL
CpuhDestPath CPUH Log files save path
CpulDestPath CPUL Log files save path
CpuhFileSize unused parameter
CpulFileSize unused parameter
CPUH or CPUL log file save path can be:

Protocol stack User Guide Log Viewer Tool
folder of local windows PC, for example: <CpulDestPath>C:\log\cpul\</CpulDestPath>
remote folder, for example : <CpuhDestPath>\\10.152.7.152\LTE\logs\cpuh\</CpuhDestPath>
ftp folder with format ftp://username:password@url, for example: <CpuhDestPath>ftp://guest:[email protected]/ftpserver/cpuh/</CpuhDestPath>
How to determine the log save path:
1. If no valid folder is configured in Device.xml, “Save folder path” option apply
2. If no path is configured in “Save folder path” option, log will be saved to the same folderas ePerviewView.exe
3. If the ftp path does not exist or is not reachable, the log will be saved to the same folder as ePerviewView.exe
Priority between LogViewer and log server
The log service thread on the board supports both log viewer tool described in this document and ePerview tool developed by the L1/DSP team.
And the log viewer tool has higher priority the log server, so if the log viewer tool connects to the board, no trace is sent to server.
Open dump log file
When the board reboot suddenly, the logs in the log buffer will be dumped by the PS and saved to one or more dump log files.
To open the dumped log file, click the “ConvertLogSrvFile” button from the Log Server panel and select the file from the open file dialog. The tool will open a new main trace window to display the records saved in the dump log file.
Online filter setting
The filter setting of online board can be changed by click “Filter” button of CPUH or CPUL.The Tool reads and displays the current board setting, then you can change the filter setting.After changing the filter setting, press “Write to board” button then new setting will be applied.
Figure 15: Online filter setting

Protocol stack User Guide Log Viewer Tool
The default setting of filter is saved in Device.xml, the path is/Device/X_OUI_DebugMgmt/TraceFilter/PsFilter
The online setting will not be saved to Device.xml, to change the default setting in Data model, press “Generate buffer” button, it will generated the new filter setting buffer and copy it to the PsFilter item in Device.xml.
Figure 16: Save the default filter setting

Protocol stack User Guide Log Viewer Tool
Section 5: Cell status display
Cell Status window is used to display the statistics information of L1 and L2. There are 6 tab pages to display the Phy, Mac, Mac1, LCH, Erab and ROHC information. Cell#1 of Phy page and Mac1 tab page are for the second cell of carrier aggregation or dual carriers.
Figure 17: Cell status display

Protocol stack User Guide Log Viewer Tool
And the Tool supports the graph draw of one or multi-fields of one page (except PHY page), right-click the mouse then select Draw graph, then the graph will be displayed. Graph works on online mode and offline mode.
Figure 18: graph display of multi fields
Section 6: PM report
The tool supports the PM report file analyze. The main features are:
Supports to open one or multi PM report files one time: Windows->Open PM report and select one or multi PM report files from the Open file dialog.
Supports multi sessions/parser in parallel Support text filter: only the PM counters which contain the text will be displayed

Protocol stack User Guide Log Viewer Tool
Support filter file: a collection of text filter, the last selected filter file will be loaded automatically next time. To disable the filter file, please clear the file name and click filter button.
Analyze the Max/Min/Sum of each PM counter from all the PM report files Copy to clip board by ctrl-c Save result to an excel file
Figure 19: PM report analyze window
Section 7: KPI analyze
The KPIs are formulated to measure the network performance in terms of Accessibility, Integrity, Mobility, Retainability and Subscriber perceived quality.
Functions of KPI analyze module
The main features of the KPI analyze module: Manage the KPI template

Protocol stack User Guide Log Viewer Tool
Check the KPI result Manage multi KPI test results
KPI template management
A KPI item is defined with a KPI template which includes a name, the description and a formula.The formula indicates how to calculate the KPI value based on some PM counters.
For different test cases, the thresholds of each KPI item are different, so the template defines the thresholds for every test case. For example, for the FDD 3M case the MAC downlink throughput range is [15000,23000]kbps and for the FDD 20M case the pass range is [135000,15000]kbps.
Figure 20: KPI template exampleKPI Description Paramter(s)/Formula FDD_3M_Default_Thp FDD_20M_Default_Thp
reboot Counter of board reboot number of board reboot 0,0 0,0rrc_mo-signalling_succ_rate RRC setup success rate for MO-signalling RRC.ConnEstabSucc.mo-Signalling,/,RRC.ConnEstabAtt.mo-Signalling1,1 1,1rrc_mo-data_succ_rate RRC setup success rate for MO-data RRC.ConnEstabSucc.mo-Data,/,RRC.ConnEstabAtt.mo-Data 1,1 1,1rrc_mt-access_succ_rate RRC setup success rate for MT-access RRC.ConnEstabSucc.mt-Access,/,RRC.ConnEstabAtt.mt-Access 1,1 1,1rrc_reestab_other RRC conn reestablishment beause of other failure RRC.ConnReEstabAtt.otherFailure 0,0 0,0rrc_reestab_succ_rate RRC conn reestablishment success rate (,RRC.ConnReEstabSucc.reconfigurationFailure,+,RRC.ConnReEstabSucc.handoverFailure,+,RRC.ConnReEstabSucc.otherFailure,),/,(,RRC.ConnReEstabAtt.reconfigurationFailure,+,RRC.ConnReEstabAtt.handoverFailure,+,RRC.ConnReEstabAtt.otherFailure,)N/A N/Aprocessor_usage_cpuh_mean mean cpuh processor usage EQPT.MeanProcessorUsage.CPU-H-0 0,50 0,75processor_usage_cpul0_mean mean cpul0 processor usage EQPT.MeanProcessorUsage.CPU-L-0 0,50 0,75processor_usage_cpul1_mean mean cpu1 processor usage EQPT.MeanProcessorUsage.CPU-L-1 0,50 0,75gtpu_thp_dl DL throughput of Gtpu GTPU.ThroughputDl 15000,23000 135000,150000gtpu_thp_ul UL throughput of Gtpu GTPU.ThroughputUl 4000,7000 40000,50000rlc_thp_dl DL throughput of RLC RLC.ThroughputDl 15000,23000 135000,150000rlc_thp_ul UL throughput of RLC RLC.ThroughputUl 4000,7000 40000,50000mac_thp_dl DL throughput of MAC MAC.ThroughputDl 15000,23000 135000,150000mac_thp_ul UL throughput of MAC MAC.ThroughputUl 4000,7000 40000,50000
The KPI templates are managed with an Excel file. The Tool imports the Excel file and analyzes the template items for the KPI result check.
To open a new KPI check Window, please click Windows -> New KPI check menu.To open a KPI template file, please click the Open File toolbar and select the Excel file, the Tool will import the templates.
Figure 21: Open template file
Check the KPI
The Tool reads the PM report files generated and uploaded by the board and checks the KPI result with specific KPI check items. And the Tool supports the PM report files generated by the log analyzer too.
To add one KPI check item, please click the Add button on the toolbar, following form will be displayed. There are two pages: “Add one item” is used to add one check item manually and “Batch Add” is used to add multi check items automatically.

Protocol stack User Guide Log Viewer Tool
Figure 22: Add a KPI item
Steps to add a KPI check1. Select a specific template from the list, for example “FDD_20M_Attach_Detach”2. Input a title for the item, for example “Tag123”3. Select PM report files4. Click “Add item” button, the KPI check result will be add to the Tab page
”FDD_20M_Attach_Detach”
Figure 23: Result of the KPI check

Protocol stack User Guide Log Viewer Tool
Note: The Red items are the Fail items, the orange items are the Warning items
Note: Multi versions are supported for one template
Figure 24: Batch add items
Steps to add a “batch” check1. Select the root log folder2. Check/uncheck Process PM report or/and Process log Report3. Click “Add item” button, the test items under the root log folder will be added
To generate test report automatically with Tool, please follow the log folder naming rules:1. The top level is the version: for example tag123_rev149962. The folder name of each test case should start with KPI title(For example:
FDD_20M_Perf_TCP_1300_1UE_2015_08_14_17_24_09)
Protocol stack User Guide Log Viewer Tool
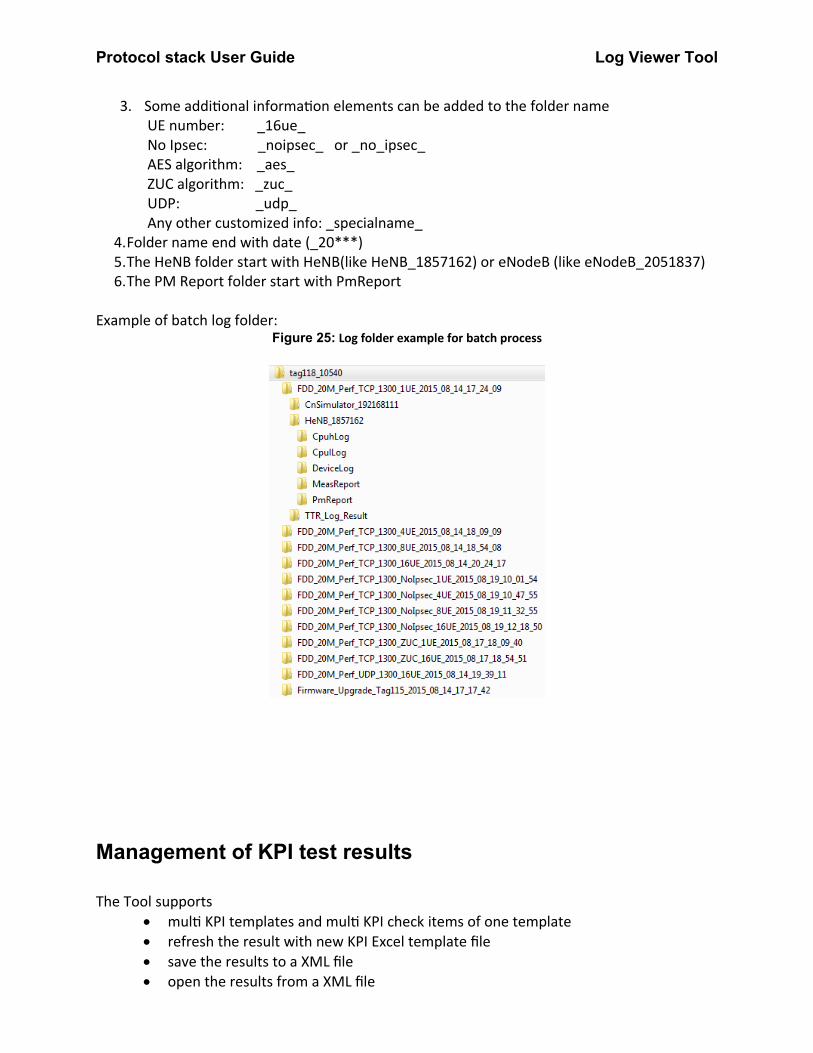
3. Some additional information elements can be added to the folder name UE number: _16ue_ No Ipsec: _noipsec_ or _no_ipsec_ AES algorithm: _aes_ ZUC algorithm: _zuc_ UDP: _udp_ Any other customized info: _specialname_
4.Folder name end with date (_20***) 5.The HeNB folder start with HeNB(like HeNB_1857162) or eNodeB (like eNodeB_2051837) 6.The PM Report folder start with PmReport
Example of batch log folder:Figure 25: Log folder example for batch process
Management of KPI test results
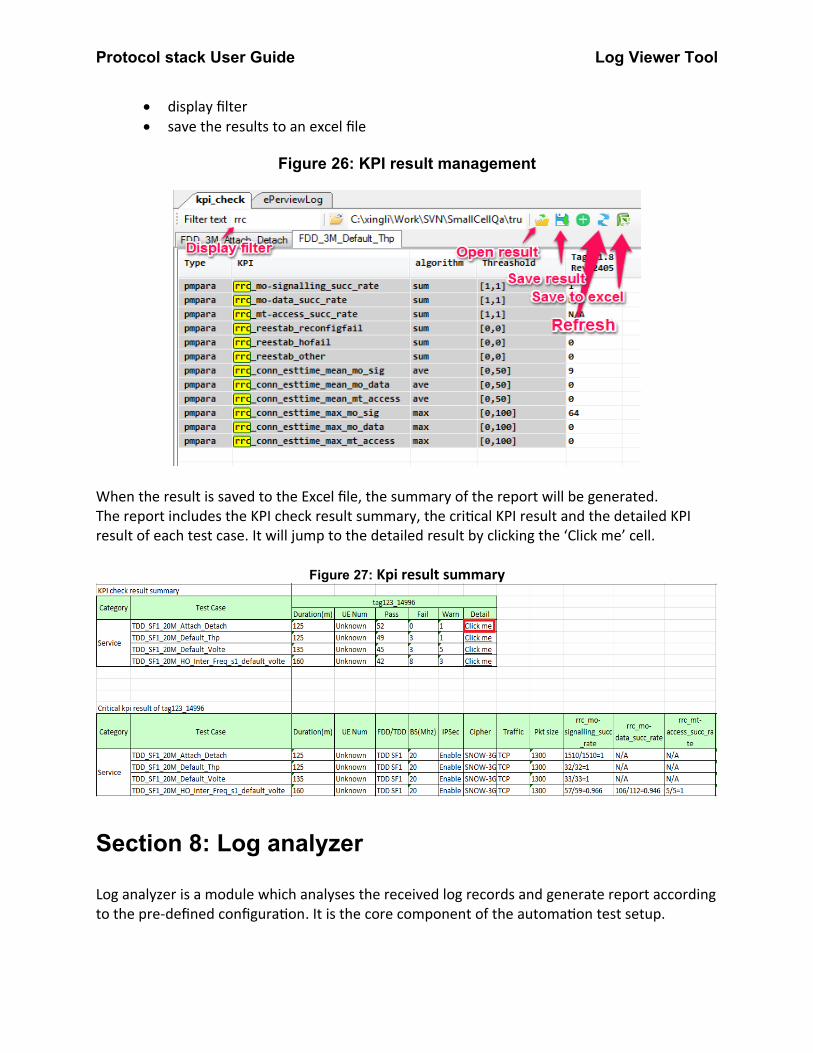
The Tool supports multi KPI templates and multi KPI check items of one template refresh the result with new KPI Excel template file save the results to a XML file open the results from a XML file
Protocol stack User Guide Log Viewer Tool
display filter save the results to an excel file
Figure 26: KPI result management
When the result is saved to the Excel file, the summary of the report will be generated.The report includes the KPI check result summary, the critical KPI result and the detailed KPI result of each test case. It will jump to the detailed result by clicking the ‘Click me’ cell.
Figure 27: Kpi result summary
Section 8: Log analyzer
Log analyzer is a module which analyses the received log records and generate report accordingto the pre-defined configuration. It is the core component of the automation test setup.
Protocol stack User Guide Log Viewer Tool
Functions of Log analyzer
The main features of the log analyzer module: Flexible configuration Online mode to receive configuration and generate report Offline mode to analyze one log folder Offline mode to analyze multi log folders Integrate with PM report analyzer module Integrate with KPI check module
Configuration of Log analyzer
The configuration is saved in an xml file. It contains the configuration of L2 measurement configuration and counters configuration.
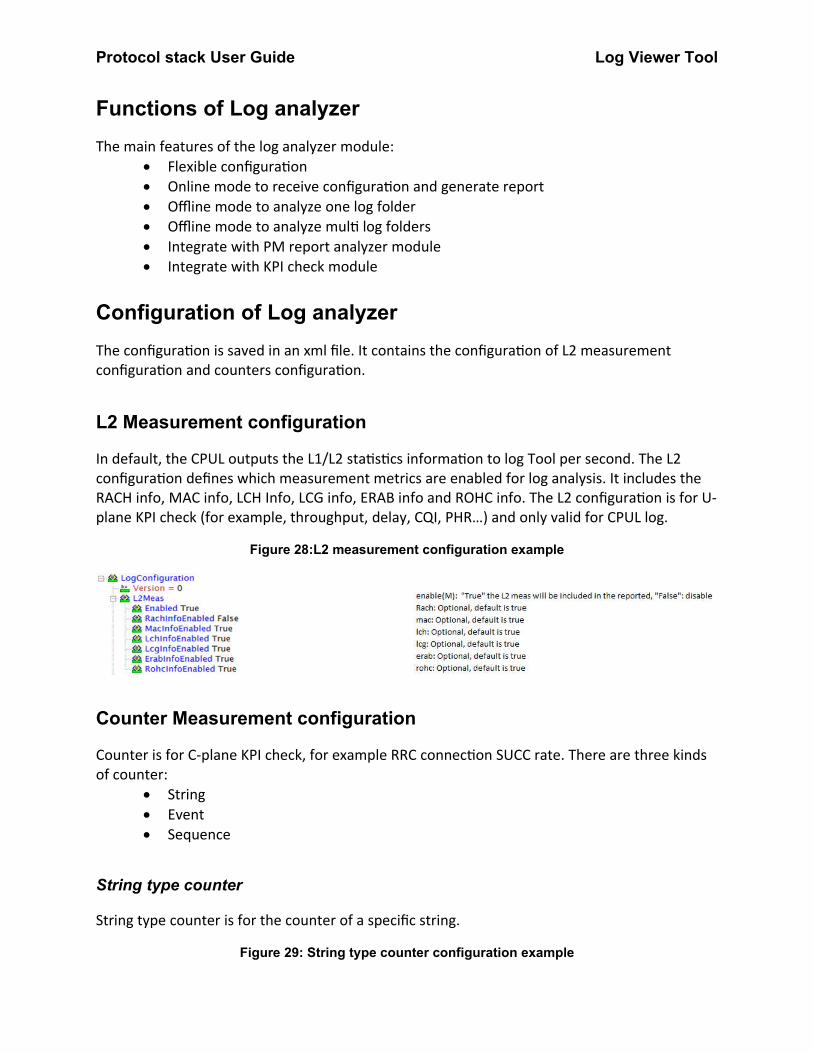
L2 Measurement configuration
In default, the CPUL outputs the L1/L2 statistics information to log Tool per second. The L2 configuration defines which measurement metrics are enabled for log analysis. It includes the RACH info, MAC info, LCH Info, LCG info, ERAB info and ROHC info. The L2 configuration is for U-plane KPI check (for example, throughput, delay, CQI, PHR…) and only valid for CPUL log.
Figure 28:L2 measurement configuration example
Counter Measurement configuration
Counter is for C-plane KPI check, for example RRC connection SUCC rate. There are three kinds of counter:
String Event Sequence
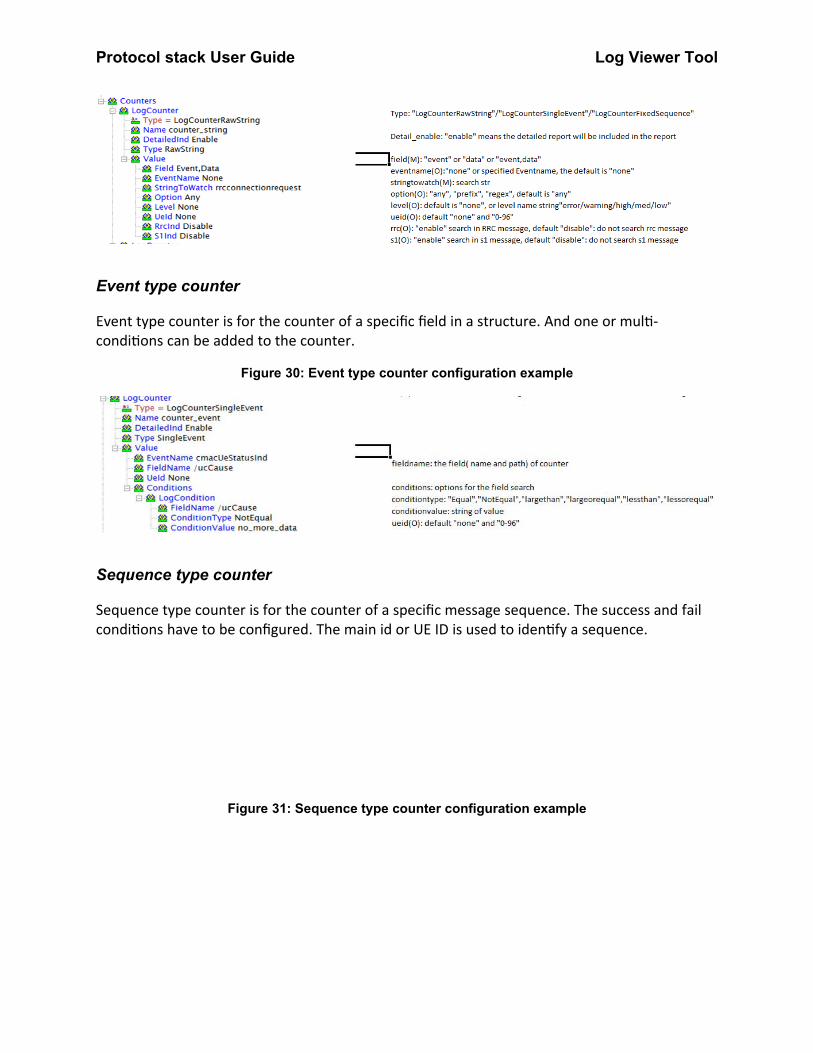
String type counter
String type counter is for the counter of a specific string.
Figure 29: String type counter configuration example
Protocol stack User Guide Log Viewer Tool
Event type counter
Event type counter is for the counter of a specific field in a structure. And one or multi-conditions can be added to the counter.
Figure 30: Event type counter configuration example
Sequence type counter
Sequence type counter is for the counter of a specific message sequence. The success and fail conditions have to be configured. The main id or UE ID is used to identify a sequence.
Figure 31: Sequence type counter configuration example

Protocol stack User Guide Log Viewer Tool
Report generation of Log analyzerLog analyzer generates a report file when required by external module or generates a report file periodically. The XML report file includes the counters and detailed report if configured.
Figure 32: Format example of report file

Protocol stack User Guide Log Viewer Tool
Online control of the analyzer
When the Tool runs with online mode, the analyzer can analyze the log records and generate the reports with the default configuration file and specific interval. The generated report files will be saved to the same folder of CPUH or CPUL log.
Figure 33: Online server setting
And after the “Start” button of log server is clicked, the analyzer listens a TCP port (Default port is 5555) to receive the control commands. The received configuration will overwrite the default configuration.
Commands send from TTR to log analyzer: Set command to set/reset URL of configuration file. A session is defined with OUI + Serial +CPUH/L
Example: set,BC0304,1839196,cpuh,ftp://admin:[email protected]/ftpserver/config_cpuh.xml Get command to require report file
Example: get,BC0304,1839196,cpul,ftp://admin:[email protected]/ftpserver/result_cpul.xml Reset command to restart the log analyzer(only the saved results are cleared)
Example: reset,BC0304,1839196,cpul Delete command to remove the configuration and to stop the session of analyzer
Example: delete,BC0304,1839196,cpul
Response commands send from analyzer to TTR: Set response:
Success example: set,BC0304,1839196,cpuh,ok Fail example: set,BC0304,1839196,cpuh,failed
Get response Success example: get,BC0304,1839196,cpuh,ok Fail example: get,BC0304,1839196,cpuh,failed
Reset response Success example: reset,BC0304,1839196,cpuh,ok Fail example: reset,BC0304,1839196,cpuh,failed
Delete response Success example: delete,BC0304,1839196,cpuh,ok Fail example: delete,BC0304,1839196,cpuh,failed
Unknown command response Example: error,unknown command, set,BC0304,1839196,cpu
Offline control of the analyzer

Protocol stack User Guide Log Viewer Tool
The analyzer can analyze the opened log records or saved log files too. The Analyzer window will be showed when you click the “Analyzer” button.
Figure 34: Offline analyzer window
“Load New Config”: load a specific configuration file to replace the default configuration. The items are showed in the “Configuration” page and it is possible to enable/disable an item. “Log folder”: Set the log folder. If a single folder is selected, the log files under the folder will be analyzed If a batch folder (Figure 25: Log folder example for batch processis selected, the log files of all the case folders will be analyzed If no folder selected, the displayed records will be analyzed“Analyze ”: Begin to analyze“Save result”: Save the result to a XML file“PM Analyze”: Open PM analyzer window to analyze the result“KPI Template”: Select the KPI template excel file, valid for batch process only“KPI Analyze”: Open KPI analyzer window to check the KPI, valid for batch process only“Report succ seq”/”Report fail seq”: Display the succ sequence and/or failed sequence in Result page“Ignore first files”/”Ignore last files”: Skip the first and/or last reports “Generate report interval”: The interval in minutes to generate the report. Value “0” means to generate one report file only. This option is valid if a log folder is selectedIf the report is generated with the displayed log records, then the index of the record will be displayed inthe detailed report item. Double click the “Index” line, the Tool will jump to that log record.
Figure 35: Jump to the record

Protocol stack User Guide Log Viewer Tool