intercepts of graphs - mr. jones
TRANSCRIPT

Cop
yrig
ht ©
McG
raw
-Hill
Edu
cati
on
y
xO
Lesson 3-4
Intercepts of Graphs
Today’s Vocabulary x-intercept y-intercept positive negative root zero
Learn Intercepts of Graphs of FunctionsThe intercepts of graphs are points where the graph intersects an axis.
The x-intercept is the x-coordinate of a point where a graph crosses the x-axis.
The y-intercept is the y-coordinate of a point where a graph crosses the y-axis.
A function is positive when its graph lies above the x-axis.
A function is negative when its graph lies below the x-axis.
Example 1 Intercepts of the Graph of a Linear FunctionUse the graph to estimate the x- and y-intercepts of the function and describe where the function is positive and negative.
The x-intercept is the point where the graph crosses the x-axis, ( , ).
The y-intercept is the point where the graph crosses the y-axis, ( , ).
A function is positive when its graph lies above the x-axis, or when .
A function is negative when its graph lies below the x-axis, or when .
Check Use the graph to estimate the x- and y-intercepts of the function and describe where the function is positive and negative.
A. x-intercept: (-2, 0); y-intercept: (0, -6); positive: x > -2; negative: x < -2
B. x-intercept: (0, −6); y-intercept: (-2, 0); positive: x < -2; negative: x > -2
C. x-intercept: (-2, 0); y-intercept: (0, -6); positive: x < -2; negative: x > -2
D. x-intercept: (0, -6); y-intercept: (-2, 0); positive: x > -2; negative: x < -2
Think About It!
Explain why this function is linear.
Study Tip:
Notice that intercept can be used to refer to either the point where the graph intersects the axis or the nonzero coordinate of the point where the graph intersects the axis.
y
xO
yx
O
Go Online You can complete an Extra Example online.
Study Tip
To help remember the difference between the x- and y-intercepts, remember that the x-intercept is where the graph intersects the x-axis, and the y-intercept is where the graph intersects the y-axis.
Today’s Goals● Identify the intercepts of
functions and intervals where functions are positive and negative.
● Solve equations by graphing.
Lesson 3-4 • Intercepts of Graphs 167
Sample answer: The function is linear because its graph forms a straight line.
3 0
0 6
x < 3
x > 3
C
THIS MATERIAL IS PROVIDED FOR INDIVIDUAL EDUCATIONAL PURPOSES ONLY AND MAY NOT BE DOWNLOADED, REPRODUCED, OR FURTHER DISTRIBUTED.

Copyright ©
McG
raw-H
ill Education
Think About It!
Explain why this function is nonlinear.
Example 2 Intercepts of the Graph of a Nonlinear FunctionUse the graph to estimate the x- and y-intercepts of the function and describe where the function is positive and negative.
y
xO
42
-4
-8-6
-10-12
21 43-4 -2-3 -1
x-intercepts: and .
y-intercept: .
positive: when and when .
negative: x is between and .
Check Use the graph of the function to determine key features.
y
xO
Part A Determine whether each ordered pair represents an x-intercept, a y-intercept, or neither.
(1, 0)
(0, 1)
Part B Describe where the function is positive and negative.
A. positive: x < 1 and x > 4; negative: x is between 1 and 4B. positive: x > 1 and x < 4; negative: x is between 1 and 4C. positive: x is between 1 and 4; negative: x > 1 and x < 4D. positive: x is between 1 and 4; negative: x < 1 and x > 4
Watch Out!
The graphs of nonlinear functions can have more than one x-intercept.
Go Online You can complete an Extra Example online.
Your Notes
168 Module 3 • Relations and Functions
-4-12
x < −4 x > 3−4 3
x-interceptneither
D
3
Sample answer: The function is nonlinear because its graph does not form a straight line.
THIS MATERIAL IS PROVIDED FOR INDIVIDUAL EDUCATIONAL PURPOSES ONLY AND MAY NOT BE DOWNLOADED, REPRODUCED, OR FURTHER DISTRIBUTED.

Cop
yrig
ht ©
McG
raw
-Hill
Edu
cati
on
Go Online You can complete an Extra Example online.
Think About It!
The function is only graphed from 0 to 9 seconds. What can you assume about the function when x > 9? Interpret this meaning. Does it make sense in the context of the situation?
Example 3 Find Intercepts from a GraphSPORTS The graph shows the height of a ball for each second x that it is airborne. Use the graph to estimate the x- and y-intercepts of the function, where the function is positive and negative, and interpret the meanings in the context of the situation.
The x-intercept is . That means that the ball will hit the ground after seconds. The y-intercept is . This means that at time , the ball was at a height of feet. The function is positive when x is between and , which means that the ball is in the air for seconds. No portion of the graph shows that the function is .
Check FITNESS The graph shows the number of people y at a gym x hours after the gym opens.
40
0
80
120
160
200
x
y
8 10 126Time (hours)
Num
ber o
f Peo
ple
42
Gym Occupancy
Part A Use the graph to estimate the x- and y-intercepts.
x-intercept: ( , )
y-intercept: ( , )
Part B Which statements describe the meaning of the x- and y-intercepts in the context of the situation? Select all that apply.
A. There were 20 people at the gym when it opened.
B. The gym closed after 20 hours.
C. The gym closed after 12 hours.
D. There were 12 people at the gym when it opened.
x
y
123
0
456789
10
8 9 106 7Time (s)
Hei
ght (
ft)
4 5321
Height of the Ball
Lesson 3-4 • Intercepts of Graphs 169
99
4 04
0 99
negative
12 00 20
A, C
Sample answer: I assume that the graph continues to follow the same path, so the function is negative when x > 9. This means that the ball would be at a negative height when x > 9. This does not make sense in the context of the situation because it is impossible for a ball to be at a negative height.
THIS MATERIAL IS PROVIDED FOR INDIVIDUAL EDUCATIONAL PURPOSES ONLY AND MAY NOT BE DOWNLOADED, REPRODUCED, OR FURTHER DISTRIBUTED.

Copyright ©
McG
raw-H
ill Education
Go Online You can complete an Extra Example online.
Example 4 Find Intercepts from a TableLUNCH Violet starts the semester with $150 in her student lunch account. Each day she spends $3.75 on lunch. The table shows the function relating the amount of money remaining in her lunch account to the number of days Violet has purchased lunch.
Part A Find the intercepts.
The x-intercept is where y = , so the x-intercept is .
The y-intercept is where x = , so the y-intercept is .
Part B Describe what the intercepts mean in the context of the situation.
The x-intercept means that after buying lunch for days, Violet will have $ left in her lunch account, or it will take Violet days to use all of the money in her lunch account. The y-intercept means that Violet’s lunch account has $ after buying lunch for days, or the beginning balance of her lunch account is $ .
Check MOVIES Ashley received a gift card to the movie theater for her birthday. The table shows the amount of money remaining on her gift card y after x trips to the movie theater.
Number of Trips Balance ($)x y0 901 81
2 723 635 457 27
10 0
Part A Find the y-intercept. ( , )
Part B Find the x-intercept and describe what it means in the context of the situation.
A. (10, 0); The initial balance on the gift card was $10.
B. (90, 0); The initial balance on the gift card was $90.
C. (10, 0); After 10 trips to the movies, there will be no money left on the gift card.
D. (90, 0); After 90 trips to the movies, there will be no money left on the gift card.
Time (Days) Balance ($)x y0 1502 142.505 131.25
10 112.5015 93.7530 37.5040 0
170 Module 3 • Relations and Functions
040
0 150
400
40150
0150
0 90
C
THIS MATERIAL IS PROVIDED FOR INDIVIDUAL EDUCATIONAL PURPOSES ONLY AND MAY NOT BE DOWNLOADED, REPRODUCED, OR FURTHER DISTRIBUTED.

Cop
yrig
ht ©
McG
raw
-Hill
Edu
cati
on
Learn Solving Equations by GraphingThe solution, or root, of an equation is any value that makes the equation true. A zero is an x-intercept of the graph of the function.
For example, the root of 3x = 6 is 2. A linear equation, like 3x = 6, has at most one root, while a nonlinear equation, like x2 + 4x − 5 = 0, may have more than one.
Equation Related Function3x = 6 f (x) = 3x − 6 or y = 3x − 6
x2 + 4x − 5 = 0 f (x) = x2 + 4x − 5 or y = x2 + 4x − 5
The graph of the related function can be used to find the solutions of an equation. The related function is formed by solving the equation for 0 and then replacing 0 with f (x) or y.
Values of x for which f(x) = 0 are located at the x-intercepts of the graph of a function and are called the zeros of the function f. The roots of an equation are the same as the zeros of its related function. The solutions and roots of an equation are the same value as the zeros and x-intercepts of its related function. For the equation 3x = 6:
• 2 is the solution of 3x = 6.
• 2 is the root of 3x = 6.
• 2 is the zero of f (x) = 3x − 6.
• 2 is the x-intercept of f (x) = 3x − 6.
Example 5 Solve a Linear Equation by GraphingSolve −2x + 7 = 1 by graphing. Check your solution.
Find the related function.
−2x + 7 = 1 Original equation
−2x + 7 = 1 Subtract 1 from each side.
−2x + = Simplify.
Graph the left side of the equation. The related function is f(x) = , which can be graphed.
y
xO
The graph intersects the x-axis at . This is the x-intercept, or zero, which is also the root of the equation. So, the solution of the equation is .
Check your solution by solving the equation algebraically.
Go Online You can complete an Extra Example online.
Think About It!
What is the difference between a root and a zero?
Think About It!
Suppose you first solved the equation algebraically. How could you use your solution to graph the zero of the related function?
Go OnlineAn alternate method is available for this example.
Lesson 3-4 • Intercepts of Graphs 171
- 1 - 1
-2x + 6
6 0
3
3
Sample answer: A root is the solution of an equation, while a zero is the x-intercept of the related function.
Sample answer: The solution of the equation is the same as the x-intercept, or zero, of the function. So, I can graph the zero by plotting a point at 3 on the x-axis.
THIS MATERIAL IS PROVIDED FOR INDIVIDUAL EDUCATIONAL PURPOSES ONLY AND MAY NOT BE DOWNLOADED, REPRODUCED, OR FURTHER DISTRIBUTED.

Copyright ©
McG
raw-H
ill Education
Example 7 Solve an Equation of a Horizontal Line by GraphingSolve 4x + 3 = 4x − 5 by graphing. Check your solution.
Find the related function.
4x + 3 = 4x − 5 Original equation
4x + 3 = 4x − 5 Add 5 to each side.
4x = 4x Simplify.
4x 8 = 4x Subtract 4x from each side.
8 = Simplify.
Graph the left side of the equation. The related function is f (x) = , which can be graphed.
y
xO
The graph does not intersect the x-axis. This means that there is x-intercept and, therefore, there is solution.
Talk About It!
Does solving the equation algebraically give a different solution? Explain your reasoning.
Go Online You can complete an Extra Example online.
Example 6 Solve a Nonlinear Equation by GraphingSolve x2 − 4x = −3 by graphing. Check your solution.
Find the related function.
x2 − 4x = −3 Original equation
x2 − 4x = −3 Add 3 to each side.
x2 − 4x + 3 = Simplify.
Graph the left side of the equation. The related function is f(x) = , which can be graphed.
y
xO
The graph intersects the x-axis at and . These are the x-intercepts, or zeros, which are also the roots of the equation. So, the solutions of the equation are and
.
Go OnlineYou can watch a video to see how to use a graphing calculator with this example.
172 Module 3 • Relations and Functions
+ 5 + 5
+ 8- 4x + - 4x
0
nono
8
Sample answer: No; solving algebraically results in the false statement 8 = 0, which means there is no solution.
+ 3 + 30
x2 - 4x = -3
1 3
13
THIS MATERIAL IS PROVIDED FOR INDIVIDUAL EDUCATIONAL PURPOSES ONLY AND MAY NOT BE DOWNLOADED, REPRODUCED, OR FURTHER DISTRIBUTED.
Cop
yrig
ht ©
McG
raw
-Hill
Edu
cati
on
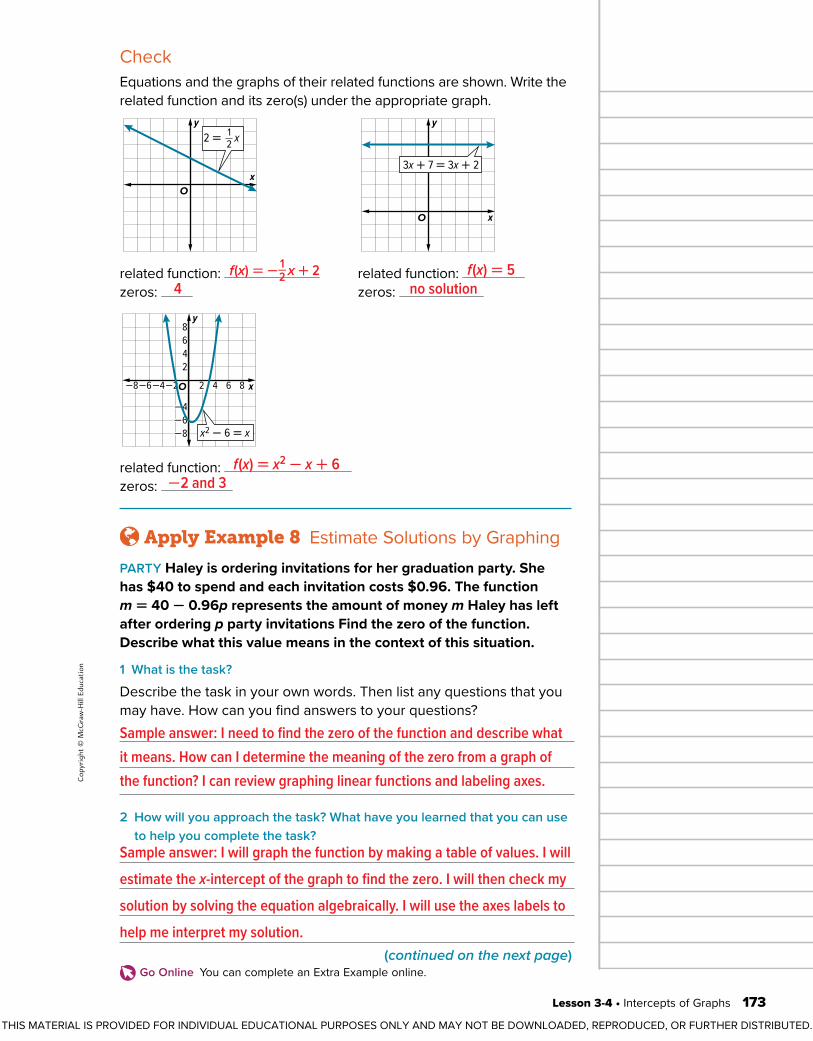
CheckEquations and the graphs of their related functions are shown. Write the related function and its zero(s) under the appropriate graph.
y
xO
2 = x12
y
xO
3x + 7 = 3x + 2
related function: related function: zeros: zeros:
−8 −4−6 −2 8642
−8−6−4
2468
y
xO
x2 - 6 = x
related function: zeros:
Apply Example 8 Estimate Solutions by GraphingPARTY Haley is ordering invitations for her graduation party. She has $40 to spend and each invitation costs $0.96. The function m = 40 − 0.96p represents the amount of money m Haley has left after ordering p party invitations Find the zero of the function. Describe what this value means in the context of this situation.
1 What is the task?
Describe the task in your own words. Then list any questions that you may have. How can you find answers to your questions?
2 How will you approach the task? What have you learned that you can use to help you complete the task?
Go Online You can complete an Extra Example online.
Lesson 3-4 • Intercepts of Graphs 173
4f (x) = 5
no solution
f (x) = x2 - x + 6-2 and 3
f (x) = - 1 __ 2 x + 2
Sample answer: I need to find the zero of the function and describe what it means. How can I determine the meaning of the zero from a graph of the function? I can review graphing linear functions and labeling axes.
Sample answer: I will graph the function by making a table of values. I will estimate the x-intercept of the graph to find the zero. I will then check my solution by solving the equation algebraically. I will use the axes labels to help me interpret my solution.
(continued on the next page)
THIS MATERIAL IS PROVIDED FOR INDIVIDUAL EDUCATIONAL PURPOSES ONLY AND MAY NOT BE DOWNLOADED, REPRODUCED, OR FURTHER DISTRIBUTED.

Copyright ©
McG
raw-H
ill Education
105 2015 30250
123456
Am
ount
of D
ata
(GB
)
Number of Days
d
g
Data Usage
Go Online You can complete an Extra Example online.
3 What is your solution?
Use your strategy to solve the problem.
Graph the function. Estimate the solution.
10 20 30 40 500
10
20
30
40
50
Am
ount
of M
oney
($)
Number of Invitations
p
m
Graduation Party _____ invitations
Check the solution.
_______ invitations.
What does your solution mean in the context of the situation?
4 How can you know that your solution is reasonable?
Write About It! Write an argument that can be used to defend your solution.
Check DATA Blair’s cell phone plan allows her to use 3 GB of data, and she uses approximately 0.14 GB of data each day. The function g = 3 − 0.14d represents the amount of data g in GB she has left after d days.
Part A Examine the graph of the function to estimate its zero to the nearest day.
The graph appears to intersect the x-axis at .
Part B Solve algebraically to check your answer. Round to the nearest tenth.
x =
Part C Describe what your answer to Part B means in this context.
After days, Blair has GB left.
174 Module 3 • Relations and Functions
22
21.4
21.4 0
Sample answer: Haley can order 41 invitations with the amount of money she has to spend.
Sample answer: This amount is close to the estimated zero of 42 invitations from the graph.
42
≈ 41.67
THIS MATERIAL IS PROVIDED FOR INDIVIDUAL EDUCATIONAL PURPOSES ONLY AND MAY NOT BE DOWNLOADED, REPRODUCED, OR FURTHER DISTRIBUTED.