interconnecting and enriching higher education programs using linked data
TRANSCRIPT

INTERCONNECTING AND
ENRICHING HIGHER EDUCATION
PROGRAMS USING LINKED DATA
Fouad ZablithAmerican University of Beirut

Problem
• Higher education programs are often designed around
courses that follow a specific sequence
• Courses are usually described at high levels in the form of
syllabi and program catalogues
• This text-based representation creates hard knowledge
boundaries around courses that tend to be delivered and
analyzed mostly in isolation
Approach
• In this work, we aim to de-blackbox the representation of a
higher education curriculum
• We rely on linked data to generate and represent the
conceptual connections around the courses in a higher
education program
• We deploy a Semantic Mediawiki platform to collaboratively
build the knowledge graph around the courses
• We highlight the value of this linked data layer through two use
cases to (1) enrich online learning environments and (2)
support the program review process

Data Model
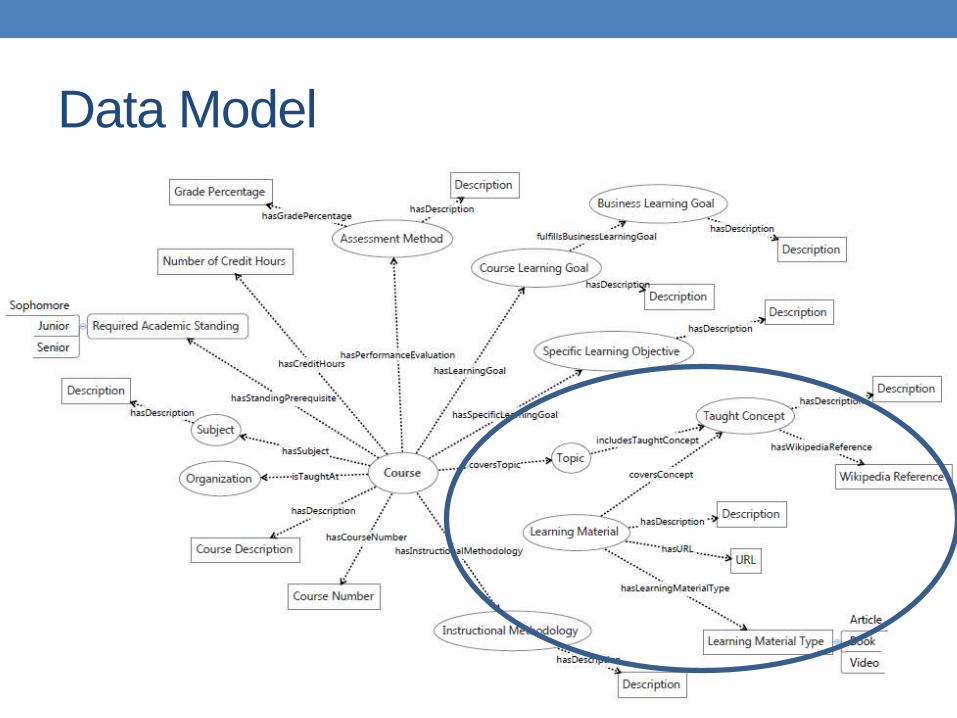
Data Model

Building the Linked Data Graph
• Phase 1: Creating Courses Information
• Course syllabi are used to identify the high level course information
(e.g. course name, description, topics, etc.)
• Phase 2: Identifying Concepts Taught
• This was the most time consuming task, where course material
(mainly textbooks) were used to identify taught concepts in courses
• Phase 3: Anchoring Learning Material to Courses
• This is the ongoing enrichment step using a semantic bookmarklet
to connect external material to courses

Course
Topic

Course
Topic
Concept

Course
Topic
Concept
Learning Material

Phase 1: Creating Courses Information

Phase 1: Creating Courses Information
http://linked.aub.edu.lb/collab

Phase 1: Creating Courses Information
http://linked.aub.edu.lb/collab

Phase 2: Identifying Concepts Taught

Conceptual Linking

Phase 3: Anchoring Learning Material to
Courses

Learning Material Bookmarklet
http://linked.aub.edu.lb/docs/tutorial_material_bookmark/
Example:
https://www.youtube.com/watch?v=f60dheI4ARg

Students Expanding the Data Graph
http://www.capgemini.com/resources/the-deciding-factor-big-data-decision-making
Learning Material

Students Expanding the Data Graph
http://www.capgemini.com/resources/the-deciding-factor-big-data-decision-making
BigData
Operations Decisions
Social Media
Automated Process
Organizational Silos
Decision
Internet Services
Business Process
Reengineering
Intuitive Decision Making
Learning Material Concepts

Current Data Available
• So far we have captured the following data around the
school’s higher education program:
Category Number
Courses 20
Topical coverage 171
Taught concepts 2,684
Learning Material 75

Using the Linked Data Graph:
Enriching Moodle Environments

Using the Linked Data Graph:
Enriching Moodle Environments

Impact of Student’s Input
http://www.capgemini.com/resources/the-deciding-factor-big-data-decision-making
Information
Systems
Management
Operations
Management
BigData
Operations Decisions
Social Media
Automated Process
Organizational Silos
Decision
Internet Services
Business Process
Reengineering
Intuitive Decision Making
Learning Material Concepts Moodle Courses

Impact of Student’s Input
http://www.capgemini.com/resources/the-deciding-factor-big-data-decision-making
Information
Systems
Management
Operations
Management
BigData
Operations Decisions
Social Media
Automated Process
Organizational Silos
Decision
Internet Services
Business Process
Reengineering
Intuitive Decision Making
Learning Material Moodle Courses
Indirectly interlinking
courses’ content
Concepts

Using the Linked Data Graph:
Program Review Concepts Graph
http://linked.aub.edu.lb/collab/index.php/Learning_Concepts_Graph

Using the Linked Data Graph:
Program Review Concepts Table
http://linked.aub.edu.lb/apps/tablebrowser/table.php

Future Directions
• Develop further data-driven applications to support
learning experiences
• Capture social interactions around the linked data graph
to have more granular insights on students’ behavior
around the concepts delivered
• Capitalize on the data graph to boost analytics and further
support the curriculum review process

Future Directions: Capturing Social
Interactions

Future Directions: Boosting Analytics

Future Directions: Boosting Analytics

Future Directions: Boosting Analytics

Conclusions
• We presented our efforts on collaboratively building a
linked data graph to capture concepts exchanged in
higher education programs
• We highlighted the value of this linked data layer at two
levels:
• First at the level of enriching learning environments and breaking
the knowledge boundaries around courses
• Second at the analytics level by building tools that provide new and
unprecedented curriculum visualizations
