interested parties shareholders - to measure management’s performance investors - to make their...
TRANSCRIPT

Interested parties Shareholders - to measure management’s
performance Investors - to make their investment
decisions Management - to plan and control
operation
Ratio analysis is a quick and easy way of analyzing a firm’sfinancial statements.

Ratio analysis cannot accurately pinpoint the problems of the firm. It is reasonable to expect that it points to a direction for a more detailed analysis.
Financial ratio itself is not meaningful without comparing it to a benchmark. Benchmarks can be a rival firm’s financial ratio or an industry average.
Sometimes a firm’s problems can be disguised as so-called “good ratios.” For example, a high inventory turnover can be an indicator of the firm’s dangerously low level of inventory.

Liquidity Ratios Efficiency Ratios Leverage Ratios Profitability Ratios
Liquidity and leverage ratios primarily measure risk; efficiency and profitability ratios measure performance and return.

Net working capital
= Current assets - Current liability
Current ratio
Quick (acid-test) ratioliabilityCurrent
assetsCurrent ratioCurrent
liabilityCurrent
Inventory - assetsCurrent ratioQuick

Inventory turnover
Average collection period (Days sales outstanding)
Assets Turnover
Fixed assets turnover
Inventory
Salesturnover Inventory
365 sales Annual
receivable Accounts
salesdaily Average
receivable Accounts
assets Total
Sales turnoverAssets
Assets Fixed
Sales turnover assets Fixed

Debt ratio
Debt-to-Equity ratio
Times interest earned ratio
assets Total
liablities Total RatioDebt
Interest
taxesandinterest before Earnings
Equity
Debt RatioEquity -to-Debt

Gross profit margin
Operating profit margin
Sales
profit Gross
Sales
sold goods ofCost - Sales
Sales
profit Operatingmargin profit Operating

Net profit margin
Return on total assets (ROA)
Return on equity (ROE)
sales
safter taxeprofit net margin profit Net
assets total
safter taxe profitsnet assets on totalReturn
equity common
after tax profitsnet equity on Return
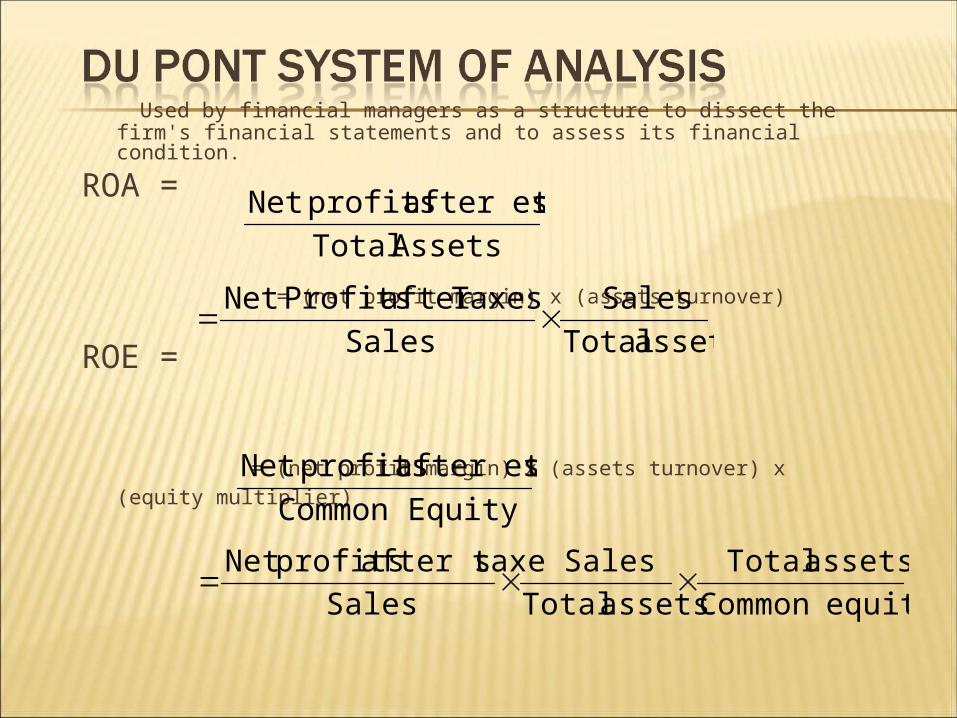
Used by financial managers as a structure to dissect the firm's financial statements and to assess its financial condition.
ROA =
= (net profit margin) x (assets turnover)
ROE =
= (net profit margin) x (assets turnover) x (equity multiplier)
assets Total
Sales
Sales
Taxesafter ProfitsNet
equityCommon
assets Total
assets Total
Sales
Sales
safter taxe profitsNet
Assets Total
esafter tax profitsNet
EquityCommon
esafter tax profitsNet

Campsey Computer Company: Balance Sheet as of December 31, 1995
Cash 77,500 Accounts payable 129,000Receivables 336,000 Notes payable 84,000Inventories 241,500 Other current liabilities 117,000
Total current assets 655,000 Total current liabilities 330,000Net fixed assets 292,500 Long-term debt 256,500
Common equity 361,000
Total assets 947,500 Total liabilities and equity 947,500
Campsey Computer Company: Income Statement
Sales 1,607,500$ Cost of goods sold (1,353,000)Gross profit 254,500Fixed operating expenses (143,000)Depreciation (41,500) Earnings before interest and taxes 70,000Interest (24,500) Earnings before taxes 45,500Taxes (40%) (18,200)
Net Income 27,300

Calculate the following ratios:a. Current ratio
b. Days sales outstanding
c. Inventory turnover
98.1000,330
000,655
liabilityCurrent
assetsCurrent ratioCurrent
66.6500,241
500,607,1
Inventory
Salesturnover Inventory
29.76
365500,607,1
000,336
365sales Annual
receivable AccountsDSO

d. Total assets turnover
e. Profit margin on sales
70.1500,947
500,607,1
assets Total
Sales turnoverAssets
%70.1500,607,1
300,27Sales
safter taxeprofit Net margin profit Net

f. Return on Assets
%88.2500,947
300,27
assets Total
safter taxe profitsNet ROA
%88.2500,947
500,607,1
500,607,1
300,27assets Total
Sales
Sales
safter taxe profitsNet ROA
OR

g. Return on Equity
%56.7000,361
300,27
EquityCommon
esafter tax profitsNet ROE
equityCommon
assets Total
assets Total
Sales
Sales
safter taxe profitsNet ROE
%56.7000,361
300,27
361,000
947,500
947,500
1,607,500
1,607,500
27,300 ROE
OR

h. Debt ratio
%90.61500,947
500,586assets Total
sliabilitie TotalratioDebt

Ratio CampseyIndustry Average
Current ratio 1.98 2.0
Days sales outstanding 76 days 35 days
Inventory turnover 6.7 5.6
Total assets turnover 1.7 3.0
Profit margin on sales 1.7% 1.2%
Return on assets 2.9% 3.6%
Return on equity 7.6% 9.0%
Debt ratio 61.9% 60.0%