interface analysis and report for incorporation and
TRANSCRIPT

Project Name Document Name
1
Interface analysis and
report for
incorporation and
alignment of data from
biomethane study into
RHI workstream
Final Report
for
Sustainable Energy
Authority of Ireland
January 2017
Element Energy Limited
Terrington House
13-15 Hills Road
Cambridge CB2 1NL
Tel: 01223 852499
Fax: 01223 353475

Interface analysis and report for incorporation and alignment of data from Biomethane study into RHI workstream
2

Interface analysis and report for incorporation and alignment of data from Biomethane study into RHI workstream
3
Contents
1 Introduction ..................................................................................................................... 5
2 AD CHP, AD boiler and biomethane grid injection tariff design and uptake modelling .. 6
2.1 Tariff design ............................................................................................................... 6
2.2 Uptake of AD CHP, AD boiler and biomethane grid injection ................................... 7
3 Funding support for biomethane through a levy on gas consumers ............................ 17
3.1 Approach ................................................................................................................. 17
3.2 Results and discussion ............................................................................................ 21
4 Preliminary assessment of an RHI tariff for BioLPG .................................................... 24
Appendix A ....................................................................................................................... 28
Report on Options for Biomethane Support ..................................................................... 28
by Ricardo Energy & Environment ................................................................................... 28
1 Introduction ................................................................................................................... 29
1.1 Background ............................................................................................................. 29
1.2 Biomethane and Renewable Energy Targets ......................................................... 29
1.3 Support for biomethane ........................................................................................... 30
1.4 Options for supporting BtG ...................................................................................... 30
2 Experience from Other Countries ................................................................................. 32
3 Stakeholder Responses ............................................................................................... 36
4 Options for supporting biomethane injection into the grid ............................................ 38
4.1 Incentivising by feed-in-tariff payment made to end-user ....................................... 38
4.2 Incentivising by payment made to producer ............................................................ 39
4.3 Comparison of the two approaches ........................................................................ 40
5 BioLPG ......................................................................................................................... 42
Appendix B ....................................................................................................................... 44
Report on Feasibility of Supporting Biomethane through a Gas Levy ............................. 44
by Ricardo Energy & Environment ................................................................................... 44
1 Introduction ................................................................................................................... 45
2 Public Service Obligation (PSO) for electricity ............................................................. 46
2.1 What is the PSO? .................................................................................................... 46
2.2 How is revenue raised and managed? .................................................................... 46
2.3 The institutional framework ..................................................................................... 47
2.4 Legislative Framework ............................................................................................ 48
3 Feasibility of a PSO on gas customers ........................................................................ 49
3.1 Legislative feasibility ................................................................................................ 49
3.2 Operational feasibility .............................................................................................. 49
4 International examples ................................................................................................. 51
5 Advantages and disadvantages of a gas levy .............................................................. 53
5.1 Advantages.............................................................................................................. 53
5.2 Disadvantages ......................................................................................................... 54
5.3 Other alternatives .................................................................................................... 56

Interface analysis and report for incorporation and alignment of data from Biomethane study into RHI workstream
4
Authors
For comments or queries please contact:
Element Energy
+44 (0)1223 852499
Ricardo Energy & Environment
+44 (0)1235 753524
Interface analysis and report for incorporation and alignment of data from Biomethane study into RHI workstream
5
1 Introduction
This study was commissioned by the Sustainable Energy Authority of Ireland (SEAI) to
incorporate the relevant aspects of the Assessment of the costs and benefits of biogas and
biomethane study completed by Ricardo Energy & Environment for SEAI into the
Economic analysis for an RHI for Ireland work undertaken by Element Energy for the
Department of Communications, Climate Action and Environment (DCCAE). The primary
aim of this work is to ensure the best information on biogas and biomethane technologies
is included in the RHI analysis, and to include those technologies on the same basis as the
other renewable heat technologies being examined. This work also ensured the alignment
of data inputs across the two studies.
This report covers the following:
Derivation of a set of scenarios for the tariffs within a Renewable Heat Incentive
(RHI) scheme for anaerobic digestion (AD) and biomethane, using an approach
consistent with that taken for the renewable heating technologies included in the
Economic analysis for an RHI for Ireland work;
An assessment of whether biomethane production should be incentivised through
support to the producer or end user of the biomethane;
An initial assessment of the potential to fund support for biomethane through a
levy on gas consumers, focusing on an estimate of the size of the levy that would
be required in a range of scenarios for RHI design and biomethane deployment;
A preliminary assessment of the cost of supplying Bio-liquefied petroleum gas
(BioLPG) in Ireland, and the size of the tariff required to support this through the
RHI.
This report was prepared jointly by Ricardo Energy & Environment and Element Energy.
Interface analysis and report for incorporation and alignment of data from Biomethane study into RHI workstream
6
2 AD CHP, AD boiler and biomethane grid injection tariff
design and uptake modelling
2.1 Tariff design
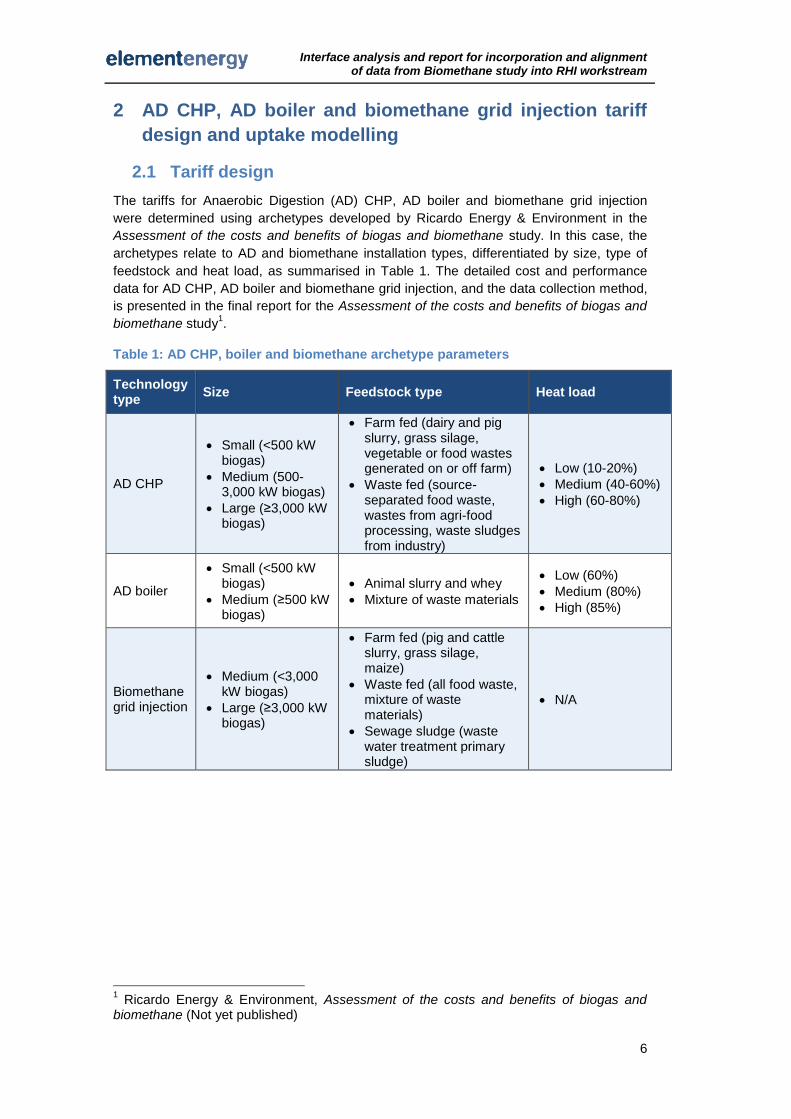
The tariffs for Anaerobic Digestion (AD) CHP, AD boiler and biomethane grid injection
were determined using archetypes developed by Ricardo Energy & Environment in the
Assessment of the costs and benefits of biogas and biomethane study. In this case, the
archetypes relate to AD and biomethane installation types, differentiated by size, type of
feedstock and heat load, as summarised in Table 1. The detailed cost and performance
data for AD CHP, AD boiler and biomethane grid injection, and the data collection method,
is presented in the final report for the Assessment of the costs and benefits of biogas and
biomethane study1.
Table 1: AD CHP, boiler and biomethane archetype parameters
Technology type
Size Feedstock type Heat load
AD CHP
Small (<500 kW biogas)
Medium (500-3,000 kW biogas)
Large (≥3,000 kW biogas)
Farm fed (dairy and pig slurry, grass silage, vegetable or food wastes generated on or off farm)
Waste fed (source-separated food waste, wastes from agri-food processing, waste sludges from industry)
Low (10-20%)
Medium (40-60%)
High (60-80%)
AD boiler
Small (<500 kW biogas)
Medium (≥500 kW biogas)
Animal slurry and whey
Mixture of waste materials
Low (60%)
Medium (80%)
High (85%)
Biomethane grid injection
Medium (<3,000 kW biogas)
Large (≥3,000 kW biogas)
Farm fed (pig and cattle slurry, grass silage, maize)
Waste fed (all food waste, mixture of waste materials)
Sewage sludge (waste water treatment primary sludge)
N/A
1 Ricardo Energy & Environment, Assessment of the costs and benefits of biogas and
biomethane (Not yet published)

Interface analysis and report for incorporation and alignment of data from Biomethane study into RHI workstream
7
2.2 Uptake of AD CHP, AD boiler and biomethane grid
injection
Given the circumstances in which many AD CHP and AD boiler plants are expected to be
developed, which is largely in an agricultural context, an important source of uncertainty is
the on-site heat demand. The heat from AD is not ‘dispatchable’, as the anaerobic
digestion plant producing the biogas used for heat cannot be turned on and off on a
frequent basis in the same way other heating systems can, and so the operating cost of
the AD plant is independent of the heat load. The available on-site heat demand will
therefore determine the heat load factor of the plant and the ‘useful’ proportion of heat
generated, and will have an important bearing on the cost-effectiveness of generating
renewable heat through these technologies. An important consideration in selecting the
final scheme tariffs will be the need to provide a tariff sufficient to incentivise uptake of the
desired type and number of installations, while not encouraging inefficient use of heat
generated.
For each archetype for AD CHP and AD boiler, therefore, three cases were studied
relating to the level of on-site heat demand; these are referred to as Low (LHL), Medium
(MHL) and High (HHL) heat load cases. A separate RHI tariff was calculated for each heat
load case. For biomethane grid injection, an operational load factor of 100% is assumed,
i.e. all biomethane produced can be injected into the grid2. It is assumed that AD boiler
systems would only be installed where a heat load is present so all heat load factors are
relatively high. In the case of AD CHP plant, which are likely to be installed primarily for
the production of electricity from biogas, in the worst case the only heat demand might be
that required to ensure operation of the digester itself and any pasteurisation of feedstocks
which is required, which leads to low (10 to 20%) heat loads depending on the feedstock.
2 This is typically the case, although there could be instances, if gas is injected at points
where summertime flows of natural gas are low due to reduced demand, when it may be necessary for grid operational reasons to temporarily suspend injection.

Interface analysis and report for incorporation and alignment of data from Biomethane study into RHI workstream
8
Table 2: Heat load factors by archetype for AD CHP and AD boiler
System ID Heat load factor
LHL MHL HHL
Boiler A 60% 80% 85%
Boiler B 60% 80% 85%
CHP A 15% 40% 80%
CHP B 10% 40% 80%
CHP C 15% 40% 80%
CHP D 15% 40% 80%
CHP E 10% 40% 80%
CHP F 20% 50% 80%
CHP G 20% 50% 80%
CHP H 20% 60% 80%
CHP I 20% 50% 80%
CHP J 20% 40% 60%
It is important to note that the RHI tariffs presented here assume ongoing support for AD
CHP through a Renewable Electricity Support Scheme (i.e. the successor to REFIT 3), in
addition to the RHI tariffs given here. For the purposes of this analysis, we assume an
indicative, flat level of support for renewable electricity of AD CHP of 14 c/kWh electricity
exported in 2016, approximately in line with the level offered through REFIT 3. The support
level is projected forward according to the same procedure as for the electricity retail
prices as described in the Economic analysis for an RHI for Ireland report; however, we
assume that the Renewable Electricity Support Scheme support level received by any
given AD CHP installation remains fixed in real terms over the installation lifetime, even if
the support level offered to new installations changes over time. The electricity exported is
assumed to be 100% of the electricity produced.
In addition, it is assumed that the heat to the digester is an eligible heat use, such that this
is included in the estimates of the on-site heat load. We note that, in the UK RHI scheme,
heat used in the pasteurisation and drying of the digestate has not qualified for RHI
payment to date3; and that it is proposed in the recent consultation document on reforms
to the UK RHI that this position is retained and that there will be no RHI payments for heat
input to the digester in the future4. Within Ireland, the definition of high efficiency CHP
allows for heat used in the AD process itself to be counted as ‘useful’ heat provided it can
be demonstrated that it is economically justifiable5. The definition of eligible heat uses in
general, and in the particular case of AD, will be an important consideration. In the case
3 Ofgem, Non-domestic Renewable Heat Incentive (RHI) Guidance Volume One: Eligibility
and How to Apply (Version 8) (November 2016) 4 Department of Energy and Climate Change, The Renewable Heat Incentive: A reformed
and refocused scheme: Proposed reforms to the existing Domestic and Non-Domestic Renewable Heat Incentive schemes, URN: 16D/012 (March 2016) 5 Commission for Energy Regulation. Certification Process for High Efficiency CHP
Decision Paper (CER/12/125) (March 2012)

Interface analysis and report for incorporation and alignment of data from Biomethane study into RHI workstream
9
that heat input to the digester was not deemed eligible, somewhat higher levels of support
than those presented here would likely be required.
In order to align the AD and biomethane tariff calculation methodology with the other
technologies considered in this assessment, the metering, additional and hidden costs
were set as for the other technologies.
The RHI tariffs required for each archetype for each set of design options were then
determined. Table 3 to Table 5 present the tariffs for Scenario 2 (see the Economic
analysis for an RHI for Ireland report). It can be seen that a wide range of tariffs is required
to incentivise the range of archetypes, reflecting the variation in cost-effectiveness across
different feedstock types, heat load levels and installation sizes, and whether the plant is
entirely new or whether part of the required infrastructure already exists.
Table 3: AD boiler tariffs by system design (Scenario 2)
System ID Feedstock Capacity,
kWth Heat load
Heat output, MWh/yr
Tariff required,
c/kWh
Boiler A Farm - slurry and waste
48
Low 200 4.23
Medium 267 3.16
High 284 2.60
Boiler B Waste – mixture of waste material
1,285
Low 4,888 0.00
Medium 6,517 0.00
High 6,925 0.00

Interface analysis and report for incorporation and alignment of data from Biomethane study into RHI workstream
10
Table 4: AD CHP tariffs by system design (Scenario 2)
System
ID Feedstock
Capacity,
kWth Heat load
Heat output, MWh/yr
Tariff, c/kWh
CHP A Farm – slurry 100
Low 122 202.56
Medium 326 72.78
High 652 33.22
CHP B Farm – slurry and silage
100
Low 81 33.93
Medium 326 4.25
High 652 0.00
CHP C Farm – slurry 196
Low 256 19.01
Medium 683 3.16
High 1,365 0.00
CHP D Farm – slurry and silage
512
Low 740 32.24
Medium 1,972 8.13
High 3,945 1.79
CHP E Farm – silage and slurry
500
Low 407 147.21
Medium 1,629 32.05
High 3,259 13.75
CHP F
Farm – source-separated food waste, agri-food waste and grass silage
527
Low 1,079 59.42
Medium 2,697 20.86
High 4,315 10.99
CHP G
Farm – livestock manure, food waste and food process wastes
500
Low 880 0.00
Medium 2,200 0.00
High 3,519 0.00
CHP H Waste – mixture of waste materials
500
Low 821 0.00
Medium 2,464 0.00
High 3,285 0.00
CHP I
Farm & Waste Fed – grass, slurry and food waste or sludges from industrial source
1,500
Low 2,444 19.12
Medium 6,110 4.74
High 9,776 0.92
CHP J Waste Fed – all food waste
3,000
Low 4,888 0.00
Medium 9,776 0.00
High 14,664 0.00

Interface analysis and report for incorporation and alignment of data from Biomethane study into RHI workstream
11
Table 5: Biomethane tariffs by system design (Scenario 2)
System
ID Feedstock Comments
Capacity, kW biogas
Biomethane produced,
MWh/yr
Tariff required,
c/kWh
BM A
Farm - silage (60%) and slurry (40%)
Biogas from several individual AD plant (five assumed) is transported by low pressure pipeline to a centralised upgrading and injection point
1,115 9,084 5.54
BM B Waste Fed - MSW food waste
Plant capable of taking contained source separated food waste from MSW and commercial waste collections
1,746 14,529 6.75
BM C Waste Fed - MSW food waste
Plant capable of taking contained source separated food waste from MSW and commercial waste collections
6,199 50,502 0.42
BM D
Waste Fed - food processing wastes
Plant taking less contaminated food wastes, typically with higher biogas yields
6,265 51,039 1.40
BM E Farm - maize and food waste
Farm-based plants taking energy crops and waste
6,747 54,966 6.23
BM F Farm - silage and slurry
Farm-based plant based on silage and slurry
6,341 51,655 2.59
BM G Farm - silage and slurry
Similar plant to BM F but biomethane is compressed and taken by road to a central injection point
6,341 51,655 3.17
BM H
Wastewater treatment primary sludge
Existing wastewater treatment plant; only costs included are those for upgrading to biomethane and injection
4,385 35,727 0.00
As for all the other renewable heating technologies studied, tiered tariffs6 for AD CHP, AD
boilers and biomethane are based on the tariff required for a reference installation7 of the
appropriate technology and size.
6 Here, a tiered tariff refers to a structure whereby the tariff (in the form of cents/kWh)
reduces as the heat output from the installation increases. The tariffs are paid on a marginal basis, such that an increase in the heat output always results in an increase in the overall payment. 7 The reference installations are the theoretical/modelled installations intended to be
representative of each of the technology and tier segments defined in the RHI tariff structure. For example, as shown in Table 6, the tariff for the technology and tier segment corresponding to AD boilers with annual heat output ≤2,400 MWh/yr is based on the tariff calculated for the reference installation defined by ‘Boiler A – MHL’.

Interface analysis and report for incorporation and alignment of data from Biomethane study into RHI workstream
12
The range of archetypes studied for AD CHP, boiler and biomethane grid injection have
widely differing levels of deployment potential, due to the availability of feedstock and, in
the case of BM H, the number of existing wastewater treatment plant. Furthermore, the low
cost-effectiveness of some of the archetypes, and the associated high required tariffs,
means it is unlikely to be desirable to design the tariffs to incentivise those types of plant.
In comparison with tariffs derived for other renewable heating technologies in the
Economic analysis for an RHI for Ireland study, AD CHP archetypes with required tariffs
(in Scenario 2) greater than approximately 15 c/kWh can be seen to be relatively cost-
ineffective. This applies to almost all of the low heat load AD CHP installations along with
some of the slurry- and silage-based AD CHP installations.
As such, we have, in collaboration with Ricardo Energy & Environment, identified the
reference installations corresponding to the types of AD and biomethane plant the RHI
could be designed to incentivise, balancing the requirement for cost-effectiveness against
the desire to ensure sufficient uptake of AD technologies, as described below. However,
we have presented here the required tariffs for each of the individual archetypes (for
Scenario 2) in order to demonstrate the tariff levels that would be required to incentivise
additional types of plant to be deployed (by setting higher tariffs) or to further constrain the
types of plant incentivised (by setting lower tariffs). For example, if there is a desire to
incentivise the use of higher cost feedstocks in order to utilise a particular resource, such
as grass silage, the tariffs would need to be increased accordingly.
Using the individual tariffs and based on stakeholder feedback, reference installations
were selected as described below.
2.2.1 AD boiler: reference installation selection and tariff tiering
The low heat load installations are excluded as reference installations, as it is not deemed
desirable to incentivise these due to the inefficient use of the heat generated. Instead,
installations where a higher fraction of heat is used on-site should be incentivised.
However, it is expected that situations with a high heat load will be limited. Therefore,
installations with medium heat loads are deemed to be the most likely desirable outcome,
and the reference installations are selected from the ‘MHL’ installations.
The key reason for the difference in cost between Boiler A and Boiler B is the different
feedstock, rather than the different size. The waste-fed system would expect to receive a
gate fee, whereas the system fed by farm slurry and waste (generated on farm) mixture
would not. However, Boiler A is also representative of the smaller installations which could
be expected in Ireland. The tier threshold for Tier 1 is therefore based on Boiler A, but with
sufficient ‘headroom’ to incentivise a somewhat larger installation of this type within this
tier.
Taking the reference installation and tiering considerations together, the following tiers and
reference installations were selected for AD boilers. These are set out in full in Table 6.
Tier 1 (0-2.4 GWh): Boiler A with MHL is the representative case at this scale. The
threshold is selected based on a maximum expected capacity of ~200 kW.
Tier 2 (>2.4 GWh): Boiler B with MHL is representative of larger installations. No
tariff required is required for this archetype in Scenario 2, so no further payment is
required within this tier.

Interface analysis and report for incorporation and alignment of data from Biomethane study into RHI workstream
13
2.2.2 AD CHP: reference installation selection and tariff tiering
We emphasise here that the analysis for AD CHP already includes a tariff from the
Renewable Electricity Support Scheme for electricity generated (of 14 c/kWh in the base
year 2016). The tariffs derived here for the RHI are those we find are required in addition
to the renewable electricity support.
Archetypes that are mainly waste-fed, including some mixture of waste with slurry (CHP G,
CHP H and CHP J) are found to be the lowest cost (due primarily to the gate fee received
for the waste), with no RHI tariff required beyond the renewable electricity support.
However, slurry- and silage-based systems (CHP A, CHP B, CHP C, CHP D, CHP E and
CHP F) are included to understand the cost of maximising use of slurry and silage
resource for AD CHP. These are generally higher cost, as shown in Table 4. In
comparison with tariffs derived for other renewable heating technologies, AD CHP
archetypes with required tariffs (in Scenario 2) greater than approximately 15 c/kWh can
be seen to be relatively cost-ineffective.
It is expected that the farm-based installations would rarely achieve the high heat load
level (HHL) so, as for AD boilers, the medium heat load (MHL) is generally taken as the
more appropriate benchmark.
Taking these points together the following tiers and reference installations were selected
for AD CHP:
Tier 1 (0-2.4 GWh): Archetype CHP D with MHL is deemed the highest cost type
of system at this scale that it would be desirable to incentivise, to ensure a
significant fraction of the silage and slurry (i.e. non-waste) potential can be taken
up. As such, this is selected as the reference installation for this tier. Archetypes
CHP A and CHP E with MHL are deemed too high cost to be desirable to
incentivise. Archetypes CHP B and CHP C are lower cost than CHP D, and so will
be incentivised by the tariff derived. The threshold for this tier is based on allowing
a small amount of headroom for the appropriate system types.
Tier 2 (2.4-7.2 GWh): Archetype CHP I with MHL is deemed the highest cost
system desirable to incentivise at this larger scale, as archetype CHP F with MHL
is deemed too high cost. Archetypes CHP G, CHP H and CHP J require no tariff
beyond the renewable electricity support. Again, the threshold is set to allow a
small amount of headroom.
Tier 3 (>7.2 GWh): Only archetype CHP I with HHL is deemed desirable at this
scale for same reasons as given in Tier 2. For archetype CHP I no tariff is required
beyond the payment for Tiers 1-2.
2.2.3 Biomethane: reference installation selection and tariff tiering
Archetype BM H is the special case of an existing wastewater sludge plant, for which it
would be significantly more cost-effective to retrofit to enable biomethane grid injection
compared with the other archetypes studied here. However, this would be limited to
existing wastewater sludge plants and as such has limited potential. Therefore, this
archetype is not deemed appropriate as a reference installation as it is proposed that the
RHI should incentivise a wider range of plant types to contribute to renewable heating
targets.
Archetype BM E is of low relevance due to the very limited availability of maize feedstock
within Ireland and as such is not appropriate as a reference installation. Waste-fed

Interface analysis and report for incorporation and alignment of data from Biomethane study into RHI workstream
14
systems (archetypes BM B, BM C and BM D) tend to have lower costs than silage- and
slurry-fed systems of a similar size, mainly due to the difference in resource cost, as
waste-fed systems would expect to receive gate fees. However, the resource potential of
MSW food waste and food processing waste is relatively limited compared with the
resource of silage and slurry, and stakeholder feedback suggests that the RHI should be
designed to incentivise some level of uptake of this resource (i.e. archetype BM F or BM
G).
There are some economies of scale in the biogas to biomethane upgrading step, which
accounts for some of the differences in cost-effectiveness with installation size (such as
between archetypes BM B and BM C). This suggests that some degree of tiering is
appropriate. We note that archetype BM A represents a case where the biogas output of
several (here it is assumed five) small AD plants would be delivered to a central grid
injection point, so for the purposes of the tariff tiering the annual biomethane capacity of
this archetype should be treated as the output of five of the individual AD plants (54.5
GWh rather than 10.9 GWh). Stakeholder feedback suggests that there will not be many
biomethane plants larger than the archetypes shown here, in the case of Ireland (due
mainly to the typical size of the agricultural facilities supplying slurry and silage, and in the
case of food wastes, to the relatively small number of large urban conglomerations where
sufficient quantities of food waste are available within a relatively small area8). However, to
determine the thresholds for the tiers, some ‘headroom’ to account for some variation in
the size of installations versus the sizing of archetypes is assumed here.
Taking the reference installation and tiering considerations together the following tiers and
reference installations were selected for biomethane:
Tier 1 (0-30 GWh/yr): Archetype BM B is selected as the reference installation as it
is the only type representative of installations with an output of <30 MWh/yr (since
BM A involves the delivery of the biogas output of five individual AD plant to a
central injection point, as described above).
Tier 2 (30-60 GWh): Archetype BM A is selected as the reference installation as it
has the highest required tariff of the remaining archetypes deemed desirable to
incentivise (once we have removed BM E for the reason above).
Tier 3 (>60 GWh): Of the larger archetypes that are desirable to incentivise
(including archetypes BM C, BM D and BM F) no further payment beyond the 60
MWh in Tiers 1 and 2 is required. Archetype BM F is selected as the reference
installation as this requires the highest tariff of those deemed desirable to
incentivise at this scale. However, we note that since this installation requires no
further payment beyond tiers 1 and 2, the same results are seen when archetypes
BM C or BM D are selected as the reference for tier 3).
8 Feedstocks for AD typically have a high moisture content meaning that costs for
transporting them are relatively high and AD plant typically seek to source feedstocks within a relatively small radius of the plant.

Interface analysis and report for incorporation and alignment of data from Biomethane study into RHI workstream
15
Table 6: AD boiler, AD CHP and biomethane tariff structure and reference installations
Tier Lower limit,
MWh/yr
Upper limit,
MWh/yr Reference installation
Anaerobic digestion boiler
1 N/A ≤2,400 Boiler A - MHL
2 ˃2,400 N/A Boiler B - MHL
Anaerobic digestion CHP
1 N/A ≤2,400 CHP D - MHL
2 ˃2,400 ≤7,200 CHP I - MHL
3 ˃7,200 N/A CHP I - HHL
Biomethane grid injection
1 N/A ≤30,000 BM B
2 ˃30,000 ≤60,000 BM A
3 ˃60,000 N/A BM F
For each of the shortlisted scenarios, the tiered tariffs for AD boiler, AD CHP and
biomethane were calculated following the design options as applied to derive the tariffs for
the other technologies. However, these tariffs were not used to determine the uptake of
these technologies in the BioHEAT model. Instead, the estimated deployment of AD and
biomethane was determined by Ricardo Energy & Environment. This was done taking into
consideration how fast the industry could develop in Ireland, based on estimates from
stakeholders of number of plant per year which could be built in period to 2020 and
thereafter, and experience from UK on the rate the industry expanded in response to
introduction of support (taking account of differences in the final size of the market). The
deployment scenarios are presented in Table 7. For all scenarios studied here, the uptake
of AD and biomethane was taken as the Central deployment scenario. We note that, in
reality, the uptake of AD and biomethane would (like all other technologies) depend on the
level of the RHI tariffs offered along with tariffs offered for renewable electricity through the
Renewable Electricity Support Scheme; however, this impact was not modelled here.
The heat production estimated in Table 7 assumes that all biomethane injected into the
grid is used for heat production. However, it should be noted that under the Renewable
Energy Directive, in accounting for the contribution of biomethane injected to the grid
towards sectoral renewable energy targets for heat, electricity and transport, the quantity
of biomethane must be divided between these three sectors in the proportions that natural
gas use is divided between these sectors. About half (46%) of natural gas consumption in
Ireland is estimated to be for heating9. Allocating only 46% of biomethane produced to the
heat sector would reduce the total heat produced in the central deployment scenario to 79
GWh/yr and in the high deployment scenario to 91 GWh/yr.
9 Based on data in 2015 Energy Balance, an estimated 46% of natural gas is used for
heating. Assumes all final energy consumption of gas is used for heat, apart from that used in transport sector. Energy balance is available at http://www.seai.ie/Energy-Data-Portal/Energy-Balance/

Interface analysis and report for incorporation and alignment of data from Biomethane study into RHI workstream
16
Table 7: Deployment scenarios for AD CHP, AD boilers and biomethane grid injection in 2020
System ID
Low deployment Central deployment High deployment
LHL MHL HHL LHL MHL HHL LHL MHL HHL
Boiler A - - 2 - - 3 - - 3
Boiler B - 1 - - - 1 - - 1
CHP A - - - - - - - - -
CHP B - - 2 - - 2 - - 1
CHP C - - 1 - - 1 - - 1
CHP D - - 1 - - 1 - - 1
CHP E - - - - - - - - -
CHP F - - - - - - - - -
CHP G - - 2 - - 4 - - 4
CHP H - - 2 - - 4 - - 4
CHP I - 1 - - - 1 - - 1
CHP J - - 1 - - 1 - - -
BM A - - -
BM B - - 1
BM C - - -
BM D - - 1
BM E - - -
BM F - - -
BM G - - -
BM H - 1 1
Number of plants 13 19 19
Total heat, GWh/yr 47 96 140

Interface analysis and report for incorporation and alignment of data from Biomethane study into RHI workstream
17
3 Funding support for biomethane through a levy on gas
consumers
Biomethane production could be supported by payments to the producer of the
biomethane (as in the UK RHI) or by payments to the final user of the biomethane. As part
of the Interface study, SEAI asked Ricardo Energy & Environment to evaluate the
advantages and disadvantage of these two approaches. This work, which also examined
what approach has been used in other countries that support biomethane and which
approach stakeholders would prefer, is reported in full in Appendix A. It concluded that
both approaches have been used in other countries, and that both of the approaches had
some advantages and disadvantages, although mechanisms could be put in place to
overcome some of the issues identified. It found that stakeholders in Ireland would
generally prefer payments directly to the operator injecting biomethane to the grid (which
would typically be the biomethane producer).
The Interface study also required Ricardo Energy & Environment to examine whether
support for biomethane could be funded through a levy on gas consumers and Element
Energy to complete a preliminary analysis of this option. The work by Ricardo Energy &
Environment, which examines the legislative and operational feasibility of such an
approach and whether other countries have used this approach to fund support (rather
than exchequer funding), is reported in full in Appendix B. In the form studied here,
biomethane producers would be supported through the RHI, and the RHI payment
required would be raised (on an annual basis) through a levy on certain gas consumers.
The levy is assumed to be fixed in c/kWh terms for each year, but to vary year to year
according to the amount that needs to be raised.
The objective of this preliminary analysis is to understand the likely size of the levy under a
range of scenarios for (i) the deployment level of biomethane and (ii) the design of the RHI
and, accordingly, the tariff offered to biomethane producers.
3.1 Approach
The annual RHI payment required to support biomethane is determined for three
biomethane deployment scenarios (Low, Central and High deployment), using the tariffs
derived in three representative RHI design scenarios taken from the Economic analysis for
an RHI for Ireland report. The annual payment required is then combined with the
expected annual gas consumption across the eligible sectors (see below) to calculate the
annual gas levy required (on a c/kWh basis) over the duration of the scheme.
3.1.1 Applicability of the gas levy
In this analysis, according to guidance from SEAI and DCCAE, we make the following
assumptions regarding the applicability of the gas levy:
Gas levy applies to public, commercial and industrial gas consumers;
Residential gas consumers, and the use of gas to generate electricity, are exempt
from the levy.
3.1.2 Biomethane RHI tariffs and support period
The tariffs for biomethane and the duration of support are based on our analysis presented
in the Economic analysis for an RHI for Ireland report, which includes a range of design
options for the RHI, and hence a range of tariffs for biomethane. For the analysis of the

Interface analysis and report for incorporation and alignment of data from Biomethane study into RHI workstream
18
gas levy funding mechanism, the results are presented for the three RHI design scenarios
listed in Table 8.
In addition, two cases for the period of eligibility for RHI support for biomethane are
assessed: in case (i) the RHI supports new biomethane plant installed over the period
2018–2020 and in case (ii) the RHI supports new biomethane plant installed over the
period 2018–2025.
For all scenarios the RHI payments required are determined using the tariffs tiered by
annual biomethane output taken from the Economic analysis for an RHI for Ireland report,
as shown in Table 9. The duration of support in each case is 15 years and the tariffs are
constant over the support period.
Table 8: RHI design scenarios included in gas levy analysis
RHI design scenario
Scenario name
2 Default design options
5 Tariffs capped at biomass boiler tariffs
8 Higher IRR (12%)
Table 9: Biomethane tariffs in the three RHI design scenarios
RHI design
scenario Tier
Lower limit,
MWh/yr
Upper limit,
MWh/yr Tariff, c/kWh
2
1 N/A ≤30,000 6.75
2 ˃30,000 ≤60,000 4.04
3 ˃60,000 N/A 0.00
5
1 N/A ≤300 6.75
2 ˃300 ≤1,000 5.56
3 ˃1,000 ≤3,000 2.37
4 ˃3,000 ≤10,000 2.25
5 ˃10,000 ≤30,000 1.67
6 ˃30,000 ≤60,000 1.67
7 ˃60,000 N/A 0.00
8
1 N/A ≤30,000 9.06
2 ˃30,000 ≤60,000 2.43
3 ˃60,000 N/A 0.00
3.1.3 Deployment scenarios for biomethane
The three scenarios for deployment of biomethane to 2025 were developed by Ricardo
Energy & Environment, based on stakeholder consultation and their own analysis. The
deployment is disaggregated across the biomethane archetypes, for which individual RHI
tariffs have been calculated, as shown above in Table 5. The three deployment scenarios
(Low, Central and High) are summarised in Table 10 to Table 12. Here, it is assumed that

Interface analysis and report for incorporation and alignment of data from Biomethane study into RHI workstream
19
no further deployment will occur once the period of eligibility for RHI support ends (either in
2020 or 2025 depending on the case in question).
Table 10: Low deployment scenario for biomethane (cumulative uptake by archetype)
10
System ID 2018 2019 2020 2021 2022 2023 2024 2025
BM A - - - - - - - 5
BM B - - - - - 1 1 1
BM C - - - - - - - -
BM D - - - - - - - -
BM E - - - - - - - -
BM F - - - - - - - -
BM G - - - - - - - -
BM H - - - - - - - -
Total number of plants - - - - - 1 1 6
Total biomethane, GWh/yr 0 0 0 0 0 15 15 60
Table 11: Central deployment scenario for biomethane (cumulative uptake by archetype)
10
System ID 2018 2019 2020 2021 2022 2023 2024 2025
BM A - - - - - - - 5
BM B - - - - 1 1 2 2
BM C - - - - - - - -
BM D - - - - - - - -
BM E - - - - - - - -
BM F - - - - - 1 1 1
BM G - - - - - - - -
BM H - - 1 1 1 1 1 1
Total number of plants - - 1 1 2 3 4 9
Total biomethane, GWh/yr 0 0 36 36 50 102 116 162
Table 12: High deployment scenario for biomethane (cumulative uptake by archetype)
10
System ID 2018 2019 2020 2021 2022 2023 2024 2025
BM A - - - - - 5 5 10
BM B - - 1 1 2 2 3 3
BM C - - - - - - - -
BM D - - 1 1 1 1 1 1
BM E - - - - - - - -
BM F - - - - - 1 1 1
BM G - - - - - - - -
BM H - - 1 1 2 2 2 2
Total number of plants - - 3 - 5 11 12 17
Total biomethane, GWh/yr 0 0 101 101 152 249 263 309
10
Note: No further deployment is expected once the period of eligibility for RHI support ends. Therefore, the deployment shown for 2021-2025 is only expected to occur if the RHI scheme remains open to new applicants beyond 2020.

Interface analysis and report for incorporation and alignment of data from Biomethane study into RHI workstream
20
3.1.4 Gas consumption across applicable sectors
The gas consumption on which the levy is to be applied, over the period 2020 to 2035 or
2040 (depending on the period of eligibility for support) is based on SEAI’s Energy
Forecasts, using the ‘NEEAP/NREAP’ scenario. This scenario assumes that Ireland’s
National Energy Efficiency Action Plan (NEEAP) and National Renewable Energy Action
Plan (NREAP) strategies to 2020 are met, but that no further policies are implemented
after that. It may therefore be expected, given the ongoing drive for energy efficiency and
decarbonisation beyond 2020, that this scenario provides an upper bound to the gas
consumption. A lower gas consumption, for the same level of support for biomethane,
would translate into a higher gas levy according to a simple reciprocal relationship; for
example, a 20% lower gas consumption across the applicable sectors would lead to a 25%
increase11
in the gas levy in cents/kWh terms.
The proportion of the annual gas demand in all sectors, excluding gas used for electricity
generation but including residential gas demand (even though the levy is not applied to the
residential sector), which is provided by biomethane is given in Table 13 for each
deployment scenario.
Table 13: Proportion of annual gas demand provided by Biomethane (excluding gas used for electricity generation)
Year
Period of eligibility for RHI support 2018–2020
Period of eligibility for RHI support 2018–2025
Low Central High Low Central High
2018 0.0% 0.0% 0.0% 0.0% 0.0% 0.0%
2019 0.0% 0.0% 0.0% 0.0% 0.0% 0.0%
2020 0.0% 0.2% 0.6% 0.0% 0.2% 0.6%
2021 0.0% 0.2% 0.6% 0.0% 0.2% 0.6%
2022 0.0% 0.2% 0.6% 0.0% 0.3% 0.9%
2023 0.0% 0.2% 0.6% 0.1% 0.6% 1.4%
2024 0.0% 0.2% 0.6% 0.1% 0.7% 1.5%
2025 0.0% 0.2% 0.6% 0.3% 0.9% 1.8%
2026 0.0% 0.2% 0.6% 0.3% 0.9% 1.8%
2027 0.0% 0.2% 0.6% 0.3% 0.9% 1.8%
2028 0.0% 0.2% 0.6% 0.3% 0.9% 1.8%
2029 0.0% 0.2% 0.6% 0.3% 0.9% 1.8%
2030 0.0% 0.2% 0.6% 0.3% 0.9% 1.8%
2031 0.0% 0.2% 0.6% 0.3% 0.9% 1.8%
2032 0.0% 0.2% 0.6% 0.3% 0.9% 1.7%
2033 0.0% 0.2% 0.6% 0.3% 0.9% 1.7%
2034 0.0% 0.2% 0.6% 0.3% 0.9% 1.7%
2035 0.0% 0.0% 0.0% 0.3% 0.7% 1.2%
2036 0.0% 0.0% 0.0% 0.3% 0.7% 1.2%
2037 0.0% 0.0% 0.0% 0.3% 0.6% 0.9%
2038 0.0% 0.0% 0.0% 0.3% 0.3% 0.3%
2039 0.0% 0.0% 0.0% 0.3% 0.3% 0.3%
2040 0.0% 0.0% 0.0% 0.0% 0.0% 0.0%
11
Since 1/(1 – 20%) = 125%

Interface analysis and report for incorporation and alignment of data from Biomethane study into RHI workstream
21
3.2 Results and discussion
The gas levy required during each year 2018–2040 has been derived for each combination
of biomethane deployment scenario and RHI design scenario. As described above, this
has been repeated for two cases: (i) for a period of eligibility for RHI support 2018–2020,
and (ii) for a period of eligibility for RHI support 2018–2025. The results are shown for the
case of eligibility to 2020 in Table 14, and for the case of eligibility to 2025 in Table 15. In
the case studied here, biomethane producers would receive support for 15 years, such
that plant coming online in 2020 will receive support until 2034 inclusive, and plant coming
online 2025 will require support until 2039 inclusive.
For the period of eligibility for RHI support for biomethane of 2018–2020, the peak gas levy
required ranges from 0.006 c/kWh for the Central biomethane deployment scenario in RHI
design scenario 5 to 0.063 c/kWh for the High biomethane deployment scenario in RHI
design scenario 8.
For the period of eligibility for RHI support of 2018–2025, the levy required increases after
2020 as the number of biomethane plants deployed increases. In this case, the gas levy
increases to 0.032 c/kWh by 2025 for the Central biomethane deployment scenario in RHI
design scenario 5, and to 0.214 c/kWh by 2025 for the High biomethane deployment
scenario in RHI design scenario 8.
For many scenarios, the gas levy decreases at some point after the deployment of new
biomethane plants ends (for example, after 2021 for the period of eligibility for RHI support
for biomethane of 2018–2020, RHI design scenario 8 in the high deployment scenario)
despite the plants receiving the same level of ongoing support. This is because whilst the
RHI payments remain constant, the gas consumption in the applicable sectors increases,
such that the fixed amount which needs to be raised is spread over a larger levy base
each year.
For RHI design scenario 5, the tariff for each tier is the same or lower than in Scenario 2.
This results in a lower annual RHI payment across the biomethane archetypes and hence
requires a lower gas levy. In contrast, RHI design scenario 8 has higher tariffs than
scenario 2 and therefore a higher levy is required. The gas levy required for the central
biomethane deployment scenario, in RHI design scenario 2 and for the period of eligibility
for RHI support of 2018–2020 is 0.020 c/kWh in 2025. This corresponds to ≈0.2% of the
expected typical gas price for a small user in 2025 (8.7 c/kWh) and ≈0.5% of that for a
large industrial user in 2025 (4.4 c/kWh). Under the high deployment scenario, in RHI
design scenario 2 and for the period of eligibility for RHI support of 2018–2025, the gas
levy required is 0.174 c/kWh in 2025, corresponding to 2.0% and 4.0% of the expected
typical gas price for a small and a large industrial user respectively.

Interface analysis and report for incorporation and alignment of data from Biomethane study into RHI workstream
22
Table 14: Gas levy for period of eligibility for RHI support 2018–2020, c/kWh
Year
RHI design scenario
S2: Default design options S5: Tariffs capped at biomass boiler tariffs
S8: Higher IRR (12%)
Biomethane deployment Scenario
Biomethane deployment Scenario
Biomethane deployment Scenario
Low Central High Low Central High Low Central High
2018 0.000 0.000 0.000 0.000 0.000 0.000 0.000 0.000 0.000
2019 0.000 0.000 0.000 0.000 0.000 0.000 0.000 0.000 0.000
2020 0.000 0.020 0.054 0.000 0.006 0.018 0.000 0.025 0.063
2021 0.000 0.020 0.054 0.000 0.006 0.018 0.000 0.025 0.063
2022 0.000 0.020 0.054 0.000 0.006 0.018 0.000 0.025 0.062
2023 0.000 0.020 0.054 0.000 0.006 0.018 0.000 0.025 0.062
2024 0.000 0.020 0.053 0.000 0.006 0.018 0.000 0.025 0.062
2025 0.000 0.020 0.053 0.000 0.006 0.018 0.000 0.025 0.062
2026 0.000 0.020 0.053 0.000 0.006 0.018 0.000 0.025 0.062
2027 0.000 0.020 0.053 0.000 0.006 0.018 0.000 0.025 0.062
2028 0.000 0.020 0.053 0.000 0.006 0.018 0.000 0.025 0.062
2029 0.000 0.020 0.053 0.000 0.006 0.018 0.000 0.025 0.062
2030 0.000 0.020 0.053 0.000 0.006 0.018 0.000 0.025 0.062
2031 0.000 0.020 0.053 0.000 0.006 0.018 0.000 0.025 0.062
2032 0.000 0.020 0.053 0.000 0.006 0.018 0.000 0.025 0.062
2033 0.000 0.020 0.053 0.000 0.006 0.018 0.000 0.025 0.062
2034 0.000 0.020 0.052 0.000 0.006 0.018 0.000 0.024 0.061
2035 0.000 0.000 0.000 0.000 0.000 0.000 0.000 0.000 0.000
2036 0.000 0.000 0.000 0.000 0.000 0.000 0.000 0.000 0.000
2037 0.000 0.000 0.000 0.000 0.000 0.000 0.000 0.000 0.000
2038 0.000 0.000 0.000 0.000 0.000 0.000 0.000 0.000 0.000
2039 0.000 0.000 0.000 0.000 0.000 0.000 0.000 0.000 0.000
2040 0.000 0.000 0.000 0.000 0.000 0.000 0.000 0.000 0.000

Interface analysis and report for incorporation and alignment of data from Biomethane study into RHI workstream
23
Table 15: Gas levy for period of eligibility for RHI support 2018–2025, c/kWh
Year
RHI design scenario
S2: Default design options S5: Tariffs capped at biomass boiler tariffs
S8: Higher IRR (12%)
Biomethane deployment Scenario
Biomethane deployment Scenario
Biomethane deployment Scenario
Low Central High Low Central High Low Central High
2018 0.000 0.000 0.000 0.000 0.000 0.000 0.000 0.000 0.000
2019 0.000 0.000 0.000 0.000 0.000 0.000 0.000 0.000 0.000
2020 0.000 0.020 0.054 0.000 0.006 0.018 0.000 0.025 0.063
2021 0.000 0.020 0.054 0.000 0.006 0.018 0.000 0.025 0.063
2022 0.000 0.029 0.084 0.000 0.009 0.028 0.000 0.037 0.101
2023 0.009 0.054 0.137 0.003 0.018 0.048 0.012 0.062 0.164
2024 0.009 0.063 0.146 0.003 0.021 0.051 0.012 0.074 0.176
2025 0.036 0.090 0.174 0.014 0.032 0.062 0.049 0.111 0.214
2026 0.036 0.090 0.174 0.014 0.032 0.062 0.049 0.111 0.214
2027 0.036 0.090 0.174 0.014 0.032 0.062 0.049 0.111 0.214
2028 0.036 0.090 0.174 0.014 0.032 0.062 0.049 0.111 0.214
2029 0.036 0.090 0.174 0.014 0.032 0.062 0.049 0.111 0.214
2030 0.036 0.090 0.174 0.014 0.032 0.062 0.049 0.111 0.214
2031 0.036 0.090 0.174 0.014 0.032 0.062 0.049 0.111 0.213
2032 0.036 0.090 0.174 0.014 0.032 0.062 0.049 0.111 0.213
2033 0.036 0.090 0.174 0.014 0.032 0.062 0.049 0.111 0.213
2034 0.036 0.090 0.172 0.014 0.032 0.061 0.049 0.111 0.211
2035 0.036 0.070 0.118 0.014 0.026 0.043 0.049 0.086 0.149
2036 0.036 0.070 0.118 0.014 0.026 0.043 0.049 0.086 0.148
2037 0.036 0.061 0.088 0.014 0.023 0.033 0.049 0.074 0.111
2038 0.027 0.036 0.036 0.011 0.014 0.014 0.037 0.049 0.049
2039 0.027 0.027 0.027 0.011 0.011 0.011 0.037 0.037 0.037
2040 0.000 0.000 0.000 0.000 0.000 0.000 0.000 0.000 0.000
Interface analysis and report for incorporation and alignment of data from Biomethane study into RHI workstream
24
4 Preliminary assessment of an RHI tariff for BioLPG
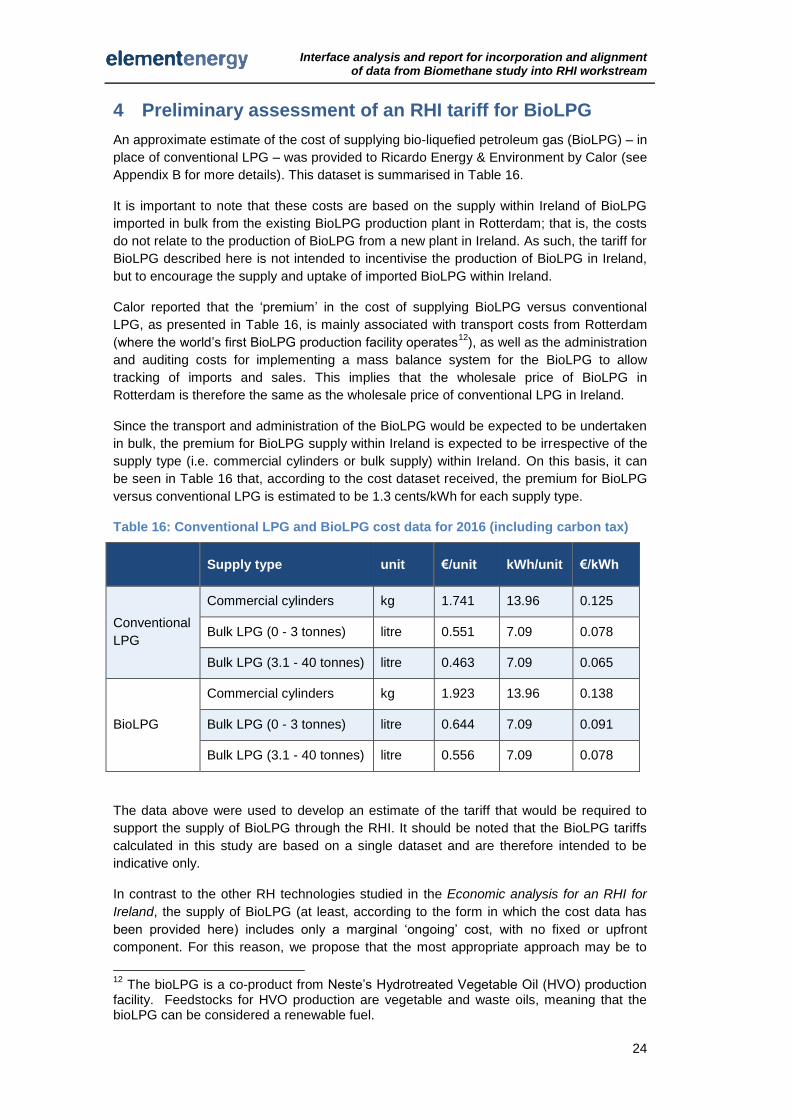
An approximate estimate of the cost of supplying bio-liquefied petroleum gas (BioLPG) – in
place of conventional LPG – was provided to Ricardo Energy & Environment by Calor (see
Appendix B for more details). This dataset is summarised in Table 16.
It is important to note that these costs are based on the supply within Ireland of BioLPG
imported in bulk from the existing BioLPG production plant in Rotterdam; that is, the costs
do not relate to the production of BioLPG from a new plant in Ireland. As such, the tariff for
BioLPG described here is not intended to incentivise the production of BioLPG in Ireland,
but to encourage the supply and uptake of imported BioLPG within Ireland.
Calor reported that the ‘premium’ in the cost of supplying BioLPG versus conventional
LPG, as presented in Table 16, is mainly associated with transport costs from Rotterdam
(where the world’s first BioLPG production facility operates12
), as well as the administration
and auditing costs for implementing a mass balance system for the BioLPG to allow
tracking of imports and sales. This implies that the wholesale price of BioLPG in
Rotterdam is therefore the same as the wholesale price of conventional LPG in Ireland.
Since the transport and administration of the BioLPG would be expected to be undertaken
in bulk, the premium for BioLPG supply within Ireland is expected to be irrespective of the
supply type (i.e. commercial cylinders or bulk supply) within Ireland. On this basis, it can
be seen in Table 16 that, according to the cost dataset received, the premium for BioLPG
versus conventional LPG is estimated to be 1.3 cents/kWh for each supply type.
Table 16: Conventional LPG and BioLPG cost data for 2016 (including carbon tax)
Supply type unit €/unit kWh/unit €/kWh
Conventional
LPG
Commercial cylinders kg 1.741 13.96 0.125
Bulk LPG (0 - 3 tonnes) litre 0.551 7.09 0.078
Bulk LPG (3.1 - 40 tonnes) litre 0.463 7.09 0.065
BioLPG
Commercial cylinders kg 1.923 13.96 0.138
Bulk LPG (0 - 3 tonnes) litre 0.644 7.09 0.091
Bulk LPG (3.1 - 40 tonnes) litre 0.556 7.09 0.078
The data above were used to develop an estimate of the tariff that would be required to
support the supply of BioLPG through the RHI. It should be noted that the BioLPG tariffs
calculated in this study are based on a single dataset and are therefore intended to be
indicative only.
In contrast to the other RH technologies studied in the Economic analysis for an RHI for
Ireland, the supply of BioLPG (at least, according to the form in which the cost data has
been provided here) includes only a marginal ‘ongoing’ cost, with no fixed or upfront
component. For this reason, we propose that the most appropriate approach may be to
12
The bioLPG is a co-product from Neste’s Hydrotreated Vegetable Oil (HVO) production facility. Feedstocks for HVO production are vegetable and waste oils, meaning that the bioLPG can be considered a renewable fuel.

Interface analysis and report for incorporation and alignment of data from Biomethane study into RHI workstream
25
apply an annually-varying tariff, with no fixed period of support (such as the 15 year
duration of support applied in the central case for other RH technologies, where an upfront
cost is incurred). As for all other RH technologies, the tariff would be equal to the
difference in net present value of supplying BioLPG rather than conventional LPG;
however, in this case this can be done on a purely marginal basis, since all costs are
marginal (again, at least in the form in which they have been provided here). We note that
this means that the tariff calculated for supply of BioLPG is independent of the discount
rate applied.
Since it is currently uncertain whether BioLPG will be exempt from the carbon tax/price,
the tariffs are determined both for the case where the carbon tax/price applies to BioLPG,
and the case where BioLPG is exempt from the carbon tax/price. In order to do this,
conventional LPG fuel prices were disaggregated into a component exclusive of the
carbon tax/price, and a component representing the carbon tax/price. For this, we
assumed a carbon intensity for LPG of 0.232 gCO2/kWh, and a current level of carbon tax
of €20 per tonne CO2.
The carbon tax/price component was projected forward according to the larger of the
current level of the carbon tax in Ireland (€20 per tonne) and the projected EU ETS carbon
price (European Union Reference Scenario values), as summarised in Table 17.
The component exclusive of the carbon tax/price was projected forward according to the
wholesale oil price in the UK Department of Energy and Climate Change’s Fossil fuel price
projections13
. However, according to guidance from Ricardo Energy & Environment, the
‘premium’ for BioLPG (excluding any difference in the applicable carbon tax/price) is
assumed to remain constant at 1.3 c/kWh.
The tariffs required are given in Table 18. Given the above, the tariff required remains
constant over time at 1.3 c/kWh in the case where BioLPG is not exempt from the carbon
tax/price. In the case where BioLPG is exempt from the carbon tax/price, the tariff required
decreases as the carbon tax/price increases, which means that the price of conventional
LPG increases and the price gap between the supply of conventional LPG and BioLPG
reduces.
We note that, since the cost premium provided here for the supply of BioLPG versus
conventional LPG is partly due to the cost of transport, and since transport costs would be
expected to change over time, the tariff should be reviewed annually. In order to account
for this in a robust way, the cost premium should be disaggregated into its transport,
administration and other components – this disaggregation was not provided in the dataset
used here. Furthermore, additional data should be sought beyond the single dataset
presented in this analysis to support the final design of a tariff for BioLPG.
13
Department of Energy and Climate Change, Fossil fuel price projections: 2015 (November 2015)

Interface analysis and report for incorporation and alignment of data from Biomethane study into RHI workstream
26
Table 17: Carbon tax/price projections
Year EU ETS Allowances
(€2016 per tonne CO2)14
Larger of current carbon tax of €20 per tonne and the EU ETS Allowance (€2016 per tonne CO2)
15
2016 9.8 20.0
2017 11.4 20.0
2018 13.0 20.0
2019 14.7 20.0
2020 16.3 20.0
2021 17.9 20.0
2022 19.5 20.0
2023 21.2 21.2
2024 22.8 22.8
2025 24.4 24.4
2026 26.8 26.8
2027 29.2 29.2
2028 31.6 31.6
2029 34.0 34.0
2030 36.4 36.4
2031 38.2 38.2
2032 40.0 40.0
2033 41.9 41.9
2034 43.7 43.7
2035 45.6 45.6
14
European Union Reference Scenario values 15
www.revenue.ie (Accessed December 2016)

Interface analysis and report for incorporation and alignment of data from Biomethane study into RHI workstream
27
Table 18: BioLPG tariffs, c/kWh
Year
Tariffs, c/kWh
BioLPG not exempt from
carbon tax/price
BioLPG exempt from carbon
tax/price
2016 1.3 0.9
2017 1.3 0.9
2018 1.3 0.9
2019 1.3 0.9
2020 1.3 0.9
2021 1.3 0.9
2022 1.3 0.9
2023 1.3 0.8
2024 1.3 0.8
2025 1.3 0.7
2026 1.3 0.7
2027 1.3 0.6
2028 1.3 0.6
2029 1.3 0.5
2030 1.3 0.5
2031 1.3 0.4
2032 1.3 0.4
2033 1.3 0.3
2034 1.3 0.3
2035 1.3 0.3

Interface analysis and report for incorporation and alignment of data from Biomethane study into RHI workstream
28
Appendix A
Report on Options for Biomethane Support
by Ricardo Energy & Environment

Interface analysis and report for incorporation and alignment of data from Biomethane study into RHI workstream
29
1 Introduction
1.1 Background
Ricardo Energy & Environment are currently carrying out an economic assessment of the costs and benefits of biogas and biomethane in Ireland for Working Group 2 of the draft bioenergy plan. Element Energy are currently carrying out a study for the Department of Communications, Climate Action and Environment (DCCAE) to undertake an economic analysis and evaluate the economic impacts of a Renewable Heat Incentive (RHI) for Ireland. The RHI study considered biogas CHP, but not the upgrading of biogas into biomethane and its injection into the grid. In order to ensure a full and robust assessment of the viability and cost-effectiveness of supporting biogas and biomethane under the RHI and the associated optimal design of such an RHI tariff, SEAI have commissioned an ‘interface’ piece of work, carried out jointly by Ricardo Energy & Environment and Element Energy to ensure that all appropriate information is available to consider potential support for biomethane under an RHI alongside other renewable heat technologies. This short report from Ricardo Energy & Environment sets out the findings from Task 1 of the interface study ‘Options for biomethane and biopropane payments under the RHI’. It provides an overview and analysis of the options available for supporting Biomethane-to-Grid (BtG) under the RHI, and discusses the advantages and disadvantages of offering payment to the biomethane producer, versus the biomethane end user.
1.2 Biomethane and Renewable Energy Targets
Biomethane can be produced by upgrading the biogas produced from anaerobic digestion
plant; this involves removing the CO2 and other impurities in the biogas. The biomethane
produced can then be injected into the natural gas grid, either directly, or by transporting it by
road to a centralised injection point. Once in the grid, it is delivered along with the natural gas
to all natural gas consumers who may use it to generate heat and/or electricity or compress it
and use it as a vehicle fuel. It is also possible to use the biomethane directly as a vehicle fuel
without using the gas grid, by locating a biomethane filling station at the same site as the AD
plant producing the biomethane, or transporting the biomethane directly by road to a filling
station.
As a renewable resource, biomethane can count towards Ireland’s renewable energy targets under the Renewable Energy Directive (RED)
16; Ireland has an overall renewables target under
the RED for 16% of total final energy consumption to come from renewable energy in 2020, and a binding target of 10% renewable energy in transport. There are also individual national targets for 2020 of contributions from renewable energy in electricity (RES-E) and renewable energy for heat and cooling (RES-H), which are 40% and 12% respectively. As biomethane can be used in each of these sectors, it can potentially contribute to each of these targets. When the biomethane is injected into the grid, then the RED stipulates that its contribution must be allocated between these three sectoral targets in the same proportions as natural gas use. So for example in Ireland, about 46% of natural gas is used for heat
17, so therefore 46% of any
biomethane injected into the grid can be assumed to be used in the production of heat, and the heat produced from that quantity of biomethane can be counted against the RES-H target. Where biomethane is used as a vehicle fuel without being transported in the natural gas grid, then all of that biomethane can be counted against the RES-T target.
16
Renewable Energy Directive (009/28/EC) 17
Based on data in 2015 Energy Balance. Assumes all final energy consumption of gas is used for heat, apart from that used in transport sector. Energy balance is available at http://www.seai.ie/Energy-Data-Portal/Energy-Balance/

Interface analysis and report for incorporation and alignment of data from Biomethane study into RHI workstream
30
This approach is however being challenged by some countries. Italy, who have a relatively high use of natural gas in the transport sector, and wish to use biomethane as way of meeting their 10% RED target for the transport sector are setting up a biomethane monitoring mechanism to allow the correct allocation of biomethane to the correct sector of use without any proportional allocation. All transport fuel distributors signing long–term contracts with biomethane producers will be required to register their contracts into a specific centralised database managed by the Italian state owned Renewable Energy Agency (GSE). Contracts for withdrawals from the grid will also be registered in the database, allowing the quantity of biomethane going to the transport sector to be calculated
18.
At present it is not clear that the European Commission will allow tracking schemes such as the one being set up in Italy to be used to specifically allocate biomethane use to particular sectors based on the end use of the biomethane. If the accounting rules under RED were changed by the EC to permit the allocation of biomethane to specific end use sectors using information from such tracking systems, it is possible that a similar system could be developed to monitor the flow of biomethane in to the grid and its final end use in Ireland (e.g. if the Green Gas Certification Scheme discussed in Section 4 was implemented). In that case, biomethane could be allocated to specific sectoral RES targets on a tracked basis, rather than using proportional allocation. The implications that such a change could have in the relative advantages and disadvantages of different types of support mechanisms is considered in the relevant sections of the report.
1.3 Support for biomethane
Under current market conditions, biomethane cannot compete against natural gas on price
alone. As a result, several support schemes have been developed across Europe, which have
led to the rapid deployment of biomethane plants in several European countries. These
schemes vary in type, with some supporting the production of biomethane directly and others
supporting the production of renewable electricity produced from biomethane injected to the
grid. Full details are given in Section 2.
Key stakeholders in the biogas and biomethane area were asked as part of the wider
stakeholder consultation carried out by Ricardo Energy & Environment on their economic
assessment study, for their views on the most appropriate financial mechanisms for supporting
BtG. These are summarised in Section 3. Based on the review from Section 2 and 3, Section 4
provides a summary of the available options, their pros and cons and makes recommendation
regarding the most appropriate option for supporting BtG under the RHI. Section 5 considers
bioLPG.
1.4 Options for supporting BtG
The key players involved in the biomethane supply chain are;
The biomethane Producer (which could also be the biogas producer and owner of the AD / biogas upgrade plant),
18
Perrella G and D’Innocenzo W, Ministry of Economic Development. ‘The potential role of biomethane in Italian transport’, presentation to the IEA Bioenergy ExCo77 workshop, Rome, 17 May 2016.

Interface analysis and report for incorporation and alignment of data from Biomethane study into RHI workstream
31
The Gas Transporter; this is the company which owns / operates the gas pipeline and so needs to ensure that the biomethane injected is compliant with national requirements,
The Gas Shipper who contracts with the gas transporter to deliver gas through the gas pipeline and a contract with the producer to buy the biomethane from them. A gas shipper must have a license before they are able to take part in any shipping action.
The Supplier; this is the company which buys gas from shipper and sells it to the end-user (as ‘green gas’),
The End-user of the biomethane; e.g. a CHP plant or any user which would normally use natural gas from the grid
Biomethane can be incentivised either by providing support directly to the producer of biomethane or to one of the key players down the supply chain e.g. the gas supplier or gas end users. Potential options under these two broad approaches - support to end user or support to producer include:
Approach 1: Incentivisation at the end-user / demand side: - Payments to the end user for either each unit of renewable gas consumed or
used or per unit of renewable electricity and/or heat produced from renewable gas used,
- Investment support (for example, capital grants for investment in CHP running on biomethane),
- Tax relief on fuel or electricity for sites using biomethane, - Revenues from emission trade where the product of the end-user receives
Emissions Trading Scheme (ETS) allowances for burning the biomethane. The end user is exempt from reporting the CO2 resulting from biomethane combustion.
Approach 2: Incentivisation at the supply / biomethane production side: - Support as feed-in-tariff (FiT) payments to the producer on the biomethane
injected into the grid - Direct investment support: providing capital grants for developing the plant or
provision of loans at reduced interest rates, - Cost sharing for grid connection, - Cost sharing for biomethane upgrading facilities
The features, requirements for implementation as well as pros and cons of these two approaches are discussed in detail in Section 4. In addition to the financial incentives listed above, further non-financial measures can be used to encourage the deployment of BtG plants and to ensure reduction of the risk associated with developing such projects. These include:
Priority access for biomethane plants to the public grid,
Standardisation and providing clear guidelines on planning permits, licensing procedures and requirements and on the local authority permitting process to avoid project delay,
Facilitating the process of obtaining grid-connection by ensuring that there is a clear institutional framework, with clearly defined roles, rights and responsibilities. This could be achieved by setting up a supervisory governmental agency, or expanding the role of existing bodies.
Non-financial barriers to the deployment of biomethane are being considered further in the main economic assessment study on biogas and biomethane.

Interface analysis and report for incorporation and alignment of data from Biomethane study into RHI workstream
32
2 Experience from Other Countries
Several countries have already developed financial mechanisms for supporting the
development of BtG projects. The applied mechanisms differ from one country to another and
come into action at different parts of the BtG supply chain. A summary of experiences from
other countries where the AD industry is relatively well developed or is expanding rapidly,
including descriptions of support mechanisms and sources of financing are given in Table 1
below.
Currently, the UK, the Netherlands and France have introduced feed-in-tariffs (FiTs) for
biomethane injection into the gas network making the production of biomethane economically
feasible. In the UK, the RHI was created to support renewable heat technologies, including
biomethane, which when injected into grid receives an RHI tariff. At the beginning of the
scheme, this was a flat rate of 9.5 c/kWh of biomethane (7.71 p/kWh19
), but in 2014 a tiering
scheme was introduced with quantities of biomethane injected over 40,000 kWh receiving a
lower payment of 5.6 c/kWh (4.2 p/kWh) and biomethane quantities over 80,000 GWh per year
receiving 4.3 c/kWh (3.49 c/kWh). These rates have subsequently been substantially
digressed and payments for installations accredited after 1st October 2016 are now 5.3 c/kWh
(4.32 p/kWh), 3.1 c/kWh (2.54 p/kWh) and 2.4 c/kWh (1.96 p/kWh).
In France, the biomethane FiT is dependent on the size of the biomethane plant (i.e. production
capacity) and on the category of feedstock used. The rate is currently 6.9 to 12.5 c/kWh for
anaerobic digestion plants. Support under the Netherlands SDE+ support scheme are 6
c/kWh, and with higher rates of 6.4 to 10.6 c/kWh for anaerobic digestion plants using manures
as a feedstock.
In Germany and Austria, support is provided at the end of the supply chain where payments
are provided to operators using biomethane for generating electricity in CHP plants. Sweden
and the Netherlands provide support to the use of biomethane in the transport sector. Most
countries provide additional benefits on top of the FiT on gas or electricity. These include
investment support and tax relief on fuel and electricity.
19
All payments have been converted using the average exchange rate for 2016 (to October 2016) of £0.811 per euro, based on monthly average exchange rate tables from Central Bank of Ireland available at https://www.centralbank.ie/polstats/stats/exrates/Pages/default.aspx

Interface analysis and report for incorporation and alignment of data from Biomethane study into RHI workstream
33
Table 1: Country review of BtG support mechanisms
Country Financing mechanism Source of Finance
United
Kingdom
Biomethane producer support. The approach of payment made to the producer rather than the end-user was decided early on in Energy Act 2008
20, before the creation of the RHI.
Support in the form of FiT on the biomethane injected into the grid is provided directly to the biomethane producer (through the UK Renewable Heat Incentive, RHI),
This is paid on top of the natural gas price and is guaranteed for 20 years,
The RHI also supports biogas consumption through payments on the amount of heat generated, with payments also grandfathered for 20 years,
Investment support is also provided by the Department for Environment, Food and Rural Affairs (Defra) to new AD plants (AD Loan Fund
The budget for the RHI comes from general taxation.
20
http://www.rhincentive.co.uk/library/regulation/08_Energy_Act.pdf

Interface analysis and report for incorporation and alignment of data from Biomethane study into RHI workstream
34
Country Financing mechanism Source of Finance
Germany
Support in the form of FiT is provided on electricity from CHP which
uses biomethane (guarantee of origin is required) and which utilises
100% of its heat.
A basic rate is offered for biogas and originally an additional top-up
rate (technology bonus) was provided if the biogas is upgraded to
biomethane (this bonus is now abolished),
Payments is if plant generates electricity and heat (so this FiT
support is for CHP plants),
Other support mechanisms:
Renewable heat quota which requires new buildings to supply
a certain amount of their heat demand from renewable heat
(including biogas) and biofuels quote requiring certain
percentage of transport fuels to be supplied by biofuels.
Tax exemption for biomethane,
Priority grid access and transport for biomethane,
Sharing of investment costs for grid connection,
Facilitated biomethane transport
Funded through a levy on electricity consumers and paid
to CHP operators on the electricity which comes from
biomethane A Guarantee of Origin, (GOO) is required. In
the case of BtG, the operator of the upgrading plant
which treats the biogas to produce biomethane enters
into a contract with the operator of a (high-efficiency)
CHP plant on the gas grid that annually consumes the
same amount of gas from the grid into which the
biomethane plant is feeding. The CHP operator
compensates the biomethane producer.
Costs for installing a gas grid connection for a biomethane upgrading facility are equally shared between the operator of the upgrading facility and the grid operator.
France
Biomethane producer support based on Guarantee of Origin system: biomethane producer sells to gas supplier at guaranteed tariff, gas supplier compensated for difference between cost of biomethane and cost of natural gas,
FiT for electricity generated from biomethane: varies by scale; bonus if high % of manure feedstock,
Biomethane: Base rate (varies by size) + bonus calculated according to feedstocks used,
Financed through levy on gas consumers

Interface analysis and report for incorporation and alignment of data from Biomethane study into RHI workstream
35
Country Financing mechanism Source of Finance
Netherlands
Biomethane producer support on difference between production cost
and energy price),
Tax reduction on investment in energy-conservation equipment used
in biomethane plants,
Feed-in-tariff for biomethane plants (with total budget capped).
Schemes bid in to funding rounds (i.e. funding on first come first
served basis with low cost projects served first),
Financed through levy on consumers energy bills
Sweden
End-user support but focussed on vehicle fuel applications (green
car premiums, support for filling stations,
All types of biomethane use (at the end-user) is exempt from carbon
dioxide tax as well as energy tax,
Investment programmes for farmers and municipalities with specific
incentives for biogas from manure (farm-specific),
Austria
Feed-in tariffs for electricity from biogas / biomethane,
Base rate for biogas with bonus for biomethane upgrading and for high efficiency CHP,
With annual budget caps. The combined cap for liquid and solid biomass and biogas is €10m per year, and is reduced by ~2% per year.
Analogous to Germany, FiTs are paid to the electricity
producer and funded via a levy on electricity
consumption.

Interface analysis and report for incorporation and alignment of data from Biomethane study into RHI workstream
36
3 Stakeholder Responses
A stakeholder consultation was conducted as part of the economic assessment of biogas and biomethane study. Two questions were asked on financing mechanisms related to biomethane injection into the grid:
What do you see as the pros and cons of supporting biomethane production via the end user of the biomethane versus support to the producer of the biomethane?
If payments were made to the end user of the biomethane, do systems already exist for biomethane users to show in an auditable way their use of biomethane?
Ten stakeholders responded to the two questions above. A summary of the responses is given in the table below. Table 2: Stakeholder responses to the consultation questions on financial support options
Question Response
What do you see as the pros and cons of supporting biomethane production via the end user of the biomethane versus support to the producer of the biomethane?
There was agreement amongst all stakeholders that support should be provided to the producer of the biogas / biomethane rather than the end-user. This was thought to be less complicated and would help the industry get established, as the major investment is made by the biomethane producer and not the end-user.
If payments were made to the end user of the biomethane, do systems already exist for biomethane users to show in an auditable way their use of biomethane?
Four stakeholder stated that they were not aware of any existing systems. One of respondents added that a Green Gas Certification scheme will still be required regardless of whether payments are made to the end user or not. It was highlighted that there is an existing methodology for tracking gas shipments by the gas network operator which can be applied for biomethane injection in a similar way. Several users highlighted that even if payments to the end user are not the support mechanism used, traceability of transactions is required by the market participants to ensure guarantee of origin and protect against double counting. Gas grids and gas tanker distribution services are an energy store as well as delivery service, so all transactions can be net balanced on a monthly and annual basis (per existing Entry-Exit market arrangements with licensed gas Suppliers). Several respondents stated that they were involved in setting-up a biomethane producer registration and “certification of origin” system so that the production and use of biomethane can be validated. This is the Green Gas Certification Scheme study which is being managed by the International Energy Research Centre (See Section 4). The scheme will support a Producer Registration and Certificate of Origin for both biomethane and other renewable gas. It will validate and verify the production and use of the biomethane from source to end-user, i.e. what goes in can only be taken out, so that there is no double counting. This certification scheme will be available to support National reporting obligations if and where required, and will provide independent validation for consumers of their purchased volumes of renewable gas and associated carbon savings/footprint.
Additional recommendations were also given:
The level of any future support for biomethane needs to be such, that in comparison to any future support for biogas electricity generation or CHP under REFIT, biomethane production is at least as economically viable as electricity and/or heat production.
Regulation should define that metering and monitoring should be at point of entry to gas network or at point of gas tanker filling stations,

Interface analysis and report for incorporation and alignment of data from Biomethane study into RHI workstream
37
Payments are preferably made to shippers rather than end-users as gas shippers/suppliers are much more likely to enter into long term stable relationships with producers than end customers, and direct payments to producers for gas placed on the market creates a certain level of security for the producer.

Interface analysis and report for incorporation and alignment of data from Biomethane study into RHI workstream
38
4 Options for supporting biomethane injection into the
grid
This section compares the two approaches of incentivising biomethane injection into the
grid:
Incentivisation by payments made to the end-user
Direct support to the biomethane producer
The pros and cons for the two approaches are also discussed.
4.1 Incentivising by feed-in-tariff payment made to end-user
Incentivising the end user requires the establishment of a green certification scheme for tracking the biomethane from the point of generation until it is consumed by the end user. The Green Gas Certification scheme (GGCS)
21 in the UK, for example, was initiated in
2011. The principle is that a certificate is issued for the generator who then transfers that to the shipper. The shipper then transfers the certificate to the end biomethane user (for example a CHP site). If there is no end-user requirement for the certificate, the shipper can redeem the certificate. Requirements for implementation In order for a GGCS to be implemented successfully, the biomethane injected into the grid needs to be tracked after it is mixed with natural gas in the grid. This can be achieved through mass and energy balances from the time the biomethane is injected until it is consumed by the end-user. This can help in providing evidence of the renewable feature of the gas and help track the parameters necessary to provide the relevant financial support (e.g. size of production plant, type of feedstock, energy efficiency, compliance with emission limits, etc.). Tracking the biomethane injected into the grid, also helps avoid the biomethane being sold to more than one user. Many countries have developed their own tracking systems in the form of biogas/biomethane registers. Potential biomethane producers, the gas industry and gas users are collaborating in a project run by the International Energy Research Centre to develop a Green Gas Certification Scheme for Ireland. The study will begin early in 2017, and should complete in early 2018, by which time it will have developed a blueprint for the scheme. How quickly the scheme could be made operational after this will depend on a number of factors – not least the level of support and engagement that is received from stakeholders and policy makers - and is unlikely to be clear until the study is well underway. Given that development of such a scheme has already been initiated, the requirement for a tracking/certification scheme should not therefore be an obstacle to incentivising the BtG market via end-user payment. It should be noted though that the scheme would need to become operational on the same timescale that any end-user support mechanism was introduced. Pros and Cons Incentivising the end-user will facilitate the creation of the full supply chain. Also as the end-user will be able to choose and have contracts with their chosen suppliers, which may lead to reduction in costs of supply in the longer term. However, the biomethane market is currently absent in Ireland and in order to successfully incentivise this industry, investment in developing the infrastructure (i.e. biomethane upgrade plants) may also need to be considered. Encouraging the development of the infrastructure can be achieved through capital grants and other methods such as sharing the cost of connection to the grid (Section 1.2). Nevertheless, a feed-in-tariff system where payment is made directly to the producer (section 4.2) may still be required to establish the infrastructure and provide certainty.
21
http://www.greengas.org.uk/

Interface analysis and report for incorporation and alignment of data from Biomethane study into RHI workstream
39
A system where payments are made to the end user means that support could be restricted to end users who are using biomethane for heat production, thus ensuring that all biomethane production is being utilised in the heat sector. However as discussed in Section 1, the RED currently stipulates that even if this is the case, in terms of its contribution towards renewable energy sub-targets, the biomethane injected must be allocated between the transport, heat and electricity targets in proportion to natural gas use in these sectors. Unless this accounting convention under the RED is changed, then the potential advantage of an end use support mechanism in ensuring that biomethane is preferentially used in the heat sector, and helps to meet the RES-H target would not be realisable. A drawback of a ‘payment to the end-user’ system is the need to develop a complex system of administration, evaluation and auditing. Auditing of sites claiming the benefits (e.g. sites receiving the green gas certificates) is required in order to ensure compliance with legislative requirements in terms of metering, maintenance, sustainability and quantities of renewable gas produced in a given period. Furthermore, as end users have little investment in the biomethane production process, they can, unless a long term supply contract has been negotiated, easily switch biomethane providers. This can be a drawback for biomethane producers, increasing uncertainty and risk for them.
4.2 Incentivising by payment made to producer
An alternative approach is to support biomethane production via payments to the
producer, based on quantities of biomethane they produce and inject into the grid22
. This
is the approach followed in several European countries such as the UK, France and the
Netherlands. In the UK this approach is also applied to biogas operators producing heat
for eligible (economic) uses, i.e. the subsidy payment under the RHI goes to the biogas
heat producer rather than the end user of the heat.
Biomethane and biogas operators may prefer this approach as direct receipt of support
payments by them, allows them to consider this as firm, ‘bankable’ income stream, which
may help facilitate raising finance for the plant. While biomethane production is well
established in other countries, and anaerobic digestion is a mature, commercial,
technology, there is limited experience of it yet in Ireland and little familiarity with the
technology by potential funders. An appropriate support mechanism targeted at the
biomethane plant operator, could help to reducing the risk in biomethane projects, and
make them more attractive to funders.
Requirements for implementation
Adopting this approach will require developing an accreditation process which ensures
payments are made to the ‘producer; of the biomethane. In the UK, the RHI Guidance
states that where more than one entity is involved in producing the biomethane from
biogas (or, ultimately, from biomass), the entity which carries out the final production
process necessary to bring the biogas within the definition of biomethane under the RHI
Regulations is to be regarded as the “producer” of that biomethane for RHI purposes. The
RHI regulations state that biomethane producers will need to provide details of the process
by which the applicant proposes to produce biomethane and arrange for its injection. This
is to determine that the party is the producer of the biomethane, and has arranged access
for its conveyance through pipes. The accredited biomethane production process under
the RHI is the biomethane upgrade process (i.e. drying process for water removal, H2S
removal, CO2 removal and any other impurity removal). A Network Entry Agreement (NEA)
is usually made between the Gas Network Operator and the biomethane producer and can
22
This approach could also be extended to supply of biomethane by road to end users who are not on the gas grid, if the point of payment is linked to a metering point.

Interface analysis and report for incorporation and alignment of data from Biomethane study into RHI workstream
40
thus be used as evidence for accrediting new installations in order to identify who should
receive the payments. Odorisation of biomethane on site of the producer is evidence that
the product was fully considered as ready for transport and injection into the grid before
leaving the ‘producer’ site.
Pros and Cons Direct support to the producer could help to get the industry established more quickly by directly rewarding the biomethane generator for investing in the technology, and the risk that this investment carries. As discussed in Section 1, at present the RED does not allow biomethane injected into the grid to be allocated to specific sectors, and based on current gas use, only about half of biomethane injected could be counted towards the heat sector. However if this stipulation were be changed by the Commission, then direct support to the producer would not provide a lever for Government to encourage use of biomethane in specific sectors if it so desired e.g. in order to ensure that the RED sectoral targets are met. In considering the significance of this in regards to the RED targets, it should be remembered that at present it is not at all clear that EC will change the rules on how biomethane should be accounted for, and that post 2020, the EU has not set specific sectoral renewable energy targets (or indeed national renewable energy targets. Furthermore, biomethane projects have a relatively long lead time (typically 2 to 3 years) which would mean that relatively few plant would be likely to be operational by 2020, again meaning that the impact of this aspect will be relatively limited. One further issue which would need to be considered if this type of support mechanisms was used is that biomethane which has been supported could be sold for use outside of Ireland. Double incentivisation could occur if, in the end users country a subsidy is available to the end user for the use of that biomethane. Procedures for accounting for this, and ensuring that no ‘double incentivisation’ occurs would therefore need to be developed if this approach is adopted. An additional issue which would need to be resolved is that the benefits from biomethane production, which would have supported by Ireland, could now accrue to another country. As production of biomethane grows within Europe, these are issues that are likely to be faced by a number of Member States, who will also need to produce solutions for these issues.
4.3 Comparison of the two approaches
Table 3 provides a summary of the pros and cos for the two approaches described above.
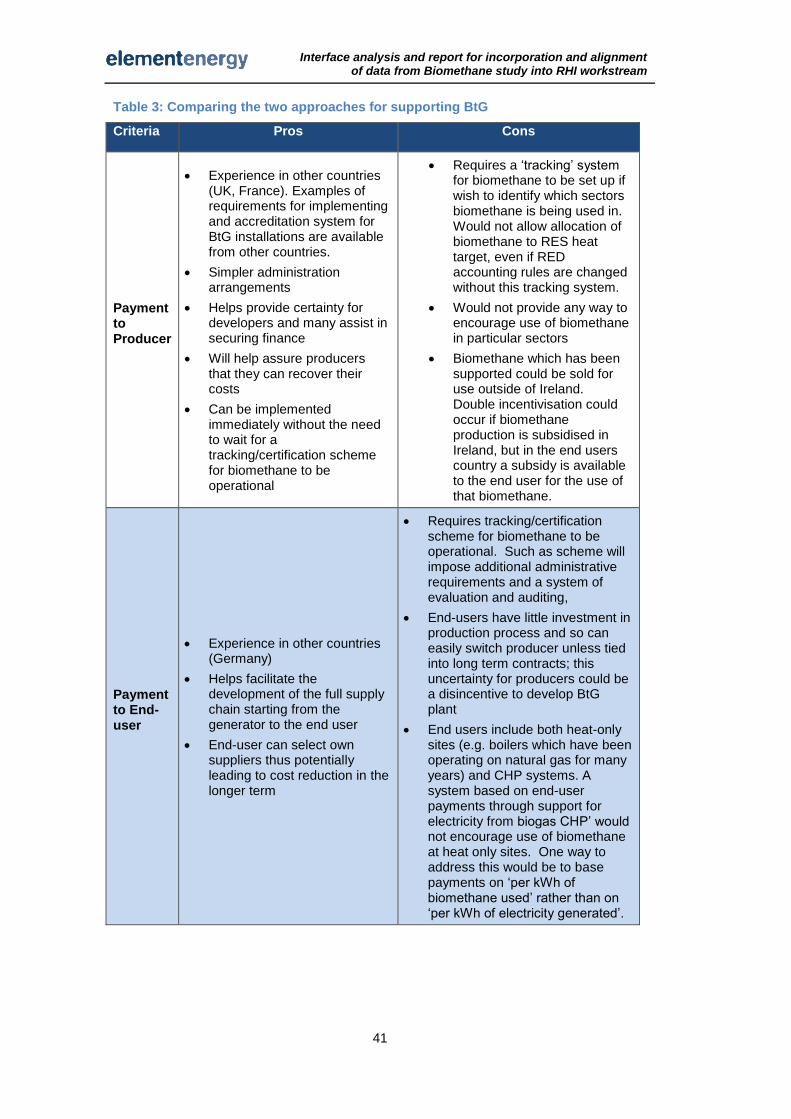
Interface analysis and report for incorporation and alignment of data from Biomethane study into RHI workstream
41
Table 3: Comparing the two approaches for supporting BtG
Criteria Pros Cons
Payment to Producer
Experience in other countries (UK, France). Examples of requirements for implementing and accreditation system for BtG installations are available from other countries.
Simpler administration arrangements
Helps provide certainty for developers and many assist in securing finance
Will help assure producers that they can recover their costs
Can be implemented immediately without the need to wait for a tracking/certification scheme for biomethane to be operational
Requires a ‘tracking’ system for biomethane to be set up if wish to identify which sectors biomethane is being used in. Would not allow allocation of biomethane to RES heat target, even if RED accounting rules are changed without this tracking system.
Would not provide any way to encourage use of biomethane in particular sectors
Biomethane which has been supported could be sold for use outside of Ireland. Double incentivisation could occur if biomethane production is subsidised in Ireland, but in the end users country a subsidy is available to the end user for the use of that biomethane.
Payment to End-user
Experience in other countries (Germany)
Helps facilitate the development of the full supply chain starting from the generator to the end user
End-user can select own suppliers thus potentially leading to cost reduction in the longer term
Requires tracking/certification scheme for biomethane to be operational. Such as scheme will impose additional administrative requirements and a system of evaluation and auditing,
End-users have little investment in production process and so can easily switch producer unless tied into long term contracts; this uncertainty for producers could be a disincentive to develop BtG plant
End users include both heat-only sites (e.g. boilers which have been operating on natural gas for many years) and CHP systems. A system based on end-user payments through support for electricity from biogas CHP’ would not encourage use of biomethane at heat only sites. One way to address this would be to base payments on ‘per kWh of biomethane used’ rather than on ‘per kWh of electricity generated’.

Interface analysis and report for incorporation and alignment of data from Biomethane study into RHI workstream
42
5 BioLPG
From 2017, Calor will be importing 6,000 tonnes of bio-LPG into Ireland from Rotterdam,
where it is produced as a co-product in Neste’s Hydrotreated Vegetable Oil (HVO)
production facility. Feedstocks for HVO production are vegetable and waste oils, meaning
that the bioLPG can be considered a renewable fuel23
. However as fossil based hydrogen
is used in the production plant, and as some of the hydrogen in the bioLPG is derived from
water, the fuel cannot be considered wholly renewable. The UK Department for Transport
have assessed this issue based on information provided by Calor and ruled that 93.2% of
bioLPG can be considered to be of biological and renewable origin24, and that this will be
used to determine the quantity of Renewable Transport Fuel Certificates (RTFCs) that
bioLPG could receive if used as a transport fuel.
A similar process does not currently exist within Ireland for determining whether a fuel is
renewable. However if support was provided for bioLPG in Ireland on the basis that it was
a renewable fuel, then it would be necessary to take a view on the renewable content of
the fuel, and how this should be determined.
Calor have indicated that for commercial customers, the price for bioLPG will be about
20% above conventional LPG prices. However the Department for Finance has indicated
that if bioLPG is recognised as a sustainable renewable fuel, it will qualify for carbon tax
exemption, which would reduce the premium. (Table 4). Calor report that the additional
premium on bioLPG is to cover the cost of transportation from Rotterdam, and also the
mass balance system they will be putting in place to allow tracking of the bioLPG. As such
it will be a flat rate across all consumers.
Table 4 Current price for conventional LPG and indicative prices for BioLPG
Conventional LPG
25
Bio LPG
BioLPG if exemption from carbon tax given
€/kWh €/kWh €/kWh
Commercial cylinders 0.125 0.1378 0.133
Bulk LPG (0 to 3 tonnes) 0.078 0.0908 0.086
Bulk LPG (3.1 to 40 tonnes) 0.065 0.0784 0.074
For existing LPG users, no capital expenditure is required to use bioLPG. However, the
cost of producing bioLPG is higher than that of producing conventional LPG due to the
additional treatment processes and fuel upgrade processes involved. The additional cost
of BioLPG is typically 11 - 13% for most commercial users. While this higher price is likely
to be a disincentive for many users, some will be willing to pay the higher price, as use of
23
The EU define biofuels as ‘biofuels’ means liquid or gaseous fuel for transport produced from biomass (Directive 2003/30/EC on the promotion of the use of biofuels or other renewable fuels for transport). Under this broad definition bioLPG is a biofuel, and hence can be considered a renewable fuel. While bioLPG is not on the list of fuels that are definitely classed as biofuels in the Renewable Energy Directive, that list included only the most common types of biofuels that were produced or envisaged at the time the Directive was passed, and is not intended to be exclusive. The fact that bioLPG is not on the list does not therefore mean that it would not be considered a biofuel. 24
Copy of letter from UK DfT to Calor of 23 June 2015, provided to Ricardo Energy & Environment by Calor. 25
SEAI Commercial/Industrial Fuels, Comparison of Energy Costs 1 July 2016

Interface analysis and report for incorporation and alignment of data from Biomethane study into RHI workstream
43
bioLPG would reduce their corporate CO2 emissions, and contribute towards achieving
corporate CO2.emissions reductions targets.
BioLPG could also offer a way to help bring renewable heat to off gas grid users currently
using oil based systems. This would require capital expenditure for LPG storage and a
new boiler, or where appropriate a CHP system. Therefore it may be possible to consider
including new boilers and CHP systems using bioLPG as an eligible technology under the
proposed RHI.
In assessing whether this is desirable, consideration should be given to security of supply
and to the fact that there is currently only one commercial supplier of bioLPG to Ireland
(Calor). Finally as bioLPG is likely to be blended with LPG, there will be a need to ensure
in any support mechanism put in place that adequate tracing and monitoring mechanisms
are in place (at both the supply and user end) to ensure that support is only given to
bioLPG which is consumed.

Interface analysis and report for incorporation and alignment of data from Biomethane study into RHI workstream
44
Appendix B
Report on Feasibility of Supporting Biomethane through a Gas
Levy
by Ricardo Energy & Environment

Interface analysis and report for incorporation and alignment of data from Biomethane study into RHI workstream
45
1 Introduction
This short report summarises current arrangements for the levy on electricity consumers
and whether a similar mechanism could be used to facilitate a levy on gas consumers to
support biomethane production for injection to the gas grid. Information for the report has
been drawn from a review of relevant policy documents and discussion with relevant staff
in the Department of Communications, Climate Action and Environment (DCCAE) and
Commission for Energy Regulation (CER).

Interface analysis and report for incorporation and alignment of data from Biomethane study into RHI workstream
46
2 Public Service Obligation (PSO) for electricity
2.1 What is the PSO?
The Public Service Obligation (PSO) is a levy mechanism through which funding is raised
for policy measures targeted at electricity generation in Ireland. The measures supported
include the deployment of renewable electricity generation (under the Renewable Energy
Feed-In Tariff (REFIT) programme), peat generation and conventional fossil fuel
generation related to security of supply.
The levy has been in place since 2001 and is paid by all electricity consumers in Ireland.
The funds raised are then used to compensate electricity suppliers that purchase
electricity from relevant generators (e.g. renewable generators under REFIT) at an
additional cost26
. The proposed levy amount for 2016/17 is €392m27
, of which €302m is to
support renewables. The proposed levy amount for 2016/17 is 21% higher than the
2015/16 PSO. The increasing cost of the PSO ley is of growing concern to government,
with the impact on energy bills and the competitiveness of energy intensive industries
often cited.
Originally the PSO was put in place to target security of supply concerns, with the
revenues generated being used to support peat and some gas generation. Over time the
purpose of the PSO has expanded to include renewables, initially through the Alternative
Energy Requirement programme introduced in the early 2000s28
, and since 2009 through
the REFIT programme. Through its provision of funding for the uptake of renewable
generation, the PSO is seen as the primary funding mechanism through which Ireland
aims to meets its renewable targets: to generate 40% of its electricity from renewable
sources by 2020 and source 16% of all energy consumption from renewables by 2020.
2.2 How is revenue raised and managed?
The total levy amount to be recovered from consumers for a given year is calculated ex-
ante by the Commission for Energy Regulation (CER). To do so, CER estimates the total
amount which will be needed to support ‘PSO parties’ (i.e. those receiving support through
the measures that the PSO funds including renewable generators supported by REFIT).
In addition, an “R-factor” is added to correct for previous years where ex-ante estimates of
required funding were different to the actual outturn funding provided. As such, calculating
the ‘R-factor’ reflects actual audited relevant PSO plant costs, outturn System Marginal
Price (SMP), outturn capacity payments received and outturn generation levels for the
PSO plants. The ‘R-factor’ can be a positive or negative number depending on the
circumstances.
The PSO levy is applied to all electricity consumers in Ireland. The actual rates applied to
the different customer groups are determined by CER depending on the total forecast levy
pot required. Different rate levels and structures apply depending on the type of consumer:
- domestic and small commercial customers pay a flat rate (or set fee) per
household / business per annum.
- medium and large profile customers pay a fixed charge per kVA of maximum
import capacity (and hence the charge scales in proportion to the likely size of
user).
26
http://www.dccae.gov.ie/energy/en-ie/Electricity/Pages/Pubic-Service-Obligation.aspx 27
http://www.cer.ie/docs/001074/CER16252%20PSO%20Levy%202016-17%20-%20Revised%20Decision%20Paper.pdf 28
http://ec.europa.eu/competition/state_aid/cases/135860/135860_435924_16_2.pdf
Interface analysis and report for incorporation and alignment of data from Biomethane study into RHI workstream
47
The balance is split roughly equally between the two groups: in 2016/17, domestic and
small business users are proposed to fund €186m of the total €392m (47%), with medium
and large industry customers picking up the remaining €206m (53%).
The steps in collection, payment and distribution of the levy are:
1. Electricity suppliers collect the levy from individual customers through their energy
bills;
2. The ESB Networks collect the allowed PSO levy from electricity suppliers;
3. The ESB Networks then pass the collected funds to EirGrid;
4. EirGrid then re-distribute the funds to the suppliers depending on the levels of
support they have provided to PSO parties over the period (e.g. purchases of
renewable electricity from REFIT generators) ;
5. This is then re-distributed to the relevant generators/suppliers supported by the
PSO in line the Power Purchase Agreements (PPAs).
Under REFIT, payments to subsidise renewable generation are based on a comparison of
total market revenue (consisting of energy price, capacity payment and constraint
payment) to a set reference price. If the total market revenue is lower than the reference
price, generators are paid the difference through the revenue collected by the PSO. For
example, if energy prices fall the PSO will make up a larger proportion of energy bills and
will be required to cover any shortfall against the reference price. The reference price is
adjusted annually in line with the Consumer Price Index, with different prices for different
generation technologies29
.
2.3 The institutional framework
There are a number of different parties involved in the PSO levy and the subsidy schemes
that it supports.
With respect to the revenue-raising element (i.e. the PSO levy), energy suppliers, ESB
networks and EirGrid play important roles in the collection and distribution of funds.
At a policy level, the PSO levy and the associated subsidy schemes it supports are
designed and mandated by the Irish Government (DCCAE) through relevant legislation,
taking into account national policy objectives for the different areas.
The calculation of the total levy amount required and the individual rates for different
groups of consumers is carried out by the CER. The levy is reviewed and updated on an
annual basis, with the levy year running from October to the following September. CER
calculate the PSO levy in accordance with Government policy and assist in ensuring the
scheme is administered appropriately and efficiently. This includes calculating the actual
costs incurred under the relevant PSO contracts/schemes to be remunerated.
With respect to REFIT (i.e. the ‘spending’ element of the policy), the DCCAE has
responsibility for the design of the scheme, and also plays a role in its day-to-day running.
DCCAE assesses applications from generators using qualifying technologies against the
relevant terms and conditions for the subsidy scheme. If approved these are then included
in a statutory instrument for CER to include in the PSO estimates. A letter of offer is issued
to the potential generator, which while not contractual, provides the mechanism for which a
Power Purchase Agreement (for 15 years) can be entered into with suppliers. This letter
29
http://www.dccae.gov.ie/energy/SiteCollectionDocuments/Renewable-Energy/2016%20Reference%20Prices%20for%20REFIT.pdf

Interface analysis and report for incorporation and alignment of data from Biomethane study into RHI workstream
48
guarantees the floor or ‘reference’ price payment underwritten by the REFIT. This then
enables the potential generator to put in place their finance and construct the plant.
2.4 Legislative Framework
The PSO is underpinned by a raft of legislation, summarised as follows:
Section 39 of the Electricity Act, 1999 – CER is responsible for the imposition of
the PSO levy on ESB, licence holders and holders of permits under the Electricity
(Supply) Act, 1927.
Statutory Instrument (S.I.) No. 217 of 2007 made under Section 39 of the
Electricity Act, 1999 provides for the calculation of the PSO levy by CER to
provide for the recovery of costs by all relevant parties
Each year a new statutory instrument is made amending the initial S.I. No 217 of
2007 through which CER sets the amount to be recovered each year.
The over-arching legal basis for the PSO levy and its method of calculation are set out in
regulations made under the Electricity Regulation Act 1999. This contains a specific
section (Section 39) wholly dedicated to Public Service Obligations. This provides the
relevant Minister with the power to direct CER to impose a PSO in relation to several
objectives.
The European Commission (EC) defines state aid as: ‘an advantage in any form
whatsoever conferred on a selective basis to undertakings by national public authorities’30
.
Support schemes which are classified as State Aid require clearance from the
Commission. The support offered though the PSO constitutes ‘state aid’ and required
approval by the EC. The original Notification of November 2000 to the EC set out the
broad areas that were to be supported by the PSO as listed in Section 39 of the 1999 Act:
security of supply;
regularity, quality and price of supplies,
use of indigenous fuel sources; and,
environmental protection.
Subsequent to this original Notification, new schemes that the Government wished to
support via the PSO have been notified to the European Commission to request state aid
clearance. S.I. No. 217 has also been amended by subsequent S.I.s to provide for the
recovery of costs under the PSO for such schemes.
Additional schemes which have been notified to the European Commission and received
state aid clearance to provide support include:
a competition in 2005, referred to as “Capacity 2005”, held by the CER due to
security of supply concerns. This enabled the recovery of costs associated with
peat plants and plants that entered the market in 2005
the three phases of the REFIT scheme which supported renewable electricity
generation
30
http://ec.europa.eu/competition/state_aid/overview/index_en.html

Interface analysis and report for incorporation and alignment of data from Biomethane study into RHI workstream
49
3 Feasibility of a PSO on gas customers
3.1 Legislative feasibility
As discussed above, the PSO on electricity consumers is underpinned by a specific
section in primary legislation (Section 39 of the Electricity Act 1999) and a raft of
supporting secondary legislation. It is conceivable that a similar legislative underpinning
would be required to place a levy on gas consumers that could be used to support
biomethane production.
A review by Ricardo Energy & Environment of the primary legislation underpinning the gas
market found that appropriate primary legislation may already be in place. The Gas
(Interim) (Regulation) Act, 2002 contains a section dedicated to PSO – Section 21. This
section mirrors Section 39 of the Electricity Act, which underpins the PSO on electricity
consumers. Section 21(1) of the Act reads as follows:
The Minister may, following consultation with the Commission and such interested parties
as determined by the Minister, by order direct the Commission to impose on such classes
of natural gas undertakings as may be specified in the order in the general economic
interest, public service obligations which may include security, including security of supply
and technical or public safety, regularity, quality and price of supplies, and to
environmental protection.
While it is the view of the study team that the Act is likely to provide a basis for any levy,
they do not have the necessary legal expertise to provide a conclusive legal view. It is
therefore recommended that if this route is to be pursued further legal advice is sought to
provide a definitive assessment on whether the Act provides the required underpinning in
primary legislation for a gas levy.
The legislative feasibility of such a levy was also discussed with officials at both DCCAE
and CER in October 2016. In both cases, officials articulated in these initial discussions
the view that both new primary and secondary legislation would need to be put in place to
underpin the scheme. Further, the introduction of new legislation (in particular primary
legislation) if required would take time to put in place. In addition, even if this was not the
case (and the necessary primary legislation was already in place), secondary legislation
will be required to define the detail of any proposed gas levy.
Discussions with stakeholders also indicated that State Aid clearance would be needed,
which based on REFIT experience could take 6-12 months to acquire. However, given
state aid clearance would be associated with the ‘spend’ element of any measure, this
would be required regardless of how revenue is raised.
3.2 Operational feasibility
As discussed in Section 2, the existing PSO on electricity consumers is underpinned by a
defined European and national legal framework, national policy framework and regulatory
framework, with a number of entities involved and playing important roles.
It is considered unlikely that there would be any issues replicating the institutional and
operational arrangements that underpin the PSO to develop a gas levy.
Similar entities exist overseeing the gas market as in the electricity market:
energy suppliers supply gas to metered customers as they do for electricity;

Interface analysis and report for incorporation and alignment of data from Biomethane study into RHI workstream
50
CER regulates the gas market as it does the electricity market;
DCCAE oversees policy across all energy markets; and
GNI operates the transmission and distribution gas system, as EirGrid and ESB do
for the electricity market.
As such directly transposing the institutional structure and roles for the electricity PSO onto
the gas market appears to be a feasible delivery model for a gas levy.

Interface analysis and report for incorporation and alignment of data from Biomethane study into RHI workstream
51
4 International examples
Funding mechanisms in three other European countries which directly support production
of biomethane are summarised below. Of these, one in the UK is funded by general
taxation and two, in the Netherlands and France are funded by surcharges on consumers’
energy bills.
In the UK, biomethane producers receive a payment per kWh of biomethane injected to
the grid under the Renewable Heat Incentive (RHI). The RHI which supports a number of
other renewable heat technologies as well as biomethane, is funded by the Exchequer
through general taxation funding. Early consultations on the design of the RHI indicated
that the Government was considering what would be the most effective way to fund the
RHI, including reviewing the Levy provisions in the Energy Act 2008, to set a levy on fuels
used for heating31
. The final detailed proposals for the scheme in 201132
however stated
that the previous Government’s plans for an RHI levy to fund the scheme were considered
overly complex, and that it would be funded from general Government spending. This
decision was also seen as alleviating the fears of a number of organisations and industries
about the potential impacts on energy bills and the consequences for fuel poverty and
energy intensive industries.
In France, biomethane producers can enter a 15 year contract with any gas supplier. The
gas supplier receives a payment from a compensation fund to cover the difference
between the cost of biomethane and the market price of natural gas. The relevant cost of
biomethane is determined by the Ministry of Ecology. The consumer’s contribution to the
fund is calculated by the energy regulator33
. The ‘Contribution Biométhane’ otherwise
known as ‘la contribution au service public du gaz (CSPG)’ is a flat rate levy; rates for
2014 to 2016 are shown in Table 4.1.
Table 4.1 Gas Levy to Support Biomethane Injection (Contribution Biométhane) in France
2014 2015 2016
No of biomethane plant supported 6 20 39
Money required for support (€M) 2.7 7.6 23.3
Levy to support biomethane (c/kWh) 0.72 1.53 4.92
Source: Commission de Regulation de L’Energie, 201534
. From 1 January 2016 rather than being levied separately, the Contribution Biométhane
was included in the existing Taxe Interieure sur la Consommation de Gaz (TICGN), or
Internal Tax on Natural Gas Consumption together with the Contribution to the Special
Solidarity Gas Tariff (CTSSG)35
. The TIGN has existed since 2014 and its original
31
DECC, 2010. Renewable Heat Incentive. Consultation on the proposed RHI financial support scheme. 32
DECC, 2011. Renewable Heat Incentive 33
Reizine S, 2015. Biomethane injection in France 34
Commission de Regulation de L’Energie, 2015 Délibération de la Commission de régulation de l’énergie du 15 octobre 2015 portant proposition relative aux charges de service public liées à l’achat de biométhane et à la contribution unitaire pour 2016. Available at http://www.cre.fr/documents/deliberations/proposition/(annee)/2015 35
The Contribution to the Special Solidarity Tariff (Contribution au tarif spécial de solidarité) or CTSS) is chargeable to natural gas suppliers in proportion to the amount of natural gas that they supply to final consumers. It is used to finance the Special Solidarity Tariff (tarif spécial de solidarité – TSS) that consists of a flat-rate rebate on the price of gas. It has been set at €0.2/MWh since 2014.
Interface analysis and report for incorporation and alignment of data from Biomethane study into RHI workstream
52
component (a tax on gas consumption) was levied on behalf of Customs and then
integrated as revenue into the state budget. Gas consumed for large scale electricity
generation and in in some energy intensive production processes and as a raw material
were exempt from the TICGN in 201536
.
In the Netherlands biomethane production is supported under the Sustainable Energy
Production Plus (SDE+) scheme. This supports a range of renewable energy technologies
producing electricity and, or heat as well as biomethane injection, by means of a feed-in
premium. Producers receive a subsidy payment that is the difference between the
standardised cost price for energy from the renewable technology and the price that they
can receive on the market for the energy produced. Since 2013 the scheme has been
funded by a surcharge on consumers and businesses energy bills37
. The surcharge is
levied on a per unit of consumption basis across both electricity and gas bills38
, with a
declining surcharge the more is consumed. There are four bands for consumption. In
2014, the levy was 2.3€/MWh for electricity consumption up to 10 MWh (which would
include most if not all households), 2.7€/MWh for consumption of 10 to 50 MWh, and much
lower rates of €0.7./MWh and €0.03/MWh for very large energy users (above 10,000 MWh
per year. The levy on gas similarly falls substantially with size of consumer – from
€0.00046/m3 for domestic and small scale consumer to 0.0004€/m3 for very large
consumers39
.
36
Energy Climate Overview, 2015 edition. No.34 Energy taxation. Available at http://www.developpement-durable.gouv.fr/IMG/pdf/34_-_La_fiscalit_de_l_nergie-ok_GB.pdf 37
Algemene Rekenamer, 2015. Promoting sustainable energy production in the Netherlands: Feasibility and affordability of policy goals 38
http://www.auresproject.eu/files/media/countryreports/pdf_netherlands.pdf 39
PWC, 2015. A European Comparison of electricity and gas prices for large industrial consumers.

Interface analysis and report for incorporation and alignment of data from Biomethane study into RHI workstream
53
5 Advantages and disadvantages of a gas levy
This section explores the possible advantages and disadvantages of a levy on gas
consumers to fund support for biomethane production. Implicit in this assessment is a
comparison to one or more alternative options. The main alternative funding option would
be through general taxation40
and this is used as a comparator in Section 5.1 and 5.2.
Other alternative options are subsequently considered in Section 5.3 below.
5.1 Advantages
The key advantage of introducing a levy on gas bills to support biomethane injection is that
this would be the option most consistent with the ‘polluter-pays’ principle – those who
cause pollution should bear the costs of managing it to prevent damage to the
environment or human health. In this case, the issue at hand is that natural gas from the
grid is a non-renewable fossil fuel and releases emissions of greenhouse gases (GHG)
when burnt. This impact is currently not captured in the gas price, i.e. it is a ‘negative
externality’. Consumers of natural gas can thus be seen as the polluter. If biomethane, a
renewable fuel which releases no GHG emissions when it is burnt, is injected into the grid,
connected consumers (the polluters) are those who would ‘benefit’, as the greenhouse gas
emissions associated with their consumption are reduced. If biomethane were to be
supported by a levy on gas bills, then only gas consumers connected to the grid who are
metered would face the levy. As such, a gas levy would more efficiently allocate costs to
the polluters (i.e. those creating the negative externality in the first place).
Funding through general taxation on the other hand would raise revenue from a much
wider base and many of those contributing would not stand to ‘benefit’ from the
biomethane injected. For example, those not connected to the gas grid would in part
subsidise biomethane injection but are arguably not contributing to the specific externality
to begin with (i.e. that natural gas supplied through the grid is non-renewable and its
consumption emits GHG’s). That said, although this would be a less ‘economically
efficient’ solution, tax revenue is spent to meet national aims, objectives and obligations
and the avoidance of penalties is of benefit to all taxpayers. It should also be remembered
that similar arguments can be made for the wider RHI, which it is proposed will be
supported through general taxation.
Furthermore, if a gas levy is charged per unit of gas consumption, this achieves the most
efficient economic solution: those who use more gas contribute proportionally more to the
negative externality created, and would also pay more towards addressing the damage as
a result. It would not be possible to achieve as efficient a solution through general taxation
as it would be more difficult to achieve these scaling effects.
This principle applies across all potential uses of biomethane injected into the grid,
whether for heat, electricity generation, or transport. However, to maintain this link the gas
levy should only be used to support biomethane injection and not wider biomethane
production more generally. If revenues raised through the gas levy are used for production
not injected into the grid (e.g. where it is provided for transport through other means of
distribution), this would provide a ‘benefit’ to some who do not pay the levy, in this case
consumers of non-renewable transport fuel.
40
The Department of Finance does not allow hypothecation of funds, as such if taxation was used to fund subsidies for biomethane injection, this would be limited to general taxation and could not be linked to / funded through specific taxes.

Interface analysis and report for incorporation and alignment of data from Biomethane study into RHI workstream
54
Adopting a gas levy approach separates the raising of funds and provision of support to
biomethane injection from annual budget setting processes. This is beneficial for potential
investors as it could provide a greater level of confidence that a consistent level of support
will be available on an on-going basis, hence reducing perceived policy risk.
More widely, this will also provide an additional, secondary incentive for the uptake of
renewable heat in place of consuming gas from the grid. The primary incentive will be
introduced by the subsidy paid to renewable heat technologies under the proposed wider
RHI. In addition, the levy will provide a disincentive to consuming gas where this raises the
unit price, promoting more efficient use and/or switching to renewable sources.
5.2 Disadvantages
A levy on gas bills could be more regressive than raising revenue through general
taxation. Fuel poor households typically live in less efficient homes and hence need to
consume more energy to achieve an adequate standard of warmth. As such, where the
levy is defined per unit of consumption for the domestic sector, this could place a greater
burden on more vulnerable households.
The UK Government considered funding the RHI (for all technologies) through a levy on
suppliers of fossil fuels for heat41
.The Coalition Government decided the RHI would be
funded from general taxation, in part due to the complexity of such an arrangement but
also to alleviate the fears of a number of organisations and industries about the potential
impacts on energy bills and the consequences for fuel poverty and energy intensive
industries. That said, there are examples where a levy has been placed on energy bills to
fund policies: this is the case for the UK’s Renewable Obligation and Feed-in Tariff (FIT)
schemes. Even though the FIT is levied on energy bills, a recent review found only limited
evidence that the scheme had exacerbated fuel poverty as a result, in part due to the way
a complex range of factors interact to define fuel poverty42
. The original Impact
Assessment for the FIT discussed fuel poverty concerns associated with a levy on bills but
suggested the impact in part would depend on the extent to which the same households
would benefit from the take-up of small scale generation43
. In addition, it notes that the
impact will also depend on the ability of households to take up other measures which could
mitigate the effect: e.g. energy efficiency measures. This raises an interesting proposition
that in fact it may be a more efficient solution to introduce the gas levy to target GHG
reduction and manage any potential negative effects through other, dedicated fuel poverty
policies. The potential to do this will depend on the existence and flexibility of such
policies.
Of course the size of such potential effects will depend on the amount of costs to be levied
on domestic households and the approach to doing so. If a gas levy was used to support
biomethane in Ireland then there may be opportunity to manage any risk (at least in part)
through the design of the levy framework, for example, by placing a fixed levy per
household as per the electricity PSO rather than on a per unit of consumption basis.
41
https://www.gov.uk/government/uploads/system/uploads/attachment_data/file/48041/1387-renewable-heat-incentive.pdf 42
https://www.gov.uk/government/uploads/system/uploads/attachment_data/file/456181/FIT_Evidence_Review.pdf 43
http://webarchive.nationalarchives.gov.uk/20121217150421/http:/decc.gov.uk/assets/decc/consultations/renewable%20electricity%20financial%20incentives/2710-final-ia-feed-in-tariffs-small-scale.pdf

Interface analysis and report for incorporation and alignment of data from Biomethane study into RHI workstream
55
Further, the proportion of the charge levied on domestic consumers could be reduced and
targeted more on other sectors. It is also worth noting that both the Dutch and French
Government’s currently place a levy on consumers to subsidise renewable energy
generally (Netherland) and biomethane injection, suggesting that these concerns were
overcome in these countries.
Alongside the risks for domestic consumers, there could also be a risk of a double penalty
associated with the gas levy for electricity generation. Just under half of gas consumed in
Ireland is used for electricity generation. GHG emissions from the electricity sector are
already targeted through the EU Emissions Trading Scheme (EU ETS), which places a
cost on electricity generators which are passed on to consumers.
The first risk of double penalty is that with the introduction of a gas levy, consumers (e.g.
households) would pay an additional cost associated with their direct consumption of gas
for heat, and could also face an additional cost associated with the gas levy through
electricity consumption. As noted, a significant proportion of electricity generation is from
gas-fired sources and generators could pass on the cost of the gas levy directly to
consumers. Whilst this is true, the externalities associated with both are separate effects:
i.e. GHG’s associated with the consumption of gas for domestic heating, and GHG’s
associated with the consumption of gas for electricity generation. As such even though
households and businesses which consume both electricity and gas for heating could face
a double penalty, this simply reflects that there are two separate externalities associated
with gas consumption for all energy supplied to these entities. As such it is considered
justified in this respect.
A second risk of a double penalty is associated purely with electricity generation: the
introduction of a gas levy will also place an additional cost on electricity generation,
alongside the cost of the EU ETS, both of which will likely be passed through to electricity
consumers. Both policies are feasibly targeting the same externality (i.e. GHG’s
associated with gas consumption for electricity generation) and could be considered to
overlap.
However, in theory, if the gas levy supports biomethane injection, this in turn should
reduce the GHG intensity of the gas in the grid. This should then reduce the level of
allowances which need to be purchased when using gas for electricity generation. As such
it is conceivable that there would be some levelling effect between the two policies,
reducing the potential for double-charging. Although in practice the ability for this levelling
effect to appear will depend on the mechanics of the EU ETS policy itself, and in particular
on how emissions factors are determined which feed into the levels of allowances required
for electricity generation using gas, and whether these would respond to the introduction of
biomethane.
Any analysis of possible double effects would also need to take into account the
distribution of free allowances under the EU ETS: to the extent electricity generators
receive such allowances, this too could mitigate the double-charging effect.
Further, there are other examples where additional incentives have been introduced
alongside the EU ETS, hence in theory targeting the same externality. For example, the
UK’s carbon price floor sets a minimum price for carbon. This introduces an additional
incentive on top of the price of EU ETS credits, which presents an additional cost to
electricity generators. In this case, the price signal from the EU ETS is considered
insufficient to offer incentive to shift away from conventional, fossil fuel generation to
renewables. A similar logic could perhaps be applied to the production of biomethane.

Interface analysis and report for incorporation and alignment of data from Biomethane study into RHI workstream
56
Alternatively, this issue could be avoided altogether through the design of the levy. Large
scale electricity generators could be exempt from the charge as is done e.g. in France,
where gas consumed for large scale electricity generation is exempt from the collection of
revenue to support biomethane.
5.3 Other alternatives
Two alternative funding sources to a levy on gas bills and general taxation were discussed
with stakeholders.
Under the PC3 revenue review, CER granted GNI (the gas transmission and distribution
network operator), on the basis of submissions from them, an “Innovation fund” of €8
million44
. . GNI has already used some of this Innovation Fund to explore the potential for
injecting biomethane into the grid. Money for the innovation fund is supplied, along with
other permitted expenditure by GNI, through revenue from customers, i.e. funding for the
biomethane projects is supported by all customers through the transmission and
distribution operators’ Use of System charges and is hence spread across all gas
consumers. There are restrictions to pursuing this as an approach to fund biomethane
deployment more widely. First this mechanism is intended for innovation – at the point
such projects increase in scale or are commercialised, these are no longer eligible for
funding through this route. Second, it is possible that such a funding route would limit the
range of potential biomethane suppliers which could access the market, given only GNI
can reclaim costs in this manner.
A further alternative would be to include a levy under the existing PSO on electricity
consumers. The existing PSO is predominantly a mechanism to support uptake of
renewable energy in the electricity sector, and using it to also support biomethane injection
would be an expansion of its role towards more general support of renewable energy.
Furthermore, legal advice would need to be sought to definitively determine if the
opportunities eligible for support under the existing PSO could include biomethane
injection. Given much of electricity in Ireland is generated from gas, raising support for
biomethane using the PSO on electricity consumers would in part reflect the polluter pays
principle, but less effectively than a direct levy on gas, as consumers using gas for heat
who are also ‘contributing to the problem’ would not contribute directly or in a proportionate
way.
44
CER, 2012. Decision on October 2012 to September 2017 transmission revenue for Bord Gáis Networks.