interference from two synchronized wave sources - project physnet
TRANSCRIPT

Project PHYSNET Physics Bldg. Michigan State University East Lansing, MI· · ·
MISN-0-230
INTERFERENCE FROM
TWO SYNCHRONIZED WAVE SOURCES
angular view
cross-section
opaque
sheet
opaque
sheet
screen
screen
light waves
light waves
d
Lslits
x
1
INTERFERENCE FROM TWO SYNCHRONIZED WAVE SOURCES
by
Peter Signell and William C. Lane, Michigan State University
1. Introductiona. Overview . . . . . . . . . . . . . . . . . . . . . . . . . . . . . . . . . . . . . . . . . . . . . . . . 1b. Synchronized Wave Sources . . . . . . . . . . . . . . . . . . . . . . . . . . . . . 1c. Source-to-Point Distances are the Key . . . . . . . . . . . . . . . . . . . 1d. Constructive interference . . . . . . . . . . . . . . . . . . . . . . . . . . . . . . . . 2e. Destructive Interference . . . . . . . . . . . . . . . . . . . . . . . . . . . . . . . . . 2f. Goals of This Module . . . . . . . . . . . . . . . . . . . . . . . . . . . . . . . . . . . . 3
2. Mathematical Descriptiona. The Phase Difference: Description . . . . . . . . . . . . . . . . . . . . . . . 4b. The Phase Difference: Calculation . . . . . . . . . . . . . . . . . . . . . . . 4c. Derivation of the Phase Difference . . . . . . . . . . . . . . . . . . . . . . . 4d. The Resultant Wave . . . . . . . . . . . . . . . . . . . . . . . . . . . . . . . . . . . . .5
3. Solving Problemsa. Finding Maximum and Minimum Points . . . . . . . . . . . . . . . . . 5b. Finding the Resulting Wave at a Point . . . . . . . . . . . . . . . . . . 6c. Intensity . . . . . . . . . . . . . . . . . . . . . . . . . . . . . . . . . . . . . . . . . . . . . . . . 6d. An Example . . . . . . . . . . . . . . . . . . . . . . . . . . . . . . . . . . . . . . . . . . . . .6
4. Young’s Experimenta. Historical Overview . . . . . . . . . . . . . . . . . . . . . . . . . . . . . . . . . . . . . 7b. Coherent Sources Were the Key . . . . . . . . . . . . . . . . . . . . . . . . . 7c. Angular Measure for the Path Difference . . . . . . . . . . . . . . . . .8d. Positions of Maxima and Minima . . . . . . . . . . . . . . . . . . . . . . . . 9
Acknowledgments . . . . . . . . . . . . . . . . . . . . . . . . . . . . . . . . . . . . . . . . . . 10
Glossary . . . . . . . . . . . . . . . . . . . . . . . . . . . . . . . . . . . . . . . . . . . . . . . . . . . . . 10
A. Time Averaging of Intensities . . . . . . . . . . . . . . . . . . . . . . . . . 12
2

ID Sheet: MISN-0-230
Title: Interference from Two Synchronized Wave Sources
Author: Peter Signell and William C. Lane, Dept. of Physics/Astronomy,Mich. State Univ.
Version: 3/22/2000 Evaluation: Stage 0
Length: 1 hr; 28 pages
Input Skills:
1. Vocabulary: wave disturbance, amplitude, frequency, wavelength,wave number (MISN-0-201) or (MISN-0-430); intensity (MISN-0-203) or (MISN-0-430); light wave (MISN-0-212) or (MISN-0-430).
2. State the mathematical expression describing a one-dimensionalsingle-frequency wave disturbance as a function of time and dis-tance from the wave source (MISN-0-203).
Output Skills (Knowledge):
K1. Vocabulary: central maximum, coherent wave sources, construc-tive interference, destructive interference, interference pattern,path difference, phase difference, angular frequency.
K2. State the conditions for destructive and constructive interference,both in terms of phase difference and in terms of path difference.
K3. State the expression for the intensity of the net wave disturbanceproduced by two equal-amplitude waves from coherent sources, asa function of path difference.
Output Skills (Problem Solving):
S1. Determine by mathematical and graphical methods the amount ofnet wave disturbance at a given point in space produced by twoequal-amplitude coherent-source waves.
S2. Determine points in space where two equal-amplitude coherent-source waves produce maximum or minimum resultant waves.
S2. Sketch the wave disturbance, produced at a given point in space bytwo equal-amplitude coherent-source waves, as functions of time,along with each of the contributing waves.
External Resources (Required):
1. Ruler, protractor.
3
THIS IS A DEVELOPMENTAL-STAGE PUBLICATIONOF PROJECT PHYSNET
The goal of our project is to assist a network of educators and scientists intransferring physics from one person to another. We support manuscriptprocessing and distribution, along with communication and informationsystems. We also work with employers to identify basic scientific skillsas well as physics topics that are needed in science and technology. Anumber of our publications are aimed at assisting users in acquiring suchskills.
Our publications are designed: (i) to be updated quickly in response tofield tests and new scientific developments; (ii) to be used in both class-room and professional settings; (iii) to show the prerequisite dependen-cies existing among the various chunks of physics knowledge and skill,as a guide both to mental organization and to use of the materials; and(iv) to be adapted quickly to specific user needs ranging from single-skillinstruction to complete custom textbooks.
New authors, reviewers and field testers are welcome.
PROJECT STAFF
Andrew Schnepp WebmasterEugene Kales GraphicsPeter Signell Project Director
ADVISORY COMMITTEE
D.Alan Bromley Yale UniversityE. Leonard Jossem The Ohio State UniversityA.A. Strassenburg S.U.N.Y., Stony Brook
Views expressed in a module are those of the module author(s) and arenot necessarily those of other project participants.
c© 2001, Peter Signell for Project PHYSNET, Physics-Astronomy Bldg.,Mich. State Univ., E. Lansing, MI 48824; (517) 355-3784. For our liberaluse policies see:
http://www.physnet.org/home/modules/license.html.
4
MISN-0-230 1
INTERFERENCE FROM
TWO SYNCHRONIZED WAVE SOURCES
by
Peter Signell and William C. Lane, Michigan StateUniversity
1. Introduction
1a. Overview. The interference of waves is one of the most importantand useful phenomena in physics. Historically, interference effects helpedconfirm the wave nature of light. The bending of sound and light wavesaround obstacles and corners, the fundamental limitation of the resolvingpower of optical instruments, the existence of “dead spots” in an audito-rium, the appearance of colored rings in oil slicks, and the non-reflectiveproperties of thin-metal coatings on lenses are all examples of interferenceand its related phenomenon, diffraction.
1b. Synchronized Wave Sources. Interference of two waves is gener-ally only useful if the waves have the same frequency and hence a constantphase difference. This will happen if the two different waves come fromsources that are “synchronized” so they emit crests at the same time,troughs at the same time, etc. As an illustration, think of an infinitelylarge swimming pool. Out in the middle are two flat horizontal discsjust under the surface of the water (they are parallel to the surface). Avertical rod is connected to each disc. The two rods go straight up toan overhead crankshaft which causes the discs to move up and down to-gether so they are synchronized wave sources. They move up and downwith the same amplitude so they are equal sources of waves. The com-bination of waves from both wave sources is visually apparent over thesurface of the water as an “interference pattern” with some areas thatmove up and down, some points in the centers of those areas that becomefirst maximum-height peaks and then minimum-height troughs, and somepoints between the “up and down” areas that never move at all (“nodes”).
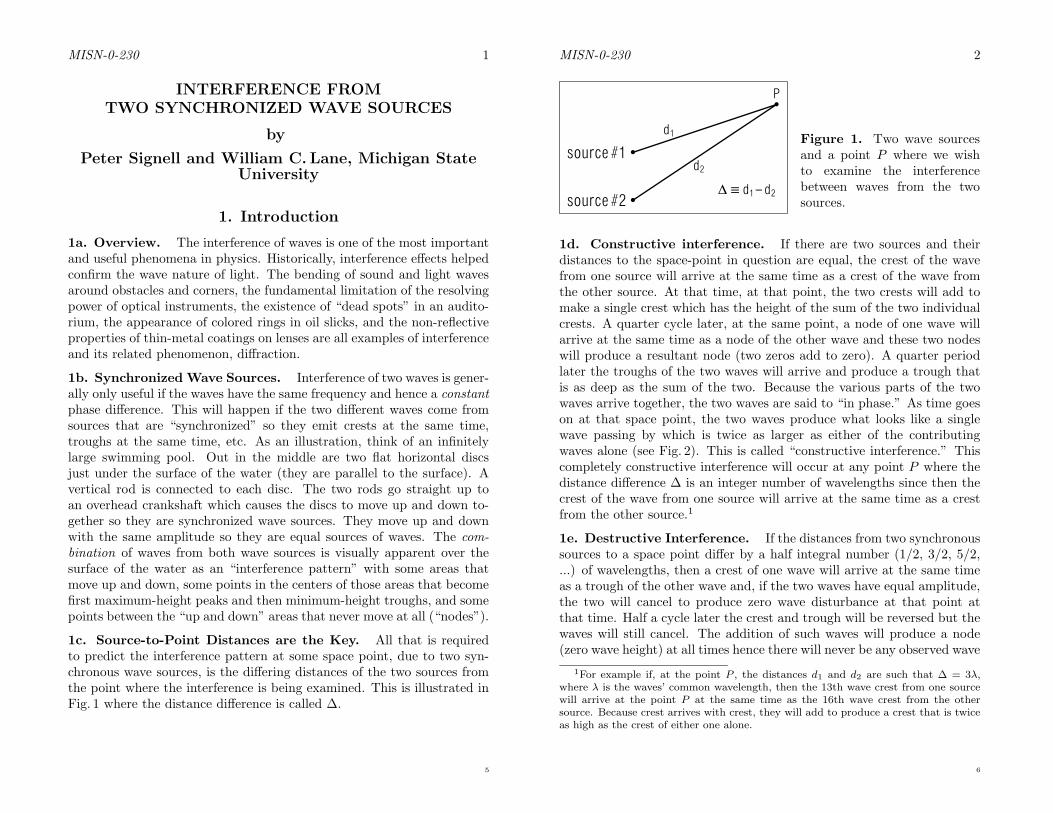
1c. Source-to-Point Distances are the Key. All that is requiredto predict the interference pattern at some space point, due to two syn-chronous wave sources, is the differing distances of the two sources fromthe point where the interference is being examined. This is illustrated inFig. 1 where the distance difference is called ∆.
5
MISN-0-230 2
source #1
source #2
P
d1
D º d1 - d2
d2
Figure 1. Two wave sourcesand a point P where we wishto examine the interferencebetween waves from the twosources.
1d. Constructive interference. If there are two sources and theirdistances to the space-point in question are equal, the crest of the wavefrom one source will arrive at the same time as a crest of the wave fromthe other source. At that time, at that point, the two crests will add tomake a single crest which has the height of the sum of the two individualcrests. A quarter cycle later, at the same point, a node of one wave willarrive at the same time as a node of the other wave and these two nodeswill produce a resultant node (two zeros add to zero). A quarter periodlater the troughs of the two waves will arrive and produce a trough thatis as deep as the sum of the two. Because the various parts of the twowaves arrive together, the two waves are said to “in phase.” As time goeson at that space point, the two waves produce what looks like a singlewave passing by which is twice as larger as either of the contributingwaves alone (see Fig. 2). This is called “constructive interference.” Thiscompletely constructive interference will occur at any point P where thedistance difference ∆ is an integer number of wavelengths since then thecrest of the wave from one source will arrive at the same time as a crestfrom the other source.1
1e. Destructive Interference. If the distances from two synchronoussources to a space point differ by a half integral number (1/2, 3/2, 5/2,...) of wavelengths, then a crest of one wave will arrive at the same timeas a trough of the other wave and, if the two waves have equal amplitude,the two will cancel to produce zero wave disturbance at that point atthat time. Half a cycle later the crest and trough will be reversed but thewaves will still cancel. The addition of such waves will produce a node(zero wave height) at all times hence there will never be any observed wave
1For example if, at the point P , the distances d1 and d2 are such that ∆ = 3λ,where λ is the waves’ common wavelength, then the 13th wave crest from one sourcewill arrive at the point P at the same time as the 16th wave crest from the othersource. Because crest arrives with crest, they will add to produce a crest that is twiceas high as the crest of either one alone.
6

MISN-0-230 3
resultant wave
wave from source #1 =wave from source #2
At onespacepoint
Figure 2. Two equal-amplitude waves from synchronoussources arriving in phase at the point P of Fig. 1.
at such space points (see Fig. 3). We say that the waves are “completelyout of phase.” This called “destructive interference.”
1f. Goals of This Module. In this module we concentrate on find-ing the wave at some given space point resulting from two synchronoussources located some distance away, with the additional assumption thatthe amplitudes of the two arriving waves are equal.2 These simplifica-tions, synchronicity and equal arriving amplitudes, make problem-solvingsimpler while retaining the essential aspects of interference. Specifically,we consider these two types of problems: (1) the two sources and thespace point are given and the goal is to find the observed resultant waveat the space point as a function of time; or (2) the sources are given andthe goal is to find space points where the resultant wave amplitude is amaximum or a minimum (zero). In both these cases one must computethe sources-to-point distances difference and compare it to the waves’
2More-general cases are treated elsewhere (see, for example, MISN-0-231).
resultant wave
wave from source #1
wave from source #2
Figure 3. Two equal-amplitude waves from synchronoussources arriving completely out of phase at the point P ofFig. 1.
7
MISN-0-230 4
wavelength to see the extent to which the waves add constructively ordestructively.
2. Mathematical Description
2a. The Phase Difference: Description. We combine two travel-ling waves that have the same frequency, wavelength, and amplitude, butdiffering phase. The reason the phases of the two waves are different isbecause their synchronized sources are different distances away from thepoint where we are examining the waves. If at some time we see that onewave arrives one-quarter cycle (one-fourth of a period) ahead of the otherwave, that one-quarter wave difference between the two will be constantwith time because the sources and the examination point are assumed tobe stationary. One can describe the one-quarter-wave difference as a 90◦
phase difference between the two waves or, entirely equivalently, as a π/2radian phase difference.
2b. The Phase Difference: Calculation. Equal-amplitude wavesfrom two synchronous sources, examined at some specific space point,will have a constant phase difference which can be computed from thewaves’ wavelength and the difference between the distances to the twosources:
δ =∆
λ2π radians; or δ =
∆
λ360◦ .
Here ∆ is the sources-to-point distances difference and λ if the waves’common wavelength. We can simplify the phase equation by introducingthe waves’ common wave number, k ≡ 2π/λ:
δ = k∆ . (1)
2c. Derivation of the Phase Difference. We can write the individ-ual heights, ξ1 and ξ2, of the two waves arriving at the examination pointP as:
ξ1(P, t) = ξ0 sin(kd1 + ωt) ,
ξ2(P, t) = ξ0 sin(kd2 + ωt) ,(2)
where ω is the waves’ common “angular frequency” (ω ≡ 2πν ≡ 2π/τ),ν is their frequency, τ is their period (the time for one complete wave tobe emitted by the source or to pass the point P ), the two ξ0’s are thewaves’ amplitudes, the ξ(d1, t) and ξ(d2, t) are the waves’ disturbances attheir distances d1 and d2 from the source at time t. Note that we have
8

MISN-0-230 5
taken time zero on our stop-watch (t = 0) as being when the waves arerising through a node as they come out of their sources (zero phases atthat time). We can eliminate k d2 betwen Eqs. (1) and (2) to get:
ξ1(P, t) = ξ0 sin(kd1 + ωt) ,
ξ2(P, t) = ξ0 sin(kd1 + ωt+ δ) .(3)
This form makes it clear that the two waves are identical at any spacepoint except for a phase difference δ which depends only on the distancedifference and not on time.
2d. The Resultant Wave. Two equal-amplitude synchonous-sourcewaves, ξ1 and ξ2, simply add at any point to give a resulting wave ξRwhich is a function of time at that point:
ξR(P, t) = ξ0 sin(kd1 + ωt+ φ) + ξ0 sin(kd1 + ωt+ φ+ δ) , (4)
where we have used Eqs. (3). We now use trigonometric identities on theright-hand side of Eq. (4) to get the equivalent single-wave form:
ξR(P, t) = ξR0(P ) sin
(
kd1 + ωt+δ
2
)
, (5)
whereξR0(P ) = ξ02 cos(δ/2) . (6)
Thus the resultant disturbance is itself just a wave like either of the twoincident waves, with their wavelength and their frequency, but with a dif-ferent amplitude and phase. Note that, for this case of equal-amplitudeincident waves, the resultant wave’s phase constant is just half way be-tween the two incident waves’ phases (compare Eq. (5) to Eqs.(3)).
¤ Evaluate Eq. (5), using Eq. (6) to evaluate ξR0(P ), for the cases: (i)δ = 0; (ii) δ = π; (iii) δ = 2π. Also determine the difference between thetwo source-to-point distances for each case. Help: [S-1]
3. Solving Problems
3a. Finding Maximum and Minimum Points. To find placeswhere the resultant wave is always zero, we need only solve Eq. (5) forthose δs which make the wave’s amplitude always zero, (δ = π, 3π, ...),and then solve Eq. (1) for the corresponding distance differences, (∆ =λ/2, 3λ/2, ...). To find the places where the resulting wave disturbances
9
MISN-0-230 6
source #1
source #2
P
x
L
d1
d/2
d/2
d2
Figure 4. Specificationof dimensions for Fig. 1.
are maximum, we go through the same process using those δs which makethe resulting wave’s amplitude a maximum, (δ = 0, 2π, 4π, ...) with thecorresponding distance differences, (∆ = 0, λ, 2λ, ...).
3b. Finding the Resulting Wave at a Point. To find the resultingwave at a point we need only measure the distances from the point to thesources, then calculate δ from Eq. (1), then calculate ξR0(P ) from Eq. (6),then calculate the resultant wave itself from Eq. (5).
3c. Intensity. If wave intensity I = |ξR(P, t)|2 is needed or given
rather than wave amplitude, note that a place of maximum, minimum, orzero amplitude will be a place of maximum, minimum, or zero intensityas well.
3d. An Example. Suppose there are two synchronous sources locateda distance d apart as in Fig. 4: we are given the source waves’ wavelengthsand are asked to find the first spot P a distance x up the line in the figurewhere the interference pattern between the equal-amplitude waves showsa constant zero disturbance.3 One way to solve the problem would be toget out a scale (a “ruler”) and measure the distances from the sources tosome point P at an x and use the distance difference to see if ∆ = λ/2;if not, keep moving to new points P and recalculating ∆ until the pointwith a wave minimum is found. Alternatively, one can solve the equation
d1,min − d2,min = λ/2 , (7)
where d1,min and d2,min are the distances to the P that shows the min-imum. Equation (7) can be written in terms of the variables in Fig. 4as:
√
L2 + (xmin + d/2)2 −√
L2 + (xmin − d/2)2 = λ/2 . (8)
3The line containing P is perpendicular to the perpendicular bisector of the lineconnecting the two sources; x is measured from the perpendicular bisector as shown.
10
MISN-0-230 7
Here we solve for xmin, the position of the first minimum resultant distur-bance found as x increases from zero; the first position where the distancesdiffer by a half integral number of wavelengths. Solving Eq. (8) directlyis somewhat involved.4
Most applications of Eq. (8) to light make the very good assumptionthat (x± d/2) ¿ L whereupon Eq. (8) reduces to the very manageable:
xmin ≈λL
2d. (9)
4. Young’s Experiment
4a. Historical Overview. In 1801 Thomas Young demonstrated theinterference of light, thus confirming the wave nature of light. Until thistime, the particle theory of light proposed by Sir Isaac Newton was theviewpoint accepted by the majority of the scientific community, despitethe claims of theorists such as Huygens that light was a wave phenomenon.The results of Young’s experiment, though disbelieved by many at thetime, gave indisputable proof that light has wave-like properties such aswavelength and frequency. The discoveries of Quantum Mechanics in thepresent century have shed further light on the nature of light and on itswave-like and particle-like properties.5
4b. Coherent Sources Were the Key. An absolutely essential re-quirement for interference to be observed is the availability of coherent
4To solve Eq. (8) formally, square both sides and then isolate the one remainingsquare root on one side of the equation. Square both sides again and the square rootwill be gone. The resulting equation is a quartic (fourth-order) polynomial equation.A similar case is solved in Problem 6 of this module’s Problem Supplement, usingshortcuts available for this case. To solve any quartic equation brainlessly, follow thedirections in Handbook of Mathematical Functions, Ed. by Abromowitz and Segun,U.S. Department of Commerce, National Bureau of Standards Applied MathematicsSeries No. 55, U.S. Government Printing Office, Washington D.C. (1970), p. 17. Themethod involves combining the quartic equation’s coefficients in three ways and usingthose combinations as the coefficients in a cubic equation. The cubic equation is thensolved using the technique given many places, including in Abromowitz. The realsolution of the cubic equation is then combined with the quartic equation’s coefficientsin four ways to produce the coefficients of two different quadratic equations. Each ofthose quadratic equations has two solutions and the four solutions together are thefour solutions to the original quartic equation. On the other hand, the equation canbe solved numerically through use of polynomial-root-finding computer programs.
5See Characteristics of Photons, MISN-0-212, andWave Particle Duality for Light,MISN-0-246.
11
MISN-0-230 8
angular view
cross-section
opaque
sheet
opaque
sheet
screen
screen
light waves
light waves
d
Lslits
x
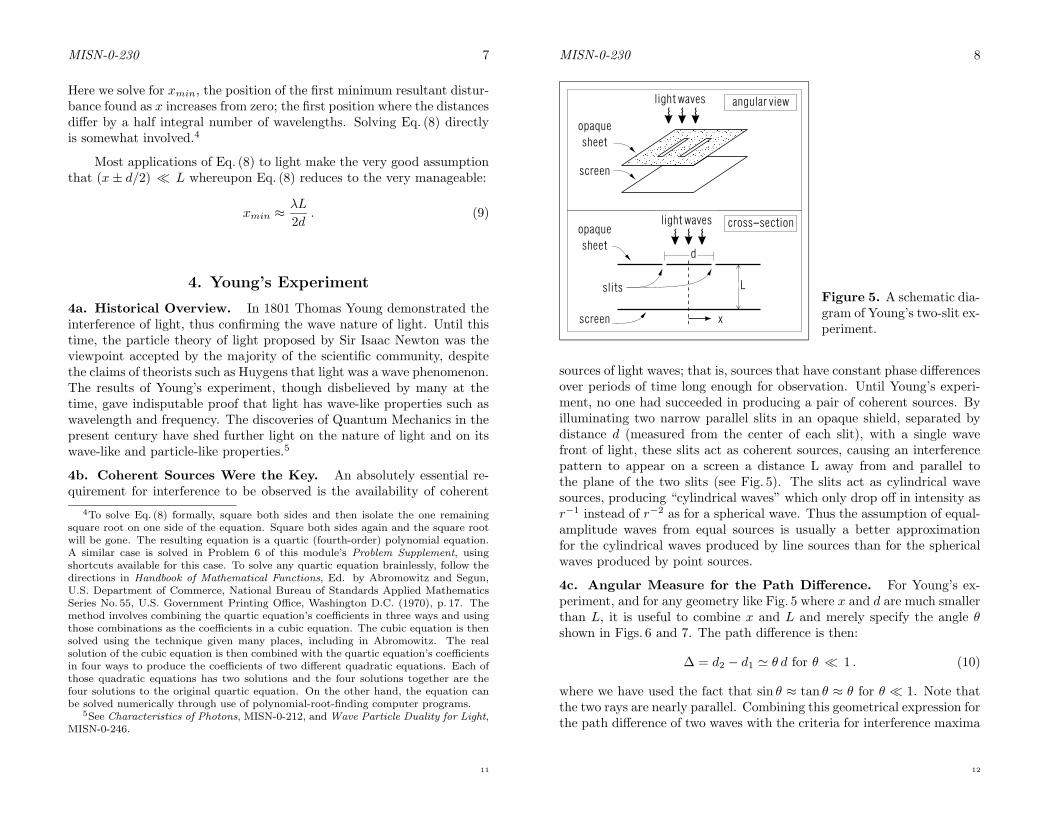
Figure 5. A schematic dia-gram of Young’s two-slit ex-periment.
sources of light waves; that is, sources that have constant phase differencesover periods of time long enough for observation. Until Young’s experi-ment, no one had succeeded in producing a pair of coherent sources. Byilluminating two narrow parallel slits in an opaque shield, separated bydistance d (measured from the center of each slit), with a single wavefront of light, these slits act as coherent sources, causing an interferencepattern to appear on a screen a distance L away from and parallel tothe plane of the two slits (see Fig. 5). The slits act as cylindrical wavesources, producing “cylindrical waves” which only drop off in intensity asr−1 instead of r−2 as for a spherical wave. Thus the assumption of equal-amplitude waves from equal sources is usually a better approximationfor the cylindrical waves produced by line sources than for the sphericalwaves produced by point sources.
4c. Angular Measure for the Path Difference. For Young’s ex-periment, and for any geometry like Fig. 5 where x and d are much smallerthan L, it is useful to combine x and L and merely specify the angle θshown in Figs. 6 and 7. The path difference is then:
∆ = d2 − d1 ' θ d for θ ¿ 1 . (10)
where we have used the fact that sin θ ≈ tan θ ≈ θ for θ ¿ 1. Note thatthe two rays are nearly parallel. Combining this geometrical expression forthe path difference of two waves with the criteria for interference maxima
12
MISN-0-230 9
D
q
slit #1 source
slit #2 source
Path 1
Path 2
qd
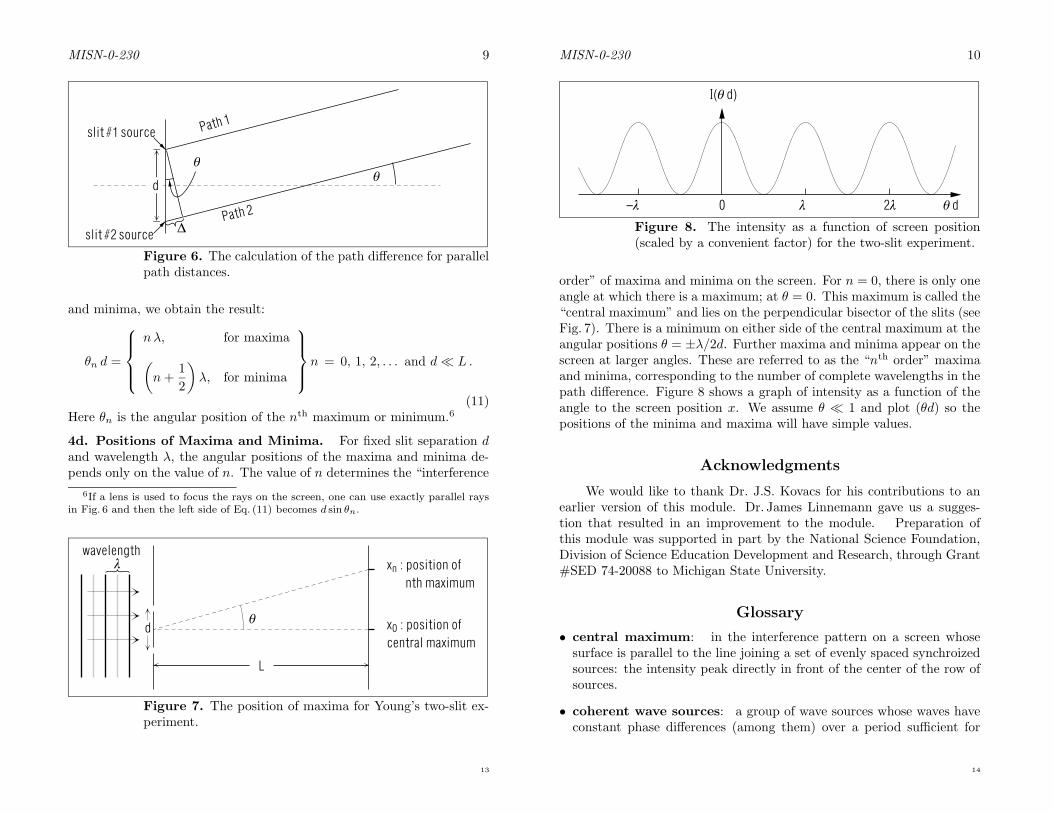
Figure 6. The calculation of the path difference for parallelpath distances.
and minima, we obtain the result:
θn d =
nλ, for maxima
(
n+1
2
)
λ, for minima
n = 0, 1, 2, . . . and d¿ L .
(11)Here θn is the angular position of the n
th maximum or minimum.6
4d. Positions of Maxima and Minima. For fixed slit separation dand wavelength λ, the angular positions of the maxima and minima de-pends only on the value of n. The value of n determines the “interference
6If a lens is used to focus the rays on the screen, one can use exactly parallel raysin Fig. 6 and then the left side of Eq. (11) becomes d sin θn.
x : position of
nth maximumn
x : position of
central maximum0
L
qd
l
wavelength
Figure 7. The position of maxima for Young’s two-slit ex-periment.
13
MISN-0-230 10
I( )q d
0-l l 2l q d
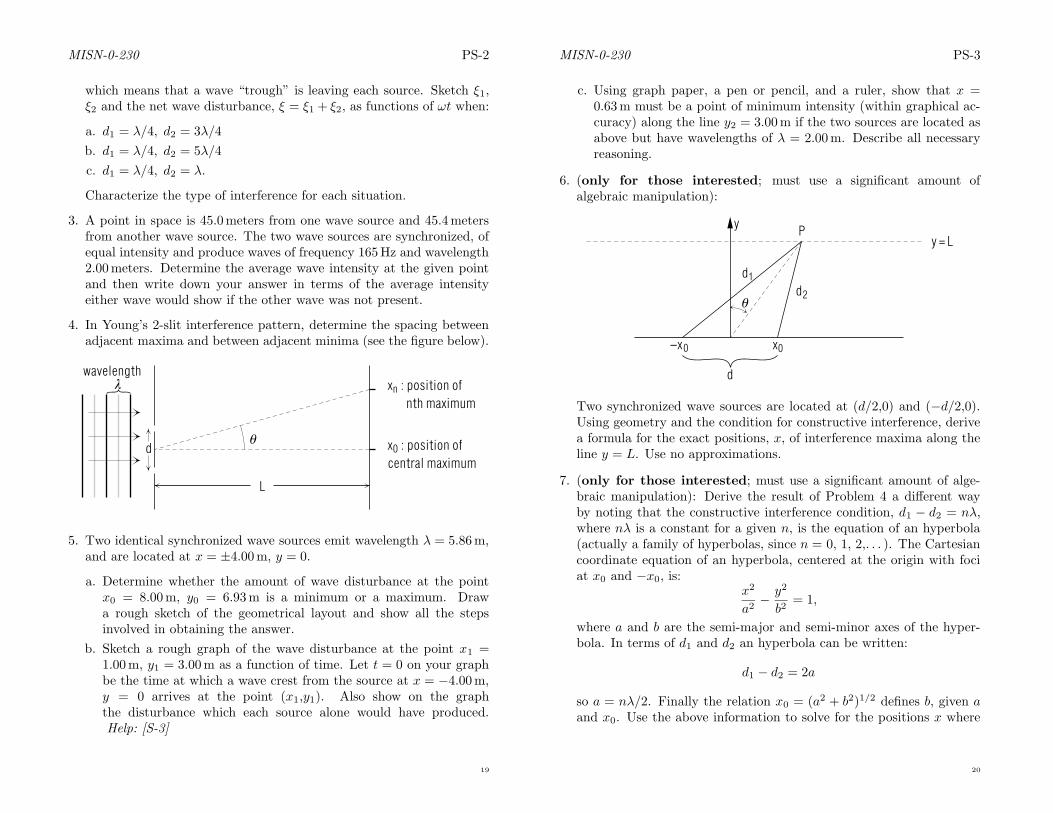
Figure 8. The intensity as a function of screen position(scaled by a convenient factor) for the two-slit experiment.
order” of maxima and minima on the screen. For n = 0, there is only oneangle at which there is a maximum; at θ = 0. This maximum is called the“central maximum” and lies on the perpendicular bisector of the slits (seeFig. 7). There is a minimum on either side of the central maximum at theangular positions θ = ±λ/2d. Further maxima and minima appear on thescreen at larger angles. These are referred to as the “nth order” maximaand minima, corresponding to the number of complete wavelengths in thepath difference. Figure 8 shows a graph of intensity as a function of theangle to the screen position x. We assume θ ¿ 1 and plot (θd) so thepositions of the minima and maxima will have simple values.
Acknowledgments
We would like to thank Dr. J.S. Kovacs for his contributions to anearlier version of this module. Dr. James Linnemann gave us a sugges-tion that resulted in an improvement to the module. Preparation ofthis module was supported in part by the National Science Foundation,Division of Science Education Development and Research, through Grant#SED 74-20088 to Michigan State University.
Glossary
• central maximum: in the interference pattern on a screen whosesurface is parallel to the line joining a set of evenly spaced synchroizedsources: the intensity peak directly in front of the center of the row ofsources.
• coherent wave sources: a group of wave sources whose waves haveconstant phase differences (among them) over a period sufficient for
14

MISN-0-230 11
interference patterns to be observed.
• constructive interference: a combination of two or more wave dis-placements at a particular point in space where the net wave intensity isgreater than the intensity of any of the individual wave displacements.
• destructive interference: a combination of two or more wave dis-placements at a particular point in space where the net wave intensityis less than the intensity of any of the individual wave displacements.
• interference pattern: a spatial variation in the net intensity of thecombined wave disturbance due to two or more sources of waves thathave constant phase differences.
• interference order: the number of complete wavelengths in the pathdifference between waves from two successive synchronized wave sourcesthat combine at a point in space to form an interference maximum. Thisnumber is used to count the maxima, e.g. the third order maxima arethe third intensity peaks in the interference pattern on either side ofthe central maximum.
• maxima: in interference patterns, points of total constructive inter-ference, where the intensity of the interference pattern is at its great-est. These points occur when the wave displacements from the varioussources present are completely in phase.
• minima: in interference patterns, points of destructive interference,where the intensity of the interference pattern is at its weakest. Thesepoints occur when the phase difference of the individual wave displace-ments results in a net disturbance of minimal amplitude.
• path difference: in interference patterns, the difference in the dis-tance that two waves from successive synchronized wave sources travelto reach a given point in space where the net wave displacements arebeing examined.
• phase difference: in interference patterns, the difference in the phaseof two wave displacements that combine at a given point in space wherethe net wave displacements are being examined. The phase differenceis related to the path difference and the wavelength of the wave.
• synchronized sources: of waves emit waves of the same frequencyand phase.
15
MISN-0-230 12
A. Time Averaging of Intensities
The intensity of the net wave disturbance produced by two or moresynchronized wave sources at point P may be written as:
I(P, t) = I0(P ) cos2 (ωt+ φ) ,
where all spatial coordinate dependencies are included in the time-independent factor I0(P ). Since the maximum value of cos2 θ is 1 andits minimum value is zero, the intensity at a fixed point in space oscillatesback and forth between its peak value of I0(P ) and its minimum value ofzero. The angular frequency of this oscillation is ω. These fluctuationsare usually too rapid to be detected, so measurements are made of thetime-averaged intensity.
The long term time-average is the same as the average over one waveperiod, since all wave periods are duplicates of each other, so we need onlycalculate the average over one period. The time-average of the intensityis denoted Iav(P ) and is defined by:
Iav(P ) =1
T
∫ T
0
I0(P, t) dt =1
T
∫ T
0
I0(P ) cos2 (ωt+ φ) dt ,
where T = 2π/ω, which is one period of the wave oscillation. For radiowaves, one period is in the region of microseconds (10−6 s).
If we let ωt + φ = x so ωdt = dx, and use ωT = 2π, the integralassumes this form:
Iav(P ) =I0(P )
2π
∫ 2π+φ
φ
cos2 x dx =I0(P )
2π
∫ 2π
0
cos2 x dx ,
where we have used the fact that the integral over any one period of extentT is the same as the integral over any other period of extent T .
We now use the fact that the integral of cos2 over a complete periodis exactly the same as the integral of sin2 over a complete period (onelooks just like the other, on a graph, but shifted.) Then we can rewritethe integral over cos2 as half the integral over the sum of the sin2 plusthe cos2. However, the sum of those two quantities is just 1, so we get:
Iav(P ) =I(P )
2π
1
2
∫ 2π
0
1 dx =1
2I(P ) .
Thus the time-average of an intensity varying as cos2(ωt+ φ) is one-halfthe peak intensity. Of course the same result holds if the time dependenceis sin2 (ωt+ φ).
16

MISN-0-230 13
t
I(P,t)
I0(P)
0-p
w—
2p
w—
p
w—
Figure 9. The variation in wave intensity as a function oftime at a given space point P at which we observe interfer-ence. The time origin was arbitrarily chosen to coincide withan intensity peak.
17
MISN-0-230 PS-1
PROBLEM SUPPLEMENT
Problem 5 also occurs in this module’s Model Exam.
1.
1
2
3.0 mAMP
P
v = speed of sound = 3.30 x 10 m/ss2
12.0 m
10.0 m
Two identical speakers are connected to the left and right channeloutput of a stereo amplifier. A single-frequency tone, ν = 660Hz, isplayed over the system. A point P is 12.0m from speaker #1 and10.0m from speaker #2.
a. Assuming the speakers are properly connected to the amplifier, i.e.are “in phase,” they constitute two synchronized sources of soundwaves. Determine wherhet the interference occurring at point P isconstructive or destructive.
b. By reversing the connections on one of the speakers, the speakersare 180◦ “out of phase”: when speaker #1 is producing a wave“crest,” speaker #2 is producing a wave “trough.” Describe thetype of interference now taking place at point P .
2. The wave disturbances at a particular point in space P , produced bytwo wave sources, are given by the equations:
ξ1(P, t) = ξ0 sin(kd1 + ωt+ φ1)
ξ2(P, t) = ξ0 sin(kd2 + ωt+ φ2)
The sources are synchronized if the frequencies are the same (they are)and if the phase constants are the same, i.e. φ1 = φ2. Suppose thatφ1 = φ2 = −π/2. This means that, at t = 0 and d1 = d2 = 0:
ξ1(0, 0) = ξ2(0, 0) = ξ0 sin(−π/2) = −ξ0
18
MISN-0-230 PS-2
which means that a wave “trough” is leaving each source. Sketch ξ1,ξ2 and the net wave disturbance, ξ = ξ1 + ξ2, as functions of ωt when:
a. d1 = λ/4, d2 = 3λ/4
b. d1 = λ/4, d2 = 5λ/4
c. d1 = λ/4, d2 = λ.
Characterize the type of interference for each situation.
3. A point in space is 45.0meters from one wave source and 45.4metersfrom another wave source. The two wave sources are synchronized, ofequal intensity and produce waves of frequency 165Hz and wavelength2.00meters. Determine the average wave intensity at the given pointand then write down your answer in terms of the average intensityeither wave would show if the other wave was not present.
4. In Young’s 2-slit interference pattern, determine the spacing betweenadjacent maxima and between adjacent minima (see the figure below).
x : position of
nth maximumn
x : position of
central maximum0
L
qd
l
wavelength
5. Two identical synchronized wave sources emit wavelength λ = 5.86m,and are located at x = ±4.00m, y = 0.
a. Determine whether the amount of wave disturbance at the pointx0 = 8.00m, y0 = 6.93m is a minimum or a maximum. Drawa rough sketch of the geometrical layout and show all the stepsinvolved in obtaining the answer.
b. Sketch a rough graph of the wave disturbance at the point x1 =1.00m, y1 = 3.00m as a function of time. Let t = 0 on your graphbe the time at which a wave crest from the source at x = −4.00m,y = 0 arrives at the point (x1,y1). Also show on the graphthe disturbance which each source alone would have produced.Help: [S-3]
19
MISN-0-230 PS-3
c. Using graph paper, a pen or pencil, and a ruler, show that x =0.63m must be a point of minimum intensity (within graphical ac-curacy) along the line y2 = 3.00m if the two sources are located asabove but have wavelengths of λ = 2.00m. Describe all necessaryreasoning.
6. (only for those interested; must use a significant amount ofalgebraic manipulation):
y = L
y
d1
d2q
-x0 x0
d
P
Two synchronized wave sources are located at (d/2,0) and (−d/2,0).Using geometry and the condition for constructive interference, derivea formula for the exact positions, x, of interference maxima along theline y = L. Use no approximations.
7. (only for those interested; must use a significant amount of alge-braic manipulation): Derive the result of Problem 4 a different wayby noting that the constructive interference condition, d1 − d2 = nλ,where nλ is a constant for a given n, is the equation of an hyperbola(actually a family of hyperbolas, since n = 0, 1, 2,. . . ). The Cartesiancoordinate equation of an hyperbola, centered at the origin with fociat x0 and −x0, is:
x2
a2−y2
b2= 1,
where a and b are the semi-major and semi-minor axes of the hyper-bola. In terms of d1 and d2 an hyperbola can be written:
d1 − d2 = 2a
so a = nλ/2. Finally the relation x0 = (a2 + b2)1/2 defines b, given a
and x0. Use the above information to solve for the positions x where
20
MISN-0-230 PS-4
the hyperbolas intersect the line y = L. These are the locations of in-terference maxima along y = L. Note that the same type of derivationcould be carried out to locate interference minima using the relation:
d1 − d2 =
(
n+1
2
)
λ, n = 0, 1, 2 . . .
21
MISN-0-230 PS-5
Brief Answers:
1. a. constructive interference
b. destructive interference
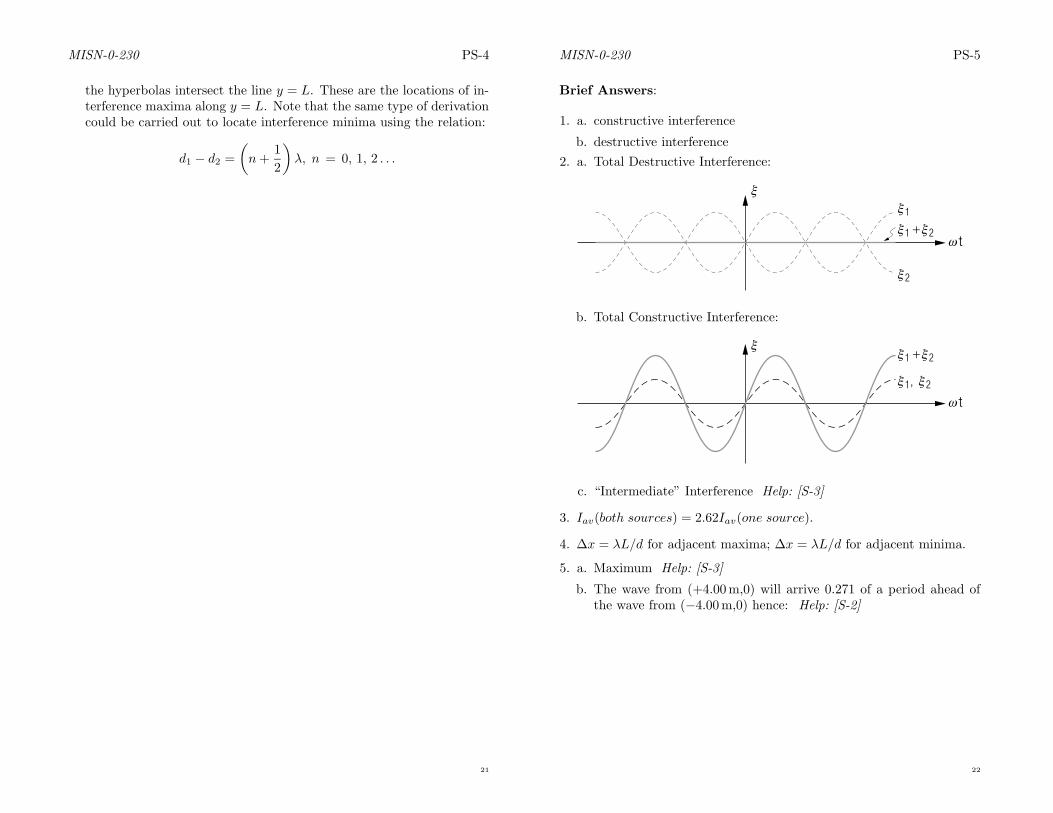
2. a. Total Destructive Interference:
x
x2
x2
x1
x1wt
+
b. Total Constructive Interference:
x
x2
x2
x1,
x1
wt
+
c. “Intermediate” Interference Help: [S-3]
3. Iav(both sources) = 2.62Iav(one source).
4. ∆x = λL/d for adjacent maxima; ∆x = λL/d for adjacent minima.
5. a. Maximum Help: [S-3]
b. The wave from (+4.00m,0) will arrive 0.271 of a period ahead ofthe wave from (−4.00m,0) hence: Help: [S-2]
22

MISN-0-230 PS-6
x
t
resultant (observed)
disturbancefrom
(-4,0)
from
(+4,0)
c. (Construct the graph).
6.
xn = ±
(
nλ
2
)
√
1 +L2
(d/2)2 − (nλ/2)2Help: [S-1]
7. Same as Answer 6.
23
MISN-0-230 AS-1
SPECIAL ASSISTANCE SUPPLEMENT
S-1 (from PS, problem 6)
d1−d2 = nλ, where d1 and d2 are defined in terms of somewhat unwieldysquare roots. Be sure to move d2 to the other side of the equation beforesquaring to solve for x, i.e.
d21 = (d2 + nλ)2 = d2
2 + 2nλd2 + (nλ)2.
Substituting the expressions for d21 and d
22 (leaving d2 as is, temporarily)
several terms cancel. You can then isolate d2 on one side and squareagain, then solve for x.
S-2 (from PS-problem 5b)
Most parts of this problem are contained in problems 1-4 and this mod-ule’s text and Glossary. Do problems 1-4 first. Do not merely copy theiranswers: make sure you work out their complete solutions yourself.
Apart from the above, be aware that the sources are both on the x-axis and that the point at which you are asked to find the degree ofinterference is above the x-axis (a positive y value).
Also, the path-difference-to-wavelength ratio equals the time-difference-to-period ratio. Here the time difference is the difference in the amountof time it takes simultaneously-emitted waves to get from their sourcesto the point in question. That is, one can clock the amount of time ittakes a wave peak, say, to get from one source to the point. One canalso clock the time it takes for the simultaneously-emitted peak fromthe other source to get to the point: the time difference is the differencein those two times.
Finally, note that the crest from the source at (+4.00m,0) arrives beforethe crest from the source at (−4.00m,0) because it has a shorter distanceto travel. That means it must arrive at a time before time zero so itmust arrive at a negative time (see the figure in the answer).
24
MISN-0-230 AS-2
S-3 (from PS-problem 2c)
The curves plotted represent:
ξ1 = ξ0 sin(ωt)
ξ2 = ξ0 sin(ωt+ 3π/2)
= ξ0 sin(ωt− π/2).
Note that one must use: k = 2π/λ and (3/4)(2π) = 3π/2.
25
MISN-0-230 ME-1
MODEL EXAM
Note: You must bring a ruler and a pen or pencil to the exam. Ask theexam manager for a piece of graph paper if you need it and it is not givenon the exam.
1. See Output Skills K1-K3 in this module’s ID Sheet. One or more ofthese skills, or none, may be on the actual exam.
2. Consider two synchronized wave sources with wavelength λ = 5.86m,located at x = ±4.00m, y = 0.
a. Determine whether the amount of wave disturbance at the pointx0 = 8.00m, y0 = 6.93m is a minimum or a maximum. Drawa rough sketch of the geometrical layout and show all the stepsinvolved in obtaining the answer.
b. Sketch a rough graph of the wave disturbance at the point x1 =1.00m, y1 = 3.00m as a function of time. Make t = 0 be the timeat which a wave crest from the source at x = −4.00m, y = 0 arrivesat the point (x1, y1). Also show on the graph the disturbance whicheach source alone would have produced.
c. Using graph paper, a pen or pencil, and a ruler, show that x =0.63m must be a point of minimum intensity (within graphical ac-curacy) along the line y2 = 3.00m if the two sources are located asabove but have wavelengths of λ = 2.00m. Describe all necessaryreasoning.
Brief Answers:
1. See this module’s text.
2. See this module’s Problem Supplement, problem 5.
26

27 28