intergenerational transfers and the evolution of … of the micro-simulations human living...
TRANSCRIPT

November 4, 2005 date last saved: 11/7/2005 8:07 AM
date last printed: 9/6/2006 10:38 AM
Version 15
Intergenerational Transfers and The Evolution of Human Mortality: A Microsimulation
Preliminary draft for comments only.
Ronald Lee Demography and Economics
University of California 2232 Piedmont Ave. Berkeley, CA 94720
Earlier versions of this paper were presented at a Workshop at UC Berkeley (June 6-8, 2005) and a Workshop on Evolutionary Biodemography at the University of Virginia (Oct 28-30, 2005). Research was funded by NIA grants P01 AG022500 and R37 AG11761. Tim Miller and Carl Boe programmed the simulations and contributed to their design. Hillard Kaplan and Micahel Gurven provided helpful information about food sharing behavior and group living arrangements. Tommy Bengtsson provided helpful insights about elasticities of fertility and mortality with respect to quantity of food consumed based on historical studies. Steve Orzack and Daniel Levitis commented on the simulation design. Any remaining errors are my responsibility alone.

Introduction Why do most species senesce? The classic theory (Medawar, 1952; Williams, 1957; Hamilton, 1966) argues that deleterious mutations raising mortality at older ages will be selected out of the population more slowly than those affecting younger ages, because the share of lifetime reproduction remaining declines with age and deaths have less effect on reproductive fitness. This share is 1.0 until sexual maturity, and then declines monotonically with age throughout the reproductive years until cessation of fertility (around age 50 in humans) when it reaches 0. The theory predicts that mortality will be low and constant from birth to sexual maturity, and rise thereafter, accelerating rapidly as reproduction ceases, with no postreproductive survival (Hamilton, 1966). But human hunter gatherers have extensive postreproductive survival, and high infant mortality that declines from initially high levels (Hill and Hurtado, 1996; Howell, 1979; Weiss, 1973; Lee, 1997), contrary to the theory. Lee (2003) showed, using comparative static analysis of genetic lineages, that when intergenerational transfers are incorporated in the theory, it predicts both these aspects of human mortality, formalizing earlier ideas (Fisher (1930), Williams (1957) and Hamilton (1966)). Here we apply Lee’s theory to the human case using an ethnographically informed microsimulation that does not require lineages or steady states, and show that with transfers and food sharing, evolution leads to U-shaped mortality with postreproductive survival and high but declining childhood mortality, as predicted by Lee (2003). The simulations also show how different social food sharing arrangements would lead to different mortality patterns. This theory provides a basis for applying mutation accumulation theories to humans without needing unrealistic and ad hoc assumptions to produce postreproductive survival, for example that human fertility continues to age 70 or beyond (Charlesworth, 2001). Lee (2003) showed how intergenerational transfers, including post-birth parental investment in offspring, influence the evolution of the age pattern of mortality throughout life. The force of selection against mortality at any age is a weighted average of the Hamilton effect (remaining fertility after age a, F(a)) and a new transfer effect (remaining net transfers after age a, T(a)). If a species makes no post-birth transfers, then the weight on F(a) is 1.0 and on T(a) is 0, and the classic theory holds. If transfers are made and the species has evolved a level of fertility that optimizes the quantity-quality tradeoff for offspring, then the weight on F(a) is 0 and on T(a) is 1.0. Other weights are also possible, including a negative weight for F(a) when the evolved fertility is above the optimal tradeoff level. Then there may be positive selection for higher infant mortality as a poor substitute for lower fertility. The microsimulation assumes that a single sex population lives in small food-sharing groups within which intergenerational transfers take place. Mutations occur probabilistically every generation, and daughters inherit their mother’s genes. Rules, parameters and initial age schedules are based on historical and ethnographic studies. Simulated mortality converges to the predictions of Lee (2003), indicating that the simplifying assumptions of the earlier paper did not distort the results.
2

Structure of the Micro-Simulations
Human Living Arrangements and Sharing Behavior Hunter-gatherer families join with other related and unrelated families to form small groups within which food and some tasks are shared, and intergenerational transfers take place. Based on Binford’s (2001) analysis of ethnographic studies of 339 hunter-gatherer populations, the microsimulation assumes that a group fissions if it exceeds 25 members, with related families staying together, and groups fuse if they fall below 8 members. (Appendix A). Based on ethnographic studies of food sharing behavior (Gurven, 2004; Kaplan and Gurven, 2004) the microsimulation assumes that 50% of food produced by a nuclear family unit is shared with several families outside that unit, whether the family is part of a small residential group or a larger group. Some of these other families in the sharing group may be related to the first. (Appendix D).
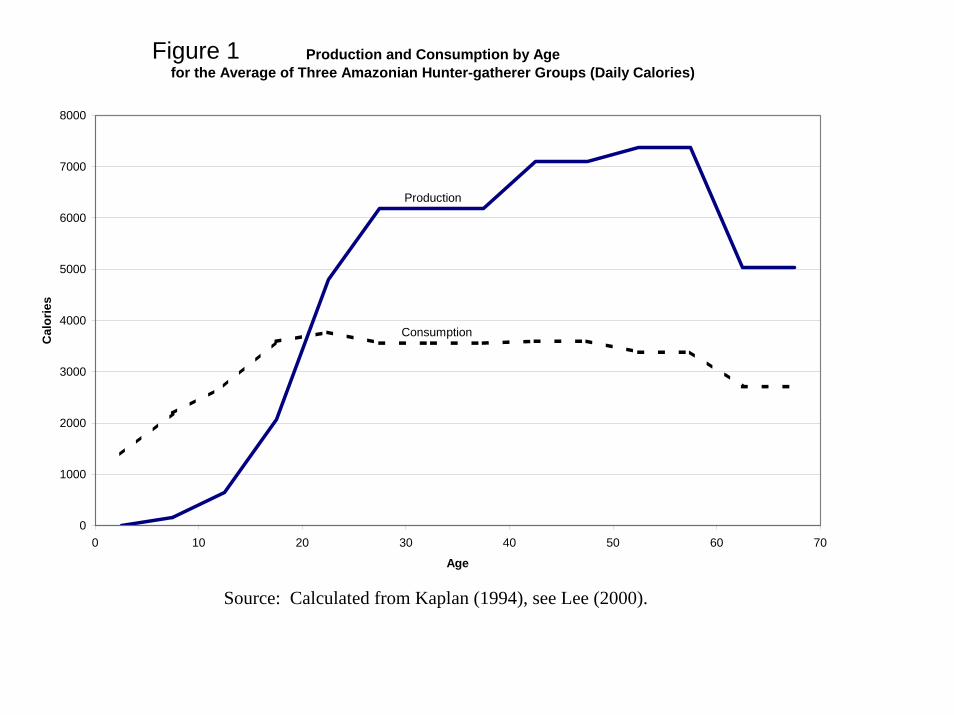
Production, Consumption, and Intergenerational Transfers Empirical age profiles of consumption and production averaged across three Amazon Basin hunter gatherer/horticulturalist groups are taken from Lee (2000) based on data in Kaplan (1994), as plotted in Figure 1. These shapes reflect biological and cultural constraints. The simulation starts with these age profiles and then modifies them to reflect varying circumstances. Because competition for resources takes place among the total population of all sharing groups, the simulation shifts the production age schedule in Figure 1 inversely with population size. In addition, higher consumption in childhood increase adult body size and productivity, and so does higher consumption in the previous period which provides more energy for foraging. See the Box for equations for production and all other variables. The simulation tracks the ages of all members of each sharing group in each period. Group production is the sum of the production of all individuals in the group. Provisional total group consumption is found by summing all the relevant age specific consumptions shown in Figure 1. This provisional total consumption is divided into total production, and their ratio gives the level of the consumption profile for this group in this period, such that consumption equals production, the requirement for balance in the group (the ratio is γ in Lee, 2003). Individual production minus consumption is the net transfer made by an individual at that age. The average value of the net transfers for each age, together with demographic variables, can be used to calculate T(a), the expected net transfers to be made after age a (Lee 2003).
Consumption Influences Demography Consumption of food affects fertility and mortality, and therefore influences reproductive fitness and natural selection. Lacking good estimates for contemporary hunter gatherers, I turn to historical studies of the effect of grain price variations on fertility and mortality of landless laborers in Europe and Asia as reported in Bengtsson et al (2004). The reported elasticities with respect to price were converted into elasticities with respect to quantity consumed. The simulations use a consumption elasticity of 1.0 for fertility and -1.0 for mortality. (See Appendix C). For fertility, an empirical age
3

schedule for a contemporary hunter-gatherer group (Hill and Hurtado, 1996) is modified by the previous periods food consumption. Individuals can have 0, one, or more mutant genes affecting mortality at age x. For simplicity, I will assume that all mutations raise mortality at the relevant age by .1, with due account taken of competing risks (see Box). When an offspring is born, it inherits its mother’s genotype, which is described by the number of mutant genes affecting mortality at each age. However, for each age x, there is a probability p=.01 that one additional mutation affecting age x will occur, and if it does, then the corresponding number of mutations for this offspring will increase by one beyond the number inherited from the mother. The probabilities of mutations with effects at each age are taken to be equal and independent, and the probability of two new mutations occurring at once for the same age is taken to be zero. With this setup, families and sharing groups will be genetically heterogeneous. Initial mortality is taken to be 0 at all ages up to 80, where it is 100%. Over time mutations accumulate and mortality rises.
Natural Selection If the dependency ratio in a group is favorable, then consumption will be high, causing higher fertility for adults, and higher survival for all in the group, and hence greater reproductive fitness. A mutant gene that raises mortality for a postreproductive adult will raise the dependency ratio, reduce consumption, and reduce fitness for all in the group including the carrier of the mutation. The death of a child will raise consumption for all the others, which may partially or completely offset the direct loss of fitness due to the death. The presence of unrelated individuals in the sharing group dilutes the effect of a mutant gene on inclusive reproductive fitness. However, those who have this mutation will tend to live in groups whose members have a higher frequency of the same mutation than will be true for individuals who do not carry the mutation. Other carriers in the same group will include their daughters, granddaughters, and siblings, because family members tend to live together. Therefore individuals who carry this mutation will on average have lower fitness than individuals who do not carry it. For this reason, the mutation will tend to be selected out of the population in the simulation, more or less rapidly depending on the age affected.
Further Micro-simulation Details The model is single sex. The simulation proceeds in five year cycles of age and time, generally for at least 15,000 cycles (75,000 years). Births, deaths and mutations are stochastic, but production is deterministic. The simulation settles down to a stochastic equilibrium in which frequency of mutations by age becomes stochastically stationary, fluctuating but not trending. At high ages, selection against mutations is weak and a process called Muller’s Ratchet (Gordo and Charlesworth, 2000) eventually leads to all individuals having at least one mutation affecting old age mortality, and then eventually at least two, and so on. The Ratchet arises in single sex (haploid) simulations with no back mutation, and is therefore not relevant for real humans who have two sexes.
4

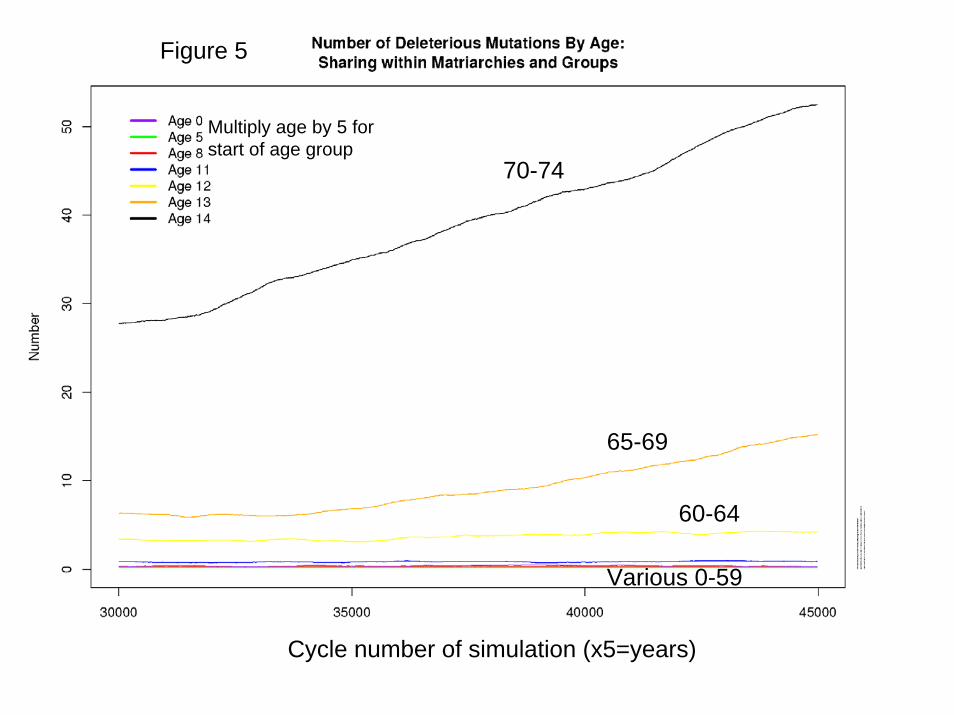
Results Figure 5 plots the simulated average number of mutations affecting mortality at each age per individual in the population. It can be seen that while the average frequencies for ages up to 60-64 (age group 12) appear to be stable over time, those at ages 65-69 and 70-74 are still rising, reflecting the operation of Muller’s Ratchet, as confirmed by the frequency distribution of mutations affecting 70-74: after 150,000 years, no individuals have less than 35 mutations at this site. At the ages below 65, the frequencies stabilize by 5000 cycles or before, and after that there is fluctuation but no trend. Figure 6 presents the key results: mortality declines after birth, remains low at young adult ages, and then rises sharply after age 65, with substantial postreproductive survival. Several theoretical lines are plotted for reference: Hamilton (1/F(a); pure transfers (1/T(a)), and 20% F(a) and 80% T(a). The transfer line and the 80/20 line both correspond closely to the results, approximately replicating Lee (2003). The insights from the comparative static/genetic lineage approach were correct, even if, like all theory, it was based on strong simplifying assumptions. Figure 9 plots the average number of mutations per individual affecting mortality at age 40-44, (change to an older age, say 55-59) showing that the frequency has stabilized. Numerous alternative specifications were investigated, and the results are summarized in Appendix F. When all food was consumed by the matriarch producing it with no broader sharing, postreproductive survival remains as before, but mortality at 0-4 is much higher, perhaps reflecting the unbuffered effect of maternal death on offspring survival. When there was complete sharing at the group level, mortality at age 0-4 declined less sharply while postreproductive survival was stronger, relative to baseline. When sharing takes place at the level of the total population (a purely hypothetical scenario violating the Lee, 2003 assumptions), then mortality collapses to the Hamilton model since all indirect fitness effects through transfers are diluted to nothingness.
Discussion It is striking that a simulated process of mutation and selection produces a very human age pattern of mortality, with postreproductive survival and declining mortality from birth to sexual maturity, confirming the insights of Lee (2003). The mutations considered here are purely deleterious, with no beneficial tradeoffs for mortality at other ages or for fertility. Another important part of the story, not considered here, must be positively selected mutations that move toward or along the efficient trait frontier, toward the optimal life history (Chu and Lee, 2005; Kaplan and Robson, 2002).
Next steps include simulating a two sex population and letting fertility also be subject to mutations. This appears to be the first stochastic simulation to combine mutation and selection with social interaction, for humans or other animals. Its success suggests that this may be a useful approach for exploring the interface of culture and evolution.
5

Methods (words = 288) i,j indexes individual i in group j. x = age of this individual. m i,j(x) = fertility of individual q i,j(x) = probability of death of individual between age x and x+1 N=total population, summed over all groups j. E=environment t-1 = one period lag; otherwise t is suppressed γj = consumption in group j. ( )c x , ( )y x = consumption and production shown in Figure 1.
τi,j(x) = net transfers T(a) = life time net transfers after age a δ = increase in mortality due to mutation ki,j(x) = number of mutations affecting mortality at age x individual i,j. (0.1) ( ) ( ), ˆi j jc x c x γ= (0.2) ( ) ( )( ) ( ) ( ).5 .5 .51
, , ,ˆ /child ti j i j i jy x y x E Nγ γ −= .
(0.3) ( ) ( ), ,1 1
ˆI I
j i j i ji i
y x c xγ= =
=∑ ∑
(0.4) ( ) ( ) ( ), , ,i j i j i jx c x y xτ = −
(0.5) ( ) ( ) ( )rx
aT a e l x x dx
ωτ−= ∫
(0.6) ( ) ( )1 1ˆ, t tj jm x m xγ γ− −=
(0.7) ( ) ( ) ( )( ),1 1
, , 1 1 i jk xt ti j j jq x γ δ γ− −= − −
6

Baseline Assumptions Item Specification Fertility Ache, normalized to GRR=1 (Hill and Hurtado, 1996);
Elastm,γ.=+1.0 Mortality initially 0 until 80, then 1.0, Elastq,γ.=-1.0 Production Average of Three Hunter Gatherer Groups (Kaplan,
1994; Lee, 2000); Elast y,γ in childhood = .5, in previous period = .5.
Density dependence Multiply production age schedule by (E/N)-.5, N is aggregate pop, E=env; Elasty,(E/N)=-.5.
Consumption Average of Three Hunter Gatherer Groups (Kaplan, 1994; Lee, 2000); Elast c,γ = 1.0
Mutation frequency Uniform across age at .01 per generation Mutation lethality Uniform across age at .10 Environment, E Set to yield equilibrium population size near 100,000 Group Formation Fusion if falls below 8, Fission if rises above 25, keep
kin together at fission, families fuse randomly Food sharing Families consume 50% of their output and share 50%
within group. Treatment of Age Five year age groups Sequencing γ measured at end of age-time interval
deaths occur at end of interval births occur after death at end of interval
Length of simulation Each cycle of a 5-year simulation is 5 years. Our baseline simulation ran for 45,000 cycles or 225,000 years.
7

References
Medawar, P. B. (1952) An Unsolved Problem in Biology (H.K. Lewis, London).
Williams, G. C. (1957) Evolution 11, 398-411.
Hamilton, W. E. (1966) J. Theor. Biol. 12, 12-45.
Bengtsson, Tommy, Cameron Campbell, James Z. Lee (2004) Life Under Pressure: Mortality and Living Standards in Europe and Asia, 1700-1900 (The MIT Press, Cambridge, Mass.).
Binford, Lewis R. (2001) Constructing Frames of Reference (University of California Press, Berkeley).
Charlesworth, Brian (1994) Evolution in Age-Structured Populations 2nd edition (Cambridge University Press).
Charlesworth, Brian (2001) “Patterns of Age-specific Means and Genetic Variances of Mortality Rates Predicted by the Mutation-Accumulation Theory of Ageing” Journal of Theoretical Biology 210, pp.47-65.
Chu, C. Y. Cyrus and Ronald Lee (2005a) “The Co-evolution of Intergenerational Transfers and Longevity: An Optimal Life History Approach”, manuscript.
Chu, C. Y. Cyrus and Ronald Lee (2005b) “Explaining the Optimality of 1 U-Shaped Age-Speci.c Mortality”, manuscript.
Fisher, R. A. (1930/1999) The Genetical Theory of Natural Selection (Oxford Univ. Press, Oxford).
Gordo, Isabel and Brian Charlesworth (2000) “The Degeneration of Asexual Haploid Populations and the Speed of Muller’s Ratchet” Genetics v.154:1379-1387.
Gurven, Michael (2004) “To Give and To Give Not: The behavioral ecology of human food transfers” Behavioral and Brain Sciences v.27, pp.543-583.
Hill, Kim and A. Magdalena Hurtado (1996) Ache Life History: The Ecology and Demography of a Foraging People (Aldine De Gruyter, New York).
Howell, Nancy (1979) Demography of the Dobe !Kung (Academic Press: New York, San Francisco and London)
Kaplan, Hillard (1994), 'Evolutionary and Wealth Flows Theories of Fertility: Empirical Tests and New Models', Population and Development Review v.20 n.4 (December) pp. 753-791.
8

Kaplan, Hillard, Michael Gurven (2005), “The Natural History of Human Food Sharing and Cooperation: A Review and a New Multi-Individual Approach to the Negotiation of Norms,” in Herbert Gintis, Samuel Bowles, Robert Boyd, and Ernst Fehr (eds.) Moral Sentiments and Material Interests: The Foundations of Cooperation in Economic Life (MIT Press, Cambridge MA and London, England) pp.75-114.
Kaplan, H. D. & Robson, A. (2002) Proc. Natl. Acad. Sci. 99, 10221-10226.
Robson, A. and Hillard S. Kaplan (2003) Amer. Econ. Rev. 93, no.1, 150-169.
Lee, Ronald (1997) “Intergenerational Relations and the Elderly,” in Kenneth W. Wachter and Caleb E. Finch, eds. Between Zeus and the Salmon: The Biodemography of Longevity (National Academy of Sciences Press), pp.212-233.
Lee, Ronald (2000) “A Cross-Cultural Perspective on Intergenerational Transfers and the Economic Life Cycle,” in Andrew Mason and Georges Tapinos, eds., Sharing the Wealth: Demographic Change and Economic Transfers between Generations (Oxford University Press, Oxford), pp.17-56.
Lee, Ronald, Hillard Kaplan, and Karen Kramer (2002) “Children and Elderly in the Economic Life Cycle of the Household: A Comparative Study of Three Groups of Horticulturalists and Hunter-Gatherers” paper presented at the 2002 annual meetings of the Population Association of America.
Lee, Ronald "Rethinking the Evolutionary Theory of Aging: Transfers, not Births, Shape Senescence in Social Species," Proceedings of the National Academy of Sciences v.100, n. 16 (August 5, 2003), pp.9637-9642.
Weiss
9
Appendix
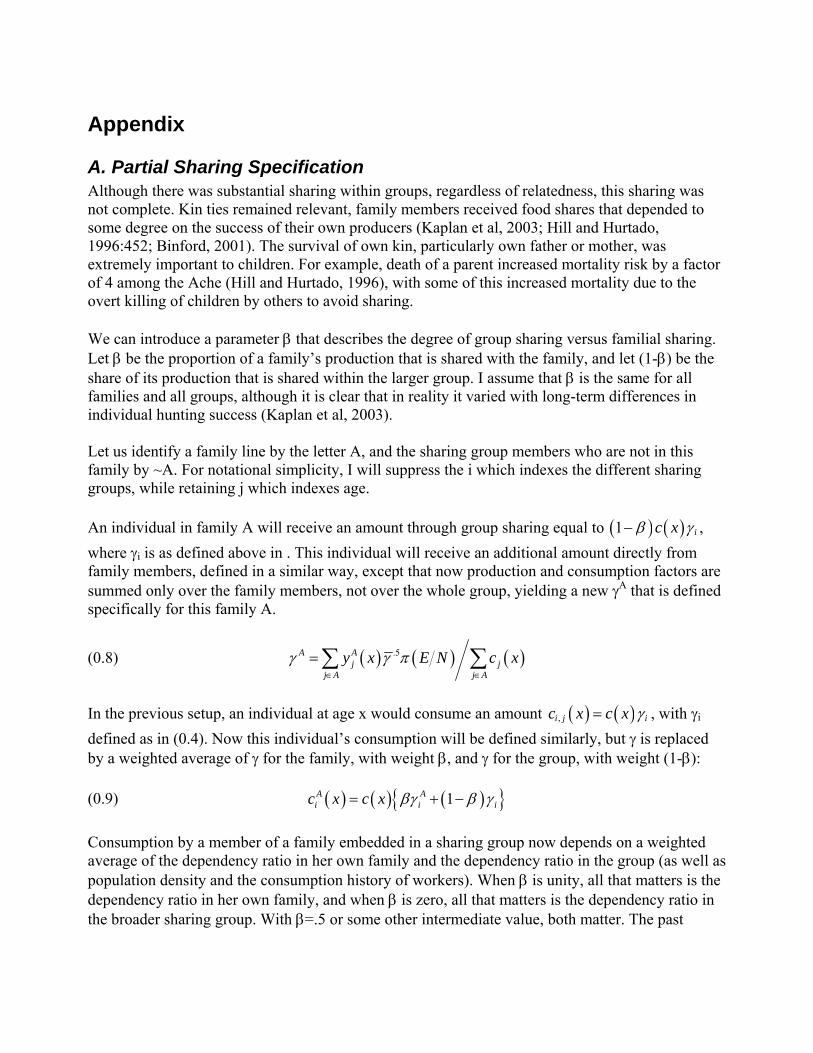
A. Partial Sharing Specification Although there was substantial sharing within groups, regardless of relatedness, this sharing was not complete. Kin ties remained relevant, family members received food shares that depended to some degree on the success of their own producers (Kaplan et al, 2003; Hill and Hurtado, 1996:452; Binford, 2001). The survival of own kin, particularly own father or mother, was extremely important to children. For example, death of a parent increased mortality risk by a factor of 4 among the Ache (Hill and Hurtado, 1996), with some of this increased mortality due to the overt killing of children by others to avoid sharing. We can introduce a parameter β that describes the degree of group sharing versus familial sharing. Let β be the proportion of a family’s production that is shared with the family, and let (1-β) be the share of its production that is shared within the larger group. I assume that β is the same for all families and all groups, although it is clear that in reality it varied with long-term differences in individual hunting success (Kaplan et al, 2003). Let us identify a family line by the letter A, and the sharing group members who are not in this family by ~A. For notational simplicity, I will suppress the i which indexes the different sharing groups, while retaining j which indexes age. An individual in family A will receive an amount through group sharing equal to ( ) ( )1 ic xβ γ− , where γi is as defined above in . This individual will receive an additional amount directly from family members, defined in a similar way, except that now production and consumption factors are summed only over the family members, not over the whole group, yielding a new γA that is defined specifically for this family A.
(0.8) ( ) ( ) ( ).5A Aj j
j A j Ay x E N c xγ γ π
∈ ∈
=∑ ∑
In the previous setup, an individual at age x would consume an amount ( ) ( ),i j ic x c x γ= , with γi defined as in (0.4). Now this individual’s consumption will be defined similarly, but γ is replaced by a weighted average of γ for the family, with weight β, and γ for the group, with weight (1-β): (0.9) ( ) ( ) ( ){ }1A A
i ic x c x iβγ β= + − γ Consumption by a member of a family embedded in a sharing group now depends on a weighted average of the dependency ratio in her own family and the dependency ratio in the group (as well as population density and the consumption history of workers). When β is unity, all that matters is the dependency ratio in her own family, and when β is zero, all that matters is the dependency ratio in the broader sharing group. With β=.5 or some other intermediate value, both matter. The past

history of consumption, as it affects production, or fertility, or mortality, will depend on the history of this weighted average.
B. Family Size, Sharing Group Size, and The Degree of Sharing Let the size of the family within which the average individual lives be F, and average group size be G, and define α=F/G. Suppose that this family carries a mutation A, hence its designation as family A. (Of course it will also carry many other mutations, but that need not concern us for the moment.) Now suppose the force of selection operating on the mutation A is rA – r~A, the difference in the associated intrinsic growth rates with the mutation and without it, for the case of pure lineages considered in Lee, 2003. Then this force will be reduced to α( rA – r~A) within the sharing group, due to the diluting effects of group sharing. The effect of age specific mortality due to mutation A on the food going to a member of this lineage is multiplied by the factor α because only a share α of the individuals at this age in the group is affected. When α is 1.0, then all members of the group are related, and no dilution of the force of selection occurs. This multiplication by the factor α has its full effect when β=0, that is when all food is shared fully in the group. However, it disappears altogether when β=1, since then there is no sharing beyond the family. More generally, I expect that the proportional reduction in the force of selection will be given by (1-α)(1-β). If α is unity, or if β is unity, then there is no reduction at all. The actual force of selection against a mutation A is given by [1 - (1-α)(1-β)]( rA – r~A). In our simulations, α is not a free parameter. Rather, it is determined by demography and the sharing rules, and it will depend largely on the size of the sharing group. β, however, can be freely varied. It will be useful to consider at least the three cases: β=0, β=1, and β=.5. We can then see how the implications for the evolution of mortality depend on the sharing rule.
C. The Elasticities of Fertility and Mortality With Respect to Food Consumption The elasticities of fertility and mortality with respect to food consumption γ are important, and results of the micro simulations vary somewhat depending on how these are set. There is no good evidence from studies of contemporary hunter gatherer groups. I turn to historical studies of the response of fertility and mortality to grain price variations in historical Europe and Asia reported in Bengtsson et al (2004), which are based on micro level studies of small areas in a number of countries. From these, I extracted a summary measure of the responses of vital rates to price variations for landless laborers, because this was the poorer group, and because the landless did not realize income increases when food prices rise since they had no food to sell. For landless laborers, averaged across age, sex, and communities, the price elasticity for mortality was approximately 2.2. This must be translated into an elasticity with respect to quantity of food consumed. If they devoted a constant amount of money to buying food of unchanging composition across types, then food consumption would vary inversely with prices with an elasticity of -1. If prices go up by 10%, food consumption goes would go down by 10%. But a) income might go down when food prices are high, because perhaps might be less to harvest, and employers of unskilled labor might cut back on employment. However, during a failed harvest it paid employers to hire labor to gather every last bit of grain, more so than during normal years, so this effect would be muted. b) Income may be reallocated within the budget toward food and away from other expenditures. c) Within food
11

expenditures, households presumably substituted cheaper calories for more expensive ones, to the extent possible, so that calories declined less than expenditures. This suggests that food intake varied less than prices, proportionately, which in turn would mean that elasticity of mortality with respect to caloric intake would be higher than the elasticity with respect to prices. d) To some degree, households will be able to forage for wild foodstuffs, which would reenforce the conclusion reached in c). From these considerations and others, it appears that elasticities of vital rates with respect to quantity of food consumed would be greater in absolute value than elasticities with respect to prices. For the simulations, I assumed an elasticity of 1.0 for fertility and -1.0 for mortality, as baseline.
D. Food Sharing Behavior From various articles on food sharing by Gurven (2002, ) I gather that about 80% of food acquired is given to others outside the nuclear family (NF). Proportions are higher for meat and honey, and lower for other items. A higher NF dependency ratio goes with a lower amount given to others, and a higher amount received from others. If this result were “perfect”, it would correspond to the equal sharing assumption within groups. In the forest, Ache share with close relatives without regard to what they themselves have received from them, in general but in relation to distant kin or non-kin, “there is strong contingency” when all kinds of food are combined. Families typically share with 2 to 3 other NFs, for a given food source (Gurven et al, 2002:113). When people are assembled in a larger group, sharing generally takes place among smaller networks of 3 or 4 NFs. Sharing is stronger among closely related individuals. In interpreting the 80% sharing figure, I note that to some extent, this is intertemporal exchange rather than sharing, as in the reciprocal altruism theory. To the extent that this is true, the 80% overstates the extent of dilution that would occur in the force of natural selection relative to the inherited characteristics of the individuals in a NF. With 75% sharing and a 33% payback (Gurven’s regression estimate), the effective sharing would be only 50%. The Kaplan and Gurven paper on a theory of time use over the life cycle shows females devoting roughly half their time to food preparation, child care, and manufacture and repair. These essential economic activities are not counted as part of the calorie based food accounts, on which the 80% sharing generalization is based. Yet they contribute importantly to making food available for consumption, and survival. Males also show some activity in these categories. If these efforts are mostly for the NF rather than shared, then a measure of sharing construed more broadly should be adjusted to reflect these unshared activities. Taking into account the first and second points, I suggest that the extent of shared productivity or energy might be put at 50% rather than 80%. Furthermore, a substantial share of that 50% would be sharing with close relatives. If the 50% rule is used in the microsimulations, then some of the 50% will go to closely related kin in the sharing group.
E. Sensitivity Tests and Experiments Table 1 describes the results of sensitivity tests and experiments. How robust are these results? I and my associates have carried out nearly 70 different simulation runs to explore the effects of altering the assumptions. Given the complexity of the setup, and the length of time it takes to complete a simulation, many questions remain unexplored and unanswered, but much has been learned. Here are some tentative conclusions, drawing on the experiments described in Table 2.
1. Universal sharing: When food sharing takes place through pooling of all output at the level of the aggregate population of about 100,000, then the results collapse to the Hamilton
12
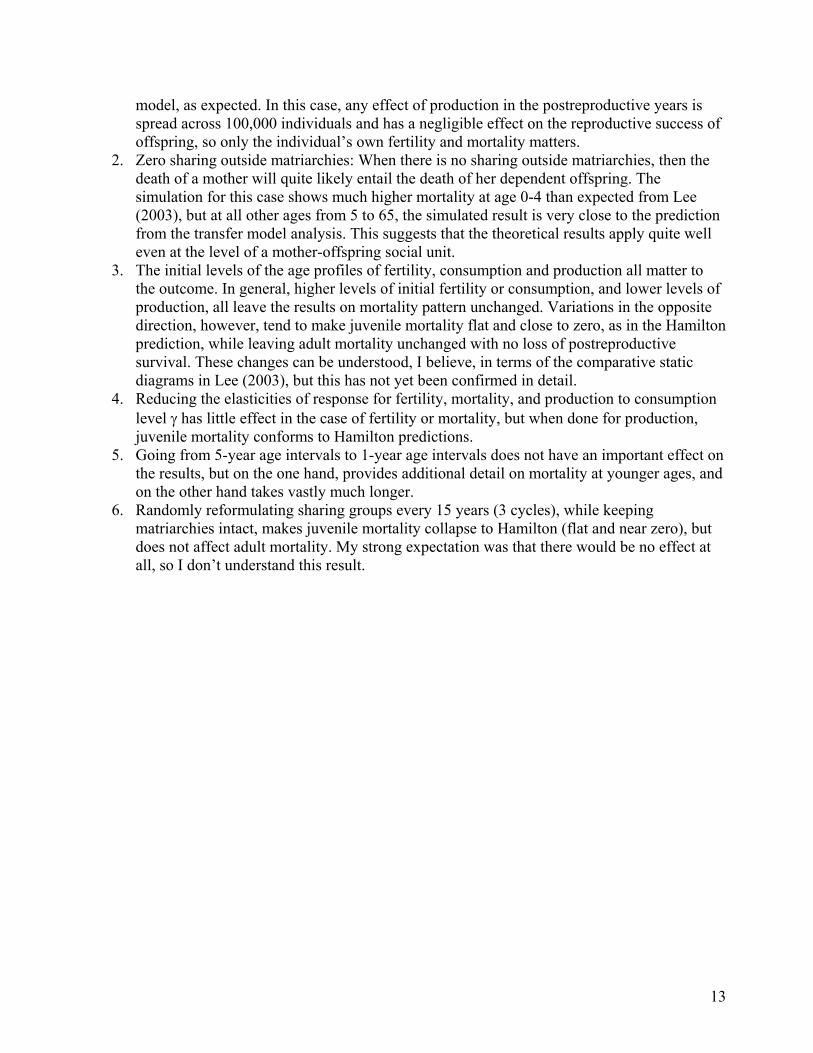
model, as expected. In this case, any effect of production in the postreproductive years is spread across 100,000 individuals and has a negligible effect on the reproductive success of offspring, so only the individual’s own fertility and mortality matters.
2. Zero sharing outside matriarchies: When there is no sharing outside matriarchies, then the death of a mother will quite likely entail the death of her dependent offspring. The simulation for this case shows much higher mortality at age 0-4 than expected from Lee (2003), but at all other ages from 5 to 65, the simulated result is very close to the prediction from the transfer model analysis. This suggests that the theoretical results apply quite well even at the level of a mother-offspring social unit.
3. The initial levels of the age profiles of fertility, consumption and production all matter to the outcome. In general, higher levels of initial fertility or consumption, and lower levels of production, all leave the results on mortality pattern unchanged. Variations in the opposite direction, however, tend to make juvenile mortality flat and close to zero, as in the Hamilton prediction, while leaving adult mortality unchanged with no loss of postreproductive survival. These changes can be understood, I believe, in terms of the comparative static diagrams in Lee (2003), but this has not yet been confirmed in detail.
4. Reducing the elasticities of response for fertility, mortality, and production to consumption level γ has little effect in the case of fertility or mortality, but when done for production, juvenile mortality conforms to Hamilton predictions.
5. Going from 5-year age intervals to 1-year age intervals does not have an important effect on the results, but on the one hand, provides additional detail on mortality at younger ages, and on the other hand takes vastly much longer.
6. Randomly reformulating sharing groups every 15 years (3 cycles), while keeping matriarchies intact, makes juvenile mortality collapse to Hamilton (flat and near zero), but does not affect adult mortality. My strong expectation was that there would be no effect at all, so I don’t understand this result.
13


Table 2. Simulation Experiments Aspect of Simulation
Variation Outcome
Fertility initial level
Vary the initial fertility schedule by factors ranging from .4 to 1.5. Alters slope and position of the renewal curve.
Alters equilibrium mortality, alters Muller’s ratchet, affects infant mort.
Fertility γ elasticity
Reduce to .4 Still get U shape, but mutation frequencies much higher, probable Ratchet effect
Mortality γ elasticity
Reduce to -.4 No apparent change in mortality shape
Extrinsic Mortality
Add extrinsic mortality of .02 at every age; same with .033
U shape unchanged, but equilibrium at higher fertility and mortality.
Periodic Mortality crises
50% of population killed off randomly every 15, 25, 50 or 100 years in different experiments
U-shaped preserved with postreproductive survival, but shape becomes more erratic.
Production γ elasticity
Reduce to .4 Juvenile mortality becomes flat, post reproductive survival is maintained
Density elasticity
Increase or decrease As expected, no effect on equilibrium mortality
Consumption initial level
Set at half or twice baseline level in separate experiments.
Twice makes no difference. Half leaves juvenile pattern unchanged, but almost eliminates post reproductive survival.
Production initial level
Set at half or twice baseline level in separate experiments.
Result is inverse of consumption level experiments. Half makes no difference, while twice almost eliminates postreproductive survival.
Sharing None outside matriarchies Juvenile mort slope very steep, adult maintained.
Sharing Complete at aggregate population level, total pooling of output for all 100,000
Collapses to Hamilton, as expected.
Age-time unit Single years of age and time, mutation rate reduced to .004, lethality at .1, 32K years
U shaped mortality, post reproductive survival, rather similar
Group Formation
Randomly reformulate groups every three cycles (15 years) keeping families together
Juvenile mortality flat, postreproductive survival continues but diminished. Unexpected result.
15
Production and Consumption by Age for the Average of Three Amazonian Hunter-gatherer Groups (Daily Calories)
0
1000
2000
3000
4000
5000
6000
7000
8000
0 10 20 30 40 50 60 70
Age
Cal
orie
s
Production
Consumption
Source: Calculated from Kaplan (1994), see Lee (2000).
Figure 1

Figure 2

Mean size of matriarchy is 1.93
Figure 3

Mean size of matriarchy in which individual lives is 2.40
Figure 4
70-74
65-69
60-64
Various 0-59
Figure 5
Multiply age by 5 for start of age group
Cycle number of simulation (x5=years)
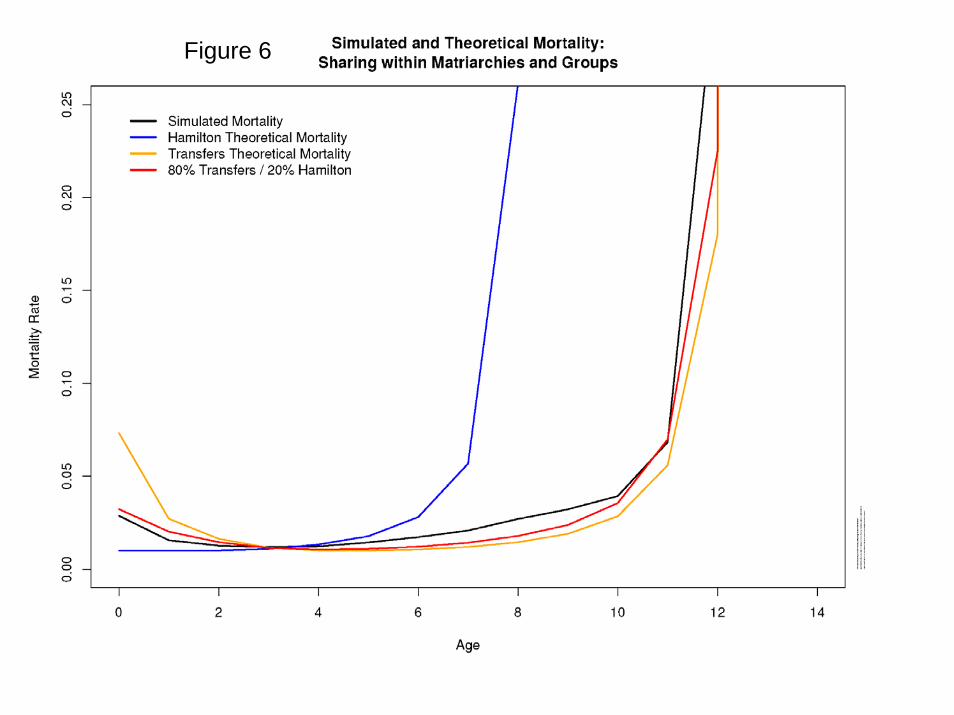
Figure 6

Figure 7. Mutation Frequency at Age 70-74: Muller’s Ratchet
Number of mutations per individual
Number of individuals with given number of mutations

Figure 8. Number of Deleterious Mutations Affecting Age 20-24
Cycle number of simulation (x5=years)
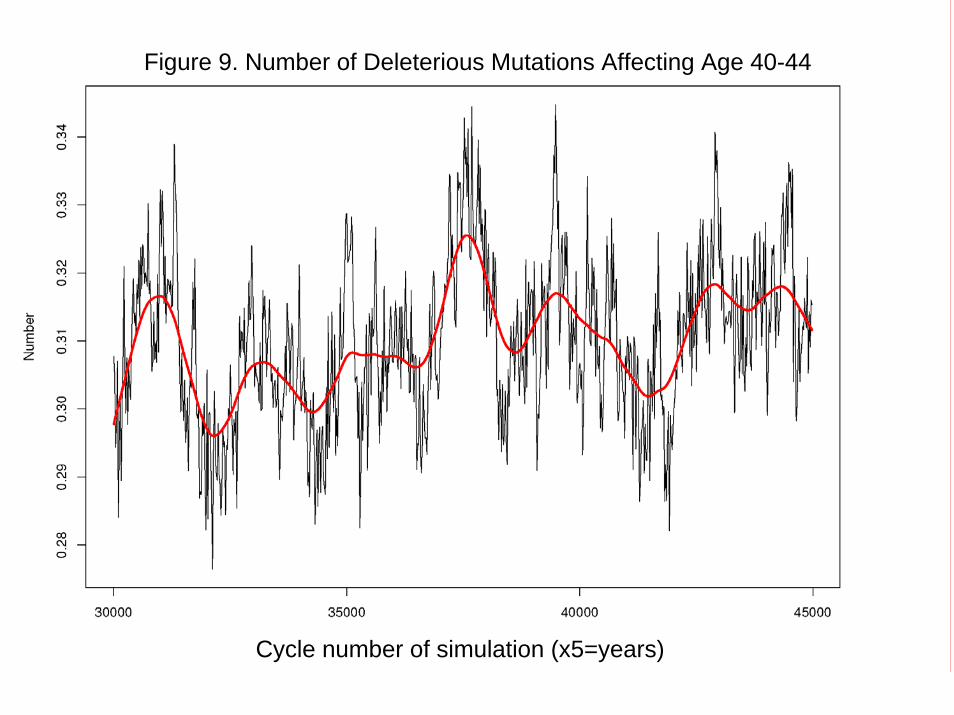
Figure 9. Number of Deleterious Mutations Affecting Age 40-44
Cycle number of simulation (x5=years)

Figure 10. Average Relative Consumption, Gamma
Cycle number of simulation (x5=years)

Figure 11. Aggregate Population Size
Cycle number of simulation (x5=years)

Figure 12. Production and Consumption After 45,000 Cycles (per surviving individual at each age)
Age group (x5=start of age interval)