intergovernmental fiscal transfers in asia: current ... and... · 34 tahun 2000 tentang perubahan...
TRANSCRIPT

Intergovernmental Fiscal Transfers in Asia: Current Practice and Challenges for the Future Edited by: Paul Smoke and Yun-Hwan Kim Manila: Asian Development Bank December 2002.

138 Intergovernmental Fiscal Transfers in Asia
5Indonesia
Blane D. Lewis1
Research Triangle Institute, Research Triangle Park,North Carolina, USA
A. Introduction
The Republic of Indonesia is the fourth largest country in the world witha population of over 200 million people. It is an extremely socially and cultur-ally varied nation: there are more than 300 ethnic groups, each with its ownlanguage, customs, and form of social organization.2 Population and attendantsocial, political, and economic activities are dispersed across a collection ofnearly 14,000 islands, spanning more than 3,000 miles.
Indonesia is a unitary country comprising central, provincial, and locallevels of government. Until recently, the regional administration of publicaffairs operated via a hierarchical, multitiered, and parallel system of decon-centrated central government agencies and nominally autonomous subnationalunits. Throughout most of its history, Indonesia’s public sector has been countedamong the most centralized in the world.3
Many observers would date Indonesia’s modern administrative and fis-cal decentralization program to Law No. 5 of 1974.4 And this law did indeedprovide a basis for a greater involvement of decentralized subnational govern-ments in the provision of public services that existed until that time. Althoughin the early 1990s some implementing regulations were written and a pilot
1. The author currently serves as Senior Adviser to the Ministry of Finance (MOF)under a project financed by the United States Agency for International Development(USAID). The views expressed here are those of the author and should not be attributedto either MOF or to the USAID.
2. Guinness (1994).3. See Smoke and Lewis (1996) for a review of the intergovernmental fiscal
framework prior to decentralization and a description of earlier decentralization efforts.4. The legal basis for decentralization existed prior to that law. See Ford (2000) for
a brief review of the constitutional and other early legal underpinnings of decentralization.

Indonesia 139
program for regional autonomy was undertaken,5 little real progress was madein operationalizing the general principles outlined in the early legislation overthe succeeding 25 years.
Decentralization became more of a political imperative in the late 1990s.The impetus to move forward in a more assertive fashion derived from a spe-cial session of the Peoples Consultative Assembly (MPR) with the issuance ofan important decree.6 As a result of the MPR mandate, Indonesia has embarkedupon an ambitious program of fiscal decentralization. The effort has its genesisin two laws, both promulgated in May of 1999, one on administrative mattersand the other concerning fiscal and finance issues.7 These two laws have beenfollowed up with a large number of implementing regulations and presidentialand ministerial decrees.
As a consequence of the recent legislation, the deconcentrated agenciesof central government have, for the most part, been abolished8 (although prov-inces continue to represent the center in certain instances) and the hierarchicalrelationship between autonomous provincial and local governments has beeneliminated. For the first time, governors (of provinces) and mayors (of localgovernments) are elected by and accountable to regional parliaments.9
In addition, starting in FY2001, provincial and local governments as-sumed major new expenditure responsibilities. Substantial functions for prov-inces have been outlined in a recently issued government regulation.10 Localgovernment (kabupaten/kota) responsibilities, regrettably, have been only rathervaguely defined via a negative list; that is, kabupaten and kota essentially are
5. See Beier and Ferrazzi (1998) for a description of the pilot program, amongother things.
6. MPR Decree No. XV of 1998 regarding the Implementation of RegionalAutonomy: A Just Regulation: Division and Utilization of National Resources and theBalancing of Central-Regional Finances within the Unitary Republic of Indonesia.
7. See Law 22/1999 regarding Regional Administration (Undang-Undang 22/1999 tentang Pemerintahan Daerah) and Law 25/1999 regarding Financial Balancebetween the Center and Regional Governments (Undang-Undang 25/99 tentangPerimbangan Keuangan antara Pemerintah Pusat dan Daerah).
8. Deconcentrated offices may continue to operate in the regions, where rel-evant, for those functions that the central government retains: foreign affairs, defense,justice, monetary and fiscal affairs, and religion, among others.
9. As of this writing, there are 348 kabupaten/kota and 30 provinces in Indone-sia. Kabupaten is generally translated as regency or district and kota means city.
10. See Government Regulation 25/2000 regarding Central Government Authori-ties and Autonomous Provincial Government Authorities (Peraturan Pemerintah No.25 Tahun 2000 tentang Kewenangan Pemerintah dan Kewenangan Propinsi sebagaiDaerah Otonom).

140 Intergovernmental Fiscal Transfers in Asia
responsible for all public services that the central and provincial governmentsare not explicitly charged with delivering.
At the same time, the law has highlighted 11 important areas of localgovernment service responsibility: public works, health, education and culture,agriculture, communications, industry and trade, capital investment, environ-ment, land, cooperatives, and labor. This list makes up the so-called obligatoryauthorities of kabupaten/kota governments. As is clear, most of the items onthis list are perhaps more analogous to sectors than they are functions per se. Assuch, it has been widely assumed that central and/or provincial governmentsmust retain at least some responsibility for service delivery in the designatedareas. This general approach to the assignment of local public services hasgenerated confusion among concerned parties at both the central and regionallevels. In any case, regional government expenditure responsibilities are nowevidently considerable. In FY2001, for example, it was estimated that subnationalgovernments made up around one-quarter of total public spending.11
Regional governments have not, unfortunately, been awarded new au-thority over any major tax bases. Subnational governments, as a whole, retainthe right to levy essentially the same taxes and charges as before the new de-centralization legislation took effect, although the distribution of tax bases acrossprovinces and kabupaten/kota have been restructured to a certain extent. Prov-inces have at least some authority over taxes related to motor vehicles, changeof title of motor vehicles, fuel, and ground water extraction and use (the latterbeing formerly under the control of kabupaten/kota). Tariffs over these taxesare set at uniform rates across the country by the central government. Localgovernments exercise control over taxes concerning hotels, restaurants, enter-tainment, advertisement, street lighting, some (class C) mineral exploitation,and parking (newly created). Kabupaten/kota control the tax rates below cen-trally specified ceilings.12 Both provinces and kabupaten/kota may collect usercharges and fees of various sorts.
In addition, kabupaten/kota (but not provinces) are now allowed tocreate their own taxes through local bylaws, if they satisfy a number of goodtax criteria and central government approval.13 As it turns out, both local
11. The subnational share of total public sector spending reaches nearly 35% ifcentral government debt service payments are ignored. See Ministry of Finance (2002).
12. By law, provinces must share 30% of the motor vehicle-based taxes and 70%of the fuel and ground water taxes with kabupaten/kota. The latter must share 10% oftheir total own-source tax revenues with villages. See Law 34/2000 regarding Changesto Law 18/1997 regarding Regional Government Taxes and Charges (Undang-Undang34 Tahun 2000 tentang Perubahan atas Undang-Undang 18 Tahun 1997 tentang PajakDaerah dan Retribusi aerah) for the details.
13. Again, see Law 34/2000.

Indonesia 141
governments and the center have very broadly interpreted these criteria.Kabupaten/kota have set about creating new taxes in a rather aggressive fash-ion. Some observers have judged most of the newly created taxes to be eithernuisances or economically harmful in some way.14 Nevertheless, the centralgovernment has done little to forestall the rapid formation of these new localrevenue instruments. The new local taxes notwithstanding, public revenuesapparently remain heavily centralized in Indonesia. Recent estimates put thesubnational government share of total national revenues at only around 4%.15
As part of the new decentralization initiative, the system of intergovern-mental transfers has also been significantly restructured and expanded. Regionalgovernments now gain greater access to substantial amounts of natural resourcerevenues than before and, in addition, receive a share of the personal incometax. Furthermore, two new and important intergovernmental grants have beencreated: Dana Alokasi Umum (DAU—General Purpose Fund) and Dana AlokasiKhusus (DAK—Specific Purpose Fund). These two transfers together replacethe old system of Subsidi Daerah Otonom (SDO—Autonomous GovernmentSubsidy) and Instruksi Presiden (INPRES—Presidential Instruction) grants.16
The basic purpose of this chapter is to review the emerging system ofintergovernmental transfers in Indonesia. After the introduction, we provide abrief appraisal of transfers that existed before the country’s new decentraliza-tion program began implementation. Next, we examine the current scheme ofintergovernmental transfer mechanisms. As noted above, the new system com-prises an array of revenue sharing and general- and specific-purpose grant in-struments. In this section of the chapter, each of the various types of transfers isdescribed and analyzed. Some of the more important emerging problems withthe system are highlighted throughout. The chapter closes with a summaryof the principal points and offers some policy recommendations for improvingthe system of intergovernmental transfers in Indonesia.
B. Intergovernmental Transfers in Indonesia before Decentralization
Prior to the implementation of the new decentralization legislation, inter-governmental transfers in Indonesia comprised a limited amount of revenue
14. See Ray (2001) for an inventory of such tax instruments that are trade-distorting.
15. Ministry of Finance (2002).16. It should be mentioned that, in addition to the decentralization initiatives
briefly catalogued here, the government has also structured special autonomy arrange-ments with the provinces of Aceh and Irian Jaya. The measures taken have awardedmore responsibility and fiscal resources to the two provinces than to other places inIndonesia. These special provisions are not further discussed in this paper.

142 Intergovernmental Fiscal Transfers in Asia
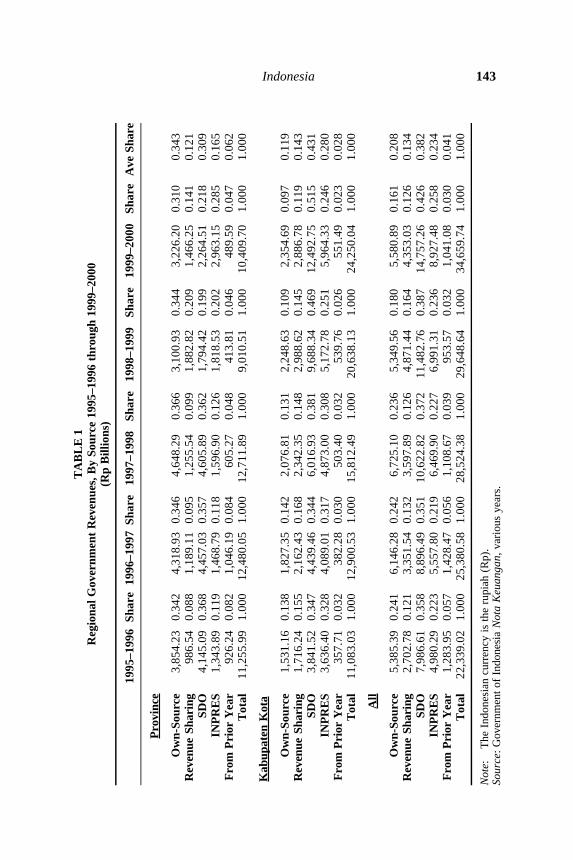
sharing as well as significant routine and development grants. Shared propertytaxes accounted for most of total revenue sharing, although shared forestryrevenues (forestry licensing fees and royalties) were also occasionally impor-tant over the years. Other national revenues, for example, from mining (landrents and royalties) and/or from clove and copra (cesses) were also at timesshared with regional governments but not consistently and the amounts wererelatively insignificant. The SDO was the basic routine-side grant for morethan 30 years prior to FY2001 when it was disbanded. Development grantsover the past three decades comprised a vast and, at times, bewildering array ofgeneral- and special-purpose INPRES transfers.17
For an illustration of the relative importance of these various transfers inregional government budgets, see Table 1 which provides aggregate data onown-source revenues, shared revenues, and grants for regional governments, intotal, and for provincial and kabupaten/kota governments over the period 1995–1996 through 1999–2000. The table demonstrates the overall importance oftransfers to regional government budgets. Transfers made up about 75% oftotal regional government revenues, on average, over the period, including justless than 60% of provincial and approximately 85% of kabupaten/kota rev-enues. SDO transfers were most important, in general (38% of total regionalgovernment revenues), and for both provinces (31%) and kabupaten/kota (43%),followed by INPRES (23% of total regional government revenues and 6% and28% of provincial and kabupaten/kota revenues, respectively) and revenue shar-ing (13% of total subnational revenues and 12% and 14% of total revenues forprovinces and kabupaten/kota).
Property taxes, the dominant form of revenue sharing until recently, un-derwent relatively little change in structure, administration, distribution, anduse over the years since 1985. The latter is the year in which the current andprincipal property-related tax, PBB (Pajak Bumi dan Bangunan),18 was createdand replaced the then large number of land and building taxes. Since that time,property taxes have been levied in five different sectors: rural, urban, estates,forestry, and mining. Property taxes were and continue to be administered andcollected, for the most part, by central government, although local governmentsassist with collections in rural and urban sectors. Until just recently, the centralgovernment retained 10% of the total tax for its own use, 9% was provided tolocal tax offices to assist with collections, 16% was assigned to provincial gov-ernments, and 65% was distributed to local governments. Regional shares were
17. See Shah and Qureshi (1994) for an early and comprehensive descriptionand discussion of intergovernmental transfers in Indonesia.
18. The other property related tax is the Bea Perolehan Hak atas Tanah danBangunan (BPHTB). The BPHTB is a tax on the transfer of title on land and buildings.
Indonesia 143T
AB
LE
1R
egio
nal
Gov
ernm
ent
Rev
enue
s, B
y So
urce
199
5–19
96 t
hrou
gh 1
999–
2000
(Rp
Bill
ions
)
199
5–19
96Sh
are
1996
–199
7Sh
are
1997
–199
8Sh
are
1998
–199
9Sh
are
1999
–200
0Sh
are
Ave
Sha
re
Pro
vinc
e
Ow
n-So
urce
3,85
4.23
0.34
24,
318.
930.
346
4,64
8.29
0.36
63,
100.
930.
344
3,22
6.20
0.31
00.
343
Rev
enue
Sha
ring
986.
540.
088
1,18
9.11
0.09
51,
255.
540.
099
1,88
2.82
0.20
91,
466.
250.
141
0.12
1SD
O4,
145.
090.
368
4,45
7.03
0.35
74,
605.
890.
362
1,79
4.42
0.19
92,
264.
510.
218
0.30
9IN
PR
ES
1,34
3.89
0.11
91,
468.
790.
118
1,59
6.90
0.12
61,
818.
530.
202
2,96
3.15
0.28
50.
165
Fro
m P
rior
Yea
r92
6.24
0.08
21,
046.
190.
084
605.
270.
048
413.
810.
046
489.
590.
047
0.06
2T
otal
11,2
55.9
91.
000
12,4
80.0
51.
000
12,7
11.8
91.
000
9,01
0.51
1.00
010
,409
.70
1.00
01.
000
Kab
upat
en K
ota
Ow
n-So
urce
1,53
1.16
0.13
81,
827.
350.
142
2,07
6.81
0.13
12,
248.
630.
109
2,35
4.69
0.09
70.
119
Rev
enue
Sha
ring
1,71
6.24
0.15
52,
162.
430.
168
2,34
2.35
0.14
82,
988.
620.
145
2,88
6.78
0.11
90.
143
SDO
3,84
1.52
0.34
74,
439.
460.
344
6,01
6.93
0.38
19,
688.
340.
469
12,4
92.7
50.
515
0.43
1IN
PR
ES
3,63
6.40
0.32
84,
089.
010.
317
4,87
3.00
0.30
85,
172.
780.
251
5,96
4.33
0.24
60.
280
Fro
m P
rior
Yea
r35
7.71
0.03
238
2.28
0.03
050
3.40
0.03
253
9.76
0.02
655
1.49
0.02
30.
028
Tot
al11
,083
.03
1.00
012
,900
.53
1.00
015
,812
.49
1.00
020
,638
.13
1.00
024
,250
.04
1.00
01.
000
All
Ow
n-So
urce
5,38
5.39
0.24
16,
146.
280.
242
6,72
5.10
0.23
65,
349.
560.
180
5,58
0.89
0.16
10.
208
Rev
enue
Sha
ring
2,70
2.78
0.12
13,
351.
540.
132
3,59
7.89
0.12
64,
871.
440.
164
4,35
3.03
0.12
60.
134
SDO
7,98
6.61
0.35
88,
896.
490.
351
10,6
22.8
20.
372
11,4
82.7
60.
387
14,7
57.2
60.
426
0.38
2IN
PR
ES
4,98
0.29
0.22
35,
557.
800.
219
6,46
9.90
0.22
76,
991.
310.
236
8,92
7.48
0.25
80.
234
Fro
m P
rior
Yea
r1,
283.
950.
057
1,42
8.47
0.05
61,
108.
670.
039
953.
570.
032
1,04
1.08
0.03
00.
041
Tot
al22
,339
.02
1.00
025
,380
.58
1.00
028
,524
.38
1.00
029
,648
.64
1.00
034
,659
.74
1.00
01.
000
Not
e:
The
Ind
ones
ian
curr
ency
is th
e ru
piah
(R
p).
Sour
ce: G
over
nmen
t of
Indo
nesi
a N
ota
Keu
anga
n, v
ario
us y
ears
.

144 Intergovernmental Fiscal Transfers in Asia
and continue to be, for the most part, distributed on a derivation basis. Use ofshared property taxes has been completely at the discretion of regional govern-ments since 1985 to the present.19
The major concern with the property tax over the years pertains to itsshared nature. While in most countries the property tax is an important local tax(arguably for good reasons related to adequacy, efficiency, fairness, and ac-countability), in Indonesia it has steadfastly remained under the control of cen-tral government. Proposals for decentralizing the property tax have been madeand reviewed frequently over the last 15 years and the central government isnow, yet again, considering partial decentralization (i.e., control over the effec-tive tariff) of property-related taxes to local governments.
The SDO grant was also altered relatively little since its inception over30 years ago until it was dropped in FY2001. The SDO grant was not actuallya single grant but a compilation of transfers. The most important component ofSDO funding was for regional government employee remuneration and it cov-ered almost the entire amount of regional civil servant salaries and allowances,including those of primary school teachers. Other smaller components of theSDO funded various additional regional government routine expenditures, in-cluding the operations and maintenance of school buildings, and sub-kabupaten/kota (i.e. kecamatan and village) administrative expenditures. Central govern-ment allocation of the SDO was based, for the most part, on the number andyears of experience of regional civil servants in various job classifications.Regional governments tended to take the lead on recruiting staff, although thecenter had responsibility for officially approving regional staffing levels, ingeneral, and additions to such, in particular. It appears that the central govern-ment did not always make a serious attempt to discern real staffing needs, how-ever, and regional proposals for additional staff were often approved in a proforma manner.20
Many observers have found the SDO to be little more than an instrumentof central control over regional governments. It is certainly clear that the grantdid little to directly promote the autonomy of regional governments. At thevery least, SDO operations made civil servants appear to be “free goods” to theregional governments for whom they worked. As such, the grant offered littlein the way of incentives for regional expenditure efficiency.21
INPRES grants changed a great deal in structure and function over thelast three decades until their recent demise. INPRES started out in the late 1960s
19. See Kelly (1993) for an early description of property taxes in Indonesia.20. See Rohdewohld (1995) for a good description of central and regional gov-
ernment civil service as it existed prior to FY 2001.21. See Davey (1989) for an early discussion of the SDO.

Indonesia 145
as a rather simple block grant but, by the late 1990s, the transfer had evolvedinto a fairly complicated system of general- and specific-purpose grants. Whilethe size of general-purpose component of the system grew quite quickly duringthe last decade of INPRES existence, the number of specific-purpose grantsalso multiplied rapidly, and growth of associated funds outstripped increases inthe block element. By the time INPRES grants were dissolved, there were atleast 15 different specific-purpose transfers, including those for primary schools,primary health care, roads, other urban infrastructure, urban re-greening, agri-cultural extension, and environmental impact assessment. By FY2000, fundsattendant to specific-purpose transfers were well over twice as large as thosefor the general-purpose grant.
Overall, most analysts seem to have concluded that the INPRES systemhad a relatively positive impact on regional social and economic developmentin Indonesia over the course of more than three decades.22 At least the fundsassisted in the development of a significant amount of regional infrastructure.These positive points notwithstanding, a number of important criticisms havebeen raised over the years, particularly with regard to the system’s generalcomplexity and specific lack of transparency in allocation procedures, exces-sive central control and attendant lack of support for regional autonomy, lackof incentives for revenue mobilization, and negative performance vis-à-vis equal-ization objectives, among others.23
At least partly as a result of the various criticisms noted above, the Indo-nesian system of intergovernmental transfers has now been significantlyredesigned. The new structure of transfers between central and regional gov-ernments is described and examined in the next section.
C. The Current System of Intergovernmental Transfers in Indonesia
Transfers in Indonesia continue to comprise both revenue sharing andgrant instruments. Revenue sharing now includes shares of property-relatedtaxes, natural resource revenues, as well as income tax, and grants consist of asingle grant mechanism each for general- and specific-purposes. Transfers, ingeneral, remain highly significant sources of revenue for regional governments.In fact, they have grown even more important to regional budgets than theywere prior to decentralization. Data for FY2001 show that all transfers togetheraccounted for just less than 90% of total regional government revenues.
22. See Shah and Qureshi (1994) for a largely positive evaluation of INPRESgrants.
23. Schroeder (1995) discusses some of these less positive features of the oldINPRES system.

146 Intergovernmental Fiscal Transfers in Asia
Table 2 details the relative importance of the various types of transfers,along with own-source revenues, in provincial and kabupaten/kota budgets forFY2001. As can be seen from the table, the DAU is far the most importantsource of revenue for regional governments, funding almost two-thirds ofsubnational government budgets. Revenue sharing is not unimportant, how-ever, and it makes up more than one-fifth of regional government financialresources. Own-source revenues remain the smallest source of funds for re-gional governments and account for just over 10% of total regional govern-ment revenues. We now turn to an examination of revenue sharing and grantmaking in the new decentralized environment in Indonesia.
TABLE 2Estimated Regional Government Revenues, FY 2001
(Rp Billions)
Source Provinces Percent Kab/Kota Percent Total Percent
Own-Source Revenues 6,400 34.5 4,100 5.6 10,500 11.4Total Revenue Sharing 5,928 31.9 14,792 20.0 20,720 22.4Property-Related Taxes 2,252 12.1 3,812 5.2 6,064 6.6Natural Resource Revenues 2,565 13.8 9,312 12.6 11,877 12.8Personal Income Tax 1,111 6.0 1,667 2.3 2,779 3.0DAU 6,238 33.6 54,279 73.5 60,517 65.5DAK n.a n.a 701 0.9 701 0.8Total Transfers 12,166 65.5 69,772 94.4 81,938 88.6Grand Total 18,566 100.0 73,872 100.0 92,438 100.0
Source: Based on Lewis (2001).
1. Revenue Sharing
As noted above, there are currently three types of revenue sharing inIndonesia. Shared sources include those for property-related taxes, natural re-source revenues, and the income tax. Property-related shares comprise those forthe land and buildings tax and the transfer of title on land and buildings tax. Thereare now eight natural resource revenue-sharing instruments: two each for for-estry, mining, and fisheries along with those for oil and natural gas. The incometax shares are derived from the personal (as opposed to the business) income tax.
As demonstrated in Table 2, shared revenues account for about 22% oftotal regional government revenues. In general, the most important shared rev-enues are those derived from natural resources (13% of total regional revenues),followed by those for property taxes (7%) and then personal income taxes (3%).The relative significance of the various instruments varies across provinces andkabupaten.

Indonesia 147
Shared revenues are distributed across regional governments by variousmeans. Table 3 lists revenue-sharing instruments along with the methods bywhich the shared sources are allocated across provinces and kabupaten/kota.As can be seen from the table, all shares to provinces are allocated exclusivelyby derivation. Shared revenues are distributed to kabupaten/kota both by deri-vation and, not infrequently, in equal amounts across places.
As previously indicated, property-related taxes have been shared withregional governments in Indonesia for many years now. As can be seen fromthe table, now all property tax revenues, including central shares are, in theevent, distributed to regional governments (with the exception of 9% for col-lections). At least several of the natural resource revenues had already beenshared with regional governments as well prior to FY2001, especially thoserelated to forestry and mining, although sharing arrangements have been re-vised in many instances. The shared revenues for fisheries, oil, gas, and per-sonal income taxes are new, however.
The main objective of revenue sharing, especially that related to newlyshared revenues, is to respond to regional aspirations for increased access toand control over certain revenues. As is well known, many regions in Indonesiahave long felt that they have not benefited sufficiently from the significantrevenues generated in their areas and these sharing schemes constitute a realattempt to meet these demands. One problem with the attainment of this objec-tive is that many in the regions remain unconvinced that they are getting theirfair share of revenues in question. This is in part because the central gov-ernment calculation of amounts of revenue to be shared is done in a less-than-transparent manner, and the regions suspect dishonest practices. Anotherproblem concerns the timing of distribution to the regions. Although such trans-fers should, according to law, be made quarterly, in FY2001, the first paymentson natural resource revenues were not made until July.
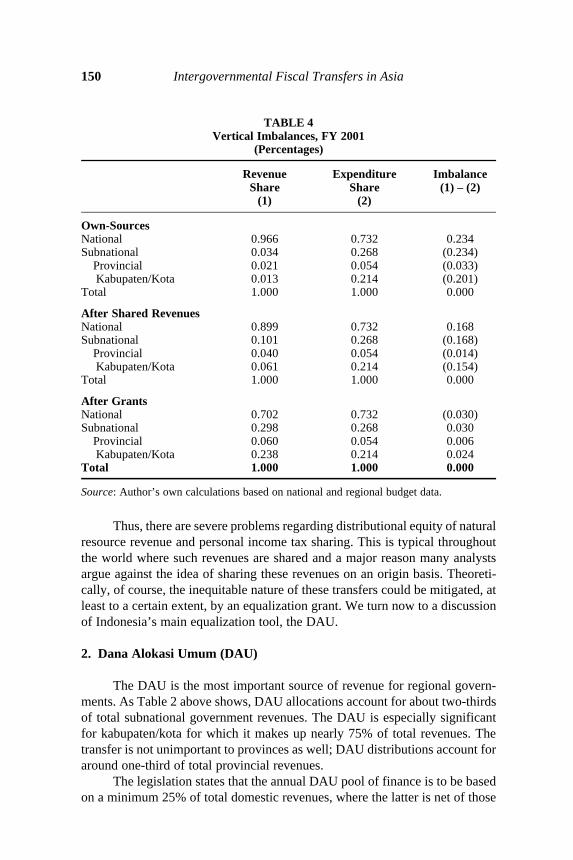
Revenue sharing is also intended to address fiscal imbalances betweenthe central and regional governments. To what extent has revenue sharing beenable to address such vertical imbalances? A somewhat naive, but typical, ap-proach to the analysis of this question is to compare expenditure shares of centraland subnational governments to their revenue shares before and after transfers.Before transfers, of course, subnational governments typically experience defi-cits. To the extent that deficits are reduced by adding transfers, then verticalimbalances are ameliorated.24 Table 4 provides some pertinent information onvertical imbalances for Indonesia for FY2001.
As the table shows, before transfers are made, subnational governments
24. See Shah (1994) for a discussion of vertical imbalances and the presentationof some evidence on the same for a number of developing and developed countries.

148 Intergovernmental Fiscal Transfers in Asia
TABLE 3Revenue-Sharing Instruments and Distribution, Starting FY 2001
Shared Revenue Central Share Provincial Share Local Share
Property Tax. 10%. Distributed to 16.2%. By 64.8%. By derivation(PBB: Pajak Bumi kabupaten/kota: 6.5% derivation. (except oil and gasdan Bangunan) in equal amounts sectors)a
across all localities and 3.5% to places based on their attainment ofprevious year’s (urbanand rural) PBB target.
Property Title 20%. Distributed to all 16%. By 64%. By derivation.Transfer Tax. kabupaten and kota in derivation.(BPHTB: Bea equal amounts.Perolehan Hakatas Tanah danBangunan)
Forestry Right to 20% 16%. By 64%. By derivation.Operate Levy. derivation.(IHPH: IuranHak PengusahaanHutan)
Forestry Resources 20% 16%. By 32% by derivation;Commission. derivation. 32% in equal(PSDH: Provisi amounts across allSumber Daya localities withinHutan) province.
Mining Sector 20% 16%. By 64%. By derivation.Land Rent. PIT: derivation.(Penerimaan IuranTetap)
Mining Sector 20% 16%. By 32% by derivation;Royalties. (PIE: derivation. 32% in equalPenerimaan Iuran amounts (for allEksplorasi dan places withinExploitasi) province).
Tax Revenue on 20% 0% 80%. Equal amountsFisheries Operations. for all kabupaten and(Penerimaan kota in country.PungutanPengusahaanPerikanan)

Indonesia 149
are in substantial deficit (23.4%). Vertical imbalances are less severe for prov-inces (deficit of 3.3%) than for kabupaten and kota (deficit of 20.1%). After theaddition of shared revenues, the overall subnational deficit is narrowed to 16.8%and the deficits for provinces and kabupaten are reduced to 1.4% and 15.4%,respectively. Remaining fiscal imbalances at the subnational level are com-pletely removed by the distribution of grants. In fact, as the table shows,subnational governments experience a surplus balance after the transfer of DAUand DAK and the central government moves to a deficit position. More will besaid below about this implied overallocation of grants.
While helpful in addressing aggregate vertical fiscal imbalances, a realand well-known problem with natural resource revenue and personal incometax sharing in Indonesia is that such revenues are distributed very unevenlyacross regions. According to Ministry of Finance data, over 50% of the per-sonal income tax shares, for example, are allocated to Jakarta alone. And over75% of the total natural resource revenues shared with kabupaten/kota are dis-tributed to just 30 places in Aceh, Riau, and Kalimantan Timur; similarly, thesethree places account for three quarters of the natural resource shares allocatedto provinces as well.
TABLE 3 (cont.)
Shared Revenue Central Share Provincial Share Local Share
Tax Revenue on 20% 0% 80%. Equal amountsFisheries Output. for all kabupaten(Penerimaan and kota in country.Pungutan HasilPerikanan)
Oil Revenues. 85% 3%. By 6% by derivation;(Minyak) derivation. 6 % in equal amounts
(within province).
Natural Gas 70% 6%. By 12% by derivation;Revenues. (Gas derivation. 12% in equalAlam) amounts (within
province).
Personal Income 80% 8%. By taxpayer 12%. Distribution byTax. (PPh: Pajak location.b provincial choice.Penghasilan)
Notes: a Remaining 9% of property tax revenues reserved for support of tax collectionscarried out by central and local governments.
b Taxpayer location, according to the legislation, may be employee residence, placeof business activity, or employer home office location. In practice, it appears,most often, to be the latter.
Source: Government Regulation 104/2000 and Law 17/2000.
150 Intergovernmental Fiscal Transfers in Asia
Thus, there are severe problems regarding distributional equity of naturalresource revenue and personal income tax sharing. This is typical throughoutthe world where such revenues are shared and a major reason many analystsargue against the idea of sharing these revenues on an origin basis. Theoreti-cally, of course, the inequitable nature of these transfers could be mitigated, atleast to a certain extent, by an equalization grant. We turn now to a discussionof Indonesia’s main equalization tool, the DAU.
2. Dana Alokasi Umum (DAU)
The DAU is the most important source of revenue for regional govern-ments. As Table 2 above shows, DAU allocations account for about two-thirdsof total subnational government revenues. The DAU is especially significantfor kabupaten/kota for which it makes up nearly 75% of total revenues. Thetransfer is not unimportant to provinces as well; DAU distributions account foraround one-third of total provincial revenues.
The legislation states that the annual DAU pool of finance is to be basedon a minimum 25% of total domestic revenues, where the latter is net of those
TABLE 4Vertical Imbalances, FY 2001
(Percentages)
Revenue Expenditure ImbalanceShare Share (1) – (2)
(1) (2)
Own-SourcesNational 0.966 0.732 0.234Subnational 0.034 0.268 (0.234)
Provincial 0.021 0.054 (0.033) Kabupaten/Kota 0.013 0.214 (0.201)Total 1.000 1.000 0.000
After Shared RevenuesNational 0.899 0.732 0.168Subnational 0.101 0.268 (0.168)
Provincial 0.040 0.054 (0.014) Kabupaten/Kota 0.061 0.214 (0.154)Total 1.000 1.000 0.000
After GrantsNational 0.702 0.732 (0.030)Subnational 0.298 0.268 0.030
Provincial 0.060 0.054 0.006 Kabupaten/Kota 0.238 0.214 0.024Total 1.000 1.000 0.000
Source: Author’s own calculations based on national and regional budget data.

Indonesia 151
amounts to be shared with regional governments via the mechanisms describedabove. Sharing arrangements between subnational levels of government arealso governed by law and 10% and 90% of the total funds are to be distributedto provinces and kabupaten, respectively. An important goal of the DAU is toaddress vertical imbalances. That is, it is the intention of the DAU, togetherwith revenues from other sources of finance, to assist provincial and kabupaten/kota governments in meeting their total respective expenditure requirements.25
For some evidence on questions related to the overall adequacy of DAUand other sources of finance vis-à-vis fiscal needs, consider Table 5 below. Thetable provides estimates of aggregate revenues available to and expenditureneeds of provincial and kabupaten/kota governments for FY2001. Own-sourcerevenue estimates are based on historical regional government budget (APBD)data (before decentralization) and shared revenues are based on FY2001 state(APBN) budgeted amounts. Regional government (routine and development)expenditure needs estimates are derived from provincial and kabupaten/kotaAPBDs (again, prior to FY2001) and from Kanwil and Kandep DIK (DaftarIsian Kegiatan—routine) expenditures for FY2000. Kanwils and Kandeps arethe former deconcentrated offices of central level agencies, the routine operationsof which were transferred to regional governments before and during FY2001.26
TABLE 5Estimated Regional Government Fiscal Capacities and Expenditure Needs
FY 2001(Rp Trillions)
Fiscal Capacity Provinces Kab/Kota Total
Own-Source 6.4 4.1 10.5Shared Revenues 5.9 14.8 20.7DAK n.a 0.7 0.7DAU 6.2 54.3 60.5Total Revenues 18.6 73.9 92.4
Expenditure NeedsRoutine, Based on FY 2000 8.4 23.2 31.6Development, Based on FY 2000 5.5 9.4 14.9From Kanwil and Kandep FY 2000 3.2 15.0 18.2Total Expenditure Needs 17.1 47.6 64.7
Surplus 1.5 26.3 27.7
Source: Based on Lewis (2001).
25. See Ministry of Finance (2002) for a discussion of the goals of the DAU andother transfers.
26. Note that fiscal needs estimates derived from ex-Kanwil and ex-Kandepoperations do not include development expenditures (Daftar Isian Proyek—DIPs). The

152 Intergovernmental Fiscal Transfers in Asia
The above table implies that the DAU and other sources of finance, ingeneral, appear to result in a significant funding surplus for regional govern-ments. Given all sources of revenue, regional governments, on the whole, appearto have almost Rp28 trillion more than they require to meet their expenditureneeds. The data suggest that kabupaten/kota seem to have access to substan-tially more funds (a surplus slightly more than Rp26 trillion) than they need tocarry out their assigned duties. On the other hand, it appears that provinciallevel funding, while apparently still in surplus (in the amount of Rp1.5 trillion),is at least close to required levels.
In any case, the implication here is that the pool of finance available tothe DAU, taking other sources of revenue as given, is too large relative to ex-penditure requirements. That is, arguably, the central government has, onbalance, transferred too much DAU to the regions; or, alternatively, it has trans-ferred too little in the way of expenditure responsibilities. While it may havebeen politically difficult to do otherwise, the economic appropriateness of mak-ing such large relative transfers to the regions, at time of rather significant pres-sure on the central budget, can at least be questioned.27
It must be emphasized that these conclusions are very tentative and moreresearch on these questions is needed. On the fiscal capacity side, additionalefforts would concentrate on developing better estimates of potential own-sourcerevenues and would be based on a more thorough examination of the tax basesto which local governments currently have access as well as normal tax ratesapplied to those bases. (The estimation of other sources of subnational rev-enue—transfers—is rather straightforward.) Improving estimates of real ex-penditure requirements is more problematic. Here, needed research would bebased on an examination of assigned service responsibilities of subnationallevels of government and a derivation of the legitimate costs related to carryingout those responsibilities at specified standards. Such a rigorous examination isnot currently possible given a lack of clarity about subnational expenditureassignments and service standards and lack of sufficient data on service deliv-ery costs, among other things. We will return to this question of the adequacyof DAU funding below after the DAU allocation methods are described.
latter have not yet been decentralized to regional governments, although by law theyshould have been.
27. The planned central budget deficit for FY2001 was 3.7% of GDP or approxi-mately Rp54.3 trillion. In the event the deficit appears to have been smaller, preliminarydata suggest that the actual deficit amounted to just 2.3% of GDP or about Rp34.2trillion.

Indonesia 153
3. Kabupaten/Kota DAU Allocation Methods
Provincial and kabupaten/kota DAU is allocated by formula. The meth-ods employed to distribute DAU across kabupaten/kota in FY2002 are describedand discussed next. Procedures used for the allocation of DAU to provinces aresimilar and briefly described later. It should be noted that DAU allocation tech-niques are still evolving and the distribution methods for FY2002 differ sig-nificantly from those used for FY2001, the first year of operations.28 Whereappropriate, differences in approach between the two years are noted. In addi-tion, the appendix to this chapter examines, in tabular format, issues and out-comes related to DAU, especially regarding differences in aggregate amountsavailable, allocation procedures, and equalization impacts in FY2001 and 2002.
Kabupaten/kota DAU allocations may be written:
iiii FABFALSADAU ++= (1)
where LSA is the lump sum amount, BFA is the balancing factor amount, andFA is the formula amount. The subscript i refers to kabupaten/kota governments.
The lump-sum amount is:
nDAU10.0
LSA Ti
•= (2)
where DAUT
refers to the total pool of finance for kabupaten/kota. Inmonetary terms, the lump-sum amount provided to each local government inFY2002 is Rp17.87 billion.
The balancing factor amount may be written as:
T
ii
ii DAU50.0
WageWage
BFA ••=∑
(3)
where Wage is the estimated wage bill for kabupaten/kota civil servants forFY2002. It is perhaps useful to note that the above formulation results in thefunding of 77% of each local government’s civil servant wage bill this fiscal year.
Note that equations (2) and (3) taken together indicate that 60% of DAUallocations are based on the lump sum and balancing factors, so that just 40%of the DAU is allocated via the fiscal gap formula as defined below. In FY2001,lump sum and balancing factor distributions accounted for just over 80% of
28. See Lewis (2001) for a description and analysis of the DAU distributionmechanism for FY2001.
154 Intergovernmental Fiscal Transfers in Asia
total kabupaten/kota DAU allocations. Some government officials have arguedthat the decrease in relative magnitude of the lump sum and balancing factoramounts this fiscal year implies an intention to phase out the use of these ele-ments over the next couple of years.
The lump sum last year was derived simply as a residual and resultedfrom adjustments made to the total pool of finance for the DAU during statebudget discussions with the parliament. The exact purpose of this year’s lumpsum is uncertain. Obviously, its significance is greater for relatively smallerplaces. As such, many observers have argued that the lump sum provides some,albeit limited, incentive for the creation of new (smaller) kabupaten out of es-tablished (larger) places. The extent to which the lump sum operates as such anincentive is unsure, but it is clear that the creation of new places continues inrapid fashion and strains the transfer system’s ability to keep apace.
The balancing factor last fiscal year was a function of the previous year’sSDO and INPRES allocations and was intended to operationalize a “hold harm-less” provision. As result, in FY2001, kabupaten/kota governments were assuredof a minimum 40% increase in grants compared with FY2000. The purposebehind the balancing factor this year is somewhat unclear. (Hold harmless pro-visions still remain but have been structured differently, as further describedbelow). However, the fact that the BFA is based on civil servants’ wages cer-tainly suggests a different objective from the previous year. Indeed, many offi-cials at the central and regional government level would very much like to seethe balancing factor separated from the rest of the allocation mechanism with aview to creating an SDO-like transfer to fund local civil servant costs.
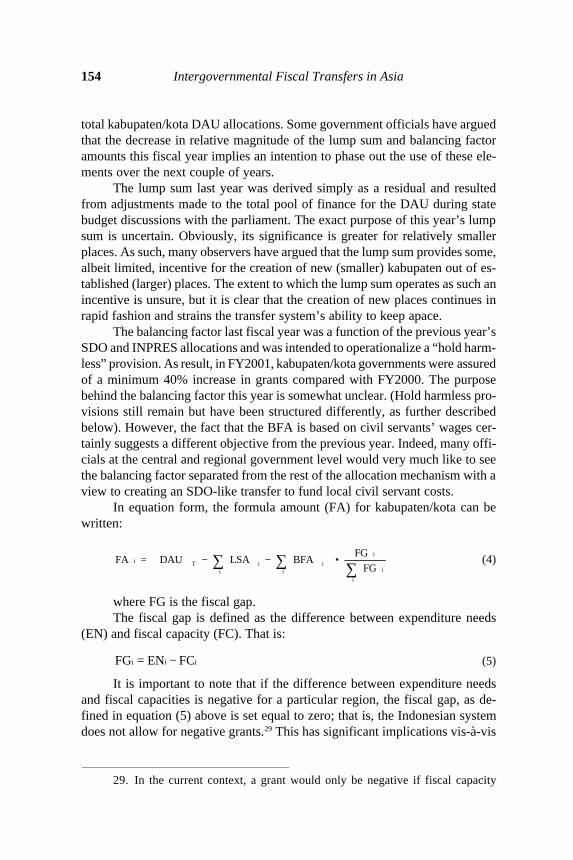
In equation form, the formula amount (FA) for kabupaten/kota can bewritten:
∑∑ ∑ •
−−=
i
i
i
i iiiTi
FGFG
BFALSADAUFA (4)
where FG is the fiscal gap.The fiscal gap is defined as the difference between expenditure needs
(EN) and fiscal capacity (FC). That is:
iii FCENFG −= (5)
It is important to note that if the difference between expenditure needsand fiscal capacities is negative for a particular region, the fiscal gap, as de-fined in equation (5) above is set equal to zero; that is, the Indonesian systemdoes not allow for negative grants.29 This has significant implications vis-à-vis
29. In the current context, a grant would only be negative if fiscal capacity

Indonesia 155
the system’s equalization performance, as discussed more fully below. TheDAU formula defines expenditure needs as the product between total localgovernment expenditure and the expenditure needs index. Expenditures areactual amounts from FY2001 local government budgets (APBD). The needsindex is a function of population, area, poverty, and a cost element. Data forthese variables are from the most recent years available.
More specifically, expenditure needs can be expressed in equation formas:
+++•=
∑∑∑∑i
i
i
ii
i
ii
i
ii
iTi
CostCost
4.0PovGap
PovGap1.0
AreaArea
1.0Pop
Pop4.0APBDEXPEN (6)
where APBDEXPT is total local government expenditure from the previous
year, Pop is population, Area is surface area, PovGap is the so-called povertygap, and Cost is a cost index.
The first term on the right hand side of equation (6) illustrates very clearlyone of the most obvious weaknesses of the DAU allocation formula. It makesapparent that, at the aggregate level, expenditure needs are simply assumed tobe equivalent to actual expenditures. The problem, of course, is that kabupaten/kota governments may not actually need what they spend. Or, they may needmore. In any case, real expenditure requirements can only be derived based ona thorough examination of the true costs of discharging a clearly defined set ofservice responsibilities at some predetermined standard or level of quality. Noneof these things is known with any degree of certainty in Indonesia and so thereis little choice but to opt for an approach such as the above, at least temporarily.
The needs index itself is comprised of variables that ostensibly influencethe demand for and/or cost of delivering local public services. Population, forexample, clearly influences the need or demand for public services—the greaterthe population, the greater the aggregate demand for services, all other thingsbeing equal.
Area also appears to have an indisputable influence on expenditure needs,at least for rural areas. One might plausibly argue that, all other things remain-ing the same, larger rural places are relatively more in need of roads, schoolbuildings, and health centers, for example, among other services. Area is prob-ably less relevant for urban areas, however. The fact that the DAU allocation
exceeded expenditure needs by an amount that was greater than the lump sum and bal-ancing factors. The policy until now has been to guarantee DAU grants to be at least aslarge as lump sum and balancing factor amounts. If and when the latter two are phasedout, then the stated “no negative grants” policy would take on more meaning.

156 Intergovernmental Fiscal Transfers in Asia
procedure treats urban and rural places in a similar manner here and, in general,is of concern.
The need for including a poverty measure in determining relative localgovernment expenditure requirements is not completely obvious. While theamount of poverty undeniably influences need for poverty-reduction programs,the level of government responsible for such efforts in Indonesia is still uncer-tain. It may well be that the central government has overall responsibility forpoverty reduction. The impact of poverty on need for other local services, suchas education, water, and roads is less than clear. While a direct relationship mayexist between the extent of poverty and expenditure needs for services otherthan pure poverty-reduction ones, Indonesian analysts have not yet made astrong case for it.
The choice of poverty variable is also somewhat unusual. Last year, DAUdesigners employed the number of poor people as the poverty variable to helpdetermine expenditure requirements. This at least makes some intuitive sense.This year the so-called poverty gap is used. The poverty gap is defined as theaverage proportionate distance of the poor from the poverty line across thewhole population. More precisely:
∑=
−=
q
1i
i1 z
yzn1
P (7)
where P1 is the typical notation for the poverty gap, n is total population, z is the
poverty line, yi is total expenditure of the ith person, and q is the number of
people who fall below the poverty line. It is usually argued that the poverty gapmeasures of the depth of poverty.
No explicit reason was given for the change in formulation. Assumingthat poverty is relevant in determining expenditure needs, it is hard to see howa measure of the depth of poverty would be more appropriate than the numberof poor people.30 In any case, this is clearly an area in which more research isneeded.
The cost index employed in equation (6) above is intended to measureunavoidable differences in costs faced by local governments. Its derivation isbased on differences in building construction costs across regions.31 These costs
30. Direct poverty reduction programs in Indonesia, such as rice subsidy pro-grams and school food programs, for example, focus on allocating benefits to people orfamilies classified as poor; benefits are standardized and are not adjusted for the depthof poverty as defined here.
31. This may not be the most appropriate index for measuring regional variationin the cost of delivering infrastructure services. Unfortunately, there is as of yet nobetter alternative. The Central Statistics Bureau is currently in the process, however, of

Indonesia 157
are assumed to be positively related to expenditure requirements associatedwith delivering local public services. Internationally, compensation for differ-ences in such costs (as opposed to those that might arise from local policydecisions) is often defended on equity grounds. While this may be legitimate, itmust be admitted that the influence of cost differentials has been formulated ina somewhat odd manner here. Typically, a cost index is structured into an allo-cation formula with a view to adjusting total expenditure needs directly (i.e.multiplicatively), after accounting for other needs factors. Thus, in the currentcontext, ignoring for a moment problems related to the use of the area andpoverty gap measures as discussed above, the influence of cost differential mightbe structured as:
100Cost
PovGapPovGap
AreaArea
PopPop
APBDEXPEN i
ii
i
ii
i
ii
iTi •
⋅χ+⋅β+⋅α•=∑∑∑
(8)
where α + β + χ = 1 and all other variables are as previously defined.In the allocation method used to actually distribute DAU, the cost index
is first averaged with noncost factors and then applied to expenditure needs.There is no clear economic rationale for this.
Finally, a brief comment is warranted on the weighting of needs factorsin equation (6) above. Last year, each of the four needs factors was weightedequally. Many analysts were unhappy with that weighting scheme; it was ar-gued, in particular, as a function of an empirical analysis of regional expendi-tures in Indonesia, that the weight accorded population was not commensuratewith its influence on expenditure needs. So, the present scheme was adopted, atleast partly in response to this criticism. Whether the adjustment is sufficient onthese grounds is uncertain, but based on the earlier mentioned analysis, it seemsless than adequate. In the end, the true influence of various needs factors, in-cluding population, can only be ascertained by more thoroughly disaggregatedsectoral and spatial analysis.
This fiscal year’s operationalization of fiscal capacity constitutes per-haps the greatest improvement over last year’s procedures. Fiscal capacity isnow straightforwardly defined as the sum of potential own-source revenuesand other transfers (somewhat reduced). In equation form:
iiiii SNR75.0SITSPTRSOFC •+++= (9)
developing an index that might better measure differentials in the full range of costsassociated with producing and providing subnational public services.

158 Intergovernmental Fiscal Transfers in Asia
where SPT is shared property tax revenue, SIT is shared personal income taxrevenue, and SNR is shared natural resource revenues. OSR in equation (9) ispotential local own-source tax and nontax revenue, which is derived as thepredicted value based on a regression of actual own-source revenue (OSR) forthe most recent year available against gross regional domestic product fromthe services sector (GRDPS). That is:
ii10i GRDPSOSR ε+β+β= (10)
Potential own-source revenues are thus defined as a function of standard taxeffort. The intention behind this formulation was, at least in part, to serve as anincentive to regional governments to mobilize revenues. It must be admitted,however, that regional officials do not understand well this feature. This lack ofunderstanding detracts from possible incentive effects.
Note the natural resource revenue share coefficient limits a region’s esti-mated fiscal capacity resulting from these transfers to 75% of the totals actuallyreceived. This unfortunate formulation resulted from the successful lobbyingefforts of local government and local parliamentary associations. It is not acoincidence, of course, that the current heads of these associations are, for themost part, mayors and councillors from natural resource-rich kabupaten/kota.
Some mention might be made of missing transfers in equation (9). It isoften argued that all sources of revenue should show up on the right-hand sideof an equation defining fiscal capacity. And, in this regard, many analysts haveargued that the DAK, for example, should be included in the definition of fiscalcapacity of regional governments. The central government has asserted, how-ever, that the DAK is reserved to fund atypical or extraordinary local expendi-ture needs. As such, they have explicitly rejected the inclusion of the DAK as acomponent of regional government fiscal capacity. On the other hand, analystsand central officials recognize that transfers made by provinces to kabupaten/kota (as mentioned above) should probably be included in the measure of thelatter’s fiscal capacity. Currently, however, a dearth of data prohibits such aformulation.
4. Hold Harmless Adjustments to Kabupaten/Kota DAU Allocations
Employment of the system described above generated the so-called origi-nal DAU allocations; that is, those that were presented to Parliament in thecontext of state budget negotiations. Parliament approved of the distributionmethods, in general, but insisted, at the same time, that no local governmentshould receive less in DAU in FY2002 than it received the previous year. Thisstipulation, of course, required some adjustments to the original DAU allocations.
The modifications were implemented by first comparing each place’s

Indonesia 159
originally derived DAU allocation to that received the previous year and notingany associated surplus or deficit. Allocations of individual surplus regions werethen reduced, where the amounts subtracted were equal to each place’s share ofthe total surplus times the aggregate deficit. This total was then distributedacross deficit regions to bring each of the latter’s allocations up to previousyear’s amounts.
Subsequently, about Rp800 billion derived from the state budget contin-gency fund for FY2002 was used to add some amounts back into surplus re-gions’ depleted allocations heretofore (where additional sums were based onrelative size of earlier contributions). This compensation scheme made up forpart, although not all, of amounts that were earlier taken away. In the end, so-called surplus regions lost a total amount of approximately Rp2 trillion in DAUallocations due to the adjustment procedures, while deficit regions gained ap-proximately Rp2.8 trillion. What may not be immediately obvious is that thosesurplus regions were, as a group, relatively less well off than deficit regions. Inany case, it is now clear that the adjustment procedures related to the imple-mentation of hold harmless condition insisted upon by Parliament wereunequalizing in their impact. More will be said about this later.
5. Provincial DAU Allocations
Provincial DAU allocations were derived in basically the same manneras just presented above for kabupaten/kota except that the lump sum and bal-ancing factor amounts were based on 20% and 30% of total provincial DAU.This resulted in a lump-sum allocation of Rp46.8 billion to each province and afunding of 31% of each province’s civil servant wage bill. Overall, therefore,the fiscal gap formula was used to allocate 50% of the total provincial DAUcompared to 40% for kabupaten/kota. The reasons behind the different approachemployed for provincial distributions have not been clearly stated and appearto be ad hoc. Provincial distributions were also subject to parliament’s holdharmless stipulations, and an adjustment procedure similar to that outlined forkabupaten/kota was used.
6. Vertical Imbalances Revisited
Having explained and operationalized the concept of the fiscal gap, weare now in a better position to undertake another approach to estimating theadequacy of the DAU pool of funds (together with other revenues) relative toaggregate expenditure needs. This method compares regional government DAUfunding to the sum of regional government net fiscal requirements, where thelatter are defined as the difference between expenditure needs and fiscal ca-

160 Intergovernmental Fiscal Transfers in Asia
pacities. We use the same definitions of expenditure needs and fiscal capacitiesas described above except that for the latter we set the coefficient of naturalresource revenue shares equal to one (assuming that the current formulation, inthis regard, lacks economic merit). Given the criticisms regarding the currentmeasures of expenditure needs noted in the earlier discussion, this proceduremight best be viewed as a check of the internal consistency of governmentprocedures in deriving the DAU pool of funds, on the one hand, and allocatingthose funds, on the other.
The most important difference between this technique and the methodpreviously used is that here aggregate net requirements are “built from the groundup”, as it were. In summing up these needs, regions with negative net require-ments (i.e., greater fiscal capacities than expenditure needs) are first zeroed out(as they are in the determination of DAU allocations). Such a technique resultsin estimates of net fiscal needs that are larger than those that will be derivedfrom a strictly aggregate examination of requirements and capacities. See Table6 below for the output of this method using FY2002 DAU data.
TABLE 6Net Fiscal Needs and DAU Amounts, FY 2002
(Rp Trillions)
Level of Government Net Fiscal Needs Share DAU Amounts Share
Provinces 7,285.9 0.143 6,911.4 0.100Kabupaten/Kota 43,707.8 0.857 62,202.7 0.900
Total 50,993.7 1.000 69,114.1 1.000
Source: Author’s own calculations based on MOF data.
As can be seen, total net regional fiscal needs, estimated in this manner,are just less than Rp51 trillion while actual DAU allocations are just greaterthan Rp69 trillion. This again suggests that the DAU is too large relative towhat is needed. In addition, the information in the table implies that a moreappropriate share of net domestic revenues for the DAU is around 18% ratherthan the current (minimum of) 25%. Also, the table suggests that provinces donot, in fact, receive enough DAU compared to what they require. And, as be-fore, the data here imply that kabupaten/kota receive significantly more thanneeded. Finally, the data suggest that a more appropriate split of the DAU forprovinces and kabupaten/kota might roughly be 15% and 85%, as opposed tothe current distribution of 10% and 90%, given the assumptions here.

Indonesia 161
7. Equalization Performance of DAU
The goal of the DAU transfer scheme in terms of equalization, as statedin the law, is to “make even the fiscal capacities of regional governments tofinance their expenditure needs.” This makes clear that a proper test of themechanism’s equalization effects requires, in the first instance, the existence ofgood measures of regional expenditure needs and fiscal capacities. But the aboveexamination of the DAU formula suggests that the current methods of estimat-ing needs and capacities are at least somewhat flawed.32
The first approach to examining the equalization performance of the DAUignores these complications and instead focuses on the variation in actual percapita revenues of kabupaten/kota. If DAU transfers were to equalize, it mightbe reasonable to expect, at a minimum, that the variation in the per capita rev-enues among local governments would be smaller after transfers were madethan before. Table 7 below provides some information on the variation of ac-tual revenues for FY2002.33
The table shows maximum and minimum per capita revenues acrosskabupaten/kota and the ratio between the maximum and minimum, along withthe coefficient of variation (i.e., the standard deviation divided by the average)of per capita revenues. The assumption is that the smaller the ratio of maximumto minimum values and the smaller coefficient of variation of per capita rev-enues, the greater the equalization. The base case relates to local governmentown-source revenues. To these own-source revenues are added, in succession,property-related shared taxes, shared personal income taxes, shared natural re-source revenues, DAU balancing factor amounts (including lump-sum amounts),DAU formula-derived amounts, and, finally, adjustments to original DAU madeto operationalize the hold harmless condition.
The table shows that the variation in per capita revenues, as defined bythe ratio of maximum to minimum values and the coefficient of variation, islower after DAU allocations are made than before such transfers are added. Inother words, the distribution of per capita revenues is more equal after the trans-fers than before. (The maximum to minimum ratio and coefficient of variation
32. A proper examination of equalization performance might also incorporate ananalysis of direct central government expenditure in the regions. As noted above, thecentral government continues to make expenditures on essentially regional functionsvia the so-called regional DIPs. Unfortunately, there are no reliable regionally disaggre-gated data on such expenditures.
33. The own-source revenues here are actuals, adjusted for inflation, for the mostrecent year available, FY2000. Revenue-sharing figures are estimated actual amountsfor FY2002. DAU amounts are actual allocations for FY2002.

162 Intergovernmental Fiscal Transfers in Asia
of 387.0 and 2.559, respectively, before DAU transfers, declined to 45.8 and1.030, respectively, after DAU transfers.) The general conclusion that can bedrawn from this analysis, therefore, is that DAU transfers appear to be equaliz-ing, at least under the admittedly somewhat weak standard considered here.
Furthermore, the table suggests that the formula component of the trans-fers is somewhat more equalizing than the balancing amount. (That is, the rel-evant measures decline after formula amounts are added to balancing factordistributions.) The table also shows that the hold harmless adjustments to theoriginal DAU allocations are unequalizing under the assumptions here. Thetable provides other interesting results as well. It shows, for example, thatthe transfer of property-related taxes tends to equalize the distribution of own-source revenues and that, somewhat surprisingly, the personal income tax tendsto equalize per capita revenues at the local level even further.34 The table alsodemonstrates the rather extreme unequalizing nature of the natural resourcetransfers.
TABLE 7Variation in Per Capita Revenues Across Local Governments
FY2002
Max/Min Coefficient Revenues Max Min Ratio of Variation
(Rupiahs)
Own-Source Revenues 855.3 0.3 2,835.9 2.245+ Property-Related Transfers 918.3 10.2 90.1 1.323+ Personal Income Tax Transfers 924.5 11.2 82.2 1.261+ Natural Resource Revenue Transfers 4,916.4 12.7 387.0 2.559+ DAU Balancing Factor Amounts 5,732.7 98.5 58.2 1.152+ DAU Formula Amounts 7,108.8 160.4 44.3 0.958+ Hold Harmless Adjustments 7,090.9 154.9 45.8 1.030
Source: Author’s own calculations.
There are at least two possible criticisms of the above methodology. Thefirst is that it has not incorporated, in an adequate way, notions of local expen-diture needs and fiscal capacities (i.e., potential own-source revenues togetherwith transfers).35 One way to get around this is to examine the variation in the
34. Recall that the allocation of the shared personal income tax revenues acrosskabupaten/kota is carried out by the province. Unfortunately, there is, as of yet, noinformation on the methods employed by provinces to distribute such revenues.
35. The implicit assumptions are that per capita expenditure needs are the same

Indonesia 163
distribution of the ratio of potential revenues to expenditure needs across alllocal governments before and after transfers. While it may be relatively easy toplausibly estimate potential revenues, the difficulties associated with derivinga single measure of expenditure needs would seem to prohibit such an approach,at least for the time being.
The second and related concern is that the method ignores the importantsimultaneous relationship between expenditure needs and fiscal capacities, onthe one hand, and transfers, on the other. That is, in examining the equalizationperformance of the DAU allocation scheme, it is useful to know how transfersvary in amount with respect to variations in expenditure needs and/or fiscalcapacities. More particularly, from an equalization point of view, it might beexpected that as expenditure needs rise, transfers should increase, with fiscalcapacities remaining the same. And as fiscal capacities increase, it might beargued that transfers should be smaller, holding expenditure needs constant.This is perhaps a slightly stricter standard of equalization than the one em-ployed above.
The difficulty, again, concerns estimating expenditure needs. While itmay not be possible to derive a plausible single measure of expenditure needs,some of the factors that are important in determining needs, in general, are atleast known. And some of these determinants were used in the current DAUmethodology to estimate needs; that is, population, area, poverty, and relativecost factors, in some weighted combination, all at least conceivably help deter-mine real requirements and therefore transfers.36 The approach used directlybelow assumes that these four variables, along with urban status, help deter-mine expenditure requirements and influence allocations. But rather than speci-fying exactly how they do this a priori, as the current DAU formula mechanismdoes, the method employed here is “let the data decide.”
Defining an appropriate measure of fiscal capacity is less controversial.Fiscal capacity is defined only slightly differently from the way in which it isdefined under present DAU allocation procedures. There are two minor, al-though conceptually important, differences. First, in the estimation of potentialown-source revenues, a dummy variable to indicate urban status is added to theright-hand side of the regression equation (10) to operationalize the notion thaturban own-source revenues tend to be larger than those of rural places, all otherthings being equal. Second, the coefficient of natural resource revenues is set
across all places and that own-source revenues are equivalent to potential own-sourcerevenues. Both assumptions are obviously unrealistic.
36. The analysis holds in abeyance final judgment about the relationship betweenpoverty and expenditure requirements. For purposes of argument, the examination heresimply adopts the basic assumptions of the DAU designers; that is, that poverty is gen-erally important in influencing expenditure needs of regional governments.

164 Intergovernmental Fiscal Transfers in Asia
equal to one instead of 0.75 in equation (9), under the assumption that the latterspecification is the result of a political deal and has no economic basis.
Transfers are posited to be a function of fiscal capacity and expenditureneeds and a simple linear regression technique is used to operationalize therelationship. Both original DAU (DAUPC) and adjusted DAU (AdjDAUPC)transfer allocations are considered. In addition, the two major components ofthe DAU—the balancing factor (BALPC) and formula amounts (FORMPC)—are treated separately. Per capita transfers, variously defined, are regressedagainst per capita fiscal capacity (FISKPC); cost-index adjusted37 population(POP•CST), area (for kabupaten only—AREA•CST•KAB, where KAB is adummy variable for kabupaten), and poverty rate (POV•CST);38 and a dummyvariable for urban status (KOTA, set equal to 0 for kabupaten and 1 for kota).The latter variable is intended to operationalize the assumption that urban placesare, de facto, charged with delivering a broader range of services than nonurbanplaces and that therefore they have greater expenditure requirements than ruralplaces, all other things being equal.39 The multiplicative specification of theinfluence of the basic needs variables is suggested by the standard employmentof a cost index, as argued above. All variables (except the dummy) are enteredinto the equation in logarithmic form.
The assumption here is that, for transfers to be equalizing, per capitaallocations should be positively related to expenditure need variables (cost-adjusted area and poverty and urban status) and negatively related to per capitafiscal capacity. There is no a priori expectation regarding the influence of cost-adjusted population. Table 8 provides the results of the ordinary least squaresregression.40 For each of the four dependent variables, the table shows the
37. The costs employed here are the Rupiah costs (in thousands) per square meterof constructing a standard type of building and a standard type of fence around thatbuilding. The cost index is calculated by dividing each place’s cost figure by the aver-age for the entire sample and multiplying by 100. The current DAU allocation mecha-nism uses the same cost figures but the cost index was derived somewhat differently.
38. The incidence of poverty is used instead of the number of poor people or thepoverty gap to operationalize poverty. This is the more straightforward approach and italso has the benefit of avoiding potential multicollinearity problems with population.
39. The problem with this dummy variable approach is that it ignores the factthat many kabupaten have significant urban populations. As such, it might be better touse a variable that denotes the percent of a local government’s total population that isurban. Unfortunately, there are no up-to-date and reliable data on the proportions ofkabupaten populations that are urban. This dearth of data is largely a function of statis-ticians’ inability to keep up with the rapid creation of new local governments over thepast several years.
40. The OLS technique results in no obvious problems of heteroscedasticity orautocorrelation.

Indonesia 165
estimated regression coefficients for the set of independent variables. The ab-solute values of the t-statistics are located in parentheses under each respectivecoefficient; in addition, the table notes whether the estimated coefficient is sta-tistically different from zero at the 0.05 level. The adjusted R2 for each regres-sion is found along the bottom row of the table.
TABLE 8Equalization Analysis Regression Results
Independent Dependent VariableVariable BALPC FORMPC DAUPC AdjDAUPC
Constant 8.477 * 17.294 * 9.972 * 8.297(34.067) (19.302) (36.987) (38.357)
FISKPC –0.030 –0.986 * –0.165 * 0.019(1.625) (14.906) (8.303) (1.196)
POP*CST –0.556 * –1.690 * –0.755 * –0.586(22.578) (19.059) (28.278) (27.354)
AREA*CST*KAB 0.035 * 0.304 * 0.105 * 0.079(2.480) (6.051) (6.969) (6.504)
POV*CST 0.040 –0.037 0.090 * 0.106(1.910) (0.488) (3.942) (5.809)
KOTA 0.317 * 2.516 * 0.884 * 0.575(2.619) (5.768) (6.733) (5.461)
Adjusted R2 0.804 0.532 0.823 0.886
The table shows that per capita balancing factor transfers are significantly andpositively related to (cost-adjusted) area (i.e., for kabupaten) and to urban sta-tus. Such transfers are not related to cost-adjusted poverty at the standard 0.05level but are statistically significant at just a slightly lower level (0.056). Bal-ancing transfers are not significantly related to per capita fiscal capacity. Theseresults indicate that balancing factor transfers are partially equalizing with re-spect to expenditure needs, as defined above, but not with regard to fiscal ca-pacity, under the assumptions employed here.
Per capita formula amounts are significantly and positively related to(cost-adjusted) area and urban status but not to (cost-adjusted) poverty. For-mula-based transfers are significantly and negatively related to per capita fiscalcapacity. The equalization impact of formula allocations is, therefore, againsomewhat mixed with regard to expenditure needs but unambiguous with re-gard to fiscal capacity.
Overall, original DAU transfers perform rather well by the standards un-der discussion here. Per capita DAU transfers, before adjustments, are signifi-cantly and positively related to (cost adjusted) kabupaten area and poverty

166 Intergovernmental Fiscal Transfers in Asia
variables41 as well as to urban status. In addition, per capita allocations aresignificantly and negatively related to fiscal capacities. These results suggestthat, overall, DAU transfers are equalizing with respect to both expenditureneeds and fiscal capacities.
Unfortunately, the same cannot be said for per capita adjusted DAU trans-fers. While per capita adjusted allocations are positively related to all expendi-ture needs variables, they are not significantly related to fiscal capacities. It isreasonable to conclude that adjustments related to the hold harmless stipulationinsisted upon by the Indonesian parliament resulted in transfers that were lessequalizing than they otherwise would have been, at least given the assumptionsemployed here.
As mentioned above, there are no a priori expectations regarding the sig-nificance or sign of the coefficient of the (cost-adjusted) population variable.As it turns out, population is the most important variable overall in explainingvariation in per capita transfers (as judged by the values of the standardizedbeta coefficients—not shown in the table) and the results here are indicative ofan assumption of economies of scale in the provision of services financed bytransfers; that is, as population increases, per capita transfers decrease, all elseremaining the same. Of course, much more detailed analysis needs to be doneto confirm the existence of such economies of scale for particular services and/or in general.
8. Dana Alokasi Khusus (DAK)
The DAK is Indonesia’s new special-purpose transfer. It comprises twodistinct elements. One is based on the allocation of national reforestation rev-enues. Forty percent of state reforestation levies on companies engaged in thesector are returned to the kabupaten of origin and are to be used exclusively forlocal reforestation activities. This is really nothing more than a simple revenuesharing transfer of the kind that was discussed above. Its attachment to theDAK is an artifact of the negotiations between government and parliamentattendant to the ratification of Law 25 of 1999.
The second component of the DAK is the real special-purpose grant. Butthere will probably not be just one such DAK; most likely, there will be many,
41. The fact that the poverty variable is significant here may be considered some-what of a statistical fluke as it does not appear among the statistically significant vari-ables for either of the two components of DAU transfers (i.e., balancing and formulaamounts).

Indonesia 167
one for each of the important line ministries, such as health, education, andinfrastructure, among others. In any case, these DAKs are intended for use infinancing expenditures on national priority infrastructure services that are out-side the scope of DAU funding.
The specific focus of this particular grant component is on financing capitalexpenditures, although operations and maintenance can also be funded throughthe grant, at least for a limited period of time (three years). This element of theDAK is specified as a matching grant and government regulations insist thatthe region’s contribution should be no less than 10% of total project expendi-tures. The allocation of the DAK is to be based on proposals from the regions.A recent Ministry of Finance policy paper notes that DAKs are intended topromote minimum standards and compensate for benefit/cost spillovers.42
Only the reforestation component of the DAK has been made operationalso far. Funding related to this element of the DAK is quite limited, as shown inTable 2. The other major component of the DAK has not yet been put intoeffect and so it is not possible to comment on its performance vis-à-vis specificstated or more general objectives. Based on its current design, however, at leastthree important issues can be raised.
The first concern relates to the transfer’s intended support for the attain-ment of minimum service standards. While the DAK hopes to promote minimumstandards, somehow defined, it apparently will do so only for the constructionof national priority infrastructure and possibly for limited operations and main-tenance activities related to such infrastructure. The promotion of minimumstandards for other sorts of (non-national priority) infrastructure investmentand/or other kinds of longer-term operations and maintenance or service deliv-ery activities will not, it appears, receive support via the DAK. This seems to bea rather uneven and inconsistent approach to the promotion of infrastructureservice delivery standards.
The second and related issue concerns DAK incentives to local govern-ments for the delivery of services with benefit spillovers. It is usually arguedthat subnational governments tend to underprovide (from a national point ofview) services with significant interjurisdictional spillovers because they onlycare about benefits that accrue to their own populations. The allocation of in-tergovernmental transfers to regions to encourage the appropriately increaseddelivery of such services is one way of overcoming the potential inefficiencies.Now, the DAK apparently intends to provide incentives to regions to buildinfrastructure that is adequate (in size and scope) to deliver services at the na-tionally desired level. But such support will appear to cease after the assetshave been developed (and the three-year time limit on support for operations
42. See Ministry of Finance (2002).

168 Intergovernmental Fiscal Transfers in Asia
and maintenance has expired). This leaves regions without an incentive to actu-ally deliver services at the desired level. Inefficiencies would be expected toensue.
A final concern relates to the possible establishment of formal linkagesbetween the DAK and loan finance for regional infrastructure development.Theory suggests that blending grants and loans in infrastructure finance mighthave many benefits, including supporting fiscally weak governments to borrow.43
While the current DAK design documentation does not appear to prohibit thedevelopment of such linkages between the DAK and regional borrowing, nei-ther does it elucidate the possibilities. This is an issue that merits increasedthought and discussion.
D. Summary and Policy Recommendations
Indonesia has recently begun the implementation of a major fiscal decen-tralization program. As part of that effort, the system of intergovernmental trans-fers has undergone significant changes. Revenue sharing has been considerablyexpanded in scope and level, central-local transfers have been rationalized, andattendant pools of finance have been substantially increased.
The most important goals of the new system of transfers are to addressregional aspirations for increased access to revenues and more control over theuse of finance and to correct vertical and horizontal fiscal imbalances. Thereare also other objectives for the transfer system, such as supporting minimumservice standards and compensating for benefit spillovers. These latter objec-tives are, however, linked specifically to the DAK which, as noted above, is notyet operational. It should be a priority of the government to further develop thisimportant intergovernmental fiscal tool. In the course of doing so, the govern-ment would be wise to revisit the notion of limiting (for the most part) DAK tothe support of regional capital expenditures. Keeping such restrictions wouldconstrain the full attainment of goals related to minimum standards and benefitspillouts.
Meeting regional government aspirations and demands for more moneyhas, in fact, been the driving force behind Indonesia’s decentralization pro-gram. The regional assignment and delivery of new service responsibilities have,by comparison, been given rather short shrift. This is unfortunate and points toa major problem with fiscal decentralization in Indonesia today. The lack ofclarity on service assignment hinders the appropriate assignment of revenuesand constrains accountability at the regional level. The government is now de-veloping a program to clarify regional government service assignments and to
43. See Smoke (1999) for a discussion of grant-loan linkages in the Indonesiancontext.

Indonesia 169
outline standards for service delivery. It is too early to judge the success of thisimportant effort.
Revenue sharing has been the major instrument for central governmentto address regional fiscal demands. The focus on revenue sharing is a functionof the historical unhappiness of many in the regions who have felt that theyhave not sufficiently benefited from revenues that are derived from “their land”in the first instance. Apparently, many Indonesians strongly hold the view thatwhat is produced on or under their soil is theirs. Many officials and others inthe regions remain unconvinced they are receiving adequate amounts of rev-enues in question.
While an expansion of revenue sharing would probably not be fiscallyprudent from a macroeconomic perspective, several efforts might be undertakento address current worries along these lines. For natural resource revenues,concerns could, at least in part, be addressed by making payments directly tothe regions, instead of first collecting total revenues at the central level andthen distributing them back to regions, as is the current practice. At the veryleast, central officials could carry out calculations of total natural resource rev-enues earned and shared in a more transparent manner. Distribution of the in-come tax will be improved by allocating it to regions based on the place ofresidence of the income earner rather than on location of the employer, as isapparently currently done. An even better approach to sharing the personalincome tax is to restructure the transfer as a tax base sharing instrument—thatis, by using a “piggyback” mechanism. In addition, the property taxes shouldbe decentralized to regional governments. The transfer of these taxes couldbegin more or less immediately with devolution of tariff control but shouldprobably eventually extend to all relevant administrative functions.44
Of course many would, on the contrary, advocate an outright reductionin revenue sharing from its current levels. While on paper this may seem like agood idea, it does not seem to be a real possibility, at least in the present politi-cally charged environment. More likely, Indonesians and others will have tolearn to accept the considerable downside associated with revenue sharing, as itis currently designed, at least in the near- to medium-term.
Revenue sharing and grants together have been successful in addressingvertical fiscal imbalances at the regional government level. In fact, intergov-ernmental transfers may have gone too far in this respect; that is, at the aggre-gate level, at least some evidence suggest that too much money may have beenallocated to regional governments vis-à-vis their expenditure needs. Of course,
44. Restructuring the personal income tax sharing via piggyback methods anddecentralizing the property tax are both now under discussion in the Ministry of Fi-nance. See Ministry of Finance (2002).

170 Intergovernmental Fiscal Transfers in Asia
more research is needed to confirm this. If true, however, this would be a par-ticularly important problem for the central government to address head-on, es-pecially at a time of not insignificant pressure on the state budget.
As suggested above, it is probably not politically feasible at this time toresolve this difficulty by reducing aggregate revenue sharing or DAU alloca-tions to the regions. Another, perhaps more feasible, approach to addressingthe (potential) problem of overallocation of transfers, is to devolve greater cen-tral government expenditures in the regions (i.e., regional DIPs) to the regionsthemselves—without decentralizing additional finance. Many central agencieshave retained expenditure authority over what are now essentially local func-tions. The decentralization of an appropriate amount of these expenditure re-sponsibilities to subnational governments could, theoretically at least, have theeffect of bringing central and aggregate regional fiscal mismatches back intobalance.
Although regional governments, in general, may have been allocated morefiscal resources than needed, this may not be true for provinces. As noted above,some evidence suggest that provinces may not have been given sufficient ac-cess to resources to meet their expenditure requirements. This again requiresmore study. If true, however, it suggests that the methods by which revenuesare shared between provinces and kabupaten/kota and by which provincial andlocal DAU pools of finance are determined might need to be revisited. A modi-fication of arrangements for distributing shared revenues and grants betweenlevels of subnational government will not be politically uncomplicated, of course,but it may be more feasible than making outright cuts to such transfers.
It is basically the job of the DAU to correct horizontal imbalances. Thistask is made more difficult than it otherwise would be because of the unequalizingnature of revenue sharing, as noted above. These inequities could, to a largeextent, be overcome if a system of negative grants could be implemented. Alas,such a fraternal system of transfers is probably not viable in Indonesia at present,at least as judged by reactions to initial proposals for such.
In any case, while Indonesia has made some progress in addressing equal-ization objectives, as demonstrated above, more could still be done, even giventhe constraints noted. More work needs to be done at the technical level toimprove the DAU allocation formula. In the medium term, factors that betterproxy expenditure requirements and fiscal capacity need to be found and em-ployed. In the long run, expenditure requirements should be more preciselyestimated for individual governments as a function of the real costs of achiev-ing some specified standard of service delivery. In addition, fiscal capacitiesneed to be more exactly derived as a function of size of tax bases over whichlocal governments actually have some control. A general issue for consider-ation is whether urbanized and rural areas should be treated separately in esti-mation procedures, given their very real differences in service responsibilities,

Indonesia 171
costs, and fiscal capacities. A transition plan for removing the balancing factorfrom the distribution formula gradually over time needs to be formally speci-fied. The hold harmless condition, which was perhaps useful in the first year ofDAU operations, should now be relaxed—its continued use directly constrainsequalization goals.
In the end, of course, some horizontal imbalances are likely to remain, asthey do everywhere in the world. This point notwithstanding, it would be use-ful for Indonesians to sort out, in more precise terms than they have so far done,the degree of fiscal inequality they are willing to tolerate. But they should notstop there. The entire process of fiscal decentralization in Indonesia would ben-efit greatly from increased clarity of its objectives and goals. Without a moreexplicit recognition of what decentralization is trying to achieve, how will In-donesians know the extent to which this important endeavor has been successful?
References
Beier, Christopher and Gabe Ferrazzi. 1998. Fiscal Decentralization in Indonesia: AComment on Smoke and Lewis. World Development 26 (12): 2201–2211.
Davey, Kenneth. 1989. Central-Local Financial Relations. In Financing Local Govern-ment in Indonesia, edited by Nick Devas. Athens, Ohio: Ohio University Centerfor International Studies.
Ford, J. and Fitz, G. 2000. Inter-Governmental Fiscal Relations and State Building: TheCase of Indonesia. Washington, DC: Mimeograph.
Guinness, Patrick. 1994. Local Society and Culture. In Indonesia’s New Order: TheDynamics of Socio-Economic Transformation, edited by Hal Hill. New York:Allen and Unwin, New South Wales, Australia.
Kelly, Roy. 1993. Property Tax Reform in Indonesia: Applying a Collection-Led Imple-mentation Strategy. Bulletin of Indonesian Economic Studies 29 (1): 85–104.
Lewis, Blane. 2001. The New Indonesian Equalization Transfer. Bulletin of IndonesianEconomic Studies 37 (3): 325–43.
——— and Paul Smoke. 1998. Reply to Beier and Ferrazzi: Reconsidering Decentrali-zation in Indonesia. World Development 26 (12): 2212–2230.
Ministry of Finance. 2002. Fiscal Decentralization: A Ministry of Finance Policy Agenda.Draft Paper, Directorate General for Fiscal Balance. Jakarta: Ministry of Finance.
Ray, David. 2001. Inventory of Trade-Distorting Local Regulations. Jakarta: USAID-PEG Project, Ministry of Industry and Trade.
Republic of Indonesia. 1995. Finance Note and State Budget for Fiscal Year 1995 (NotaKeuangan dan Anggaran Pendapatan dan Belanja Tahun Anggaran). Jakarta.
———. 1996. Finance Note and State Budget for Fiscal Year 1996 (Nota Keuangandan Anggaran Pendapatan dan Belanja Tahun Anggaran 1996). Jakarta.
———. 1997. Finance Note and State Budget for Fiscal Year 1997 (Nota Keuangandan Anggaran Pendapatan dan Belanja Tahun Anggaran 1997). Jakarta.
———. 1998. Finance Note and State Budget for Fiscal Year 1998 (Nota Keuangandan Anggaran Pendapatan dan Belanja Tahun Anggaran 1998). Jakarta.

172 Intergovernmental Fiscal Transfers in Asia
———. 1999. Finance Note and State Budget for Fiscal Year 1999 (Nota Keuangandan Anggaran Pendapatan dan Belanja Tahun Anggaran 1999). Jakarta.
———. 1999. Law No. 22/1999 regarding Regional Administration (Undang-Undang22/1999 tentang Pemerintahan Daerah). Jakarta.
———. 1999. Law No. 25/1999 regarding Financial Balance between Central and Re-gional Governments (Undang-Undang No. 25/1999 tentang PerimbanganKeuangan antara Pusat dan Daerah). Jakarta.
———. 2000. Finance Note and State Budget for Fiscal Year 2000 (Nota Keuangandan Anggaran Pendapatan dan Belanja Tahun Anggaran 2000). Jakarta.
———. 2000. Government Regulation No. 25/2000 regarding Government Authoritiesand Autonomous Provincial Government Authorities (Peraturan Pemerintah No.25/2000 tentang Kewenangan Pemerintah dan Kewenangan Propinsi sebagaiDaerah Otonom). Jakarta.
———. 2000. Government Regulation No. 104/2000 regarding Balance Funds(Peraturan Pemerintah No.104/2000 tentang Dana Perimbangan). Jakarta.
———. 2000. Law No. 17/2000 regarding the Third Revision to Law 7/83 regardingIncome Tax (Undang-Undang 17/2000 tentang Perubahan Ketiga Atas Undang-Undang Nomor 7 Tahun/83 tentang Pajak Penghasilan). Jakarta.
———. 2000. Law No. 34/2000 regarding the Revision to Law 18/97 regarding Re-gional Taxes and Charges (Undang-Undang 34/2000 tentang Perubahan atasUndang-Undang 18/97 tentang Pajak Daerah dan Retribusi Daerah). Jakarta.
Rohdewohld, Rainer. 1995. Public Administration in Indonesia. Melbourne, Australia:Graduate School of Government, Monash University.
Schroeder, Larry. 1995. Targeting Intergovernmental Transfers. Jakarta: USAID Mu-nicipal Finance Project II, Ministry of Finance.
Shah, Anwar. 1994. The Reform of Intergovernmental Fiscal Relations in Developingand Emerging Market Economies. Policy and Research Series 23. Washington,DC: World Bank.
Shah, Anwar and Zia Qureshi. 1994. Intergovernmental Fiscal Relations in Indonesia:Issues and Options, World Bank Discussion Paper No. 239. Washington, DC:World Bank.
Smoke, Paul. 1999. Improving Local Infrastructure Finance in Developing Countriesthrough Grant-Loan Linkages: Ideas from Indonesia’s Water Sector. Interna-tional Journal of Public Administration 22 (11–12): 1561–1585.
——— and Blane Lewis. 1996. Fiscal Decentralization in Indonesia: A New Approachto an Old Idea. World Development 24 (8): 1281–1299.

Appendix: Dana Alokasi Umum, Fiscal Years 2001 and 2002 Feature FY 2001 FY 2002 Total Pool of Funds 25 percent of total national revenues (net of shared amounts). Rp 60.517 trillion. 25 percent of total national revenues (net of shared amounts). Rp 69.114 trillion. Local and Provincial Shares
90 percent for kabupaten/kota (Rp 54.279 trillion); 10 percent for provinces (Rp 6.238 trillion).
90 percent for kabupaten/kota (Rp 62.203 trillion); 10 percent for provinces (Rp 6.911 trillion).
General Allocation Mechanism iiii FABFALSA * ++DAU = iiii FABFALSADAU ++=
Lump Sum Amount
n
FA*BFADAULSA i i
ii2T
i
+−
=∑ ∑
nDAU10.0LSA T
i•
=
Balancing Factor Amount
iii INPRES1.1SDO3.1BFA •+•= T
ii
ii DAU50.0
WageWageBFA ••=∑
Formula Amount
∑∑ •
−=
ii
i
ii1Ti
FGFGBFADAUFA
∑∑ ∑ •
−−=
ii
i
i iiiTi
FGFGBFALSADAUFA
Fiscal Gap Component
iii FCENFG −= ; allocated 20 percent of total DAU. iii FCENFG −= ; allocated 40 percent of total DAU.
Expenditure Needs
+++•=
∑∑∑∑i
i
i
ii
i
ii
i
ii
iTi
CostCost4.0
PovGapPovGap1.0
AreaArea1.0
PopPop4.0APBDEXPEN
Fiscal Capacity
∑∑+
∑∑+
∑∑
•
+
=
ii
ii
i
i
ii
ii
i
i
ii
ii
i
i
Pop
LFPopLF
GRDP
NNROGRDPNNRO
GRDP
NRO
GRDPNRO
TTi
31
nSPTOSRFC
iiiii SNR75.0SITSPTRSOFC •+++=
where is the predicted value derived from the regression:
GRDPSOSR ε+β+RSO
ii10i β=
Provincial Allocations
••+
++
••=∑∑
ii
i2T
iii
ii2Ti
FGFGDAU2.0
INPRESSDOINPRESSDODAU8.0DAU
Same as for local governments except that lump sum and balancing factor based on 20 and 30 percent of total provincial DAU, respectively.
Hold Harmless Condition
For local governments only. Built into balancing factor; local governments assured of at least 40 percent increase over previous year.
Insisted upon by Parliament. Led to “adjusted DAU” whereby both provincial and local governments assured of no less than previous year.
Use of Contingency Fund
A total of Rp 2.8 trillion allocated to regional governments to cover estimated shortfalls in finance. The total includes Rp 1.2 trillion for provinces and Rp 1.6 for kabupaten/kota. Allocations based on proposals from the regions and made at various times during the course of the fiscal year.
A total of Rp 2.1 trillion distributed to regional governments as part of DAU allocations. Distributions necessitated by Parliament’s hold harmless stipulation. Total includes Rp 1.2 for provinces and Rp 0.81 trillion for kabupaten/kota governments.
Equalization Performance
Variation in distribution of per capita revenues smaller after DAU allocations than before. Per capita DAU allocations positively related to both expenditure needs and fiscal capacities.
Variation in distribution of per capita revenues smaller after DAU allocations than before. Per capita DAU allocations, before hold harmless adjustments, positively related to expenditure needs and negatively related to fiscal capacities. After adjustments, per capita DAU allocations positively related to expenditure needs but unrelated to fiscal capacities.
+∑+∑+∑•
=
100CostPovAreaPop
41
nAPBDEXPEN i
n
Pov
i
n
Area
i
n
Pop
iTi
ii
ii
ii

2
Variable Definitions
FY 2001 FY 2002
i subscript denoting region i subscript denoting region
n subscript denoting total number of regions n subscript denoting total number of regions
T subscript denoting total of variable in question T subscript denoting total of variable in question
T1 subscript denoting total value before changes to draft state budget
T2 subscript denoting total value after changes to draft state budget
DAU DAU allocation DAU DAU allocation
LSA lump sum amount LSA lump sum amount
BFA balancing factor amount BFA balancing factor amount
BFA* balancing factor amount after adjustments Wage civil service wage bill
FA formula amount FA formula amount
SDO routine grant, from previous fiscal year
INPRES development grant, from previous fiscal year
FG fiscal gap FG fiscal gap
EN expenditure needs EN expenditure needs
FC fiscal capacity FC fiscal capacity
APBDEXP local government expenditure APBDEXP local government expenditure
Pop population Pop population
Area area Area area
Pov incidence of poverty PovGap poverty gap
Cost cost index Cost cost index
OSR own-source revenue OSR own-source revenue
SPT shared property taxes SPT shared property taxes
NRO product from natural resources sector SIT shared personal income tax
NNRO product from non-natural resources sector SNR shared natural resource revenues
LF labor force
GRDP gross regional domestic product GRDPS gross regional domestic product, services sector
See Lewis (2001) for further explanation See text for further explanation