interim financial results briefing...trends in sales-cost ratio and sg&a cogs sg&a...
TRANSCRIPT

Copyright THK CO.,LTD.2010. All rights reserved.
November 15th 2010
THK CO., LTD.President & CEOAKIHIRO TERAMACHI
This presentation material contains forward looking statements that reflect the Company’s business plans, performance projections, and strategic forecasts. Such statements are based on information currently available to the Company. However, changes in the operating environment may cause actual results and achievements to differ from those anticipated in this corporate presentation material. Also, please let you know that this presentation material includes reference information that are not exactly accounts indication matters.
INTERIM FINANCIAL RESULTS BRIEFINGINTERIM FINANCIAL RESULTS BRIEFING

Copyright THK CO.,LTD.2010. All rights reserved.
1.1. Financial ResultsFinancial Results 1st Half of Fiscal Year ending March 1st Half of Fiscal Year ending March 20201111

2Copyright THK CO.,LTD.2010. All rights reserved. 2
Financial HighlightsFinancial Highlights
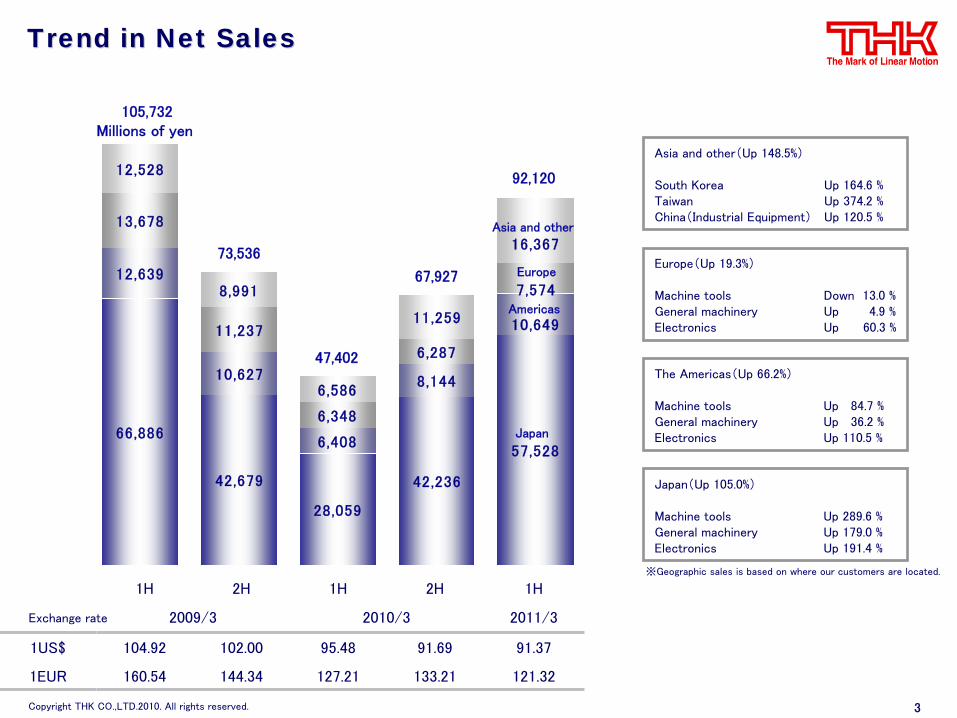
Net sales increased by 94.3% from the previous year to 92.1 billion yen
In Japan, THK successfully grew overall product sales for machine tools, general machinery and electronics as
domestic demand recovered
In overseas markets, the company achieved overall growth of sales, supported by rising demand in the Asian
region, including China and Taiwan, as well as a recovery in demand in developed nations such as European
countries and the U.S.
Operating Income of 9.5 billion yen was posted
Income was recorded due to the quantitative effects accompanying the increase in net sales
Negative impact by appreciation of the yen
Fixed costs increased due to higher capacity utilization
Business results were roughly in line
Both net sales and operating income were roughly in line with the forecast revision announced in August 2010 to
net sales of 92.1 billion yen and operating income of 9.5 billion yen
Copyright THK CO.,LTD.2010. All rights reserved. 3
66,886
42,679
28,059
42,236
57,528
12,639
10,627
6,408
8,144
13,678
11,237
6,348
6,287
12,528
8,991
6,586
11,259 10,649
7,574
16,367
Asia and other(Up 148.5%)
South Korea
Up 164.6 % Taiwan Up
374.2 %China(Industrial Equipment)
Up 120.5 %
Europe(Up 19.3%)
Machine tools Down 13.0 % General machinery
Up 4.9 %Electronics
Up 60.3 %
The Americas(Up 66.2%)
Machine tools
Up 84.7 % General machinery
Up 36.2 % Electronics
Up 110.5 %
Japan(Up 105.0%)
Machine tools
Up 289.6 % General machinery
Up 179.0 % Electronics
Up 191.4 %
73,536
47,402
67,927
1H 2H 1H 2H 1H
2009/3 2010/3 2011/3
1US$ 104.92 102.00 95.48 91.69 91.37
1EUR 160.54 144.34 127.21 133.21 121.32
Exchange rate
92,120
Trend in Net SalesTrend in Net Sales
Americas
Europe
Japan
Asia and other
105,732Millions of yen
※Geographic sales is based on where our customers are located.

Copyright THK CO.,LTD.2010. All rights reserved. 4
34.4%
20.0% 24.1%17.3%
25.3%
8,431 7,107 7,156 6,812 7,366
2,6981,945 1,110 1,400 1,614
1,5271,518 1,547 1,783 1,762
8,0377,518
6,021 5,914 4,770
498532 463 487 427
72,68458,243
40,51451,626
66,613
72.3%76.0%85.5%
79.2%68.7%
1H 2H 1H 2H 1H
2009/3 2010/3 2011/3
1H 2H 1H 2H 1H
2009/3 2010/3 2011/3
21,194
18,62316,299 16,397
COGS ratio
SG&A ratio
Millions of yen
15,940Millions of yen
Trends in SalesTrends in Sales--Cost Ratio and SG&ACost Ratio and SG&A
COGS
SG&A
Sales-cost ratio decreased
by
13.2points Y/Y
Income
was recorded due to the quantitative effects accompanying the increase in net sales
R&D(Up ¥
214
million, or 13.8% Y/Y
)
Sales & Distribution Costs(Up ¥
503million, or 45.3% Y/Y
)Increase in
distribution costs by increase of net sales
Depreciation and Amortization(Down ¥
36 million, or 7.8% Y/Y
)
Personnel Costs(Up ¥
210
million, or 2.9% Y/Y
)
Other(Down
¥
1,251
million, or 20.8% Y/Y)Decrease in Amortization of Goodwill

Copyright THK CO.,LTD.2010. All rights reserved. 5
前
上
期
営
業
利
益
数
量
効
果
変
動
費
比
率
の低
下
のれ
ん償
却
額
の減
少
固
定
費
の増
加
為
替
の影
響
今
上
期
営
業
利
益
Japan 8,343 million
The Americas939 million
Europe (430) million
Other271 million
Deletion or Company Total(360) million
China 802 million
Operating income by geographical segment
Operating Income Operating Income -- Cause of Change Cause of Change --
+18.7+2.5
+1.3 (3.3)
(0.3)
9.5Billionsof yen
(9.4)Billionsof yen
FY
2009 1HOperating
Income
Increase ofProduct
Volume
ForeignExchange
RateDifference
Down inVariable
CostRatio
Increase inFixed cost
FY2010
1HOperatingIncome
Decrease inAmortization
of Goodwill

6Copyright THK CO.,LTD.2010. All rights reserved.
88,916
163,066
160,211 86,060
Liabilities
Net Assets
Current Assets
Fixed Assets
Total Assets
249,127millions of yen
Up ¥
16,750 million from
previous period
Up ¥
807 million from previous period
Up ¥
11,944 million from previous period
Down ¥
3,998
million from
previous period)
Cash and Cash in Account: Up ¥
2,591million from previous period
Cash Flows from Operating Activities: ¥
7,407 million
Cash Flows from Investing Activities:
¥
(2,656) million
Cash Flows from Financing Activities:
¥
(992) million
Foreign Currency Translation Adjustments on Cash and Cash Equivalents : ¥
(1,167) millionAccounts Receivable: Up ¥
14,029 million from previous period
→Increase of net sales→Number of months’ sales receivables:
Previous period 4.2 per monthThis period 3.5 per monthInventories: Up ¥
1,655 million from previous period
→Previous period: 2.6 per month:This period: 1.7 per month
Property , Plant and Equipment:Down ¥
3,628 million from previous period
→CAPEX: ¥
2,693 millionDepreciation: ¥
4,439 million
Intangible Assets: Down
¥
117 million from previous period
Investment and Other:Down ¥
252 million from previous period
Current Liabilities: Up ¥
11,817 million from previous periodAccounts Payable: Up ¥
8,244 million from previous period
→ Purchasing
increased because of sales increase
→Number of months’ notes payable:
previous period →
2.5 monththis period →
2.1 month
Long-term Liabilities: Up ¥
126 million from previous period
Net Income:
¥
5,706 millionForeign Currency Adjustment:
Down ¥
3,773 million from previous period
(Up ¥
12,752 million from previous period)
Trends in Assets, Liabilities and Net AssetsTrends in Assets, Liabilities and Net Assets

Copyright THK CO.,LTD.2010. All rights reserved.
22.. Management Strategy ForwardManagement Strategy Forward

8Copyright THK CO.,LTD.2010. All rights reserved. 8
●Cash Management
Keywords
●Protectionism
Survival Stage Revival Stage
●Carbon Offset
Current Management EnvironmentCurrent Management Environment
Current Position
<< Response to THK >>
Globalization
New BusinessesIncreasing the rate of numerical-controlled
Demand expands in a mid/long term. Demand expands in a mid/long term. But aBut a careful steer is necessary for the short term. careful steer is necessary for the short term.
machine tools made in developing countries
<< Growth Driver >>
9Copyright THK CO.,LTD.2010. All rights reserved.
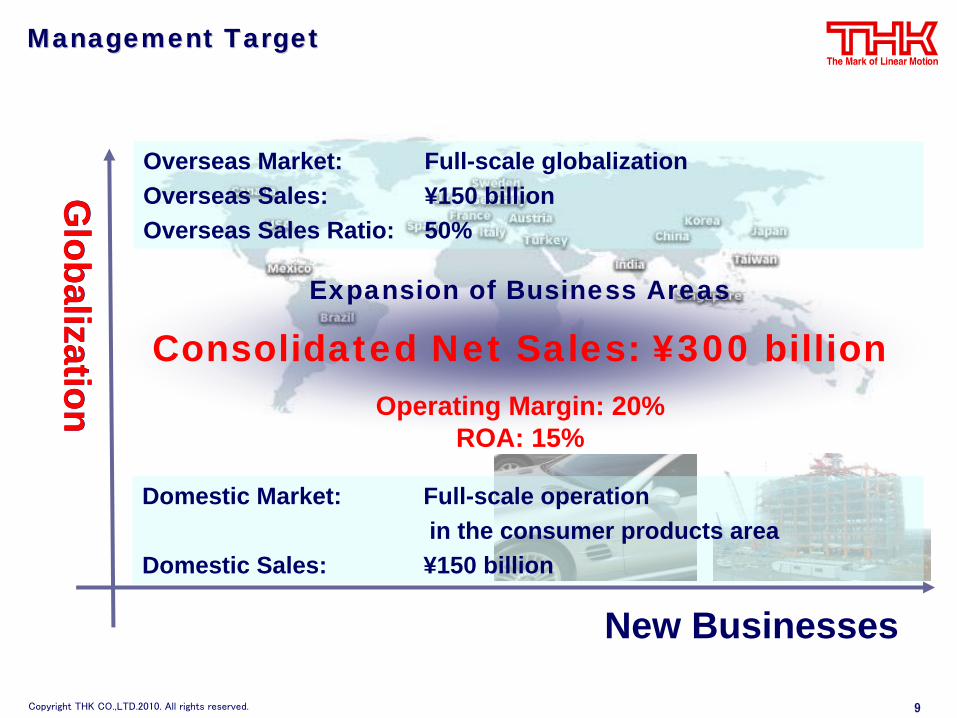
Globalization
New Businesses
Consolidated Net Sales: ¥300 billion
Overseas Market: Full-scale globalizationOverseas Sales: ¥150 billionOverseas Sales Ratio: 50%
Domestic Market: Full-scale operationin the consumer products area
Domestic Sales: ¥150 billion
Expansion of Business Areas
Operating Margin: 20%ROA: 15%
Management TargetManagement Target
Globalization

Copyright THK CO.,LTD.2010. All rights reserved. 10
Business Deployment in AsiaBusiness Deployment in Asia
GD
P
Population
4,909 billionsof dollars
1,328millions of people
1,236billions
1,118millions
182billions4
millions
263billions
66millions
96billions
87millions
832billions49
millions
3,678dollars
GDP per Capita
3,940dollars
37,293dollars
128millions
39,731dollars
17,074dollars
1,060dollars
16,392dollars
5,068billions
IndiaSales :
1(Bangalore)-THK plans to establish
two new business bases.
SingaporeSales :
1ThailandSales :
1 (New establishment)Manufacturing : 1
VietnamManufacturing :
1
KoreaSales :
13Manufacturing :
1
JapanSales :
49Manufacturing :
14
TaiwanSales :
3
(Reference: JETRO and Cabinet Office)
ChinaSales :
19Manufacturing :
4
Manufacturing SalesSales (planning)
24millions
378billions
1,031dollars
11Copyright THK CO.,LTD.2010. All rights reserved.
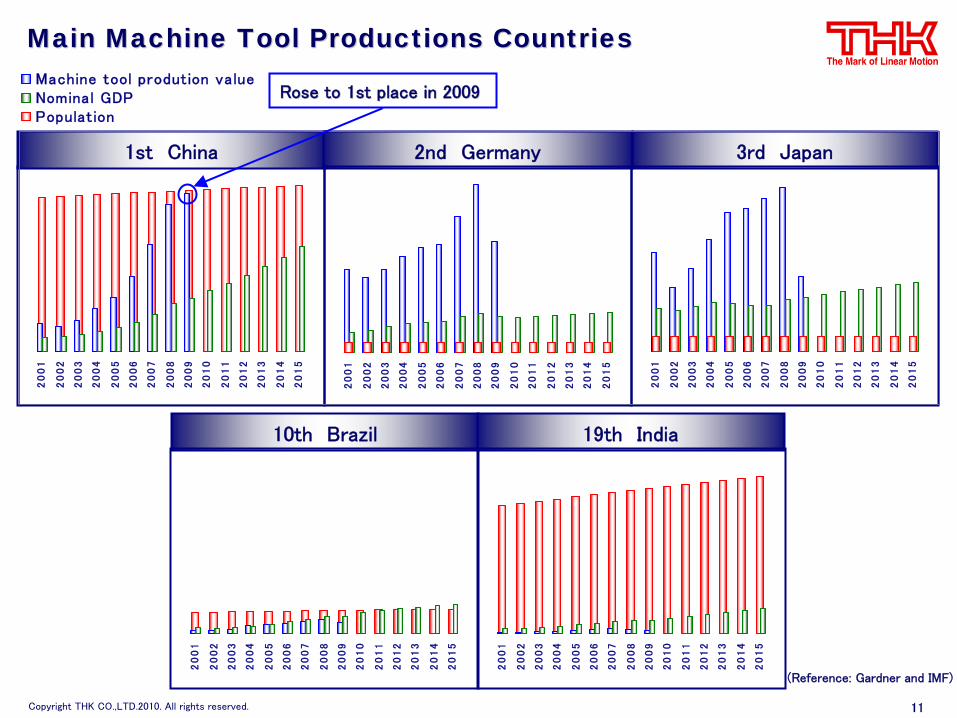
Main Machine Tool Productions CountriesMain Machine Tool Productions Countries2
00
1
20
02
20
03
20
04
20
05
20
06
20
07
20
08
20
09
20
10
20
11
20
12
20
13
20
14
20
15
1st
China 2nd
Germany 3rd
Japan
10th
Brazil 19th
India
20
01
20
02
20
03
20
04
20
05
20
06
20
07
20
08
20
09
20
10
20
11
20
12
20
13
20
14
20
15
20
01
20
02
20
03
20
04
20
05
20
06
20
07
20
08
20
09
20
10
20
11
20
12
20
13
20
14
20
15
20
01
20
02
20
03
20
04
20
05
20
06
20
07
20
08
20
09
20
10
20
11
20
12
20
13
20
14
20
15
20
01
20
02
20
03
20
04
20
05
20
06
20
07
20
08
20
09
20
10
20
11
20
12
20
13
20
14
20
15
Rose to 1st place in 2009 Rose to 1st place in 2009
(Reference: Gardner
and IMF)
Machine tool prodution valueNominal GDPPopulation

12Copyright THK CO.,LTD.2010. All rights reserved.
Expansion of SalesExpansion of Sales,, Manufacturing and Development Manufacturing and Development Network in ChinaNetwork in China
SHANGHAI
BEIJING
WUHAN
GUANGZHOU
CHENGDU
XIAN
SHENYANG
NINGBO
SHENZHEN
WUXI
HANGZHOU
JINAN
TIANJIN
NANJING
KUNMING
CHONGQING
QINGDAO
DALIAN
SUZHOU
XIAMEN
THK China
New Establishment Plan
THK WUXI
THK LIAONING
DALIAN THK
RHYTHM GUANGZHOU
Manufacturing
Development
Established by October 2010
Sales
DONGGUAN
13Copyright THK CO.,LTD.2010. All rights reserved.
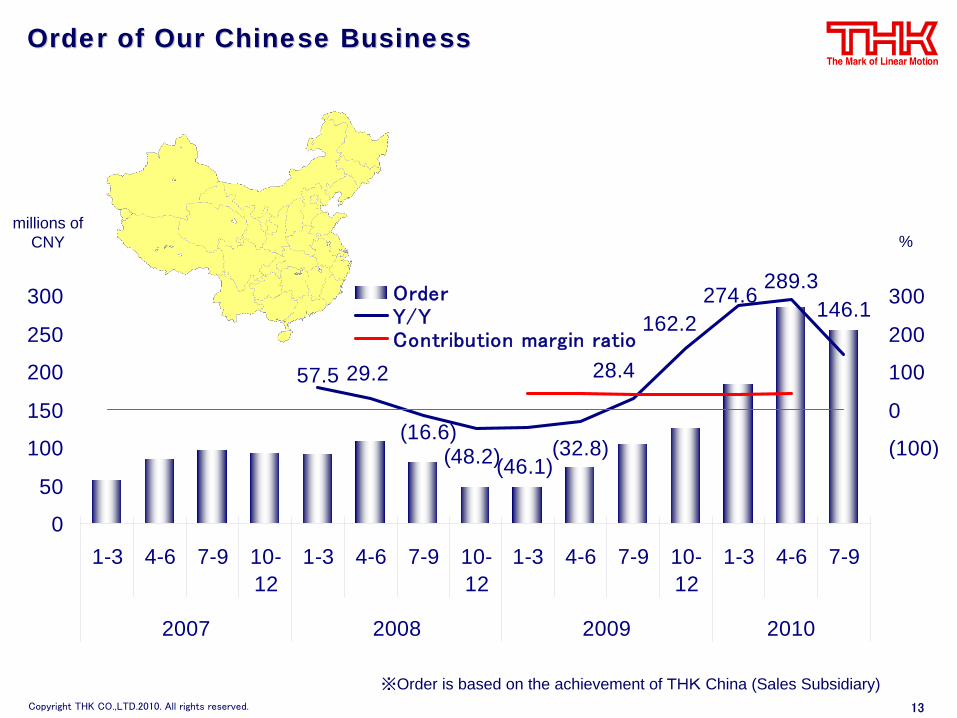
Order of Our Chinese BusinessOrder of Our Chinese Business
%
※Order is based on the achievement of THK
China (Sales Subsidiary)
(16.6)
274.6
(32.8)
162.2
(48.2)
146.1289.3
28.429.257.5
(46.1)
0
50
100
150
200
250
300
1-3 4-6 7-9 10-12
1-3 4-6 7-9 10-12
1-3 4-6 7-9 10-12
1-3 4-6 7-9
2007 2008 2009 2010
(300)
(200)
(100)
0
100
200
300OrderY/YContribution margin ratio
millions ofCNY
14Copyright THK CO.,LTD.2010. All rights reserved.
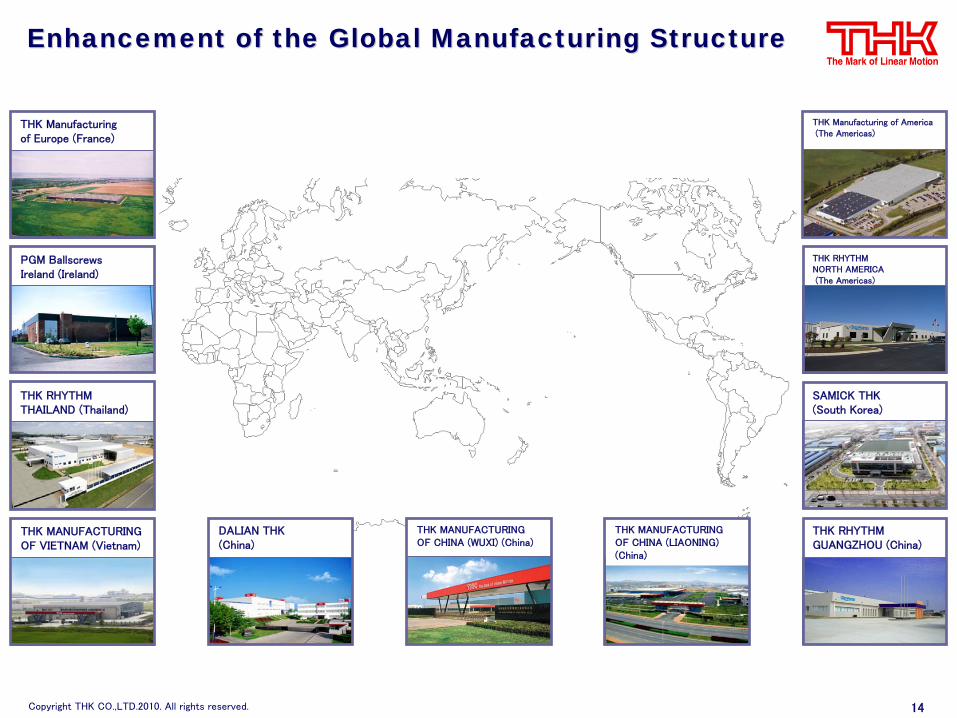
THK RHYTHMTHAILAND (Thailand)
THK Manufacturingof Europe (France)
PGM BallscrewsIreland (Ireland)
THK MANUFACTURINGOF VIETNAM (Vietnam)
THK RHYTHM GUANGZHOU (China)
SAMICK THK(South Korea)
THK RHYTHM NORTH AMERICA(The Americas)
THK Manufacturing of America(The Americas)
DALIAN THK(China)
THK MANUFACTURING OF CHINA (WUXI) (China)
THK MANUFACTURING OF CHINA (LIAONING) (China)
Enhancement of the Global Enhancement of the Global ManufacturingManufacturing StructureStructure
15Copyright THK CO.,LTD.2010. All rights reserved.
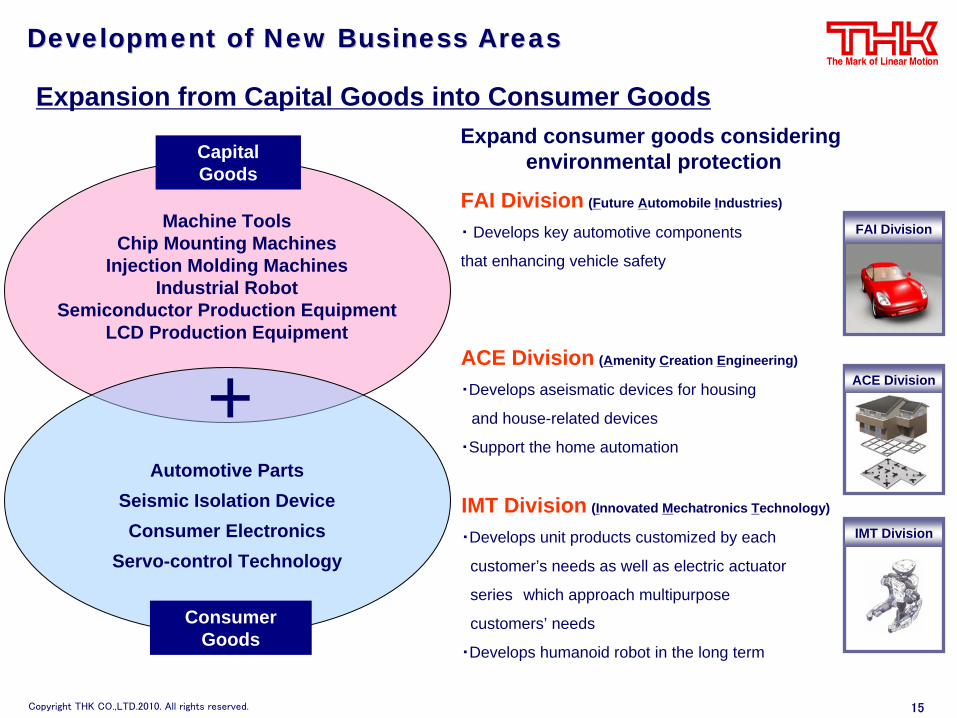
Machine ToolsChip Mounting Machines
Injection Molding MachinesIndustrial Robot
Semiconductor Production EquipmentLCD Production Equipment
Automotive PartsSeismic Isolation DeviceConsumer Electronics
Servo-control Technology
CapitalGoods
Consumer Goods
+IMT Division (Innovated Mechatronics Technology)
・Develops unit products customized by each
customer’s needs as well as electric actuator
series which approach multipurpose
customers’ needs
・Develops humanoid robot in the long term
FAI Division (Future Automobile Industries)
・
Develops key automotive components
that enhancing vehicle safety
ACE Division (Amenity Creation Engineering)
・Develops aseismatic devices for housing
and house-related devices
・Support the home automation
Development of New Business AreasDevelopment of New Business Areas
FAI Division
ACE Division
Expand consumer goods considering environmental protection
Expansion from Capital Goods into Consumer Goods
IMT Division

16Copyright THK CO.,LTD.2010. All rights reserved. 16
Development of FAI Development of FAI DDivisionivision
FAI Division
Sales Engineering
Production Control
Engineering (Test and Research)Process Engineering
Gifu Plant
THK Manufacturing of America
THK Manufacturing of Europe
THK RHYTHM KYUSHU
THK RHYTHM NORTH AMERICA
THK RHYTHM GUANGZHOU
THK RHYTHM (THAILAND)
Production FunctionManagement FunctionHeadquarters of THK RHYTHM
Expansion of the Sales of Ball Joint parts Expansion of Application of Liner Motion Systems in Vehicles
Global Sales Network of THK Group THK Engineering and Development Department
Consolidate into THK RHYTHM for strengtheningConsolidate into THK RHYTHM for strengthening
Company name change

Copyright THK CO.,LTD.2010. All rights reserved.
33.. Fiscal Year Ending March 201Fiscal Year Ending March 20111 Financial ForecastFinancial Forecast
18Copyright THK CO.,LTD.2010. All rights reserved.
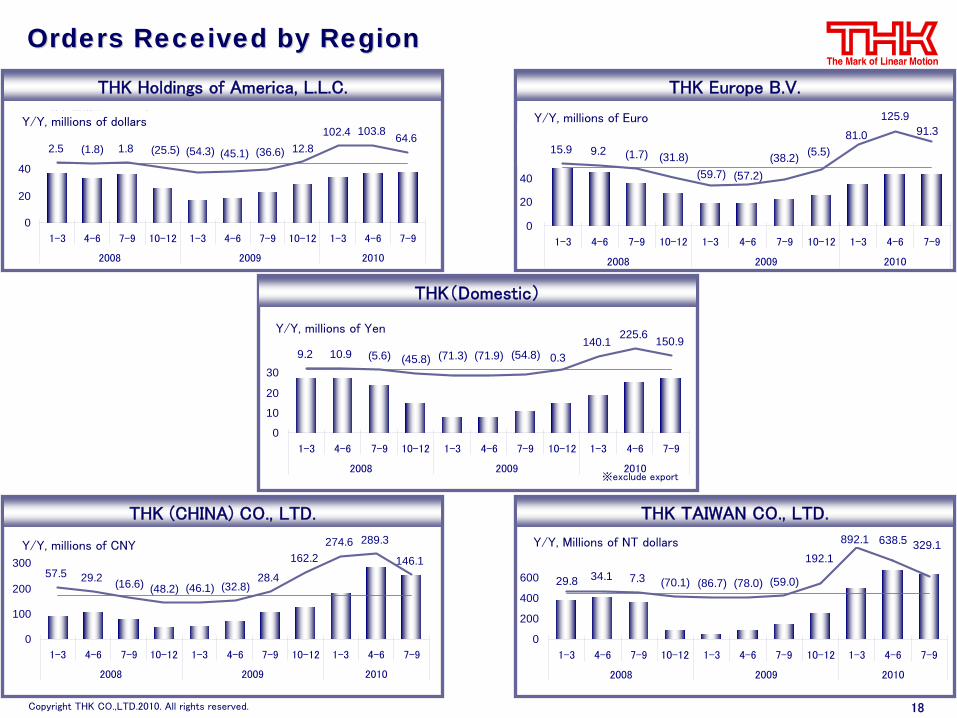
※exclude export
THK(Domestic)
THK
Holdings of America, L.L.C. THK
Europe B.V.
THK
TAIWAN CO., LTD.THK
(CHINA) CO., LTD.
Orders Received by RegionOrders Received by Region
(59.0)
638.5192.1
29.8 34.1 7.3
329.1
(78.0)(86.7)(70.1)
892.1
0
200
400
600
800
1-3 4-6 7-9 10-12 1-3 4-6 7-9 10-12 1-3 4-6 7-9
2008 2009 2010
前年同期比、100万台湾ドル
(54.8)(71.9) 0.3150.9225.6
(71.3)(45.8)(5.6)10.99.2140.1
0
10
20
30
40
50
1-3 4-6 7-9 10-12 1-3 4-6 7-9 10-12 1-3 4-6 7-9
2008 2009 2010
前年同期比、10億円
2.5 (1.8) 1.8102.4 103.8 64.6
(36.6)(45.1)(54.3)(25.5) 12.8
0
20
40
60
1-3 4-6 7-9 10-12 1-3 4-6 7-9 10-12 1-3 4-6 7-9
2008 2009 2010
前年同期比、100万ドル
9.2 (1.7) (31.8)(59.7) (57.2)
81.0
125.991.3
15.9 (5.5)(38.2)
0
20
40
60
80
1-3 4-6 7-9 10-12 1-3 4-6 7-9 10-12 1-3 4-6 7-9
2008 2009 2010
前年同期比、100万ユーロ
274.6
(48.2) (46.1) (32.8)
146.1
(16.6)29.257.5162.2
289.3
28.4
0
100
200
300
400
1-3 4-6 7-9 10-12 1-3 4-6 7-9 10-12 1-3 4-6 7-9
2008 2009 2010
前年同期比、100万元
Y/Y, millions of dollars Y/Y, millions of Euro
Y/Y, millions of Yen
Y/Y, millions of CNY Y/Y, Millions of NT dollars

19Copyright THK CO.,LTD.2010. All rights reserved.
-
2010.3
FY2011.3 1H2011.3 FY
-
5,706
-
8,755
-
9,565
+94.3%
92,120
(Result)
-
11,700
-
18,300
-
19,300
+64.7%
190,000
(Revised Nov. Forecast)
-14,30010,600Net Income
-35.7%+57.8%Y/Y
--Y/Y
--Y/Y
-Y/Y
-8,79717,300Ordinary Income
-9,50817,600Operating Income
115,330182,000Net Sales
(Result)(Revised Aug.
Forecast)
Financial Forecast (Consolidated)Financial Forecast (Consolidated)

21Copyright THK CO.,LTD.2010. All rights reserved.
Strategy for Growth of THKStrategy for Growth of THK
Development of New Business AreasDevelopment of New Business Areas
Full S
cale
Glo
balizatio
nFull S
cale
Glo
balizatio
n
Consolidated Sales¥ 300 billion
ROA15%
ACE Division
IMT Division
FAI Division
Expansion of Sales Network
In Developing country
P25 Project

22Copyright THK CO.,LTD.2010. All rights reserved.
Support Statement Support Statement ––Trends in orders, sTrends in orders, sales and backlogales and backlog ((domesticdomestic・・unconsolidatedunconsolidated))
––
(Millions of yen)
0
5,000
10,000
15,000
20,000
25,000
30,000
Orders
Sales
Backlog
Orders 10,594 13,709 15,204 14,678 16,358 17,699 17,989 21,394 23,645 26,668 24,637 22,435 21,885 24,383 25,017 28,370 27,721 28,466 26,370 26,099 24,907 25,067 25,371 27,509 27,201 27,794 23,950 14,913 7,809 7,815 10,818 14,953 18,753 25,450 27,147
Sales 11,298 12,745 14,651 15,007 15,960 17,532 17,885 19,507 22,138 24,747 25,845 22,375 22,192 23,582 24,318 25,986 27,760 28,077 27,176 27,116 25,988 24,923 24,320 27,077 27,081 26,048 25,524 19,834 11,473 7,787 10,698 13,726 17,209 20,942 23,922
Backlog 4,834 5,797 6,350 6,021 6,420 6,587 6,691 8,578 10,084 12,005 10,797 10,857 10,551 11,352 12,052 14,436 14,398 14,787 13,981 12,964 11,883 12,027 13,078 13,511 13,631 15,378 13,804 8,883 5,219 5,247 5,367 6,594 8,138 12,645 15,870
1-3 4-6 7-9 10-12 1-3 4-6 7-9 10-12 1-3 4-6 7-9 10-12 1-3 4-6 7-9 10-12 1-3 4-6 7-9 10-12 1-3 4-6 7-9 10-12 1-3 4-6 7-9 10-12 1-3 4-6 7-9 10-12 1-3 4-6 7-9
2002 2003 2004 2005 2006 2007 2008 2009 2010

23Copyright THK CO.,LTD.2010. All rights reserved.
Support StatementSupport Statement ––Trends in orders classified Trends in orders classified by industry by industry (unconsolidated(unconsolidated))––
(Millions of yen)
0
1,000
2,000
3,000
4,000
5,000
6,000
7,000
8,000
9,000
Machine tool
General Machinery
Electronics
Machine tool 1,263 1,589 1,651 1,892 1,978 2,164 1,994 2,421 2,624 2,956 3,157 3,252 3,304 3,435 3,493 3,376 3,409 3,757 3,685 3,769 3,658 3,926 3,925 3,965 3,727 3,635 3,263 1,319 527 535 846 1,612 2,164 3,443 4,020
General Machinery 1,819 2,655 2,745 2,758 3,377 3,723 3,898 4,461 4,340 4,818 4,353 4,267 4,085 4,735 4,598 4,997 4,970 5,486 4,825 4,664 4,217 4,581 4,603 4,833 4,835 4,942 3,969 2,219 1,091 1,268 1,654 2,445 3,216 4,730 4,627
Electronics 1,725 2,857 3,428 2,893 3,047 3,596 3,346 5,048 5,803 7,113 5,862 4,483 4,198 4,730 5,059 7,947 6,916 6,593 5,745 5,351 5,515 5,600 5,812 6,149 5,657 5,984 5,159 2,809 1,514 1,315 2,406 3,763 4,127 5,372 6,394
1-3 4-6 7-9 10-12 1-3 4-6 7-9 10-12 1-3 4-6 7-9 10-12 1-3 4-6 7-9 10-12 1-3 4-6 7-9 10-12 1-3 4-6 7-9 10-12 1-3 4-6 7-9 10-12 1-3 4-6 7-9 10-12 1-3 4-6 7-9
2002 2003 2004 2005 2006 2007 2008 2009 2010