interim financial stability report 2020 - central bank of
TRANSCRIPT

INTERIM FINANCIAL STABILITY REPORT 2020

© Central Bank of Malta, 2020
AddressPjazza KastiljaValletta VLT 1060Malta
Telephone(+356) 2550 0000
Fax(+356) 2550 2500
Website www.centralbankmalta.org
E-mail [email protected]
Photo creditsShutterstock
All rights reserved. Reproduction is permitted provided that the source is acknowledged.
The Interim Report covers the first six months of 2020 and evaluates developments which may impact the resilience of the domestic financial system since the publication of the Financial Stability Report 2019. It also analyses whether any new risks have emerged. The Interim Financial Stability Report is prepared by the Financial Stability Department and is subsequently reviewed and endorsed by the Financial Stability Com-mittee of the Central Bank of Malta.
The cut-off date for information relating to banking, insurance and investment funds is 28 August 2020 unless otherwise specified. The source of data in tables and charts is the Central Bank of Malta unless otherwise indicated.
ISSN 2312-5918 (print)ISSN 2074-2231 (online)

CONTENTS 1. MACROPRUDENTIAL RISK ASSESSMENT AND POLICY RESPONSE 5
2. DEVELOPMENTS IN THE BANKING SECTOR 15 2.1 Core Domestic Banks 16 2.2 Non-Core Domestic Banks 19 2.3 International Banks 21
3. STRESS TESTS 25 3.1 Macro Stress Testing Framework 26 3.2 Liquidity Stress Testing Framework 31 3.3 Interest Rate Risk in the Banking Book 33
4. INSURANCE COMPANIES AND INVESTMENT FUNDS 35 4.1 Domestic Insurance Companies 36 4.1.1 The Domestic Life Insurance Companies 36 4.1.2 The Domestic Non-life Insurance Companies 38 4.1.3 The Domestic Insurance Risk Outlook 40 4.2 Domestic Investment Funds 40 4.2.1 Risk Assessment 42 4.2.2 Risk Outlook 43
APPENDIX: Financial Soundness Indicators – Banking Sector 45

ABBREVIATIONS AIF Alternative Investment Funds AMC amortised costAML/CFT anti-moneylaundering/combatingthefinancingofterrorismARB Asset Recovery BureauAUM Assets under ManagementBCBS Basel Committee on Banking SupervisionBLS Bank Lending SurveyBR Banking RuleBRRD Bank Recovery and Resolution DirectiveCBC counterbalancing capacityCBM Central Bank of MaltaCCyB CountercyclicalCapitalBufferCET1 Common Equity Tier 1CFIML captivefinancialinstitutionsandmoneylendersCIU Collective Investment UndertakingsCRD Capital Requirements Directive CRR Capital Requirements RegulationDAX Deutscher AktienindexDSTI-O debt-service-to-income at origination EA euro areaEBA European Banking AuthorityECL expected credit lossECB European Central BankEP European ParliamentEU European UnionESRB European Systemic Risk Board FIAU Financial Intelligence Analysis Unit FSR Financial Stability Report FV fair valueFX foreign exchangeGDP gross domestic productHQLA high-quality liquid assetsIFRS International Financial Reporting StandardsLCR liquidity coverage ratioLTV-O loan-to-value at originationMBR Malta Business RegisterMFI monetaryfinancialinstitutionMFSA Malta Financial Services AuthorityMGA Malta Gaming AuthorityMGS Malta Government Stocks MMF money market fundsMREL minimum requirements for own funds and eligible liabilitiesMSE Malta Stock ExchangeMST macro stress testingNAV net asset valueNFC non-financialcorporationsNII net interest incomeNNII net non-interest incomeNPISH non-profitinstitutionsservinghouseholdsNPL non-performing loansO-SIIs other systemically important institutions OCR overall capital requirementOFI otherfinancialintermediariesP&L profitandlossaccountPDW persistent deposit withdrawalsPIF Professional Investor FundRHS right-hand scaleROA return on assets ROE return on equityRWA risk-weighted assets SBS security by securitySCR Solvency Capital RequirementSDW Statistical Data Warehouse SME small and medium-sized enterprise SRB Systemic Risk BoardSRMR Single Resolution Mechanism RegulationSREP Supervisory Review and Evaluation ProcessSyRB systemicriskbufferS&P 500 Standard and Poor’s 500TSCR total SREP capital requirementUCITS Undertakings for the Collective Investment in Transferable SecuritiesUK United Kingdom US United States of America

1. Macroprudential Risk Assessment and Policy
Response

6
CENTRAL BANK OF MALTA Interim Financial Stability Report 2020
1. MACROPRUDENTIAL RISK ASSESSMENT AND POLICY RESPONSE
In the first half of 2020, the global economy was severely impacted by the unprecedented restrictionsimposed on activity to counter the spread of the COVID-19 pandemic. Measures put in place by govern-mentstolimitthetransmissionoftheviruscoupledwithacollapseinconsumerandbusinessconfidencehave inevitably led to a steep contraction in economic activity.1Atthesametime,thedriveforsocialdistanc-ing and contactless ways to conduct activities and payments have created new business opportunities for someeconomicsectorsbutalsothepotentialforincreasedcyberthreats,drivingupoperationalcostsanddemandformorehighly-skilledstaff.
Geopoliticaltensions,particularlybetweentheUnitedStatesandChinapersisted,whilenegotiationsonBrexitbetweentheEuropeanUnionandtheUnitedKingdomhavenotbeenconcluded.Inaddition,theNovember2020USpresidentialelectionheighteneduncertainty,especiallyconcerningfuturepolicydirec-tion.
TheeuroarearealGDPdecreasedbyanannual14.8%inthesecondquarterof2020,whichrepresentsarecorddropinasinglequarter,withtheunemploymentratealsodeterioratingby0.4percentagepointto7.7%.Theeuroareaeconomyisforecastedtocontractby8.7%in2020beforegrowingby6.1%in2021,thoughtheseforecastsaresubjecttogreatuncertaintyandsignificantrisksrelatedtotheuncertainevolutionof the virus spread.2Malta’seconomicactivityalsocontractedinthesecondquarteroftheyear,withrealGDPdownby16.2%,asinternationalpassengertravelpracticallycametoastand-still.Wholesaleandretailtrade,andthetransportationandstoragesectorswerealsoadverselyhitwithpartiallockdownmeasures.Thishadatollonthelabourmarket,withtheunemploymentraterisingmarginallyto4.3%,butwithasharpdrop in the average hours worked for the bulk of the workforce. Malta’s economy is forecasted to contract by 6.6%in2020,beforegrowingby6.1%in2021.3 Underpinning these forecasts is the assumption of gradual recoveryofthelocalandforeigneconomiesandtheeventualdevelopmentofavaccine,whichcouldallhelpinrestoringmarketconfidence.
During thefirsthalfof2020, theeconomicsentimentwithin theeuroareadeterioratedsignificantly (seeChart 1.1). In fact, byApril it hadalready dropped by around 36% as a consequence of the nega-tive impact that the pandemic had on economic activity. Investor sentiment also changed, with theS&P500 falling by 34% (by 1148.5 points to 2237.4 points) between February and March. However, inApril there were already signs of recoveryinfinancialmarketsdrivenby some corporations operating in sectors which benefited from thepandemic(suchasthehealthcare,communications and technology sectors) but especially due to the swift response of fiscal and mon-etarypolicy.Domestically,theMSEindex dropped between March and April as the virus started to spread
1 Thesemeasuresincludedfullorpartiallockdowns,restrictedtravellingthroughclosureorrestrictionsinports,andsocialdistancingmeasuresincludingthebanofmassgatheringeventsandclosureofentertainmentandcateringestablishments,amongothers.2 Source: https://ec.europa.eu/commission/presscorner/detail/en/ip_20_12693 https://www.centralbankmalta.org/economic-projections
-50
-40
-30
-20
-10
0
10
20
January February March April May June
S&P500 MSE Economic Sentiment Indicator (MT) Economic Sentiment Indicator (EA)
Chart 1.1MONTHLY CHANGES IN EQUITY MARKETS AND ECONOMIC SENTIMENT INDICATORS(per cent)
Sources: EuroStat; Malta Stock Exchange and SPglobal.com.

7
CENTRAL BANK OF MALTA Interim Financial Stability Report 2020
locally,butthedropwasmilderincomparisontoothermajorstockmarkets.Insubsequentmonths,theMSEindex recovered some of the losses.
Varioussupportivemeasureswereimplementedacrossanumberofcountriestoshoreupeconomicactivity,includinggovernmentguaranteesforbankstolend,moratoriaandfiscalincentivestocitizensandselectedeconomicsectors.Allthesehaveraisedsovereigndebtlevels,withtheeuroareagovernmentdebtstandingat95.1%ofGDPbyJune2020,upfrom84%inend2019.4Similarly,duringthefirsthalfof2020,thenetMGSissuedbytheMalteseTreasuryamountedtoaround€245milliontofinancethesemitigationmeasures,projected to push up government debt to 56% of GDP at the end of 2020 – up from 42.6% in 2019. Private sectorindebtednessedgedhigherforbothhouseholdsandNFCs,althoughwhenexpressedasashareofGDP these remained at a more contained level than the euro area average.
ThespreadofCOVID-19hadasevereadverseimpactonthefinancialperformanceoftheglobalbankingindustry.Domesticbankswerealsohitasimportanteconomicsectorscametoavirtualhaltinthefirsthalfoftheyear,consumerspendingdeclined–withrepercussionsonconsumercredit,whilemortgagessloweddownasthepropertymarketcametoastandstillowingtoatemporarysuspensionoflegaltime.Asaresult,residentcreditgrowthsloweddownto2.7%,1.7percentagepointslowerthaninthesameperiodin2019.Ontheotherhand,whilethespreadofthepandemicforcedsomecorporatestoconsolidatetheiroperations,suchfirmsneededliquidityforworkingcapitalrequirements.Mostbanksgrantedmoreloanstocorporatesas theymet the increased demand, supported by theMaltaDevelopmentBank’sCOVID-19GuaranteeScheme.Thiswasreportedinsomeofthemostimpactedsectors,suchastheaccommodationandfoodserviceactivitiessector,withrelatedlendingincreasingby15.2%.
Thelow-for-longerinterestrateenvironmentcontinuestoputpressureontheprofitabilityofEuropeanfinan-cialinstitutions,eventhoughlowinterestrateshaveapositiveeffectonthefundingcostsofinstitutionsintimesofeconomicstress.TheprofitabilityofbankswasfurtheraffectedbytheCOVID-19spreadasincomesourcesdiminished.Indeed,thedeclineineconomicactivitycausedbythepandemichasaffectedbanks’earnings,operationsandcreditquality.SimilartoEuropeanbanks,inthefirsthalfoftheyear,coredomesticbankspostedsignificantdeclinesinnetprofitbeforetax,mainlyinducedbyasignificantdropinnon-interestincomeandincreasednetimpairmentcharges.Non-coredomesticbanks’profitabilityalmosthalved,whileinternationalbanks(excludingbranches)postedlowerpre-taxnetprofits.ThisresultedintheMaltesebanks’post-taxROEdroppingby3.3percentagepointsto3.5%,butremainedhigherthanthatreportedbyEuro-peanbanks,whichfellbyaround5.2percentagepointsto0.5%asofJune2020.5
Theimpactonassetqualitywasmorecontained,althoughachangeintrendwasobserved,withtheoverallNPLratiorisingmarginallyto3.2%.However,whenloanmoratoriagrantedbythebankstotheaffectedsectorsoftheeconomyend,NPLsareexpectedtoincreaseastherepaymentcapabilityofhouseholdsandprivatefirmswillbechallenged.Thisisespeciallyso,iftherecoveryineconomicactivitybecomesslowerthancur-rently projected due to a resurgence of the virus spread. A part of the increase in expected NPLs has already beenincorporatedinbanks’balancesheetastheirprovisionsincreasedby18.3%duringthefirstsixmonthsof2020.Notwithstanding,thebanks’capitalandliquidityremainedsoundwiththeCET1andLCRratiosforMaltesebanksstandingat24.0%and345.2%onaverage,respectively.Inthisregard,domesticbanksareexpectedtohavesufficientcapitalandliquiditybufferstowithstandlosseswithoutbreachingtheirregulatoryrequirements. This is further corroborated by the stress tests conducted by the Bank (see Chapter 3).
Theprofitability of thedomestically-relevant insurance corporationswasalso significantly impactedby thepandemic,mainlydrivenbyadropininvestmentandotherincometriggeredbyadversemarketmovements.Writtenpremiawerealsodented,withamarkedslowdowninnewbusiness.Whileremainingaboveregulatoryrequirements,thesolvencyratiofordomesticinsurerswasalsoimpacted.Thisratiofellbyabout37percentagepoints to around 190%, largely driven by developments within the life insurance sector. In conjunction,the prolonged low-yield environment also remains a key challenge for the insurance sector. Assets of the
4 Source: https://sdw.ecb.europa.eu/quickview.do?SERIES_KEY=325.GFS.Q.N.I8.W0.S13.S1.C.L.LE.GD.T._Z.XDC_R_B1GQ_CY._T.F.V.N._T5 Source:EBAriskdashboard,Q22020

8
CENTRAL BANK OF MALTA Interim Financial Stability Report 2020
domestically-relevantinvestmentfundscontracted,mainlyreflectinglowerequityanddebtsecuritiesholdings.Goingforward,thepotentialre-pricinginglobalriskpremiacouldbeconsideredasthemainchallengeforthissectorduetotheuncertaintysurroundingthepandemic,coupledwithgeopoliticalevents.However,locally-relevantfundshavereportedimprovedliquidityandleverageinthefirsthalfoftheyear.
Theeffectsofthepandemicwillcontinuetobefeltintheneartermasgovernmentsstrivetolimitthedamagecausedinsomesectors,notablytravelandtourism.Shouldthevirusspreadlinger,disruptionstoecono-miesarelikelytopersistfurther.Inthisregard,institutionsareencouragedtopreservecapital,whileatthesame time continue lending prudently and avoid unnecessary forbearance measures and thus continue to recogniseprovisionsinatimelymanner.Furthermore,institutionsshouldcontinuetomaintaintheirprudentinvestmentpracticesandimprovefurtherefficiencytoreducecosts,withoutcompromisingcapitalandliquid-itybuffers.
Table1.1belowhighlightsthekeyvulnerabilitiesofthedomesticfinancialsectorandhowtheyhaveevolvedsince 2019.
Table 1.1SUMMARY OF RISKS
Credit/Profitability Cyclical/ Structural ↑ ↑
Credit Structural ↔ ↔Credit Cyclical/
Structural ↑ ↑Contagion Structural ↔ ↔Contagion Structural ↑ ↔Profitability Cyclical ↑ ↑
Liquidity/Solvency/ Profitability
Cyclical/ Structural ↑ ↔
Credit/Solvency/ Profitability
Cyclical/ Structural ↑ ↑
Credit/Profitability Cyclical ↑ ↔Credit/Contagion Cyclical ↑ ↔
Profitability/Contagion Structural ↑ ↑Credit/Profitability Cyclical ↑ ↑
Contagion Structural ↔ ↑Profitability Cyclical ↑ ↔Profitability Cyclical ↑ ↔
↑↔↓
Medium Stable risk
Elevated Decreased risk
Geopolitical uncertainties
Prolonged low interest rate environment
Reassessment in risk premia
Risk position Direction of risk
Moderate Increased risk
Economic conditions in the euro area and public debt sustainability
The level of non-performing loans
Concentration in sectoral lending
Developments in bank credit
Interlinkages between banks and the non-bank financial sector
Operational risk
Domestically-relevant Insurances
Domestically-relevant Investment funds
Vulnerabilities outside the financial system
Domestic macroeconomic developments
Real estate market developments
Exposures of the financial sector to domestic sovereign
Developments related to income sources
Vulnerabilities within the financial system
Main vulnerabilities and risks for the financial system
Type of risk
Nature of risk
Change in risk level since FSR 2019
Risk assessment one year ahead

9
CENTRAL BANK OF MALTA Interim Financial Stability Report 2020
The Policy ResponseDomesticandEuropeanauthoritiescontinuedtomonitorcloselymacroeconomicandfinancialsectordevel-opmentsinMaltawithaviewtostepup,wherenecessary,themacroprudentialtoolkittopreventadverseeventsfrommaterialisingortomitigatetheireffectsonthestabilityofthefinancialsystem.
Thefollowingisasynopsisofthepolicyresponsesduringthefirsthalfof2020,includingrevisionsandexten-sionsofpreviouslyintroducedmeasures,withthefocusbeingonmeasuresofamacroprudentialnature.
Extension of CBM Directive No. 18 on Moratoria on Credit Facilities in Exceptional CircumstancesAs outlined in the 2019 Financial Stability Report (FSR), theBank issuedDirectiveNo.18 inApril2020,wherebyasix-monthmoratoriumonrepaymentsoncapitalandinterestwasofferedtoborrowerswhowerenegatively impacted by COVID-19. The deadline to apply for loan moratoria was originally set for 30 June 2020but inviewof theuncertaintysurroundingthe lengthof theCOVID-19pandemic, itwasdecidedtoamend the Directive and extend the application to 30 September 2020 in line with the EBA’s guidance. Concurrently,themoratoriumperiodofsixmonthsstartsfromthedateofapprovalofapplicationfornewmoratoria,whileextensionsstartfromthedayaftertheendofthefirstmoratoriumperiod.
Amendments to CBM Directive No. 16 on Borrower-based MeasuresInresponsetotheCOVID-19pandemic,theBankissuedanoticeon1June2020topostponethefully-phasedloan-to-valueratioatorigination(LTV-O)limitof75%applicabletoCategoryIIborrowers,byoneyear to July 2021; and to apply a temporary easing in the stressed debt-service-to-income ratio at origination (DSTI-O)limitfornewresidentialrealestateloansgrantedtobothCategoryIandCategoryIIborrowers,subject to conditions as stipulated in the Notice.6 The Bank granted the concession on the stressed DSTI-O ratio for a period of six months till 1 December 2020.
Identification of Other Systemically Important Institutions (O-SIIs)ThelatestBankdecisiononthefourdesignatedO-SIIsandtheircorrespondingcapitalbufferrates(resultingfrom the 2019 revised domestic O-SII methodology) remained unchanged during the period under review. Thecredit institutions identifiedasO-SIIs, togetherwith their respectivecapitalbuffer rates,areBankofVallettaGroup(2%),HSBCBankMaltaplc(1.5%),MeDirectGroupLtd(0.5%)andAPSBankplc(0.25%).7 TheO-SIIidentificationexerciseisundertakenonanannualbasisandthenextroundofresultsisexpectedto be published by Q1 2021.
Countercyclical Capital Buffer (CCyB)InaccordancewiththeBank’snotificationconcerningthedecisionontheapplicableCCyBrateforthefourthquarterof2020,cyclicalrisksremainedcontained,resultinginaCCyBrateof0%.8 This decision was sup-portedbydevelopmentsinthecredit-to-GDPgap,aswellasadditionalsupportingindicators,whichsug-gestednoexcessivecreditbuildupinthefinancialcycle.
Identification of material third countriesPursuanttotheESRBRecommendation2015/1onrecognisingandsettingcountercyclicalbufferratesforexposurestothirdcountries,theBankconductsanannualexercisewiththeaimofidentifyingthematerialthird countries to which the domestic banking sector is exposed.9 In line with the methodology prescribed inArticle4oftheESRBDecision2015/3,theUnitedStates,UnitedArabEmiratesandRepublicofTurkey
6 Link: https://www.centralbankmalta.org/en/news/79/2020/88237 BankofVallettaGroup,HSBCBankMaltaplcandMDBGroupLtdwerepreviouslyidentifiedasO-SIIsandhavebeenreconfirmedwhileAPSBankplcwasidentifiedasanewdomesticO-SII.Inlinewithestablishedpractice,APSBankplcwasgrantedatransitoryperiodtobuildthenecessaryO-SIIbuffer.ThistransitoryperiodisspecifiedintheapplicableyearlyStatementofDecision.https://www.central-bankmalta.org/systemically-important-institutions8 Source: https://www.centralbankmalta.org/countercyclical-capital-buffer9 ESRB/2015/1:RecommendationoftheESRBof11December2015onrecognisingandsettingcountercyclicalbufferratesforexpo-sures to third countries.

10
CENTRAL BANK OF MALTA Interim Financial Stability Report 2020
arethethreethirdcountrieswhichhavebeenidentifiedasmaterialforMaltaforthe2020Q2–2021Q2period.10,11
Voluntary reciprocation of macroprudential measuresIn response to the ESRB Recommendation on the assessment of cross-border effects of and voluntary reci-procity for macroprudential policy measuresandinlinewithitsinternalpolicyframework,theBankanalysesthe measures recommended for reciprocation by other EU Member States.12 No additional new measures were recommended for reciprocation by the ESRB until Q2 2020. The Bank maintained its non-reciprocation stanceafterreassessingthemeasuresrecommendedforreciprocationinthepreviousyears,bytheBelgian,Swedish,FinnishandFrenchauthorities.Forfurtherinformation,refertotheCBMFinancial Stability Report of 2019.13
Main MFSA Circulars and Related European Regulatory DevelopmentsHereunderisalistofcircularsissuedbytheMFSAin2020withaparticularfocusonthosethathavefinancialstability implicationsandaddressCOVID-19relatedissues.Whereapplicable,referencetorelatedEuro-pean regulatory developments is also made under this section.
Circular to Financial Institutions authorised in terms of the Financial Institutions Act on Contingency Pre-paredness in the Context of Coronavirus (COVID-19)Bymeansofthiscircular,theMFSAemphasisedtheneedforfinancialinstitutionstoensuretheiroperationalpreparedness tominimise thepotentialadverseeffectsof thespreadofCOVID-19,by takingallactionsnecessarytorespondtothepandemicscenario.Inthisregard,financialinstitutionswererequiredtoinformtheMFSAofanyadversechangeincustomerbehaviour,imminentdifficultiesinensuringthecontinuityofservices and to inform the MFSA should contingency plan/s be activated.
Circular to credit institutions on the issuance of a new Banking Rule (BR/23)On6July2020,theMFSAissuedanewBankingRule(BR/23)whichaimstoimplementtheprovisionsandrequirements stipulated in the EBA Guidelines on reporting and disclosure of exposures subject to measures applied in response to the COVID-19 crisis (EBA/GL/2020/07).14InaccordancewiththisRule,creditinstitu-tions are obliged to regularly report information relating to: i) exposures that are subject to payment mora-toria,ii)exposuresthataresubjecttootherforbearancemeasuresintroducedinresponsetotheCOVID-19crisis,and iii)newly-originatedexposuressubject to theMaltaDevelopmentBankCOVID-19GuaranteeScheme.15ThisRulebecameeffectiveuponitspublication.
Circular to credit institutions on the extension to the restriction on dividend distributions or share buybacks and variable remunerationThiscircularmakesreferencetotheECBRecommendationECB/2020/35,which,againstthebackdropofheightenedeconomicuncertaintyduetoCOVID-19,repealedandextendeditspreviousrecommendationtocredit institutionsondividenddistributions,sharebuy-backsandvariableremunerationuntil1January2021.16Throughthiscircular,theMFSAdeclaredthattheabove-mentionedRecommendationistoapplyinits entirety to all domestic credit institutions from the date of publication and at least until 1 January 2021.17
10 ESRB/2015/3: Decision of the ESRB of 11 December 2015 on the assessment of materiality of third countries for the Union’s banking systeminrelationtotherecognitionandsettingofcountercyclicalbufferrates.11 https://www.centralbankmalta.org/reciprocity12 ESRB/2020/9: Recommendation of the ESRB of 2 June 2020 amending Recommendation ESRB/2015/2 on the assessment of cross-bordereffectsofandvoluntaryreciprocityformacroprudentialpolicymeasures.13 Central Bank of Malta Twelfth Financial Stability Report 2019. 14 EBA Guidelines of 2 June 2020 on reporting and disclosure of exposures subject to measures applied in response to the COVID-19 crisis (EBA/GL/2020/07). 15 Exposures that that are subject to payment moratoria are in accordance with the Moratorium on Credit Facilities in Exceptional Circum-stancesRegulations,2020(L.N.142of2020) and the Central Bank of Malta Directive No. 18 on Moratoria on Credit Facilities in Exceptional Circumstances.16 https://eur-lex.europa.eu/legal-content/EN/TXT/HTML/?uri=CELEX:52020HB0035&from=EN17 https://www.mfsa.mt/wp-content/uploads/2020/07/Circular-to-Credit-Institutions-on-the-Extension-to-the-Restriction-on-Dividend-Dis-tributions-or-Share-Buy-backs-and-Variable-Remuneration.pdf

11
CENTRAL BANK OF MALTA Interim Financial Stability Report 2020
Circular to Credit Institutions on IFRS9 in the context of the COVID-19 pandemicPursuanttotheECBpressreleasepublishedon20March2020,andtheEBAstatementissuedon25March2020,theECBissuedalettertoallbanksthatfallunderitsdirectsupervision,withtheaimtoprovidefurtherguidance on and references to the use of forecasts.18,19 The letter also refers to the avoidance of excessively procyclical assumptions in banks’ expected credit loss (ECL) estimations during the COVID-19 pandemic and recommends banks to use the IFRS9 transitional arrangements.20Tothisend,theMFSAissuedacir-cularon6April2020andspecifiedthatalldomesticcreditinstitutionsaretobeguidedbythecontentsofthe ECB letter.
Other European Regulatory Developments
Systemic Risk Board (SRB) Minimum Requirement for Own Funds and Eligible Liabilities (MREL) Policy 2020On20May2020,theSRBpublishedthefinalMRELpolicyinlinewiththenewBankingPackage.Indeed,this policy implements the changes introduced by the Bank Recovery and Resolution Directive 2014/59/EU (BRRD II); the Single Resolution Mechanism Regulation 806/2014/EU (SRMR II); and the Capital Require-mentsDirectiveandRegulation(CRDVandCRRII).TheupdatedMRELpolicycoversfourmainareas,namely the MREL calibration of resolution entities; their subordination requirements; internal MREL for non-resolution entities; and transition arrangements.21
EBA Final Guidelines on the appropriate subsets of exposures in the application of the systemic risk bufferAsperArticle133(6)oftheFifthCapitalRequirementDirective(CRDV),theEBAismandatedtoissueguidelines on the appropriate subsets of sectoral exposures towards which a relevant authority may applyasystemicriskbuffer.22,23WiththeintroductionofasectoralSyRB,therelevantauthoritieshavemore flexibility in using the SyRB to target systemic risk, including the application of such buffer tospecificsubsetsofthesesectors.Furthermore,theEBAGuidelinesmakereferencetothefactthatthestructuralelementhasbeenremovedfromtheSyRB’sdefinition,whichindicatesthattheSyRBcanalsobe used to address risks of a cyclical nature. The Guidelines also stipulate that a pre-condition when definingasubsetofsectoralexposuresintheapplicationofasectoralSyRBisthesystemicrelevanceof the risks stemming from the subset of sectoral exposures. This is to be carried out on the basis of a qualitativeandquantitativeassessment,wherebyasetofimportantcriteriaaretobeconductedbytherelevant authority.24
EBA Guidelines on loan origination and monitoringTheEBAGuidelineson loanoriginationandmonitoring issuedon29May2020, laydown the internalgovernance arrangements for granting and monitoring of credit facilities throughout their lifecycle.25 The aimoftheGuidelinesistocertifythatrobustandprudentstandardsforcreditrisktaking,managementandmonitoringare inplaceinall institutions,andthatnewly-originated loansareofhighcreditquality.Furthermore,theobjectiveoftheGuidelinesisalsotoensurethatinstitutions’practicesarealignedwithconsumerprotectionrulesandAMLrequirements.Tothisend,theGuidelinespresentrequirementsforborrowers’ creditworthiness assessment and bring together the EBA’s prudential and consumer protection objectives.18 https://www.bankingsupervision.europa.eu/press/pr/date/2020/html/ssm.pr200320~4cdbbcf466.en.html19 The EBA statement issued on 25 March 2020relatestotheapplicationoftheprudentialframeworkregardingDefault,ForbearanceandIFRS9inlightofCOVID19measures,whereintheEBAhighlightedthatwhenapplyingtheIFRS9internationalaccountingstandard,creditinstitutions are expected to use a certain degree of judgement.20 ThesetransitionalarrangementsareputforwardinCRRArticle473a,wherebyinordertomitigatetheimpactofIFRS9,banksareal-lowed to add back to CET1 capital a part of the expected credit loss recognised in accounting terms.21 https://srb.europa.eu/sites/srbsite/files/srb_mrel_policy_2020.pdf22 Click here for more information.23 AspertheEBAGuidelines,whendefiningsubsetsofsectoralexposures,authoritiesaretoemploythefollowingthreedimensions:typeofdebtororcounterpartysector,typeofexposureandtypeofcollateral.Ifdeemedappropriate,dulyjustifiedandproportionate,therelevantauthoritiesmaysupplementthesedimensionswiththreeadditionalsub-dimensions:economicactivity,riskprofileandgeographicalarea.24 Thecriteriaaresize,riskinessandinterconnectedness.25 Click here for more information.

12
CENTRAL BANK OF MALTA Interim Financial Stability Report 2020
EBA phases out its Guidelines on legislative and non-legislative loan repayments moratoriaOn21September2020,theEBAannounceditsdecisiontoadheretotheGuidelines’stipulateddeadlineof30 September 2020.26Initsdecision,theEBAcitedtheeffectivenessoftheGuidelinesinassistingbankstomanagenumerousrequestsforcustomerstobenefitfrommoratoria,therebyprovidingimportantclarifica-tions on the treatment of COVID-19 related loan moratoria. These Guidelines have provided the necessary regulatoryflexibility,aswellascertaintytoaddressthesignificantnumberofactionstakenbybankstosup-port their customers as exceptional social restrictions measures were put in place.
ESRB Recommendation on monitoring the financial stability implications of debt moratoria, and public guarantee schemes and other measures of a fiscal nature taken to protect the real economy in response to the COVID-19 pandemicPursuant to ESRB Recommendation ESRB/2020/8,nationalmacroprudentialauthoritiesarerecommendedtomonitor and assess the financial stability implications of COVID-19 relatedmeasures taken by theirMemberStatestoprotecttherealeconomy,suchasdebtmoratoria,publicguaranteeschemesandothermeasuresofafiscalnature.Inthisregard,itisrecommendedthatrelevantauthoritiesmonitorthedesignfeaturesanduptakeofthesemeasures,aswellasthepossibleimplicationsforfinancialstabilityusingkeyindicators.Furthermore,authoritiesarealsorecommendedtoregularlyreporttotheESRBtheinformationnecessary for the ESRB to adequately conduct its monitoring.
Inexercisingitsoversighttasks,theBankiscarryingoutamonitoringassessmentoftheeffectivenessandimpact of the various measures introduced in Malta to protect the real economy from the COVID-19 pan-demicshock.InlinewiththeRecommendation,thisinformationisalsobeingregularlyreportedtotheESRBtofacilitateitsEUfinancialstabilityoversightrole.Onitspart,theESRBisevaluatingthelevelofcomplianceofnationalmacroprudentialauthorities,withthesaidrecommendation.
European Parliament approves easing of certain CRR rules to encourage banks to lend to compa-nies and householdsInJune2020,theEuropeanParliament(EP)announceditsapprovaloftheCRR“quick-fixes”,whichareaimed at easing the currently applicable rules of Regulation (EU) No 575/2013 (CRR). These easing mea-suresareintendedtopromotetheflowofcredittohouseholdsandbusinesses,therebyensuringthatthebankingsectorcanadequatelysupporttheeconomy,andbeinapositiontoabsorbCOVID-19pandemic-related losses. The temporary amendments were approved by the EP and include the following:
• Deferralof theapplicationof the leverage ratiobuffer fromJanuary2022 toJanuary2023 toallowbanks to increase the amount that they would be able to loan.
• Pensioners or employees with a permanent contract will be able to get a loan under more favourable prudential conditions. The loan will be backed by the borrower’s pension or salary.
• BringingforwardtheapplicationdateofamorefavourableSMEandinfrastructuresupportingfactor,allowing for a more favourable prudential treatment to promote credit towards such sectors.27
• Earlier implementation of the allowance to treat some software as their own capital to encourage banks to invest in software and digitalisation.
• Liquiditymeasuresprovidedbycentralbanksinacrisiscontextwillbeeffectivelychannelledbybankstotheeconomy,byexcludingexposurestowardscentralbanksfromtheleverageratiodenominator.
MONEYVALInOctober2020,MaltasubmitteditsfinalprogressreporttoMONEYVAL,highlightingtheprogressachievedinstrengtheningtheimplementationofanti-moneylaundering/combatingthefinancingofterrorism(AML/CFT)measures.Over thepastmonths,Maltahasbeencontinuouslymakingprogress inaddressingtherecommendationsmadebyMONEYVAL.InJune2020,theCashControlRegulationswereamendedtopro-videgreatercapacitytotheCommissionerofInlandRevenuetoseizecasharisingfromcriminaloffences.
26 https://eba.europa.eu/eba-phases-out-its-guidelines-legislative-and-non-legislative-loan-repayments-moratoria27 The SME supporting factor allows a ‘discount’ on the applicable capital requirements on loans granted to SMEs. This means that banks can free up capital resources that can be redeployed in the form of new loans and cheaper lending to SMEs.

13
CENTRAL BANK OF MALTA Interim Financial Stability Report 2020
Inthesamemonth,theMFSAintroducedarisk-basedapproachtosupervision,whichwillplaceprudential,conductandfinancial crime risksat thecentreofallMFSAactivity.28Subsequently, inAugust2020, theResidual Balances Fund Act was published with the objective of facilitating the dissolution and winding upprocessofasolventcreditinstitutionsand,concurrently,ensuringthatthenecessaryAML/CFTchecksarebeingadopted.Additionally,Malta’sagenciesandinstitutions,whichincludetheFinancialIntelligenceAnalysisUnit(FIAU),MFSA,MaltaGamingAuthority(MGA)andtheMaltaBusinessRegistry(MBR)haveundertakensignificantinvestment,bothfromaninfrastructuralandhumanresourcespointofview,toboosttheir respective AML capabilities. More measures are in the process of being introduced to further strengthen thefightagainstmoneylaundering.UpcomingchangesintheAssetRecoveryBureau(ARB)willintroduceasystemfornon-conviction-basedconfiscationthatwillmakeiteasierandfastertoconfiscateproceedsofcrimewhileempoweringtheARBtofilecivilproceedings.Inaddition,amendmentstotheCompanyServiceProvidersActwillsignificantlyincreasethepenaltiesforregulatorybreaches.Anewcashrestrictionpolicyisalso in the process of being introduced with the aim of limiting the use of cash in transactions related to the motorindustry,realestatesector,andinthesaleandacquisitionofpreciousmetalsandstones.TheBankwillcontinuetocontribute,withinitsremit,tostrengthenMalta’sAML/CFTregime.
28 https://www.mfsa.mt/news-item/the-mfsa-publishes-document-outlining-its-risk-based-approach-to-supervision/


2. Developments in the Banking Sector

16
CENTRAL BANK OF MALTA Interim Financial Stability Report 2020
2. DEVELOPMENTS IN THE BANKING SECTOR
2.1 Core Domestic BanksSimilar to theirEuropeanpeers, theCOVID-19spreadaffectednegatively theprofitabilityof thesixcoredomesticbanks,whichdeclinedsomewhatduringthefirsthalfof2020.Suchchallengesareexpectedtolinger as the timeframe for recovery much depends on the discovery of a vaccine and subsequent recovery inbusinessandconsumerconfidence.Furthermore,banksarealsograpplingwiththeeffectsofthelow-for-longerinterestrateenvironment.Inlightofthesedevelopments,thepost-taxROEandROAfellfrom6.7%and0.6% inDecember2019 to2.0%and0.2% inJune2020, respectively.Nonetheless,coredomesticbanks’performancewasbetterthanthatoftheirEuropeanpeers,whichreportedanaverageweightedROEandROAof0.5%and0.03%,respectively.1
Pre-taxprofitsdeclinedby63.6%to€72.5milliononthebackofhighernetimpairmentchargesof€56.5millionlargelyreflectingonebank’ssignificantincreaseinStage3provisions(seeChart2.1).2 Other banks have set higher Stage 1 and 2 provisions in a bid to mitigate the impact from any potential deterioration in borrowers’ creditworthiness as a result of the pandemic.3
Non-interestincome–whichcontractedby26.2%–alsodampenedprofitsasbanksreceivedlowerdividendincome from their subsidiariesandassociatedcompaniesas thesewerealsoadverselyaffectedby thepandemic,coupledwiththeirintentiontopreservecapitalinsuchstressfultimes.Thecorrectioninfinancialmarketsalsohitbanks’tradingprofits,wipingoutthe€8.3milliongainsrecordedin2019andleadingtoaloss of €1.5 million in June 2020. Fee and commission income declined by around 7% as lower business and consumer credit activity resulted in lower card usage and payments business. Net interest income (NII) contractedby1.8%,whichalsocontributedtothe10.7%declineingrossoperatingincome.NIIfrominter-mediationdeclinedby1.3%asinterestincomefellatafasterpacethaninterestexpenses.Similarly,otherNII – mainly from securities – fell by 6.4% as the decline in interest paid on securities issued was more than offsetbyadropinincomefromsecuritiesholdings.
Inabidtocontainthevirusspread,banks adopted unprecedented measures to meet the recommen-dationsofhealthauthorities,includ-ing enhanced health and safety measures and staff expensesrelated to support teleworking. Such increased costs were in part mitigated by lower costs as a num-ber of branches closed their doors and employees teleworked. Over-all non-interest expenses rose by 1.0%. The operational cost-to-income ratio deteriorated by 12.1 percentage points, to 78.4% inJune 2020 – driven by declining income – and surpassed the EU banks’ average of about 67%.4
1 Source: EBA Risk Dashboard2 Profitsarebasedonfour-quartermovingsum.3 ImpairmentstagesasdefinedinIFRS9. ‘Stage1’refersto impairmentestablishedonexpectedcredit losses(ECL)resultingfrompotentialdefaulteventswithinthenext12months.‘Stage2’referstoimpairmentsestablishedifthecreditriskincreasessignificantlysinceinitial recognition and is not considered as low. ‘Stage 3’ refers to impairment on credit-impaired assets.4 Source: EBA Risk Dashboard
-100-75-50-250255075100
0255075
100125150175200
Pre-
tax
prof
its 2
018
Pre-
tax
prof
its 2
019
Pre-
tax
prof
its H
1 20
20
NII
on in
term
edia
tion
Oth
er N
II
Trad
ing
prof
its
Fee
& C
omm
issi
on In
com
e
Div
iden
d in
com
e
Oth
er n
on-in
tere
st in
com
e
Non
-inte
rest
exp
ense
Net
impa
irmen
t cha
rges
NII
on in
term
edia
tion
Oth
er N
II
Trad
ing
prof
its
Fee
& C
omm
issi
on In
com
e
Div
iden
d in
com
e
Oth
er n
on-in
tere
st in
com
e
Non
-inte
rest
exp
ense
Net
impa
irmen
t cha
rges
2019 H1 2020
Chart 2.1MAIN COMPONENTS OF PROFITS − CORE DOMESTIC BANKS(EUR millions)
Source: Central Bank of Malta.Note: Grey bars indicate pre-tax profits in absolute amounts. Green (positive) and red (negative) bars indicate yearly changes in profit components. NII stands for net interest income.

17
CENTRAL BANK OF MALTA Interim Financial Stability Report 2020
The response of core domestic banks to the COVID-19 pandemic was also evident in the shift in composition of their balance sheet structure. During the first half of2020, these banks’ assets grewby 3.6% to reach €25.6 billion,equivalent to 196.9% of GDP. This was mainly on the back of higher debt security holdings which rose by 13.1% to reach €6.1 billion,accounting for almost a quarter of the banks’ balance sheets (see Chart 2.2). Most of these debt securities were domestic govern-mentpaper,whichrosebyjustover50%to€2.3billion,furtherincreas-ing their liquid assets (see Chart 2.3). Core domestic banks took the opportunity of the new bond issu-ances as the Government sought to finance itsmeasures to combatthe impact of COVID-19. Holdings of foreign sovereign bonds – par-ticularly of European governments –also rose.The riskprofileof thebond portfolio deteriorated with medium-rated bonds accounting for justoverhalfof thebondportfolio,up by 7.5 percentage points. This could be partly attributable to the downgrades reported by the various ratingagencies,especially inbankbonds. Meanwhile, unrated bondspredominatelyissuedbybanksfell,while holdings of low-rated bonds rose.Nonetheless,theshareoflowand unrated bonds stood lower at 12.4%.5Equitiescontractedby1.4%to€452.7million,representing1.8%ofassets.
Inthefirsthalfoftheyear,outstandingloansgrewby3.3%,drivenbybothresidentandnon-residentlending,withthelatterreflectingthebusinessprofileofonebank.Residentprivatecreditgrowthdeceleratedto2.5%comparedto4.4%inthesameperiodayearearlier.Suchslowdownemanatedchieflyfromlowerresidentcredittohouseholds.Consumerlendingcontractedby3.5%,whilemortgagegrowthsloweddownto2.0%comparedtoDecember2019,asthepropertymarketcametoavirtualhaltduringthepartiallockdowninthesecond quarter of the year. Such developments are corroborated by the latest Bank Lending Survey (BLS) resultswherereducedspendingwasreportedonthebackoflowerconsumerconfidenceandadversehous-ingmarketprospects.However,anecdotalevidenceindicatesthattherealestatemarketrecoveredsome-what following the end of the containment measures coupled with temporary government tax incentives to support the recovery of the real estate market.
5 Investment-grade bonds carrying a rating of AA- or above are regarded as ‘high-rated bonds’. ‘Medium-rated bonds’ are those rated betweenA-andA+,whereas‘low-ratedbonds’arethoseratedbetweenBBB-andBBB+.
-6
-4
-2
0
2
4
6
8
10
2016 2017 2018 2019 June 2019 June 2020
Customer loans Investment securities Claims on the EurosystemInterbank claims Other assets Total assets
Chart 2.2CONTRIBUTION TO BALANCE SHEET GROWTH − CORE DOMESTIC BANKS(percentage points)
Source: Central Bank of Malta.Note: June 2019 and June 2020 figures refer to growth in the first half of the respective years
-€43.1
-€0.3
-€86.5
-€0.8
+€76.6
+€753.4
-500 0 500 1,000 1,500 2,000 2,500
Foreign bank bonds
Domestic bank bonds
Foreign non-bank corporate bonds
Domestic non-bank corporate bonds
Foreign sovereign debt
Domestic sovereign debt
Semi-annual change 2019 June 2020
Chart 2.3BOND PORTFOLIO − CORE DOMESTIC BANKS(EUR millions)
Source: Central Bank of Malta.

18
CENTRAL BANK OF MALTA Interim Financial Stability Report 2020
Meanwhile,residentcorporatecreditremainedstrong,upby3.7%comparedtothe4.3%reportedinthefirsthalfof2019,asfirmsfacingliquidityshortagesneededadditionalcredittofinanceworkingcapitalrequire-ments.Thiswaspossibleinviewoftheampleliquidityavailableatbanks,coupledwiththeintroductionoftheMaltaDevelopmentBankCGS,whichprovidedapartialsafetynetforcommercialbanksgiventhattheguaranteeiscappedat50%ofthefundsborrowedunderthisscheme.Atasectorallevel,thewholesale&retail trade,transportation&storage,andaccommodation&foodserviceactivitiessectorsbenefittedthemostfromtheCGS.AccordingtotheJuly2020BLSresults,domesticparticipantbanksreportedsomeeas-ing in their terms and conditions for corporate loans.
AsatJune2020,placementswithotherbanksfellbyjustover10%to€1.4billion,equivalentto5.3%ofassets.Thesewereheldalmostentirelywithnon-residents,aroundhalfofwhichwithunrelatedcreditinstitu-tions,therestpertainingtoparentorsubsidiaries,almostentirelyintheformofdeposits.PlacementswiththeCentralBankofMaltahavemeanwhileadvancedby1.5%torepresent16.6%oftotalassetsreflectingthe excess liquidity available for core domestic banks.
Upuntilmid-2020,theadverseimpactofthevirusspreadonthecoredomesticbanks’assetqualitywaslimited.TheEBAintroducedsupervisoryflexibilityonthetreatmentofNPLs,inparticulartoallowbankstofullybenefitfromguaranteesandmoratoriaputinplacebypublicauthoritiestoeasetheburdensbroughtbythepandemic.Indeed,whiletheNPLratiodeterioratedby0.2percentagepointto3.5%inJune2020,theincreasewasbank-specificandlargelydrivenbyhighernon-residentNPLs,whichrosebymorethanhalf(seeChart2.4).ThesedevelopmentswerepartlyoffsetbyanimprovementintheresidentNPLratioof0.1percentagepointtostandat3.0%,asNPLsofcorporatesoperatinginconstruction,andtransportationandstoragedeclinedby18.0%.Consequently,theresidentcorporateNPLratiodeclinedby0.4percentagepointto7.7%inJune2020.Incontrast,themortgageNPLratioroseby0.2percentagepointto2.4%asthe growth in NPLs outpaced that of mortgages. NPLs pertaining to resident consumer lending remained relativelystable,withtheNPLratiohoveringataround5%.
Lookingahead,higherNPLscouldbereportedwhenthemoratoriagrantedoncreditfacilitiesexpireandsomecustomerspotentiallyfinditmoredifficulttomeetdebtobligations–particularlyifthepandemicper-sists.6Thelatter,however,couldbemitigatedbyfiscalsupport,targetingaffectedeconomicsectors.Againstthisbackdrop,itisimportantfromafinancialstabilityperspectivethatbankscontinuetomaintainadequatecapitalandliquiditybuffersandsetasideadditionalimpairmentprovisionswhileavoidingunnecessaryfor-bearance measures on their lending portfolios. Provisions (including the Reserve for General Banking Risks asspecified in theBR/09/2019)ofthe core domestic banks already increasedby just overa fifth,withthe total coverage ratio rising by almost 5 percentage points to 48.5% in June 2020. Taking into consideration collateral backing NPLs, June 2020 NPLs would befully covered, hence limiting creditrisks for these banks.
The growth in the balance sheet was primarily financed by depos-its, which grew by 4.0% to €20.9billion representing almost 82% of the overall balance sheet value. 6 TheMinisterresponsibleforpublichealth,withtheconcurrenceofandinconsultationwiththeMinisterforFinanceandFinancialSer-vices;theSuperintendentofPublicHealth;andtheMFSA,empoweredtheCentralBankofMaltatoissueDirectiveNo.18toregulatetheMoratorium on Credit Facilities in Exceptional Circumstances.
0
5
10
15
2017 2018 2019 June 2020
Resident non-financial corporates loans Resident mortgagesResident consumer credit and other lending Non-resident loansTotal loans
Chart 2.4 NPL RATIOS − CORE DOMESTIC BANKS (per cent)
Source: Central Bank of Malta.

19
CENTRAL BANK OF MALTA Interim Financial Stability Report 2020
Resident deposits increased by 5.2% to account for 91.3% of overall deposits, mainly driven byhouseholds’ deposits which grew by 5.4%.Reflecting the uncertain-ties brought about by the pandemic and a number of containment measures, households were con-strained to postpone consump-tion and to increase their savings using short-term deposits. Indeed,preference for short-term deposits over longer-term deposits persisted also during this period, enablingbanks to fund their operations at lowcosts,withaweightedaverageinterest rate on resident deposits of just0.24%.Bycontrast,thedown-ward trend in non-resident deposits persistedasbankscontinuedwiththeirde-riskingprogramme.Othersourcesoffundingremainedlimited,withtheincreaseininterbankexposuressomewhatoffsetbylowerdebtsecurities.Againstthisbackdrop,despitedecliningmarginally,theLCRof330%indicatesthatinaggregatethesebankscontinuedtooperatewithampleliquiditybuffers,sufficienttowithstandanyliquidityshocks.Suchhealthyliquiditypositionisalsovisiblefromthehigherholdingsofunencumberedcentralbank-eligibleCounterBalancingCapacity(CBC),whichoverallrosebyaquartertorepresentalmost15%oftheaggregatebalancesheet,thoughthisvariedamong individual banks. The unencumbered central bank-eligible share of CBC amounted to 1.5 times the totalLCRnetcashoutflows,suggestingthattogetherthesebankscansurvivearound45daysofnetcashoutflowsinastressedscenario.
Forthefirsttimeinrecentyears,totalownfundscontractedby1.1%inthefirsthalfof2020,owingtolowerretainedearningsbysomebanks.Totalrisk-weightedexposuresfellbyjust0.4%,withthetotalcapitalratiodeclining marginally to 20.0% (see Chart 2.5). The drop in risk-weighted assets was attributable to lower creditriskexposure,which–however–stillaccountedforabout90%ofthetotalriskexposures,whilecon-tributiontooperationalrisksroseagain.At7.5%,theleverageratio–whichisanon-risksolvencyratio–alsoabated,yetstillremainedwellabovetheregulatorythresholds.Thebanks’riskprofilemeanwhileimproved,dropping by 1.8 percentage points to 44.4%.
2.2 Non-core Domestic BanksSimilar tootherbanks,both locallyandabroad, thefivenon-coredomesticbankswereadverselyhitbytheeconomicimpactofthepandemic,aslosseswerereported.Thiswasmainlyduetohighernetimpair-mentchargesreflectingaworseninginexpectationsontherecoverabilityof loans,coupledwithdropsinnon-interestincome.Inaggregate,profitshalvedasimpairmentlossesrosebyalmost50%,withonebankreportingasignificantriseinNPLs.Ontheotherhand,non-interestincomedroppedby9.5%largelyduetodecreaseddividendincomeaswellaslowertradingprofits,andfeesandcommissions.Netinterestincomemainlyfromintermediationalsodeclinedbyaround10%,asinterestincomefellatafasterpacethaninterestexpense.Consequently,thepost-taxROEandROAnarrowedto5.5%and0.6%respectively,from10.6%and 1.2% six months earlier.
Non-coredomesticbanks’assetscontractedby2.4%to€2.8billion,mainlyduetolowerplacementswiththeBank,whichdecreasedby12.3%torepresent21.7%ofassets(seeChart2.6).Meanwhile,thesebanksexperiencedaslightincreaseininterbankexposures,mainlydrivenbydepositsfromgroupentities,whichoffsetthedeclineinlendingfromunrelatedparties.
-5
0
5
10
15
20
25
-50
0
50
100
150
200
250
300
2016 2017 2018 2019 June 2020
Change in Tier 1 capital Change in Tier 2 capital Change in total own fundsTier 1 Capital Ratio (RHS) Total Capital Ratio (RHS) Leverage ratio (RHS)
Chart 2.5 CHANGE IN TOTAL OWN FUNDS, CAPITAL AND LEVERAGE RATIOS − CORE DOMESTIC BANKS (EUR millions; per cent)
Source: Central Bank of Malta.

20
CENTRAL BANK OF MALTA Interim Financial Stability Report 2020
The securities portfolio decreased slightly to €709.2 million, butremained an important element on their balance sheet. This drop appears to have been motivated by flight to quality as a significantdecrease in the equity holdings was offset by higher bond hold-ings. Equities holdings fell by just over a fourth to 8.4% of the balance sheet, mainly driven bylower holdings in non-MMF invest-ment funds and also in MMFs to a lesser extent. In contrast, bondholdings grewby arounda fifth toconstitute 13.5% of assets (see Chart 2.7). The large part of these bonds were of domestic sovereigns which now accounted for 28.7% of the bond portfolio, up by 12.8percentage points over December 2019. Non-core domestic banks also invested in foreign non-bank corporate bonds, largely NFCs.At the same time, these banksshedasignificant shareof foreignsovereign bond holdings which,nonetheless,at34%remained themost popular bond holding. The credit quality of the debt securities held by these banks improved sig-nificantlyastheamountofunratedbonds decreased by around 62.1% – largely due to lower exposure to the financial sector – while high-quality bonds increased by 25.3% and accounted for around two-thirds of the overall bond portfo-lio of these banks. Medium-rated bonds increased substantially, upby almost 90%, largely due to anincrease in MGS.
In thefirsthalfof theyear,growthin customer loans remained muted. Resident customer loans increased by 11.9% as this group of banks continued to increase their resident business through higher lending to the construction sector, wholesaleand retail trade, and consumercredit (see Chart 2.8). Lending towards real estate decreased slightly. Resident customer loans
#Document Classification: Restricted
€13.2
€0.2
€60.4
-€0.8
-€66.4
€72.9
-100 -50 0 50 100 150 200 250 300
Foreign bank bonds
Domestic bank bonds
Foreign non-bank corporate bonds
Domestic non-bank corporate bonds
Foreign sovereign debt
Domestic sovereign debt
Semi-annual change June 2020 Dec. 2019
Chart 2.7 BOND PORTFOLIO − NON-CORE DOMESTIC BANKS (EUR millions)
Source: Central Bank of Malta.
-24
-20
-16
-12
-8
-4
0
4
8
12
16
20
24
2016 2017 2018 2019 H1 2020
Total customer loans Total securities Interbank claimsClaims on the Eurosystem Other assets Total assets
Chart 2.6 CONTRIBUTION TO ASSETS GROWTH − NON-CORE DOMESTIC BANKS (percentage points)
Source: Central Bank of Malta. Note: H1 2020 figures refer to growth over end 2019.
19.8
7.3
11.8
25.0
24.1
12.0 21.9
8.9
11.4
22.2
22.7
12.9
ConstructionWholesale and retail trade; repair of motor vehicles and motor cyclesNon-bank financial entitiesReal estate activitiesConsumer creditManufacturingInformation and communicationOther
RESIDENT LOANS
2019
JUNE 2020
Chart 2.8 DISTRIBUTION OF RESIDENT LOANS AND NON-RESIDENT LOANS (per cent)
Source: Central Bank of Malta.
NON-RESIDENT LOANS
JUNE 2020
4.4
23.4
54.8
5.3 2.5
9.6
5.3
25.1
52.2
6.5
5.2 5.7
2019

21
CENTRAL BANK OF MALTA Interim Financial Stability Report 2020
represented29%ofthetotalcustomerloanportfolio,upbyalmost12percentagepoints,thoughtheseloansstillaccountedforonly2.5%oftheoverallcustomerlendinginthebankingsector.Meanwhile,non-residentcustomer loans decreased by 4.1% mainly due to one bank which reduced its exposures towards non-bank financialinstitutionsandNFCsintheelectricity,gas,steamandairconditioningsupplysector.
Thequalityoftheloanportfoliodeterioratedfurther,astheNPLratioincreasedby1.6percentagepointsto7.1%.TheincreasewasreportedbyonebankreflectinghighercorporateNPLswithinthewholesaleandretailtradesectorand,toalowerextent,inconstruction.However,thecoverageratioincreasedby3.9per-centagepointsto44.9%asprovisionsrosefasterthanNPLs,withanadditional25%ofNPLscoveredbycollateral.
Customerdeposits,primarilyfromnon-residents,remainedtheprimarysourceoffundingandrosemargin-allyto73.5%oftotalliabilities.Meanwhile,residentcustomerdepositsdecreasedby1.1%since2019,andremainedlimitedto16.6%ofthenon-coredomesticbanks’liabilities,andjust2.4%oftheresidentdepositsinthesystem.Wholesaledepositsdecreasedbyjustunderathird,mainlyreflectinglowerplacementsfromunrelated credit institutions. The decrease in wholesale funding indicates limitations for this source of fund-ing,asintimesofstressitcandryupquickly.Inthisregard,itisimportantforsuchbankstocontinuediver-sifyingtheirfundingsources,althoughoverallliquidityofthenon-coredomesticbanksremainedsoundwiththe LCR ratio increasing to almost 400% in June 2020. Unencumbered central bank-eligible CBC rose by almost 3% to represent around a fourth of the overall balance sheet of non-core domestic banks. This cre-atesfurtherspaceforsuchbankstoobtainalternativefunding,amountingtoaroundthreetimestheoverallLCRnetcashoutflows.
Duringthisperiod,thetotalcapitalratioofnon-coredomesticbanksimprovedslightlyto18.7%.Thiswasmainlyduetoa9.3%decreaseinRWAsreflectinglowercreditrisktocorporatesandcollectiveinvestmentundertakings.However,totalownfundsandCET1capitaldecreasedby8.0%asretainedlossesincreased.Theleverageratioofthebanksremainedsoundabove10%,complyingwiththeregulatoryminimum.
2.3 International BanksInternationalbanksconsolidatedfurthertheirbalancesheets.Inaggregate,theirassetsdeclinedby2.7%to€13.2billion,equivalentto101.5%ofGDPinJune2020.Thisreflectedthesustainedcontractioninopera-tionsofthebranchesofforeignbanksthattogetheraccountforaboutfourfifthsoftheoverallactivityofthisbankcategory.Incontrast,theassetsoftheotherbanksinthiscategorygrewby4.9%overDecember2019.Inlinewiththeirclassification,thesebanks’activitiesremainedorientedtowardsnon-residents.
Branches of Foreign BanksIn spite of the challenges brought about by the pandemic, the profitability of branches improved. Suchimprovementwasdrivenexclusivelybyonenon-EUbranch,withtheoverallpre-taxprofitsalmostdoublingduringthefirsthalfof2020,pushingtheoverallpost-taxROAto1.9%.Incomefromnon-interest-bearingactivitiesmorethandoubledover2019onthebackofhigherFXrevaluations.Similarly,netinterestincomerosebyalmost60%,asinterestexpensesfell,mainlydrivenbylowerinterbankplacements,surpassingthedrop in interest income from both its investment and lending portfolio. Non-interest expenses dropped by almost10%,drivenbylowerfeesandcommissionspayableaswellasadministrativeexpenses,offsettingtheincreaseinstaffexpenses.Asaresult, thecostefficiencyofthiscategoryofbanksimprovedfurther,withthecost-to-incomeratiocontractingby3percentagepointstoalowof2.8%inJune2020,mirroringtherelativelylowexpensesincurredbythebranches.Theincreaseinprofitswasinpartmutedbyasignificantincrease in net impairment charges.
Thecontractioninassetswasmainlyduetoa7.4%dropinsecuritiesholdings,whichstoodforalmostathirdofthesebanks’balancesheet.Meanwhile,thecustomerloanbookrosebyamarginal0.4%,drivenbya20%increaseinloanstonon-residentOFIs,whichinturnrepresentedaround28%ofthetotalcustomerloanbook.Incontrast,NFCloans,predominantlylocatedinTurkey,declinedby5.7%.Ascanbeseenin

22
CENTRAL BANK OF MALTA Interim Financial Stability Report 2020
Chart2.9,theNFCloanportfolioofthese institutions is mainly exposed to the transportation and storage sector,andconstructionsector.
At the same time, asset qualityimproved further – largely driven by a drop in the level of outstanding NPLs mainly to non-resident OFIs and to a lower extent NFCs in the transportation and storage sector,reported by one branch. Conse-quently, the NPL ratio remainedata lowof1.0% inJune2020,asotherwise the credit risk of the two largest branches is shifted to their headoffice, in linewith their busi-ness model.
Meanwhile,fundsplacedwiththeCentralBankofMaltafellmarginally,toaccountfor4.2%oftotalassets.
Intragroupfundingdeclinedby11.3%,butstillaccountedforaroundtwothirdsoftotalliabilities.Atthesametime,interbankdepositsfromunrelatednon-residentbanksrosebyalmost60%,accountingforabout21%ofoverallliabilitiesinJune2020.Meanwhile,thecontractioninthebalancesheetofthesebankswassup-portedbyalowercustomerdepositbase,whichdroppedbymorethan80%over2019,mainlyduetohigheroutflowsofnon-residentprivateNFCsspecialisedinthemanufacturingsector,financingonly1.3%ofoverallassets by mid-2020.
Subsidiaries of Foreign Banks and Stand-alone BanksTheoverallpre-taxprofitsearnedbythisgroupofbanksweakenedby23.7%asnetimpairmentchargesgrewbyaround20%,drivenpredominantlybyhigherStage3impairmentspostedbymicrolenders.Otherbankshavealsoreportedlowerprofits,largelyduetolowerincome.Consideringthesedevelopments,thepost-taxROEandROAnarrowedby1.0and0.5percentagepointto6%and2.4%,respectively.
Despitethechallengesinthefirsthalfoftheyear,overallNIIincreasedby4.1%,owingprimarilytohigherincomeearnedon lending,andsecuritiesholdings toa lowerextent.Non-interest incomealso rose,by2.3%,onthebackofhigherfeesandcommissions.Non-interestexpensesincreasedby6.2%,drivenpre-dominantly by one bank on the back of higher general expenses charged from within its group. This resulted intheoverallcostefficiencyofthesebankstodeteriorate,withthecost-to-incomerationarrowingby1.5percentage points to 54.8% in the six months to June 2020.
Sinceend2019,thecustomerloanportfoliodeclinedby8.9%to57.6%oftheiroverallassetsinJune2020,driven by a 12% drop in non-resident NFCs loans (see Chart 2.10). The sectoral composition of the loan bookremainedlargelyintactwithlendingpredominantlytowardsthemanufacturing,andthetransportationand storage sectors. Non-resident consumer credit fell marginally to account for 18.2% of total customer portfolio.Loanstonon-residentOFIsincreasedby1.9%,pushingupitsshareintheloanbooktoaround7%.Althoughresidentlendingincreasedby15.6%over2019,largelydrivenbyOFIs,residentlendingremainedperipheral to the banks’ activities representing just 1.4% of customer lending portfolio.
The asset quality of their loan portfolio deteriorated slightly as the NPL ratio rose by 0.4 percentage point to3.9%,reflectinga19.4%increaseinNPLs.Thiswasdrivenpredominantlybyhouseholds,possiblyduetoincreasedrepaymentdifficultiesduringthepandemicasNPLspertainingtotheNFCsectorfellby9.9%,
23.4
13.8
43.5
4.43.90.5
6.24.20.2
28.0
13.443.6
3.83.8
0.43.1 3.8 0.1
Financial and Insurance activities(excl. credit institutions)
Construction and real estate
Transportation and storage
Manufacturing
Accommodation and food serviceactivities
Wholesale and retail trade
Electricity, gas, Steam and AirConditioning Supply
Administrative and supportservices activities
Others
Chart 2.9CUSTOMER LOANS BY SECTOR – BRANCHES OF FOREIGN BANKS(per cent)
Source: Central Bank of Malta.
2019
JUNE 2020

23
CENTRAL BANK OF MALTA Interim Financial Stability Report 2020
mainly from the wholesale and retail trade sector. Although provi-sions rose by 10.6% compared to end-2019, these fell short ofthe increase in NPLs, and conse-quently the coverage ratio dropped to 101.6%.
This category of banks reported higher interbank placements which rose by 17.7% to account for 13.0% ofoverallassets,mainlydrivenbyplacements with related institu-tions, and to amuch lower extentvia placements with resident unre-lated financial institutions. Claimswith the Central Bank of Malta rose by more than 80%, to represent17.6% of total assets. These devel-opmentsreflectedtheabundantliquidityavailableatthesebanks,withtheLCRstandingsignificantlyabovetheregulatorythresholdataround1,045%inJune2020.
Thesecuritiesportfoliogrewby6.9%over2019,mainlyreflectinghigherholdingsofdebtsecurities.Gov-ernmentbondsroseby2.9%,drivenbyhigherholdingsofMGSasthisgroupofbanksalsotapped intotheopportunitiesarisingfromtheincreasedgovernmentfundingneedstofinancetheCOVID-19mitigationmeasures. This resulted in an increase in Eurosystem-eligible debt securities that can be pledged to secure fundinginEurosystemmonetarypolicyoperations.Althoughforeignsovereignholdingsdecreasedby3.4%,thesestillrepresentedmorethanfourfifthsoftheirsovereigndebtholdings.Thesebanksalsoinvestedincorporatebondstoaccountfor justunder10%ofthebondportfolio. Incontrast,MFIbondsfellby1.5%though these accounted for 28.8% of total debt portfolio. Around 80% of their debt securities were invested inmedium-ratedbonds,whichincreasedfurtherinthefirsthalfoftheyear,asotherwiseholdingsofbothlowand high rated bonds fell.
Exposureinequityinstrumentsroseby1.2%,mirroringhigherinvestmentbyonebankinamanufacturingcompany, to account for 31.6% ofsecurities portfolio.
The expansion in the balance sheet was financed by customerdeposits,whichrosebymorethana quarter to around 39.3% of the balance sheet (see Chart 2.11). This mainly reflected higher non-residenthouseholds’deposits,andtoalowerextentnon-residentOFIs,which increased by 52.1% and 12.2%, respectively. Conversely,deposits of non-resident NFCs fell by around two fifths over 2019.Resident customer deposits more than doubled, reflecting higherdeposits from NFCs and OFIs. Yet
-24
-20
-16
-12
-8
-4
0
4
8
12
16
2016 2017 2018 2019 H1 2020Total customer loans Total securities Interbank claimsClaims on the Eurosystem Other assets Total assets
Chart 2.10CONTRIBUTION TO ASSETS GROWTH − SUBSIDIARIES OF FOREIGN BANKS AND STAND-ALONE BANKS(percentage points)
Source: Central Bank of Malta.Note: H1 2020 figures refer to growth over end 2019.
-18-16-14-12-10
-8-6-4-202468
10
2016 2017 2018 2019 H1 2020Total customer deposits Debt securities issued Interbank fundingOther liabilities Capital and reserves Total liabilities
Chart 2.11CONTRIBUTION TO LIABILITIES GROWTH − SUBSIDIARIES OF FOREIGN BANKS AND STAND-ALONE BANKS(percentage points)
Source: Central Bank of Malta.Note: H1 2020 figures refer to growth over end 2019.

24
CENTRAL BANK OF MALTA Interim Financial Stability Report 2020
resident customer deposits remained limited to 3.6% of total assets and just 0.5% of total resident deposits in the Maltese banking sector.
Despiteachallengingfirsthalfof theyear,thetotalcapitalratioofthesebanksincreasedfrom47.2%in2019to51.4%inJune2020,owingtohigherretainedearningsandlowerrisk-weightedassets,attributabletolowercreditriskfromcorporatecustomers.ThelatterresultedinanimprovedriskprofileastheshareofRWA to overall assets dropped from 86.7% in 2019 to 76.1% in June 2020.

3. Stress Tests

26
CENTRAL BANK OF MALTA Interim Financial Stability Report 2020
3. STRESS TESTS
The Bank Reaffirms the Robustness of Credit Institutions’ Solvency and Liquidity Buffers Amid the COVID-19 Pandemic Infulfillingitscorefunctionofsafeguardingfinancialstability,theBankcontinuedtomonitortheresilienceofthe banking system’s capital and liquidity adequacy by running its suite of stress tests and sensitivity analy-seswhichformpartoftheBank’sfinancialstabilitytoolkit.Thissectionprovidesupdatedresultsofthestresstests presented in Chapter 3 of the FSR 2019 (which were based on December 2019 as reference date) and the Special Feature (with reference date March 2020).
3.1 Macro Stress Testing FrameworkFollowing the publication in August 2020 of revised economic projections for the period 2020 to 2022 (2020:3), theMacroStressTesting (MST) frameworkwasre-run toassessandmonitor the resilienceofbanks in June 2020 under two revised scenarios on the basis of this new information. Although the MST frameworkwasdesignedasanannualexercisetomakeuseoffinancialyear-enddataandthefullthree-yearprojectionhorizon,theframeworkwasmodifiedtoprovideanupdateoftheresilienceofbanksfrommid-2020 till end-2022. Given that the capital position as at the reference date already captures the realised impactofthepandemicinthefirsthalfoftheyear,theinterimMSThasa2.5-yeartesthorizon.
Revisions to the Results Published in the FSR 2019Following the FSR 2019publication,Tier1capitalratiosforDecember2019havebeenrevisedupwardsby0.18percentagepointand1.59percentagepointsforcoreandnon-coredomesticbanks,respectively.ThisrevisionwasmainlyduetoprofitsforDecember2019whichwerenotyetincludedincapitalforsomebanks.Whiletheimpactbyrisktyperemainsthesame,therevisioninthestartingcapitalratioresultsinanupwardrevisionofthepost-shockTier1capitalratiosfor2022.Hence,lookingbackatthestartingpositionfeaturedin the FSR 2019,coredomesticbankswouldhavestartedtheexercisewithaTier1capitalratioof17.58%(0.18 percentage point higher than 17.40%) increasing to 18.18% under the former exercise’s baseline sce-narioanddroppingto14.29%underitsadversescenarios,respectively.Similarly,non-coredomesticbankswould start the exercise with a Tier 1 capital ratio of 18.11% (1.59 percentage points higher than 16.52%) droppingto15.30%underthebaselineand10.48%undertheadversescenarios,respectively.Theserevi-sions to the starting capital ratio are also reported in Charts 3.1 to 3.4.
Revised Baseline and Adverse Macroeconomic ScenariosUndertheMST’sbaselinescenario,domesticGDPisprojectedtocontractby6.6%in2020andgrowby6.1%and4.2%in2021and2022,respectively.ComparedtotheFSR 2019baseline,GDPisrevisedsig-nificantlydownwardsfrom-4.8%in2020mainlyduetoamoreadverseoutlookfortourismexportswhichoffsettheenhancedfiscalsupport.Inaddition,privateconsumptionandprivateinvestmentwillalsocontractin2020followingtheshutdownofnon-essentialservicesanduncertainty.Thereafter,theeconomicrecoveryis mainly driven by domestic demand. The unemployment rate is expected to peak at 4.9% in 2020 and then moderateto4.6%and4.4%in2021and2022,respectively,whileoilpricesremainlowtoreflectthedipinprices observed between February and March 2020. These economic projections are complemented by an exogenousV-shapedshocktoequitypriceswhichwoulddropby12%inthefirstyearandpartiallyrecoverthroughoutthetesthorizon.Moreover,underthisscenario, it isassumedthatdividendincomeonbanks’equityholdingswoulddropby50%in2020and,similar toequityprices,partiallyrecoverthroughout thetest horizon. Fees and commission income are expected to decline by 10% in each year of the test horizon.
UndertheMST’sadversescenario,GDPisexpectedtodeclineby9.3%in2020followingasharperdropintourismexports,andaslowerglobaleconomicrecoverythananticipated.TheeconomyisexpectedtorecoverthereafterwithGDPgrowthratesof5.5%and3.7%in2021and2022,respectively.Theunemploy-ment rate peaks at 5.1% in 2020 and subsequently falls to 4.9% and 4.8% in the following two years. The adverse scenario also features exogenous shocks to equity prices which would drop by 24% (and partially recoveroverthetesthorizon),whilerealestatepriceswouldfallbyaround5%ineachyearcomparedto

27
CENTRAL BANK OF MALTA Interim Financial Stability Report 2020
the baseline scenario to account for the mild overvaluation observed at the reference date and cancel the baselinegrowthinpropertyprices.Moreover,underthisscenario,itisassumedthatbankswouldnotreceiveanydividendincomefromtheirequityholdingsin2020and,similartoequityprices,dividendincomewouldpartiallyrecoverthroughoutthetesthorizon,whilefeesandcommissionincomeareexpectedtodeclineby15% in each year of the test horizon.
ResultsCharts3.1and3.2presenttherevisionstotheTier1capitalratiorelativetofigurespublishedintheFSR 2019 and the contributions of the various risk modules (as a fraction of risk weighted assets) to the evolution of the Tier1capitalratiounderthebaselinescenarioforcoreandnon-coredomesticbanks,respectively.Whiletheimpact for credit risk, market riskand operational risk is comparable to the impact presented in the FSR 2019, the lower magnitudecan be attributed to the shorter test horizon of 2.5 years. These impacts are mainly driven by credit risk losses from impairments held against defaults in debt securities atamortisedcost(AMC)andloans,as well as market risk losses in the form of revaluation losses on debt securities, held at fair value (FV).Nonetheless, banks experience acontraction in the offsetting effectattributed to NII and net non-interest income (NNII) relative to the FSR 2019. NII is mainly impacted from credit risk with a reduced income stream because of forgone coupons and missed repayments from defaulted debt securities and loans, respectively. NNII is mainlyimpacted by lower income and higher losses experienced in the firsthalfof2020which,bythestaticbalancesheetassumption,arethenprojected to impact also the second half of 2020 and to be repeated also in the following two years.1 Overall, core domestic and non-core domestic banks experience a drop in their Tier 1 capital ratio of 0.34 and 2.51 percentage points to reach 17.11% and 15.99%,respectively, under the baselinescenario. Nonetheless, both bankcategories remain well above the regulatory requirement of 6%. At
1 The static balance sheet assumption allows for ease of comparison between results by leaving the composition of assets and liabilities constant throughout the test horizon. Any instruments which mature over the test horizon are immediately replaced by instruments with similar characteristics.
17.11
3.18
17.45
0.18
17.40
- 0.22
- 0.61
- 0.68
- 0.13
- 1.88
- 0.13
0 5 10 15 20 25 30
T1 capital ratio 2022Q4
Change in RWA
Taxes and dividends
Operational risk
Market risk
Credit risk
NII & NNII
T1 capital ratio 2020Q2
Change in 2020H1
Revision for December
T1 capital ratio 2019Q4
Chart 3.1 STRESS TEST RESULTS – MACRO STRESS TEST BASELINE SCENARIO – RELATIVE CONTRIBUTION OF THE IMPACT ON CORE DOMESTIC BANKS' TIER 1 CAPITAL RATIO(per cent)
Source: Central Bank of Malta calculations.
15.99
4.96
18.50
0.39
1.59
16.52
- 0.39
- 1.55
- 0.69
- 1.37
- 3.49
0 5 10 15 20 25 30
Tier 1 capital ratio 2022
Change in RWA
Taxes and dividends
Operational risk
Market risk
Credit risk
NII & NNII
T1 capital ratio 2020Q2
Change in 2020H1
Revision for December
T1 capital ratio 2019Q4
Chart 3.2 STRESS TEST RESULTS – MACRO STRESS TEST BASELINE SCENARIO – RELATIVE CONTRIBUTION OF THE IMPACT ON NON-CORE DOMESTIC BANKS' TIER 1 CAPITAL RATIO(per cent)
Source: Central Bank of Malta calculations.

28
CENTRAL BANK OF MALTA Interim Financial Stability Report 2020
an individual bank level, banksmanage to surpass their respective Total SREP Capital Requirement (TSCR).2
Charts 3.3 and 3.4 show that under the adverse scenario, the aggre-gate Tier 1 capital ratios would drop for both bank categories. Losses would mainly originate from higher levels of NPLs and defaulted bonds that reduce the stream of interest income via missed repayments against these assets. In addition to losses in interest income aris-ingasaconsequenceofcreditrisk,NNII is also reduced as a result of the assumed decline in dividend income (100% in 2020 with a partial recovery to approach the 2019 level thereafter) and in fees and commis-sion income (15% in each year of thetesthorizon).Moreover,opera-tional risk contributes to the impact on core domestic banks’ capital while unrealised losses on shares held impact the capital of non-core domestic banks. The Tier 1 capital ratio for core domestic banks falls by 4.33 percentage points (3.29 percentage points in the FSR 2019) to reach 13.12% while that of non-core domestic banks falls by 6.85 percentage points (7.63 percent-age points in the FSR 2019) to reach 11.65%. The overall impact for non-core domestic banks is smaller when compared to Decem-ber2019asaresultofacontractioninthebalancesheetsize,particularlysharesheld(whichareamajorsource of unrealised losses in December 2019) have reduced by 21% over this 6-month period. It is worth highlighting that these results do not consider any policy intervention or supplementary support measures aimed at mitigating the outcome of the adverse scenario.
TheTier1capitalratioforbothbankcategoriesremainswellabovethe6%minimumrequirement.Moreover,banksareassessedindividuallyagainsttheirrespectiveTSCR,whichistheapplicablebenchmarkforanadverse scenario under the SREP guidelines. The TSCR consists of the common 6% Pillar 1 requirement and the 2020 Pillar 2 requirement individually determined for each bank by the respective supervisor. The interim MST results are benchmarked against higher TSCRs than those applicable for December 2019. In
2 EventhoughtheOverallCapitalRequirement(OCR)isthebenchmarkforabaselinescenario,followingthetemporarycapitalreliefmeasures announced by the ECB and the MFSA,banksareallowedtomakeuseoftheircapitalandliquiditybuffersandoperatebelowthecombinedbuffersrequirementassumingalsoreleaseoftheO-SIIbuffer.Thus,forthisInterim FSR,thebaselinescenarioisassessedagainsttheTSCRwhichexcludestheseadditionalbuffers.
13.12
2.83
17.45
0.18
17.40
- 0.25
- 0.18
- 4.32
- 0.13
- 2.29
- 0.13
0 5 10 15 20 25 30
Tier 1 capital ratio 2022
Change in RWA
Taxes and dividends
Operational risk
Market risk
Credit risk
NII & NNII
T1 capital ratio 2020Q2
Change in 2020H1
Revision for December
T1 capital ratio 2019Q4
Chart 3.3 STRESS TEST RESULTS – MACRO STRESS TEST ADVERSE SCENARIO – RELATIVE CONTRIBUTION OF THE IMPACT ON CORE DOMESTIC BANKS' TIER 1 CAPITAL RATIO(per cent)
Source: Central Bank of Malta calculations.
11.65
2.60
18.50
0.39
1.59
16.52
- 0.34
- 1.26
- 1.71
- 1.97
- 4.16
0 5 10 15 20 25 30
Tier 1 capital ratio 2022
Change in RWA
Taxes and dividends
Operational risk
Market risk
Credit risk
NII & NNII
T1 capital ratio 2020Q2
Change in 2020H1
Revision for December
T1 capital ratio 2019Q4
Chart 3.4 STRESS TEST RESULTS – MACRO STRESS TEST ADVERSE SCENARIO – RELATIVE CONTRIBUTION OF THE IMPACT ON NON-CORE DOMESTIC BANKS' TIER 1 CAPITAL RATIO(per cent)
Source: Central Bank of Malta calculations.

29
CENTRAL BANK OF MALTA Interim Financial Stability Report 2020
general,thefinancialsystemexhibitsresilienceunderthemoreadversescenariowhichisdesignedtotestforsystemicrisks.However,somevulnerabilitiesareobservedinafewsmallbanks.3
Sensitivity AnalysesAsacomplementtotheMSTframework,sensitivityanalysesareconductedtoassesstheimpactonsol-vency from alternative scenarios in isolation using June 2020 data. As an update to the results for December 2019 presented in Chapter 3 of the FSR 2019, (1) thehousepricecorrection test targetscoredomesticbanksasthemainmortgageprovidersagainstanabruptdropinhouseprices.Moreover,anupdateoftheresultsforthethreetestsincludedintheSpecialFeature(asatMarch2020),isprovided.Thesetestsassesstheresilienceofcoredomestic,non-coredomesticandinternationalbanksagainst:(2)creditqualitydeterio-rationintheirdebtsecuritiesportfolio,(3)anincreaseinNPLsfromanassumedcreditqualitydeteriorationin those loans granted a moratorium and (4) a combined scenario of 2 and 3.
House Price CorrectionThis test focuses on core domes-tic banks as the main mortgage providers and applies two adverse exogenous shocks to house prices of 7.5% (1 standard deviation) and 30% (4 standard deviation). These shocks affect the valuation of realestate-related collateral backing loans and are combined with a simultaneous increase in NPLs of 4% and 18%, respectively, whichtranslate into higher loan loss provi-sions.
Chart 3.5 shows that core domes-tic banks’ Tier 1 capital ratio fall marginally from 17.45% to 17.11% under adverse scenario 1 and 16.21% under adverse scenario 2. Despite a marginally higher esti-mated level of provisions required to be set aside in June 2020, thechange in the Tier 1 capital ratio results in a marginally lower but comparable impact to the results presented for December 2019.
Credit Quality Deterioration in the Debt Securities PortfolioThis test applies the MST’s credit risk module for debt securities in isolation and assesses the core domestic, non-core domesticand international banks against a potential deterioration in the credit quality of their debt securities port-folio.Specifically,thetestassumes3 The Bank does not comment on individual bank results for its stress tests given that these are designed to test the overall resilience of the system.
0
5
10
15
20
Initial Tier 1 capital ratio Adverse scenario 1: 7.5%decline in house prices & 4%
increase in NPLs
Adverse scenario 2: 30%decline in house prices & 18%
increase in NPLs
Chart 3.5STRESS TEST RESULTS – IMPACT OF A DROP IN HOUSE PRICES ON CORE DOMESTIC BANKS' TIER 1 CAPITAL RATIO(per cent)
Source: Central Bank of Malta calculations.
0
20
40
60
80
0
5
10
15
20
Initial Tier 1capital ratio
Post-shock Tier1 capital ratio
Initial Tier 1capital ratio
Post-shock Tier1 capital ratio
Initial Tier 1capital ratio
Post-shock Tier1 capital ratio
Core domestic banks (6) Non-core domestic banks (4) International banks (5) (RHS)
Chart 3.6STRESS TEST RESULTS ̶ IMPACT OF DETERIORATION IN DEBT SECURITIES PORTFOLIO ON TIER 1 CAPITAL RATIO(per cent)
Source: Central Bank of Malta calculations.

30
CENTRAL BANK OF MALTA Interim Financial Stability Report 2020
a three-notchratingdowngrade indebtsecuritiesaccounted foratAMC,aswellasawideningofcreditspreads and valuation haircuts applied respectively for non-sovereign and sovereign FV debt securities. The compositionofthedebtsecuritiesportfolioremainedbroadlystablewhencomparedtoMarch2020.Indeed,theshareofdebtsecuritiesratedatinvestmentgrade(BBB-orhigher)stoodat99%,98%and90%fortherespectivebankcategories.Moreover,theshareofdebtsecuritiesaccountedforatAMCstoodat59%,48%and81%,respectively.Chart3.6showsthatundersuchascenario,theTier1capitalratiowouldfallfrom17.45%to16.28%forcoredomesticbanks,from18.50%to16.98%fornon-coredomesticbanksandfrom64.44%to63.98%forinternationalbanks.Thedropincapitalisequivalentto-1.17,-1.52and-0.46percent-agepoints,respectively.Thedropincapitalforcoreandnon-coredomesticbanksishigherthantheimpactreported for March 2020 as these banks have increased the size of their debt securities portfolio from €5.3 billionto€6.0billionandfrom€0.4billionto€0.5billion,respectively.
Increase in NPLsThissensitivityanalysis,whichassessestheimpactfromanincreaseinNPLsinkeysectors,wasintro-duced for thefirst time in theSpecialFeaturewithreferencedateMarch2020.Thesameapproach isadopted to assess the impact on solvency as at June 2020 from a worst-case scenario in which perform-ingloanstotheidentifiedproductivesensitivesectors(same12sectorsaslistedinPanelAoftheSpecialFeaturewhichwereassumedtobemostlyimpactedbytheCOVID-19pandemic)andmortgages,whichhavebeengrantedamoratorium(uptoAugust2020),wouldbecomenon-performing.4RelativetoMarch,thebanksinscopehaveincreasedfrom10to12,astwointernationalbankshavesincestartedgrantingmoratoria.UponclassificationoftheseloansasNPLs,bankswouldneedtosetasideloanlossprovisionsbasedontheuncollateralisedpartoftheloans,whicharechargedtotheP&L.Inthecasethatoperat-ingprofitsprovideonlypartiallossabsorption,bankswouldneedtoreleasecapitaltooffsettheresiduallosses.
Chart3.7showsthatinsuchascenario,Tier1capitalratioswouldfallfrom17.45%to14.14%,from18.18%to 15.35% and from 64.06% to 57.03% for core domestic, non-core domestic and international banks,respectively – but remaining well above the regulatory Tier 1 capital ratio requirement of 6%. The impact on theTier1capitalratioofthe12banksinscoperangesbetween1.31and11.26percentagepoints,andina worst-case scenario assuming an extreme situation – where none of the borrowers that were granted a moratorium would be in a position to honour their obligations.
Combined Credit Quality Deterioration and Increase in NPLsTo further assess the banks’ sol-vency positions, the previous twosensitivity analyses have been combined to consider a dete-rioration in both debt securities and loans. The same 15 banks included in the sensitivity analysis on their debt securities portfolio fall within scope of this test.
Thequantificationoftheimpactofthe combined scenario would result in a drop in the Tier 1 capital ratio of4.49,3.98and7.38percentagepointsforcoredomestic,non-core
4 WhilethetestreferstobankdataasatJune2020,theuptakeofmoratoriahasbeencalibratedatAugust2020tocapturebothmoratoriagrantedbybanksattheonsetofthepandemic,aswellasaftertheBankissuedDirectiveNo.18on13April2020toregulatemoratoriagranted to credit facilities in exceptional circumstances.
0
20
40
60
80
0
5
10
15
20
Initial Tier 1capital ratio
Post-shock Tier1 capital ratio
Initial Tier 1capital ratio
Post-shock Tier1 capital ratio
Initial Tier 1capital ratio
Post-shock Tier1 capital ratio
Core domestic banks (6) Non-core domestic banks (2) International banks (4)(RHS)
Chart 3.7STRESS TEST RESULTS ̶ IMPACT OF AN INCREASE IN NPLS IN SENSITIVE SECTORS AND MORTGAGES ON TIER 1 CAPITAL RATIO(per cent)
Source: Central Bank of Malta calculations.

31
CENTRAL BANK OF MALTA Interim Financial Stability Report 2020
domestic and international banks,respectively. This impact is higher given that, as mentioned above,while the composition of the debt securities portfolio remained rela-tively stable, the share of loanswith moratoria to total loans of banks in scope in this exercise has increased by 1.3 times from 11.83% in May to 15.96% in August 2020. Chart 3.8 shows that their Tier 1 capital ratio would drop from 17.45% to 12.96%, from 18.50%to 14.52% and from 64.44% to 57.06%, respectively. However,the materialisation of the assumed shocks would still leave all three bank categories in a comfortable position to absorb potential losses when compared to the regulatory minimum Tier 1 capital ratio of 6%.
3.2 Liquidity Stress Testing Framework
Persistent Deposit WithdrawalsThepersistentdepositwithdrawals(PDW)frameworkassessestheresilienceofbanks’ liquiditybuffersof the highest quality against a bank-run type of scenario. The framework considers extreme shocks over aperiodoffivedaysandthesubsequentthreeweeksoverwhichthebanks’counterbalancingcapacity(CBC)isassessedinmeetingtheassumedwithdrawals.Thebanks’CBCismadeupof,inter alia: cash; excess on their reserve requirement with the Bank; and funds raised from the sale of marketable securities.
Twoadversescenariosareconsidered.Underthefirstscenario,bankscanobtainECBfundingagainstpledgedsecuritiesandsellFVdebtinstrumentsatfiresaleprices,whileunderthesecondscenariobanksobtain ECB funding against all eligible securities and sell remaining unencumbered FV debt instruments atfiresaleprices.5BanksareassumedtobecomeilliquidiftheirstressedCBCisnotsufficienttomeettheassumedwithdrawals.Theextentofliquidityoutflowsfromdepositsisdrivenbytheterm-to-maturityandtheassumedoutflowswhichdifferforretail,corporateandothercustomercategories.
Tables3.1and3.2presenttheresultsofthePDWframeworkunderbothscenariosasatJune2020,withallthreebankcategoriesretainingexcessliquiditybuffersattheendofthestresstesthorizonunderbothscenarios. Compared to the March 2020 results published in the Special Feature of the FSR 2019,core
5 Firesalepriceshavebeencalibratedonthebasisofmarketpricesobservedduringthe2008financialcrisis.
0
20
40
60
80
0
5
10
15
20
InitialTier 1 capital
ratio
Post-shockTier 1 capital
ratio
InitialTier 1 capital
ratio
Post-shockTier 1 capital
ratio
InitialTier 1 capital
ratio
Post-shockTier 1 capital
ratio
Core domestic banks (6) Non-core domestic banks (4) International banks (5) (RHS)
Chart 3.8STRESS TEST RESULTS ̶ IMPACT OF DETERIORATION IN DEBT SECURITIES PORTFOLIO AND INCREASE IN NPLS IN SENSITIVE SECTORS AND MORTGAGES ON TIER 1 CAPITAL RATIO(per cent)
Source: Central Bank of Malta calculations.
Scenario Day 1 Day 2 Day 3 Day 4 Day 5 Week 2 Week 3 Week 4Core domestic banks 86 83 79 76 73 69 65 62 Non-core domestic banks 80 74 68 63 57 51 44 39 International banks 90 88 87 85 84 82 79 77
Table 3.1
Source: Central Bank of Malta calculations.
STRESS TEST RESULTS ̶ IMPACT OF PERSISTENT DEPOSIT WITHDRAWALS ̶ SCENARIO 1, RESTRICTED ECB FUNDING, EXCESS LIQUIDITY TO TOTAL COUNTERBALANCING CAPACITY(per cent)

32
CENTRAL BANK OF MALTA Interim Financial Stability Report 2020
domesticand international bankshavemarginally improved their excessCBC,whilenon-coredomesticbanks have a slightly lower excess CBC over the entire test horizon. Despite the overall positive aggregate results,weaknessescanbeobservedinafewsmallbankswhichcanbeattributedtotheseverityoftheassumed deposit withdrawals.
LCR-based Liquidity Stress TestThe Liquidity Coverage Ratio (LCR) framework assesses the banks’ ratio of high quality liquid assets (HQLA) tonetcashoutflowsoverthenext30daysagainsttheLCRregulatoryminimumrequirementof100%.
Table 3.3 describes the eight adverse scenarios considered in this framework. The first four adversescenariosconsiderhigherinflowandoutflowsratesfromthoseprescribedintheCommission Delegated Regulation (EU) 2015/61andappliedinthebaseline,pairedtogetherwithhigherwithdrawalsindepositsby residents,non-residents,orboth. Inaddition to thesestandardLCRscenarios, fouradditionalsce-narios are considered in which banks experience a partial or full withdrawal of commitments to NFCs and the retail sector.
Chart 3.9 presents the resulting LCR as at June 2020 under the baseline scenario and the eight adverse scenarios.Onanaggregatelevel,thethreebankcategoriesmanagetosurpassthe100%regulatorymini-mum requirement in all scenarios. Compared to the results for March 2020 published in the Special Feature of the FSR 2019, international banks have increased theirHQLA,mainly aswithdrawable central bankreserves(asreportedinChapter2),leadingtoanalmostthree-timeshigherLCRratio.Thisputsthiscat-egoryofbanksinasounderpositionagainsttheadverseshocks(inMarch2020,internationalbanksfellbelowtheminimumrequirementunderadversescenarios3and4).Ontheotherhand,resultsforcoreandnon-core domestic banks have remained broadly stable.
Scenario Day 1 Day 2 Day 3 Day 4 Day 5 Week 2 Week 3 Week 4Core domestic banks 89 87 84 81 79 76 73 70 Non-core domestic banks 80 74 68 63 57 51 45 39 International banks 91 89 88 87 86 83 81 79
Table 3.2
Source: Central Bank of Malta calculations.
STRESS TEST RESULTS ̶ IMPACT OF PERSISTENT DEPOSIT WITHDRAWALS ̶ SCENARIO 2, UNRESTRICTED ECB FUNDING, EXCESS LIQUIDITY TO TOTAL COUNTERBALANCING CAPACITY(per cent)
Scenario DescriptionBaseline Haircuts and outflow/inflow rates as prescribed by the LCR Delegated RegulationAdverse:Scenario 1 Higher outflows compared to the LCR Delegated Regulation Scenario 2 Scenario 1 with additional withdrawals of resident time deposits (>30 days) Scenario 3 Scenario 1 with additional withdrawals of non-resident time deposits (>30 days)Scenario 4 Scenario 1 with additional withdrawals from both resident and non-resident time deposits Scenario 5 Baseline scenario with 50% withdrawal of committed facilities to NFCsScenario 6 Baseline scenario with 100% withdrawal of committed facilities to NFCs Scenario 7 Baseline scenario with 100% withdrawal of committed facilities to retail, including mortgagesScenario 8 Baseline scenario with 100% withdrawal of committed facilities to retail and NFCs
Table 3.3DESCRIPTION OF BASELINE AND ADVERSE SCENARIOS
Source: Central Bank of Malta.

33
CENTRAL BANK OF MALTA Interim Financial Stability Report 2020
Scenario Initial Tier1 capital
ratio
Parallelup
Paralleldown
Steepener Flattener Shortrate up
Shortrate
down
Core domestic banks 17.5 20.1 15.3 15.8 19.9 20.6 14.9 Non-core domestic banks 18.5 19.6 17.5 17.9 19.3 19.5 17.5 International banks 48.0 49.4 46.7 47.1 49.3 49.6 46.6
Table 3.4
Source: Central Bank of Malta calculations.
STRESS TEST RESULTS ̶ IMPACT OF CHANGES IN NET INTEREST INCOME ON THE TIER 1 CAPITAL RATIO(per cent)
Weaknesses can be observed in afewsmallbanks;however,thesevulnerabilities have to be seen in the context of the severity of the shocks applied. Moreover, giventhe current extraordinary circum-stances, under the supervisors’authority, banks are allowed totemporarily operate with an LCR below the minimum requirement while providing a plan highlight-ing ways how the LCR would be restored.
3.3 Interest Rate Risk in the Banking BookThis test analyses the impact that changes in the shape of the yield curve would have on the banks’ business model. This is done by applying the six scenarios prescribed by the Basel Committee for Bank-ing Supervision (BCBS) guidelines,consistingofanupwardanddownwardparallelshiftatthereferencedate; an increase and a decrease in the short rate end of the curve; and two composite shifts in the short andlong-termratesreferredtoasthe‘steepener’andthe‘flattener’scenarios.Theshocksareassumedtoaffectthedegreeofinterestrateriskbasedontheinterestratetype(fixed,variableoracombinationthereof),thecurrencydenominationandtheresetdateofinterest-bearingassetsandliabilities.
Table 3.4 presents the aggregate post shock Tier 1 capital ratios for the three bank categories. The results are comparable to the results published in the 2019 report with the ‘short-rate down’ scenario having the biggestnegativeeffectonallthreebankinggroupsduetomajorityofinterestbearingassetsandliabilitiesbeingrepriced immediately.Fornon-coredomesticbanks, the impactof ‘short-ratedown’and ‘paralleldown’isequal,whiletherewasonlyamarginaldifferencebetweenthesetwoscenariosforinternationalbanks.Whileprofitmarginscouldcontinuetonarrowintheeventoffurtherdeclinesintheinterestrates,theaggregatepostshockTier1capitalratiowouldremainwell-abovethe6%regulatorythreshold,evenin the most adverse scenarios. All the banks would be able to absorb the impact and have a total capital ratiowhichexceedstherespectiveTSCRrequirementsfollowingthelargestnegativeimpact.Contrarily,‘short-rateup’seemstohavethebiggestpositiveeffectforcoredomesticbanksandinternationalbanks,with‘parallelup’beingaclosesecond.Fornon-coredomesticbanks,theimpactof‘parallelup’ismargin-ally more positive than for ‘short-rate up’.
0
100
200
300
400
500
600
700
800
900
1,000
Baseline Scenario 1 Scenario 2 Scenario 3 Scenario 4 Scenario 5 Scenario 6 Scenario 7 Scenario 8
Core domestic banks Non-core domestic banks International banks
Chart 3.9STRESS TEST RESULTS – LCR RESULTS FOR ALL BANKS(per cent)
Source: Central Bank of Malta calculations.


35
CENTRAL BANK OF MALTA Interim Financial Stability Report 2020
4. Insurance Companies and Investment Funds

36
CENTRAL BANK OF MALTA Interim Financial Stability Report 2020
4. INSURANCE COMPANIES AND INVESTMENT FUNDS
4.1 Domestic Insurance CompaniesAsatJune2020,67insurancecompanieswerelicensedtooperatefromMalta,with€14.7billioninassets,equivalentto113.1%ofGDP.Outofthese,eightunderwriterisksinMalta,withassetsamountingto€3.7billion.Theseconsistedofthreelifeinsurancecorporationsandfivenon-lifeinsurancecorporations,withtwoofthelatteralsolicensedtoprovidelifeinsuranceproducts.WhencomparedtotheDecember2019,assetsofdomestically-focusedinsurancecompaniesdeclinedby2.8%,equivalentto28.3%ofGDP.
Domestic insurance companies reinsured a median of 17.8% of their premia with foreign reinsurance com-panies, up by 0.8 percentage point since 2019, reducing the impact of potentially large claims on theirbalance sheet but strengthening cross-border links.1 Potential contagion risks are deemed to be contained given that reinsurance is spread across various high-rated companies.
The onset of theCOVID-19 pandemic had disrupted somewhat the operations of the insurance sector,potentially challenging the way the sector sells protective cover.
4.1.1 The Domestic Life Insurance CompaniesThebalancesheetofthedomesticlifeinsurerscontractedby3.7%to€3.2billion,equivalentto24.6%ofGDP,withtwoofthethreelifeinsurancecompaniesaccountingforthebulkofwrittenpremia.Thetoplineofbusinessremained‘insurancewithprofitparticipation’accountingfor76.9%oflifeinsurers’grosswrittenpremia,thoughitcontractedby2.8percentagepointsoverDecember2019.2 ‘Index and unit-linked’ products representedaround14%ofgrosswrittenpremia,whichgrewby1.9percentagepoints,whiletechnicalpro-visions set aside for index and unit-linked products remained limited to 16.7% of the life insurers’ technical provisions.3Theremainingshareofgrosswrittenpremiaisclassifiedas‘otherlifeinsurance’.
Holdings of corporate and government bonds decreased marginally but their share increased by 0.2 percent-agepointand0.9percentagepoint,respectivelyto9.5%and28.8%ofthelifeinsurers’assets(seeChart4.1). Sovereign bonds represented almost three fourths of their bond portfolio, with about 43% investedin MGS.
Inthefirsthalfoftheyear,insurersrecorded some shifts in their corpo-rate bond allocation. Although hold-ingsofhigh-ratedbondsincreased,these only accounted for around 6% of total corporate bonds. Mean-while, there was a general thrusttowards lower-rated bonds, ascorporate downgrades resulted in medium-rated paper holdings to decline,whileholdingsoflow-ratedpaperincreased.Atthesametime,insurers shed some of their sub-investment grade bonds, thoughthese still accounted for 16% of the
1 Themedianreinsurancepartofpremiaforthelifeandnon-lifesectorsinJune2020stoodat9.6%and35.6%,respectively.2 ‘Insurancewithprofitparticipation’referstoasavingsproductwhereattheendofeachyeartheinsurancecompanymaydeclareabonusrate,whichformspartoftheannualinvestmentreturn.‘Indexandunit-linked’productsrefertowhentheobligationforthelifeinsur-ance company is represented by the value of the underlying unit.3 The rest of the technical reserves were set for non-unit linked products.
0
5
10
15
20
25
30
35
CollectiveInvestment
Undertakings
GovernmentBonds
Equity Cash anddeposits
CorporateBonds
Other assets
2019 June 2020
Chart 4.1 COMPOSITION OF ASSETS HELD BY THE DOMESTIC LIFE INSURANCE SECTOR (per cent of total assets)
Source: Central Bank of Malta.
Note: Other assets mainly include deferred tax, property, recoverables and receivables, collateralised securities, structured notes, mortgages and loans.

37
CENTRAL BANK OF MALTA Interim Financial Stability Report 2020
corporate bond portfolio (see Chart 4.2).4Geographically,corporatebondholdingswerealmostequallysplitbetweeneuroarea(excludingMalta)countriesandothersoutsidetheeuroarea,witheachstandingatjustabove46%oftheoverallcorporatebondportfolio.TheseweremainlyissuedbyNFCs,banks,otherfinancialintermediaries(OFIs)andcaptives’financialinstitutionsandmoneylenders(CFIMLs).5 The remaining were domesticcorporatebonds,largelyissuedbyCFIMLs,NFCsandfinancialauxiliaries.
Holdingsofequitiesdeclinedby9.1%,mainlyreflectingthefallinmarketprices,toaccountfor16.4%oflifeinsurers’ assets. Such holdings were mainly concentrated in NFCs located in the United States and in the euro area,witharound21%pertainingtodomesticNFCsmainlyinrealestate,andfinancial&insuranceactivitiessectors. Almost 83% of equities related to NFCs were invested in COVID-19 sensitive sectors – mainly in manufacturing,information&communication,andwholesaleandretailsectors.EquityholdingsofMFIsarecontainedat1.3%oftotallifeinsurers’assetsindicatinglimitedcontagionriskinthisregard,withonly0.8%oflife insurers’ assets held with local MFIs.
Participation in Collective Invest-ment Undertakings (CIUs) made up almost a third of life insurers’ assets, and are mainly spreadacrossequity,debt,moneymarketand asset allocation funds, pre-dominately in euro area countries other than Malta.
Other assets include tangible real estate mainly held for investment purposes,whichstoodat4.2%,upby 0.2 percentage point and loans whichremainedstableatjust0.6%,indicating the limited participation of domestic life insurers in non-tra-ditional non-insurance activities. Furthermore, domestic life insur-ances held 10.8% of their assets in the formof cashanddeposits,representing a drop of 5.0% com-pared to December 2019. These were almost all (97.7%) held with domestic banks.
The COVID-19 pandemic impacted theprofitabilityoflifeinsurers.Pre-taxprofitsamountedto€0.6millioninJune2020,muchlowerthanthereported €19.1 million in Decem-ber 2019 (see Chart 4.3).6 Adverse market movements and deteriora-tion in investment activity resulted in a loss of almost €290 million in 4 Investment-gradebondscarryingaratingofAA-oraboveareregardedas‘high-ratedbonds’,‘medium-ratedbonds’arethoseratedbetweenA-andA+,whereas‘low-ratedbonds’arethoseratedbetweenBBB-andBBB+.Sub-investmentgradebondsareratedlowerthan BBB- or are unrated.5 The CFIML consist also of holding companies that hold controlling levels of equity of a group of subsidiary corporations and whose principal activity is of owning the group without providing any other service to the businesses in which the equity is held. 6 Profitfiguresarebasedonfour-quartermovingsumfigures.
€ 18.4
€ 97.5
€ 138.1
€ 48.5
€ 12.1
€ 115.4
€ 124.8
€ 56.1
€ 6.3
-€ 17.9
€ 13.3
-€ 7.6
-50 0 50 100 150
High
Medium
Low
Unrated/sub-investment
Change 2019 June 2020
Chart 4.2 CORPORATE BOND PORTFOLIO − INVESTMENT RATINGS − LIFE INSURANCE SECTOR (EUR millions)
Source: Central Bank of Malta.
-300
-200
-100
0
100
200
300
400
0
5
10
15
20
25
30
35
Pre-
tax
prof
its 2
018
Pre-
tax
prof
its 2
019
Pre-
tax
prof
its J
une
2020
Net
writ
ten
prem
ia
Inve
stm
ent a
ndot
her i
ncom
e
Net
cla
ims
paid
Prov
isio
ns
Net
ope
ratin
g an
dot
her e
xpen
ses
Net
writ
ten
prem
ia
Inve
stm
ent a
ndot
her i
ncom
e
Net
cla
ims
paid
Prov
isio
ns
Net
ope
ratin
g an
dot
her e
xpen
ses
2019 H1 2020
Chart 4.3 MAIN COMPONENTS OF PROFITS − DOMESTIC LIFE INSURANCE SECTOR (EUR millions)
Source: Central Bank of Malta. Note: Grey bars indicate pre-tax profits in absolute amounts. Teal (positive) and red (negative) bars indicate yearly changes in profit components. These figures are based on management accounts.

38
CENTRAL BANK OF MALTA Interim Financial Stability Report 2020
allocated investment returns.Furthermore,adecline ineconomicactivitycoincidedwitha reduction inpremia,whichfellbyaround11%mainlyduetowith-profitparticipationschemes,andariseinclaimsof8.2%,contributingnegativelytotheunderwritingperformanceoflifeinsurers.Theselosseswerepartlyoffsetbyariseinprovisionsagainstunearnedpremia,claimsandotherreserves.Asaresult,pre-taxROEandROAplummetedto0.3%and0.02%from7.8%and0.6%,respectively,in2019.Pre-taxreturnonnetpremiaalsofellto0.2%from5.7%in2019,drivenbyafasterincreaseinnetpremiathanprofitbeforetax.
The macroeconomic impact of COVID-19 also took its toll on the life insurers’ capital levels though their sound position prior to the onset of the pandemic provided the insurers with enough cushioning to withstand thisunprecedentedshock. In June2020, theSolvencyCapitalRequirement (SCR) recovered to160%afterdippingto121.6%inMarch2020,thoughstilllowerthanthe209%inDecember2019.Thecomposi-tion remained healthy with almost all own funds held in Tier 1 capital.
At the same time, liquidity wasnot adversely affected. The liquidassets ratio stood at 78.4%, justmarginally lower than in Decem-ber 2019 (see Chart 4.4).7 Such high liquidity reflected significantholdings of government bonds and listed equities coupled with increased cash holdings. How-ever, the COVID-19 pandemicmay result in liquidity pressures in the future,mainly due to lowervolumes of new business which couldaffectthepaymentofclaimsof older policy holders.
4.1.2 The Domestic Non-life Insurance CompaniesIn contrast to the life insurance sector, the assets of domesticnon-life insurers rose by 3.5% to €478.3 million in June 2020,equivalent to 3.7% of GDP. Busi-ness remained concentrated in the motor vehicle-related segment,which accounted for 43.4% of the total written premia, followed byfire and other property damage,which represented another 26.6% (see Chart 4.5).
Their investment portfolio con-tracted as equity holdings fell by 7.7% due to drops in market prices. However,itremainedprominentat7 The liquid assets ratio shows the proportion of liquid assets on total assets (excluding assets held for unit-linked). The ratio is calculated byapplyingdifferentweights(rangingfrom100%forcashto0%forintangibleassets)tothedifferentassets,accordingtotheirliquidityprofile).
60
65
70
75
80
85
90
95
Dec.2016
Mar.2017
June2017
Sep.2017
Dec.2017
Mar.2018
June2018
Sep.2018
Dec.2018
Mar.2019
June2019
Sep.2019
Dec.2019
Mar.2020
June2020
Minimum-maximum range Liquid assets ratio
Chart 4.4LIQUID ASSETS RATIO OF THE DOMESTIC LIFE INSURANCE SECTOR(per cent)
Source: Central Bank of Malta.
26.6%
22.4% 21.0%
15.9%
4.7% 3.5%
2.8% 1.6% 1.4% Fire and other damage topropertyMotor vehicle liability
Other motor
Medical expense insurance
General liability
Other insurance products
Marine, aviation and transport
Assistance
Miscellaneous financial loss
Chart 4.5 GROSS WRITTEN PREMIUM OF THE DOMESTIC NON-LIFE INSURANCE SECTOR BY LINE OF BUSINESS (per cent of total gross written premia)
Source: Central Bank of Malta. Note: Solvency II Reporting. Other insurance products include workers' compensation, income protection, other life insurance and profit participation, index-linked and unit-linked insurance.

39
CENTRAL BANK OF MALTA Interim Financial Stability Report 2020
23.7% of non-life insurances’ assets (see Chart 4.6). Such equities were predominantly in related insur-ance companies andotherlocalinsurers,implyingahighlevelofinterconnectednessduetocrossowner-ship.8Bondholdingsalsofell,downby4.5%toaccountforalmost10%ofoverallassets.Almost80%wereintheformofcorporatebondswithmorethanhalfinvestedinforeignfirms.Holdingsofunratedcorporatebondsdeclinedbyaround23%toaccountfor31.0%ofassets,whilelow-ratedbondsincreasedby17.2%to 35.3%.9Holdingsofhighly-ratedbondscontractedby8.1%, largelydrivenbycorporatedowngradeswhichdrovesuchNFCstobeclassifiedasmedium-ratedbonds.Theseroseby2.4%tostandat26.8%ofoverall corporate bonds in June 2020. Sovereign bond holdings were almost equally split between foreign anddomesticholdings.Meanwhile,participationsinCIUs,mainlyindebt,equityandmoneymarketfunds,remained stable at 7.9% of the non-life insurers’ assets.
Recoverable and receivables rose by 2.7 percentage points to 23.7% of non-life insurers’ assets.10 The lower investment holdings were offset by higher cash and depos-its which increased by 13.8% since December 2019 to 17.2% of the non-life insurers’ assets, withdeposits predominately held with domestic banks.
Furthermore, during the first halfof 2020, non-life insurers reducedtheir exposures towards the domes-tic real estate market as tangible real estate exposures fell to 16.1% of assets from 17.4% in Decem-ber2019, inpart reflectingsaleofproperties. More than half of these assets were in the form of officeand commercial buildings held for investmentpurposes,with the restmainly held for own use. Non-life insurers did not engage in credit intermediation, while uncollater-alised loans to domestically-related insurance companies remained stable at 0.2% of assets.
COVID-19 also had a considerable impact on the profitability of non-life insurers, albeitmore containedcompared with the life insurance companies. Their pre-tax profitsdecreased by 39.1% to €31.2 mil-lion (see Chart 4.7). The pre-tax ROEandROAdeclined, at 14.9%and 7.2%, respectively, although
8 TherestofthedomesticholdingswerespreadamongequitiesinNFCs,CFIML,banks,OFIsandpensionfunds.EquityholdingsinNFCswerelargelywithintherealestate,information&communication,andtransportation&storagesectors.9 See Footnote 4. 10 These consisted of recoveries of losses from claims that are reimbursed from the reinsurers and receivables in terms of outstanding premia.
0
5
10
15
20
25
30
Rec
over
able
and
rece
ivab
les
Equi
ty
Cas
h an
dde
posi
ts
Prop
erty
Col
lect
ive
inve
stm
ent
unde
rtaki
ngs
Cor
pora
te b
onds
Gov
ernm
ent b
onds
Oth
er a
sset
s
2019 June 2020
Chart 4.6 COMPOSITION OF ASSETS HELD BY THE DOMESTIC NON-LIFE INSURANCE SECTOR (per cent of total assets)
Source: Central Bank of Malta. Note: Other assets mainly include mortgages and loans.
-30
-20
-10
0
10
20
30
0
10
20
30
40
50
60
Pre-
tax
prof
its 2
018
Pre-
tax
prof
its 2
019
Pre-
tax
prof
itsJu
ne 2
020
Net
writ
ten
prem
ia
Inve
stm
ent a
ndot
her i
ncom
e
Net
cla
ims
paid
Prov
isio
ns
Net
ope
ratin
g a
ndot
her e
xpen
ses
Net
writ
ten
prem
ia
Inve
stm
ent a
ndot
her i
ncom
e
Net
cla
ims
paid
Prov
isio
ns
Net
ope
ratin
g an
dot
her e
xpen
ses
2019 H1 2020
Chart 4.7 MAIN COMPONENTS OF PROFITS − DOMESTIC NON-LIFE INSURANCE SECTOR (EUR millions)
Source: Central Bank of Malta. Note: Grey bars indicate pre-tax profits in absolute amounts. Teal (positive) and red (negative) bars indicate yearly changes in profit components. These figures are based on management accounts.

40
CENTRAL BANK OF MALTA Interim Financial Stability Report 2020
these remained relatively healthy given the current unprecedented circumstances. Similarly, the pre-tax return on net premia stood at 19.6%,down from31.5% reportedin 2019. The reduction in profit-ability was mainly due to drops in investment income. While a 2.0% decline in net written premia con-tributed to theweakening inprofit-ability, net claimspaid declinedby3.3% to €76.6 million mainly due to motor, medical and general liabil-ity business, contributingpositivelytoprofitability.Asa result, the lossratiofellslightlyto46.7%,whilethecombined ratio went down by 4.6 percentage points to around 80% in June 2020. The net expense ratio remainedlargelystableat33.2%,withsuchindicatorsallpointingtowardspositiveunderwritingperformance.
Liquiditynarrowedslightlyduringthefirsthalfof2020,withtheliquidassetsratiofallingby0.8percentagepointto38.1%,comparatively lowcomparedtolife insurers,owingtothehighshareof intragroupequityholdingsandrecoverablesandreceivablesheldbynon-lifeinsurers,whichareconsideredasilliquidassetsand carry zero risk-weighting (see Chart 4.8).11
The non-life insurers’ capital remained well-above the supervisory requirements with an overall solvency ratioof251.2%.Althoughcomparedtoend2019,thisratiocontractedby5.4percentagepoints,itimprovedsince March 2020 when it stood at 233.3%. Most of total own funds were held in Tier 1 capital.
4.1.3 The Domestic Insurance Risk Outlook TheCOVID-19shockaffectedtheeconomyacrossseveraldimensions,anditisexpectedtohavealonger-termimpactalsoontheinsurancesector.Thesecondwaveofthepandemiccouldfurtheramplifytheeffectsanalysedabove.Althoughcontainmentmeasuresasyetarelessseverewhencomparedtothefirstwave,nevertheless this could imply that the recovery is likely to be slower than previously anticipated. The current main risks for the insurance sector include a weaker than expected macroeconomic environment accompa-niedbylowforlongeryields,whichcouldaffectassetallocation,profitabilityaswellassolvencyofinsurers.There is also the risk of further ratings downgrades.
AlthoughcapitalmarketsrecoveredsomewhatfromthefalloutatthestartoftheCOVID-19spread,uncer-taintystillremainshighandmarketsarestillveryfragile,particularlyinviewoftheresurgenceofinfectionsatamuchhigherlevelthanthefirstwavewhichisgivingrisetorenewedcontainmentmeasures,particularlyinEurope.Premiaandclaimscouldbe furthernegatively influenceddrivenbyeconomicdevelopments,furtherimpactingtheunderwritingperformanceof insurers.Althoughthepandemichasdecreasedprofitsandaffectedtheircapitalpositions,domesticinsurersasyetstillhaveenoughheadroomtocontinuedealingwith adverse developments.
4.2 Domestic Investment FundsBytheendofJune2020,67sub-fundswereconsideredtobedomestically-relevant,withoverallassetsdecreasing by 7.1% to €2.4 billion, equivalent to 18.2% of GDP. This contraction wasmainly due toredemptions coupled with valuation losses on both equity holdings and bonds. This was mainly observed inequitiesandotherassetallocationsub-funds,withtheirshareinoverallassetsfallingby1.0and2.0
11 Intragroup equity holdings accounted for 18.8% of assets and receivables and recoverables represented another 23.7% of assets.
0
10
20
30
40
50
60
70
Dec.2016
Mar.2017
June2017
Sep.2017
Dec.2017
Mar.2018
June2018
Sep.2018
Dec.2018
Mar.2019
June2019
Sep.2019
Dec.2019
Mar.2020
June2020
Minimum-maximum range Liquid assets ratio
Chart 4.8LIQUID ASSETS RATIO OF THE DOMESTIC NON-LIFE INSURANCE SECTOR(per cent)
Source: Central Bank of Malta.
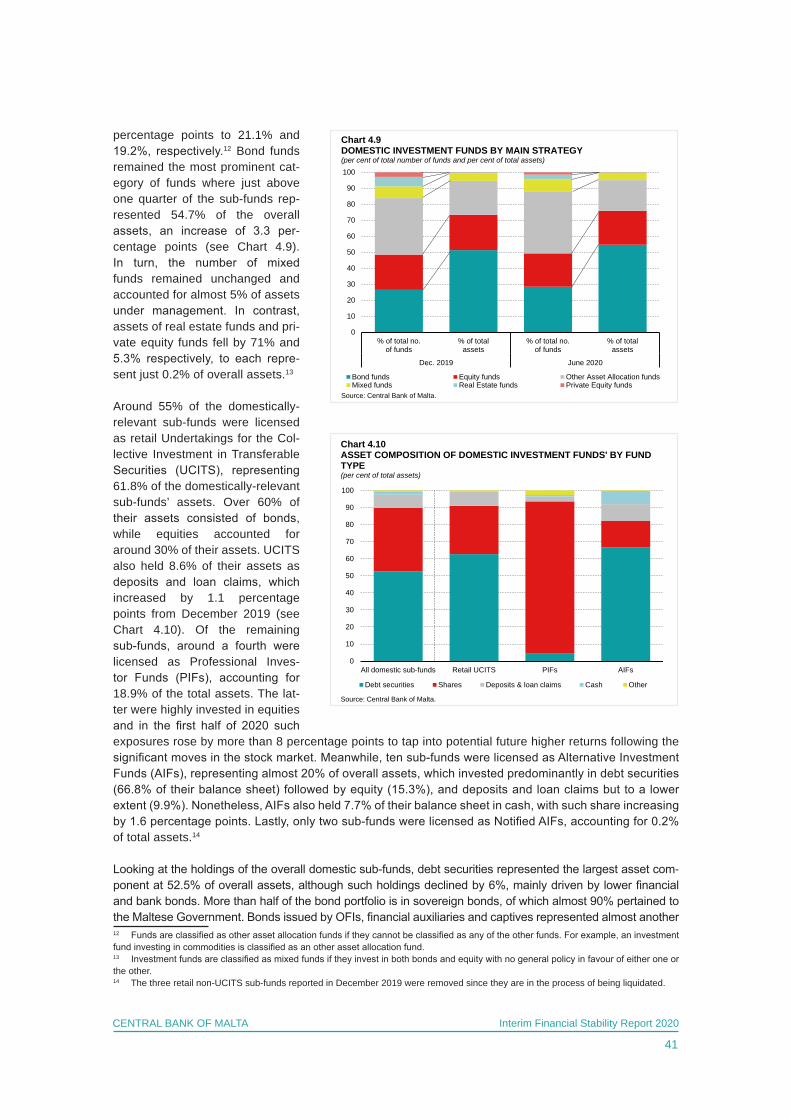
41
CENTRAL BANK OF MALTA Interim Financial Stability Report 2020
percentage points to 21.1% and 19.2%, respectively.12 Bond funds remained the most prominent cat-egory of funds where just above one quarter of the sub-funds rep-resented 54.7% of the overall assets, an increase of 3.3 per-centage points (see Chart 4.9). In turn, the number of mixedfunds remained unchanged and accounted for almost 5% of assets under management. In contrast,assets of real estate funds and pri-vate equity funds fell by 71% and 5.3% respectively, to each repre-sent just 0.2% of overall assets.13
Around 55% of the domestically-relevant sub-funds were licensed as retail Undertakings for the Col-lective Investment in Transferable Securities (UCITS), representing61.8% of the domestically-relevant sub-funds’ assets. Over 60% of their assets consisted of bonds,while equities accounted for around 30% of their assets. UCITS also held 8.6% of their assets as deposits and loan claims, whichincreased by 1.1 percentage points from December 2019 (see Chart 4.10). Of the remaining sub-funds, around a fourth werelicensed as Professional Inves-tor Funds (PIFs), accounting for18.9% of the total assets. The lat-ter were highly invested in equities and in the first half of 2020 suchexposures rose by more than 8 percentage points to tap into potential future higher returns following the significantmovesinthestockmarket.Meanwhile,tensub-fundswerelicensedasAlternativeInvestmentFunds(AIFs),representingalmost20%ofoverallassets,whichinvestedpredominantlyindebtsecurities(66.8%oftheirbalancesheet)followedbyequity(15.3%),anddepositsandloanclaimsbuttoalowerextent(9.9%).Nonetheless,AIFsalsoheld7.7%oftheirbalancesheetincash,withsuchshareincreasingby1.6percentagepoints.Lastly,onlytwosub-fundswerelicensedasNotifiedAIFs,accountingfor0.2%of total assets.14
Lookingattheholdingsoftheoveralldomesticsub-funds,debtsecuritiesrepresentedthelargestassetcom-ponentat52.5%ofoverallassets,althoughsuchholdingsdeclinedby6%,mainlydrivenbylowerfinancialandbankbonds.Morethanhalfofthebondportfolioisinsovereignbonds,ofwhichalmost90%pertainedtotheMalteseGovernment.BondsissuedbyOFIs,financialauxiliariesandcaptivesrepresentedalmostanother12 Fundsareclassifiedasotherassetallocationfundsiftheycannotbeclassifiedasanyoftheotherfunds.Forexample,aninvestmentfundinvestingincommoditiesisclassifiedasanotherassetallocationfund.13 Investmentfundsareclassifiedasmixedfundsiftheyinvestinbothbondsandequitywithnogeneralpolicyinfavourofeitheroneorthe other. 14 The three retail non-UCITS sub-funds reported in December 2019 were removed since they are in the process of being liquidated.
0
10
20
30
40
50
60
70
80
90
100
% of total no.of funds
% of totalassets
% of total no.of funds
% of totalassets
Dec. 2019 June 2020
Bond funds Equity funds Other Asset Allocation fundsMixed funds Real Estate funds Private Equity funds
Chart 4.9DOMESTIC INVESTMENT FUNDS BY MAIN STRATEGY(per cent of total number of funds and per cent of total assets)
Source: Central Bank of Malta.
0
10
20
30
40
50
60
70
80
90
100
All domestic sub-funds Retail UCITS PIFs AIFs
Debt securities Shares Deposits & loan claims Cash Other
Chart 4.10ASSET COMPOSITION OF DOMESTIC INVESTMENT FUNDS' BY FUND TYPE (per cent of total assets)
Source: Central Bank of Malta.

42
CENTRAL BANK OF MALTA Interim Financial Stability Report 2020
quarteroftheportfolio.Around14%ofholdingswereinnon-financialcorporates,ofwhicharoundhalfwereequallysplitbetweenMaltesefirmsandothereuroareacorporates.Bankbondsrepresented7.3%oftheover-allbondportfolio,withalmosthalfissuedbyothereuroareabanksandafurtherthirdbylocalbanks.
Holdings of equities decreased by 5.8% to 37.2% of overall assets. The drop in equities was primarily driven bylowerparticipationinnon-MMFinvestmentfunds,largelydomiciledintheeuroarea,whichdecreasedbyalmostathirdtoaccountforslightlyaboveaquarteroftheoverallequities.Meanwhile,directequityholdingsalsodecreased,downbyaroundaquartertoalmosttwo-thirdsofoverallequities.15 The drop was largely driven bylowerinvestmentsinOFIs,financialauxiliariesandcaptives,whichdroppedby85.1%.SharesinNFCs,whichaccountedforaroundhalfoftheequityportfolioalsofell.TheseweremainlyheldineuroareaNFCs,which were also adversely impacted as indicated by the drop in some of their equity prices.
Duringthefirstsixmonthsof2020,theshareofdepositsandloanclaimsdecreasedby1.4percentagepointsto7.7%ofoverallassets,whilecashholdings grew marginally to 1.7% of total assets. Other assets, includ-ing financial derivatives, stood at0.9%oftotalassets,upfrom0.7%in December 2019.16
Maltese households and NPISH continued to be the principal inves-tors in domestically-relevant sub-funds, largely through their par-ticipation in retailUCITSandAIFs,although their share of the overall net asset value (NAV) fell by 11 percent-age points to 44.4%. Maltese NFCs meanwhile represented 24.8% of theoverallNAV,upby1.2percent-age points and largely invested in PIFs. Domestic MFIs represented more than20%of theoverallNAV,and are mainly invested in retail UCITS (see Chart 4.12).
Overall, domestically-relevantinvestment funds represented 3.5% and 1.9% of the Maltese house-holds’ and the NFCs’ financialwealth,respectively.
4.2.1 Risk Assessment
Liquidity ProfileDomestically, PIFs reported thehighest liquid assets ratio which rose by 8.1 percentage points to 90.3%.17Meanwhile,UCITS,whichare globally recognised as highly liquid,reporteda liquidassetsratioof70.5%,justmarginallybelowthat15 DirectequityholdingsincludeinvestmentsinMFIs,OFIs,financialauxiliariesandcaptives,insurancecorporationsandNFCs.16 The‘Other’categoryconsistsofotherfinancialassets,non-financialassets(includingfixedassets)andfinancialderivatives.17 Liquidassets includecashanddepositswithbanks,debtsecurities issuedbyMFIs,sovereignbonds,equityand investmentfundshares.
0
10
20
30
40
50
60
Dec. 2016 Dec. 2017 Dec. 2018 Dec. 2019 June 2020
Bonds Equity Deposits Loans Cash OtherSource: Central Bank of Malta.Note: The 'Other' category consists of other financial assets, non-financial assets (including fixed assets) and, to a lesser extent, financial derivatives.
Chart 4.11ASSETS COMPOSITION OF THE DOMESTICALLY-RELEVANT INVESTMENT FUNDS (per cent of assets)
0
10
20
30
40
50
60
70
80
90
100
Domestic sub-funds Retail UCITS PIFs AIFs
MT households MT insurance companies MT banksMT NFCs MT investment funds MT OFIs
Chart 4.12DOMESTIC INVESTMENT FUNDS' NAV BY COUNTERPARTY(% of NAV)
Source: Central Bank of Malta.

43
CENTRAL BANK OF MALTA Interim Financial Stability Report 2020
of AIFs which stood at 72.4%. As a result,theoverallliquidassetsratioof the domestically-relevant invest-ment funds stood at 75.1% in June 2020, up by 0.5 percentage pointfrom December 2019. This shows that, overall, domestic investmentfunds have increased their capacity toabsorbliquidityshocks.However,liquid assets decreased in absolute amounts, particularly due to lowerdeposits with banks and lower equity and investment fund shares (see Chart 4.13).18
LeverageDomestically, leverage remainedlimitedacrossalltypeofsub-funds,with the AUM-to-NAV ratio decreas-ing marginally to 100.8%. PIFs’ AUM-to-NAVratiostoodat101.4%,while the ratio for both AIFs and retail UCITS was slightly lower at 100.6%. This means that most of theassetsarefundedthroughNAV,thus sourced directly from investors (see Chart 4.14).
Concentration RiskIn line with their focus on domes-tic business, around 46% of thesecurities portfolio of domestically-relevant investment funds is con-centratedinMalta,withsecuritiesofeuro area sovereigns accounting for about 40% of the overall securities portfolio (see Chart 4.15). The bond portfolio is highly concentrated in domestic sovereignpaper,with theshare of such holdings on the total assetsincreasingfurther inthefirsthalfof2020,accounting foralmostone quarter of the assets. The increased shift towards local sov-ereign holdings mainly arises from the relatively higher domestic yields when compared to other countries in the euro area.
4.2.2 Risk Outlook Links of investment funds with other financial services entitiesremained a structural feature of
18 ThethreedomesticRetailNon-UCITSfundsarecurrentlybeingliquidated,thereforetheyarebeingexcludedfromtheassessment.
0
10
20
30
40
50
60
70
80
90
100
Dec . 2016 Dec. 2017 Dec. 2018 Dec. 2019 June 2020
Retail UCITS PIFs Retail non-UCITS AIFs
Chart 4.13LIQUID ASSETS RATIO OF THE DOMESTICALLY-RELEVANT INVESTMENT FUNDS BY LICENCE(per cent of assets)
Source: Central Bank of Malta.Note: Liquid assets include deposits with banks, debt securities issued by MFIs, sovereign bonds, equity and investment fund shares and cash. June 2020 figures exclude domestic Retail Non-UCITS funds since they are currently being liquidated.
100.0% 100.5% 101.0% 101.5% 102.0% 102.5%
Dec. 2016
Dec. 2017
Dec. 2018
Dec. 2019
June 2020
AUM-to-NAV Ratio
Source: Central Bank of Malta.
Chart 4.14RATIO OF ASSETS UNDER MANAGEMENT (AUM) TO NAV OF THE DOMESTIC INVESTMENT FUNDS (per cent)
40.4%
46.1%
13.8%
39.8%
46.4%
13.9%
Euro area Malta Rest of the World
Source: Central Bank of Malta
DEC. 2019
JUNE2020
Chart 4.15COUNTRY EXPOSURE OF THE SECURITIES PORTFOLIO OF DOMESTICALLY-RELEVANT INVESTMENT FUNDS(per cent of securities portfolio)

44
CENTRAL BANK OF MALTA Interim Financial Stability Report 2020
domestically-relevantsub-funds,assomeassetmanagementcompaniesareownedbythecoredomes-ticbanks.Yet,spill-overrisksaresomewhatmitigatedsincefundsaresetupasseparatelegalentities,although possible step-in and reputational risks remain. Other risks are more cyclical in nature. Implied volatilitymeasuredonboththethree-montheuro-dollarrateand,toalesserextent,oftheS&P500andDAXindexes,whicharetimelyindicatorsofinvestors’uncertainty,stillremainedabovepre-COVIDlev-els,althoughwellbelowthehighspreviouslyseenat thestartof thepandemic,showingunwillingnessby some investors to take on risks. Investment funds’ exposure to COVID-19 sensitive sectors doubled comparedtoDecember2019,withsuchsecuritiesamountingto24.1%ofassets,mainlydrivenbyhigherexposures to real estate sector bonds and shares within the information and communication sector.19
Goingforward,aprotractedeconomicrecoverycoupledwithincreasedinvestoruncertaintyamidhighlevelsofmarketvolatilitycouldtriggerareassessmentofriskpremia,makingitmorecostlyforleveragedcorporatebalancesheets.This,coupledwithgeopoliticaltensionsandlow-for-longerinterestrateenvironment,couldtrigger further excessive search-for-yield behaviour.
19 The share of investment funds exposed to COVID-19 sensitive sectors is based on security-by-security (SBS) data only. SBS data for debt securities represent 98.2% of total debt securities holdings and SBS data for equity holdings represent 64.4% of total equity holdings. COVID-19 sensitive sectors are the same as those considered as such in the FSR 2019,Specialfeature:COVID-19–AspectsofFinancialSector Resilience.

Interim Financial Stability Report 2020
45
CENTRAL BANK OF MALTA
Appendix


Interim Financial Stability Report 2020
47
CENTRAL BANK OF MALTA
Appe
ndix
Fina
ncia
l Sou
ndne
ss In
dica
tors
2016
2017
2018
2019
June
20
2020
1620
1720
1820
19Ju
ne
2020
2016
2017
2018
2019
June
20
2020
1620
1720
1820
19Ju
ne
2020
Cor
e FS
IsR
egul
ator
y ca
pita
l to
risk-
wei
ghte
d as
sets
16.1
617
.28
18.1
320
.10
19.9
815
.48
16.6
817
.21
18.4
118
.68
49.2
047
.93
52.9
747
.15
51.4
121
.17
21.6
822
.66
23.6
623
.96
Reg
ulat
ory
Tier
1 c
apita
l to
risk-
wei
ghte
d as
sets
13.5
815
.19
16.0
017
.58
17.4
512
.27
13.3
116
.99
18.4
118
.68
46.6
945
.28
34.3
644
.44
51.1
018
.53
19.3
918
.55
21.4
121
.99
Non
-per
form
ing
loan
s ne
t of s
peci
fic p
rovis
ions
& in
tere
st in
sus
pens
e to
tota
l ow
n fu
nds2
28.9
022
.37
19.7
818
.25
19.0
711
.98
6.87
11.5
424
.89
28.5
98.
156.
897.
712.
723.
6920
.10
16.3
415
.34
14.4
315
.54
Non
-per
form
ing
loan
s to
tota
l gro
ss lo
ans
5.32
4.07
3.36
3.21
3.45
3.99
2.26
3.64
5.50
7.09
1.70
1.88
2.50
1.82
1.82
4.12
3.23
3.08
2.96
3.23
Sect
oral
dist
ribut
ion
of re
siden
t loa
ns to
tota
l loan
sAg
ricul
ture
0.19
0.16
0.14
0.15
0.14
0.00
0.00
0.00
0.01
0.01
0.00
0.00
0.00
0.00
0.00
0.12
0.09
0.08
0.09
0.09
Fish
ing
0.07
0.35
0.23
0.16
0.12
0.00
0.00
0.00
0.00
0.00
0.00
0.00
0.00
0.00
0.00
0.05
0.20
0.14
0.10
0.08
Min
ing
and
quar
ryin
g0.
070.
010.
010.
010.
010.
000.
000.
000.
000.
000.
000.
000.
000.
000.
000.
040.
010.
000.
000.
00M
anuf
actu
ring
2.57
2.64
2.49
1.78
1.71
0.31
0.43
0.34
0.42
0.42
0.01
0.01
0.00
0.00
0.01
1.60
1.55
1.50
1.14
1.13
Elec
trici
ty, g
as, s
team
and
air
cond
itioni
ng s
uppl
y2.
301.
551.
381.
481.
630.
000.
000.
880.
000.
000.
000.
000.
000.
000.
001.
410.
900.
870.
931.
05W
ater
sup
ply;
sew
erag
e w
aste
man
agem
ent a
nd re
med
iatio
n ac
tivitie
s0.
460.
430.
390.
360.
340.
000.
000.
000.
020.
020.
000.
000.
000.
000.
000.
280.
250.
230.
230.
22C
onst
ruct
ion
4.88
4.54
4.37
4.54
4.50
0.03
2.51
3.30
4.79
6.04
0.00
0.00
0.00
0.00
0.00
2.99
2.74
2.78
3.10
3.22
Who
lesa
le a
nd re
tail t
rade
; Rep
air o
f mot
or v
ehic
les
and
mot
or c
ycle
s7.
806.
856.
275.
385.
240.
422.
235.
241.
762.
460.
000.
000.
010.
000.
004.
804.
074.
013.
463.
50Tr
ansp
orta
tion
and
stor
age
2.30
2.27
1.68
1.46
1.47
0.00
0.00
0.00
0.51
0.66
0.15
0.16
0.24
0.24
0.24
1.46
1.38
1.09
1.02
1.06
Acco
mod
atio
n an
d fo
od s
ervic
e ac
tivitie
s3.
472.
782.
963.
203.
560.
000.
000.
000.
050.
190.
000.
000.
000.
000.
002.
121.
611.
772.
002.
30In
form
atio
n an
d co
mm
unic
atio
n0.
670.
480.
520.
440.
500.
020.
070.
050.
120.
160.
000.
000.
000.
000.
000.
410.
280.
310.
280.
33Fi
nanc
ial a
nd in
sura
nce
activ
ities
6.79
6.26
6.13
6.17
6.22
2.59
3.71
1.91
2.87
3.14
1.31
0.06
0.00
0.03
0.10
4.74
3.81
3.76
4.02
4.20
Rea
l est
ate
activ
ities
[incl
udes
inpu
ted
rent
s of
ow
ner-o
ccup
ied
dwel
lings
]7.
266.
956.
907.
387.
294.
184.
364.
766.
056.
120.
030.
000.
000.
000.
004.
704.
214.
364.
945.
02Pr
ofes
siona
l, sc
ient
ific a
nd te
chni
cal a
ctivi
ties
1.26
1.42
1.69
2.59
2.46
0.00
0.86
0.80
0.54
0.80
0.00
0.00
0.00
0.00
0.00
0.77
0.86
1.05
1.65
1.63
Adm
inist
rativ
e an
d su
ppor
t ser
vice
activ
ities
1.02
0.81
0.65
1.18
1.25
0.69
1.09
0.76
1.18
1.24
0.01
0.03
0.03
0.00
0.00
0.67
0.52
0.43
0.80
0.87
Publ
ic a
dmin
istra
tion
and
defe
nce;
Com
pulso
ry s
ocia
l sec
urity
1.13
1.30
1.21
1.13
1.18
0.00
0.00
0.00
0.00
0.00
0.00
0.00
0.00
0.00
0.00
0.69
0.76
0.72
0.71
0.76
Educ
atio
n0.
330.
290.
280.
260.
260.
000.
000.
000.
000.
010.
000.
000.
000.
000.
000.
210.
170.
170.
170.
17H
uman
hea
lth a
nd s
ocia
l wor
k ac
tivitie
s0.
710.
720.
790.
760.
720.
000.
000.
000.
000.
000.
000.
010.
000.
000.
000.
440.
420.
470.
470.
47Ar
ts, e
nter
tain
men
t and
recr
eatio
n0 .
380.
320.
270.
240.
240.
000.
000.
000.
010.
010.
020.
000.
000.
000.
000.
240.
180.
160.
150.
15O
ther
ser
vices
act
ivitie
s0.
210.
180.
190.
270.
250.
000.
000.
260.
040.
050.
000.
000.
000.
030.
030.
130.
110.
130.
180.
17H
ouse
hold
s an
d in
divid
uals
(exc
l. So
le P
ropr
ieto
rs)
48.2
647
.51
46.8
550
.38
49.5
10.
142.
623.
455.
846.
250.
010.
000.
010.
010.
0129
.56
27.6
628
.16
31.7
832
.17
Mor
tgag
es42
.28
42.3
742
.29
45.8
545
.28
0.01
0.00
0.00
0.00
0.00
0.01
0.00
0.00
0.00
0.00
25.8
924
.57
25.2
628
.63
29.1
1Ac
tivitie
s of
ext
rate
rrito
rial o
rgan
isatio
ns a
nd b
odie
s0.
000.
000.
000.
000.
000.
000.
000.
000.
000.
000.
000.
000.
000.
000.
000.
000.
000.
000.
000.
00N
on-re
siden
t loa
ns to
tota
l loan
s7.
8412
.16
14.6
210
.67
11.4
091
.60
82.1
078
.25
75.7
872
.43
98.4
699
.73
99.7
299
.69
99.6
342
.57
48.2
247
.81
42.8
041
.44
Ret
urn
on a
sset
s30.
760.
700.
540.
570.
170.
300.
250.
161.
190.
630.
961.
481.
441.
091.
990.
841.
040.
900.
800.
82
Ret
urn
on e
quity
310
.06
9.20
6.54
6.67
1.96
3.38
2.94
1.53
10.6
05.
503.
654.
915.
225.
685.
966.
727.
335.
726.
733.
45In
tere
st m
argi
n to
gro
ss in
com
e 62
.25
70.7
962
.28
63.6
770
.00
31.2
431
.06
37.6
731
.69
31.5
292
.57
78.8
279
.56
55.1
152
.01
72.9
973
.28
69.2
857
.72
58.3
9N
on-in
tere
st e
xpen
se to
gro
ss in
com
e 52
.21
58.8
064
.34
67.8
376
.74
66.5
278
.25
62.0
546
.73
53.8
531
.89
28.1
332
.13
39.0
932
.59
44.7
044
.04
48.9
354
.20
52.7
3N
on-in
tere
st in
com
e to
gro
ss in
com
e 37
.75
29.2
137
.72
36.3
330
.00
68.7
668
.94
62.3
368
.31
68.4
87.
4321
.18
20.4
444
.89
47.9
927
.01
26.7
230
.72
42.2
841
.61
Liqu
id a
sset
s to
tota
l ass
ets4
36.5
229
.36
28.3
230
.95
32.4
433
.45
28.5
832
.02
36.1
633
.54
30.1
420
.56
19.8
914
.08
15.5
035
.56
16.6
027
.91
30.0
831
.13
Liqu
id a
sset
s to
sho
rt-te
rm lia
biliti
es4
55.8
043
.49
37.1
639
.10
36.7
367
.79
37.3
638
.81
44.7
836
.65
96.3
143
.69
46.7
227
.85
22.4
158
.71
42.9
637
.81
39.0
837
.41
Oth
er F
SIs
Tota
l cov
erag
e ra
tio5
45.9
145
.24
44.3
543
.64
48.4
753
.86
65.8
964
.61
40.9
644
.88
54.8
151
.85
53.1
968
.96
72.3
847
.96
47.4
445
.61
44.9
951
.85
Liqu
idity
Cov
erag
e R
atio
164.
4327
6.03
316.
0734
1.63
329.
7319
4.89
263.
8742
1.34
381.
6639
8.69
357.
6327
9.41
411.
7237
1.92
1044
.82
173.
8727
5.31
329.
3834
4.81
345.
19D
omes
tic d
ebt s
ecur
ities
to to
tal a
sset
s7.
907.
006.
456.
449.
174.
863.
162.
002.
795.
420.
090.
150.
110.
080.
114.
023.
573.
674.
096.
04Fo
reig
n de
bt s
ecur
ities
to to
tal a
sset
s20
.62
16.8
315
.82
15.3
714
.63
14.9
611
.87
14.0
810
.74
11.2
746
.91
42.6
529
.70
26.3
325
.19
32.8
328
.89
21.2
118
.66
17.7
5U
nsec
ured
loan
s to
tota
l lend
ing
25.3
627
.70
28.5
926
.28
25.9
265
.39
67.1
673
.39
75.9
474
.51
26.6
916
.23
17.2
222
.56
20.8
228
.18
24.9
726
.83
27.8
126
.99
Asse
ts to
tota
l cap
ital a
nd re
serv
es13
.33
11.9
912
.16
11.5
112
.01
12.1
211
.49
8.97
8.60
8.83
2.91
3.36
2.83
2.46
2.58
9.56
9.25
8.92
8.60
8.94
Larg
e ex
posu
re to
tota
l ow
n fu
nds
110.
9488
.40
92.8
487
.88
103.
3826
8.59
274.
9420
5.74
144.
6536
7.68
128.
7711
9.22
79.0
984
.82
88.7
313
0.11
111.
0597
.90
92.1
312
1.36
Gro
ss a
sset
pos
ition
in fi
nanc
ial d
eriva
tives
to to
tal o
wn
fund
s1.
650.
870.
630.
570.
410.
610.
290.
030.
030.
0910
3.03
131.
2416
8.78
125.
6512
9.76
37.8
342
.68
52.9
035
.12
36
.76
G
ross
liabi
lity p
ositio
n in
fina
ncia
l der
ivativ
es to
tota
l ow
n fu
nds
2.04
1.03
0.92
1.45
1.79
3.60
0.29
0.90
0.05
0.52
69.1
980
.24
104.
0681
.95
91.3
822
.57
26.4
133
.01
23.5
926
.88
Pers
onne
l exp
ense
s to
non
-inte
rest
exp
ense
s48
.76
48.0
537
.85
43.7
543
.85
49.7
445
.61
49.6
749
.26
49.4
319
.88
16.2
214
.14
14.7
114
.16
40.5
237
.58
31.1
935
.30
34.8
3C
usto
mer
loan
s to
cus
tom
er d
epos
its55
.95
58.8
760
.88
59.4
959
.30
46.5
147
.14
50.4
747
.41
47.0
710
8.14
111.
5518
9.84
373.
0948
9.33
65.6
670
.35
78.0
179
.36
79.2
7N
et o
pen
posit
ion
in e
quitie
s to
tota
l ow
n fu
nds
14.0
113
.10
10.8
310
.45
10.2
714
6.79
138.
7510
7.47
100.
6781
.30
1.13
3.40
4.81
5.74
5.80
20.1
718
.58
16.9
517
.24
14.9
5
Loan
-to-v
alue
:6
Res
iden
tial
75.1
273
.53
72.7
175
.67
76.6
0
Com
mer
cial
767
.49
65.1
456
.65
70.4
657
.97
1 Sat
aban
k pl
c is
excl
uded
from
201
8 fig
ures
onw
ards
follo
win
g th
e M
FSA’
s de
cisio
n to
app
oint
a c
ompe
tent
per
son
in O
ctob
er 2
018
in te
rms
of A
rticl
e 29
(1)(c
) and
(d) o
f the
Ban
king
Act
. Its
licen
ce w
as w
ithdr
awn
on 3
0 Ju
ne 2
020.
2 Spe
cific
pro
visio
ns fr
om 2
018
refe
r to
Stag
e 3
allo
wan
ces.
3 Bas
ed o
n pr
ofits
afte
r tax
. 4 T
he liq
uid
asse
ts to
tota
l ass
ets
and
liqui
d as
sets
to s
hort-
term
liabi
lities
figu
res
from
201
7 ar
e ba
sed
on C
OR
EP re
turn
s.5 F
or th
e co
re d
omes
tic b
anks
, the
ratio
incl
udes
'Res
erve
for G
ener
al B
anki
ng R
isks'
as p
er th
e re
vised
Ban
king
Rul
e 09
/201
9.6 T
he lo
an-to
-val
ue ra
tio is
bas
ed o
n a
wei
ghte
d av
erag
e.7 T
he m
arke
t sha
re o
f the
ban
ks w
as a
djus
ted
to c
ater
sol
ely
for t
he b
anks
that
pro
vided
com
mer
cial
real
est
ate
loan
s. T
he v
olum
e of
suc
h tra
nsac
tions
is lim
ited
whi
ch e
xpla
ins
the
vola
tility
in th
e w
eigh
ted
indi
cato
rs.
Cor
e D
omes
tic B
anks
Non
-Cor
e D
omes
tic B
anks
Inte
rnat
iona
l Ban
ks1
Tota
l Ban
ks1