interim investor december 2016 - distell
TRANSCRIPT

1
Interim investor – December 2016
Richard Rushton – Managing Director
Lucas Verwey – Financial Director
Investor Presentation Interim results as of December 2016

2
Interim investor – December 2016
Overall sales volumes lower mainly due to: o High H1 2015/16 base as a result of RSA price
increase timing o Ciders impacted by trade down as
disposable incomes come under pressure in SA
o Intensified beer pricing and pack activities in formal channels as well as recent RTD launches
o Challenging conditions in Africa
On a normalised FX basis, EBITDA increased by
17.2% and HLE by 22.8%
EBITDA & HLE impacted by strengthening of the Rand compared to prior year
The improved performance is driven by efficiencies, optimised A&P spend and cost reductions
NormalisedNormalised
FX#
Sales volumes -3.1% -3.1%
Revenue 2.4% 3.0%
EBITDA* -0.3% 17.2%
Headline earnings 1.1% 22.8%
Headline earnings per share 1.0% 22.6%
Growth in total assets 2.8% 3.9%
Salient features of our performance to
December 2016
# Throughout this presentation, “normalised FX” refers to normalised performance excluding exchange rate movements
Salient features and key performance metrics H1 Strong efficiencies and cost containment improved like-for-like profitability

3
Interim investor – December 2016
Continued growth in wine – 4th Street achieved high double digit
growth, with further growth coming from Perle wine brands
Brandy volume growth , led by double digit growth in Viceroy
Gin recorded another year of strong double digit growth
Weaker performance in Whisky
Cider volumes impacted by pricing, high base and increased competition
Mainstream momentum continues – RTD’s and Wines
Significant progress made across priority initiatives:
o COGS efficiencies – returnable bottles, crate project, cost savings
o Champion wine in mainstream – 4th Street leading mainstream market penetration
o Extract benefits of SFE – Incorporation of “Accelerated Competency Development
Program” to build sales capability
o Luxury brand portfolio – new influencer and hospitality teams established
o Marketing effectiveness – portfolio optimisation, marketing effectiveness including
planning and tracking through CRM
South Africa performance highlights Growth in wine and spirits in South Africa despite tough market conditions
Volume growth in wine and spirits
Revenue growth despite volume decline
Gross profit margin relatively flat
Operational efficiencies and cost containment contributed to EBIT growth
Volume Revenue Revenue % Distell
South Africa -1.1% 5.1% 76.2%

4
Interim investor – December 2016 Africa (incl BLNS) performance highlights Challenging macro-economic conditions across the continent
Africa – +/- 70% of volume decline due to Angola excl BLNS
Other markets show mixed results due to slower economic growth
BLNS – impacted by subdued growth in Namibia
Prudent cost management delivers 3.9% EBIT growth
Volume Revenue Revenue % Distell
Africa (Incl BLNS) -12.8% -8.0% 12.7%
Revenue % Africa
BLNS -3.9% 2.2% 65.7%
Mozambique -12.4% -15.8% 6.9%
Zambia -14.1% -13.4% 6.4%
Angola -61.7% -66.4% 3.6%
Kenya -9.4% -3.1% 3.5%
Nigeria 12.5% -11.3% 3.5%
Ghana -19.9% 4.0% 2.9%
Other -6.0% -3.7% 7.5%
5
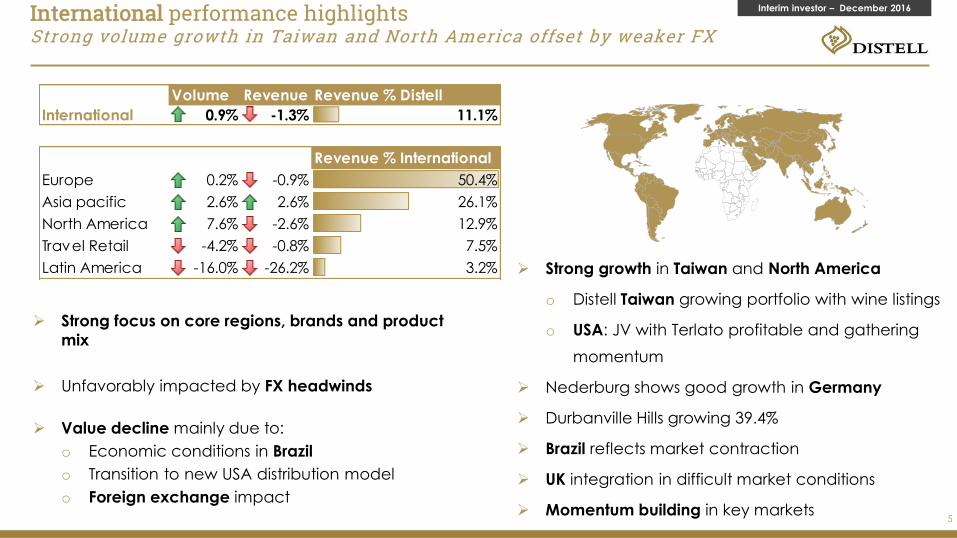
Interim investor – December 2016 International performance highlights Strong volume growth in Taiwan and North America offset by weaker FX
Strong focus on core regions, brands and product
mix
Unfavorably impacted by FX headwinds
Value decline mainly due to:
o Economic conditions in Brazil
o Transition to new USA distribution model
o Foreign exchange impact
Strong growth in Taiwan and North America
o Distell Taiwan growing portfolio with wine listings
o USA: JV with Terlato profitable and gathering
momentum
Nederburg shows good growth in Germany
Durbanville Hills growing 39.4%
Brazil reflects market contraction
UK integration in difficult market conditions
Momentum building in key markets
Volume Revenue Revenue % Distell
International 0.9% -1.3% 11.1%
Revenue % International
Europe 0.2% -0.9% 50.4%
Asia pacific 2.6% 2.6% 26.1%
North America 7.6% -2.6% 12.9%
Travel Retail -4.2% -0.8% 7.5%
Latin America -16.0% -26.2% 3.2%

6
Interim investor – December 2016 Power and luxury brands Our unique brand crafting capabilities position Distell to grow our consumer base
• Hunter’s: 660ml delivering value at the right price point
•4th Street: Recruiting new consumers to the wine category and our brands
•Amarula: Successfully building premium cues for our core assets
•Savanna Loco: Transcending traditional category boundaries
CATEGORY EXPANSION
BRAND RENOVATION
OFFERING VALUE
CONSUMER BASE
EXPANSION
H1 2017 H1 2016
Value growth Value growth
Power Brands 3.9% 11.3% 89.7%
Luxury brands -0.5% 13.1% 10.3%
Contribution to
Distell
INSIGHTS:
Heavy discounting and acceleration in
consumer trading down trends in RSA
Increased competition in blended whisky in
all key markets
Premium offerings under pressure; strategy
review being finalised
Core brand renovation completed for all
focus brands
Rate of innovation increased in RTD
segment
7
Interim investor – December 2016
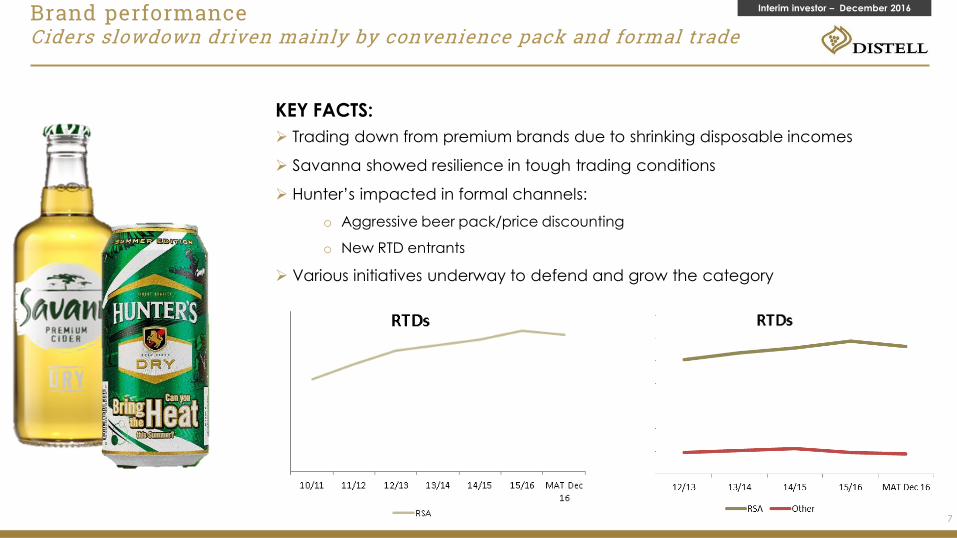
KEY FACTS:
Trading down from premium brands due to shrinking disposable incomes
Savanna showed resilience in tough trading conditions
Hunter’s impacted in formal channels:
o Aggressive beer pack/price discounting
o New RTD entrants
Various initiatives underway to defend and grow the category
Brand performance Ciders slowdown driven mainly by convenience pack and formal trade
8
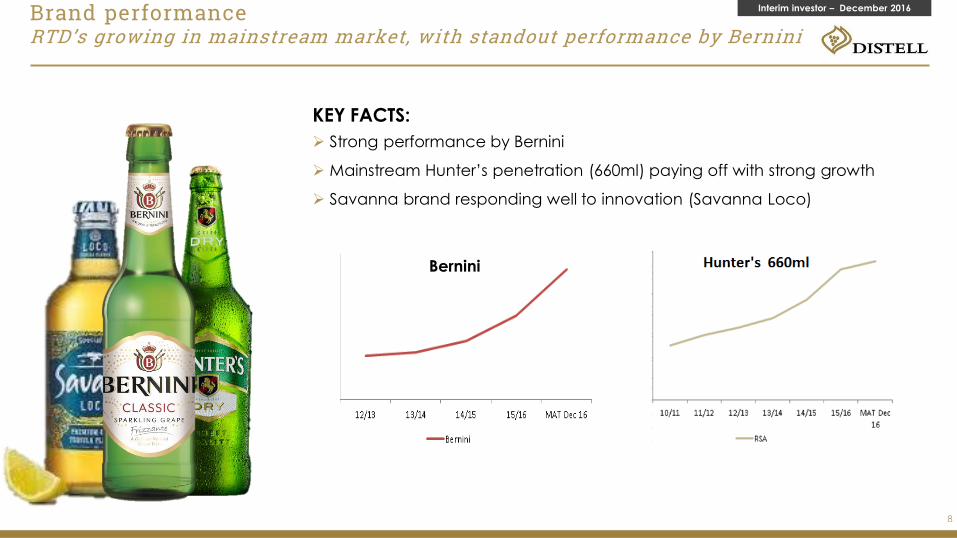
Interim investor – December 2016 Brand performance RTD’s growing in mainstream market, with standout performance by Bernini
KEY FACTS:
Strong performance by Bernini
Mainstream Hunter’s penetration (660ml) paying off with strong growth
Savanna brand responding well to innovation (Savanna Loco)
Bernini

9
Interim investor – December 2016 Brand performance 4th Street continues strong double digit growth
KEY FACTS:
SA Market leadership momentum continues
Worlds fastest growing wine brand (IWSR)
KEY INITIATIVES:
Pack upgrade & new mix to launch Q1
Up weighted on-con presence to drive perfect serve
Outdoor increased in mainstream hubs

10
Interim investor – December 2016 Brand performance JC le Roux comes back with strong SA growth
KEY FACTS:
Volume growth in RSA
SA sparkling leadership position strengthened
Angolan economy put pressure on performance
KEY INITIATIVES:
Launch of Vibrazio a new drier range in progress, with key focus on listings and trial

11
Interim investor – December 2016 Brand performance Two Oceans delivers growth across all focus markets
KEY FACTS:
SA volume share up +0.8%; SA 3l BIB driving growth
No 1 standard price wine in Ontario
Canada’s strong momentum continues
KEY INITIATIVES:
Global IWSR Silver award applied to all Sauvignon Blanc
Pinot Noir Canada launch & Fruity upgrade Europe Q3

12
Interim investor – December 2016 Brand performance Durbanville Hills – continued growth across territories
KEY FACTS:
Continued growth across multiple countries
Launched Terlato range in the USA
Successful launch of Sparkling Sauvignon Blanc (Nov ’16)
KEY INITIATIVES:
Drive on-con listings for Sparkling Sauvignon Blanc
Ensure successful introduction of Durbanville Hills in Brazil
Continued support to Terlato Wines to drive volumes in USA
Launched Atlantic View (Off-trade offering) in the UK

13
Interim investor – December 2016 Brand performance Nederburg– Ultra premium tier performance delivering good results
KEY FACTS:
Heritage Heroes & 5600 tiers continued growth
Entrenching quality credentials due to multiple awards
Germany delivering good volume growth (26.0%) on back of pack upgrade
KEY INITIATIVES:
Leverage IWSC Producer of the year
Continued collaboration with Team Dimension Data for Qhubeka
Entrenching new positioning “Curiously the best of both worlds”
14
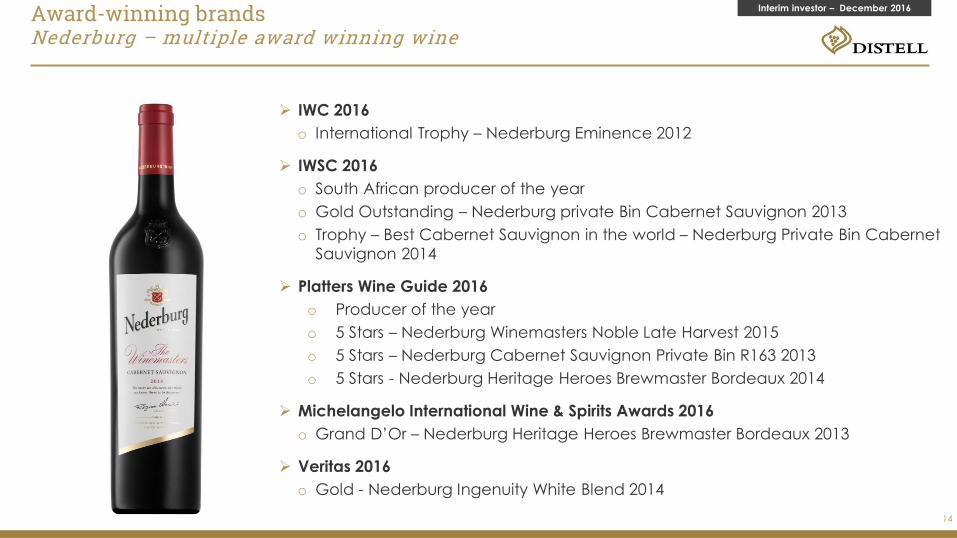
Interim investor – December 2016 Award-winning brands Nederburg – multiple award winning wine
IWC 2016
o International Trophy – Nederburg Eminence 2012
IWSC 2016
o South African producer of the year
o Gold Outstanding – Nederburg private Bin Cabernet Sauvignon 2013
o Trophy – Best Cabernet Sauvignon in the world – Nederburg Private Bin Cabernet
Sauvignon 2014
Platters Wine Guide 2016
o Producer of the year
o 5 Stars – Nederburg Winemasters Noble Late Harvest 2015
o 5 Stars – Nederburg Cabernet Sauvignon Private Bin R163 2013
o 5 Stars - Nederburg Heritage Heroes Brewmaster Bordeaux 2014
Michelangelo International Wine & Spirits Awards 2016
o Grand D’Or – Nederburg Heritage Heroes Brewmaster Bordeaux 2013
Veritas 2016
o Gold - Nederburg Ingenuity White Blend 2014

15
Interim investor – December 2016 Brand performance Viceroy double digit growth continues
KEY FACTS:
Affordability and residual equity paying dividends
KEY INITIATIVES:
Makoya 3 year statement to launch Q3
Packaging upgrade 5year Q2-3 in SA, Kenya & Zimbabwe
Viceroy 10 launched in Kenya

16
Interim investor – December 2016 Brand performance Early indicators of success for Amarula global premiumisation journey
KEY FACTS:
Won 2017 IWRC Medal New York
Markets where pack up grade implemented showing uplift in sales
Strong global consumer response from Amarula Trust “Name them save them” campaign
KEY INITIATIVES:
Aggressive drive behind global campaign
Amarula Trust Limited edition bespoke label together with consumer campaign

17
Interim investor – December 2016 Brand performance Scottish Leader – positive consumer uptake in Taiwan continues
KEY FACTS:
Europe remains a tough market for blended Scotch
Brand campaign “New Perspective, Richer Possibilities” building brand equity
Range extension (Original) in Taiwan opened new channels
12 YO launched in SA
KEY INITIATIVES:
Further innovation
New digital campaign to follow “New Perspectives”

18
Interim investor – December 2016
USA Africa JV structure now fully
operational
Distribution network being
integrated
Focus on rate of sale &
quality of distribution
New leadership team
Improvement drive continues
Build partner trust and add value
Drive share and scale RTM in core
categories
Own the last mile Select African & International partnerships are positioning Distell for the future
JV company established
Savanna in-market from
December 2016; Bernini
from April 2017
JV staffing and integration
process advanced
Breaking ground on local
production February 2017
China
19
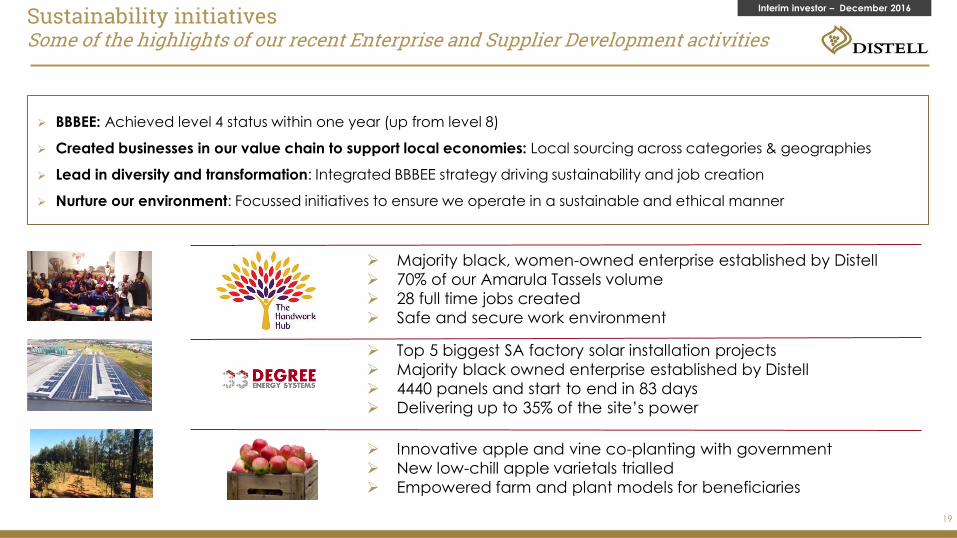
Interim investor – December 2016 Sustainability initiatives Some of the highlights of our recent Enterprise and Supplier Development activities
Majority black, women-owned enterprise established by Distell
70% of our Amarula Tassels volume
28 full time jobs created
Safe and secure work environment
Top 5 biggest SA factory solar installation projects
Majority black owned enterprise established by Distell
4440 panels and start to end in 83 days
Delivering up to 35% of the site’s power
Innovative apple and vine co-planting with government
New low-chill apple varietals trialled
Empowered farm and plant models for beneficiaries
BBBEE: Achieved level 4 status within one year (up from level 8)
Created businesses in our value chain to support local economies: Local sourcing across categories & geographies
Lead in diversity and transformation: Integrated BBBEE strategy driving sustainability and job creation
Nurture our environment: Focussed initiatives to ensure we operate in a sustainable and ethical manner
20
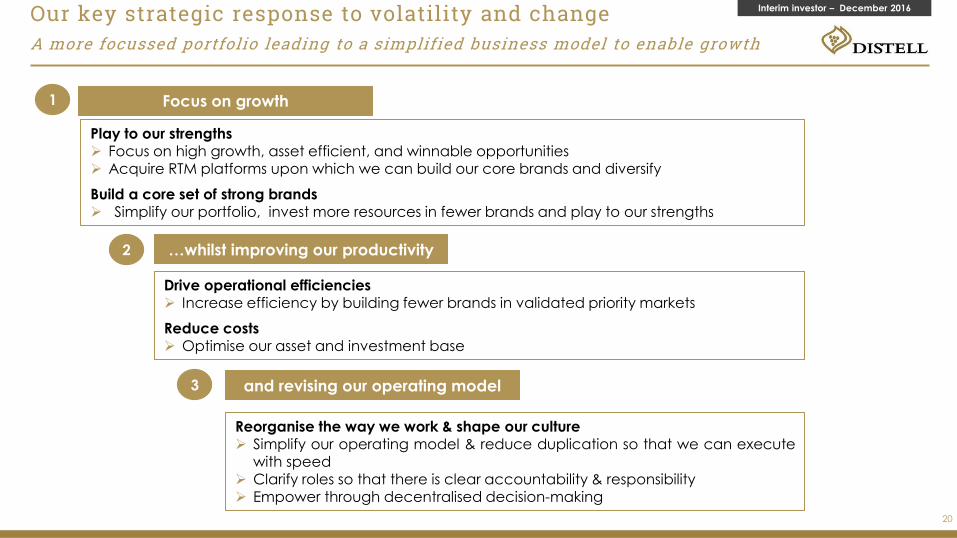
Interim investor – December 2016 Our key strategic response to volatility and change A more focussed portfolio leading to a simplified business model to enable growth
Reorganise the way we work & shape our culture Simplify our operating model & reduce duplication so that we can execute
with speed
Clarify roles so that there is clear accountability & responsibility Empower through decentralised decision-making
Play to our strengths Focus on high growth, asset efficient, and winnable opportunities Acquire RTM platforms upon which we can build our core brands and diversify
Build a core set of strong brands Simplify our portfolio, invest more resources in fewer brands and play to our strengths
Drive operational efficiencies Increase efficiency by building fewer brands in validated priority markets
Reduce costs Optimise our asset and investment base
Focus on growth
…whilst improving our productivity
and revising our operating model
1
2
3

21
Interim investor – December 2016
Key strategic initiatives to drive change and enhance performance
Lead selected emerging markets
Craft distinctive & compelling Brands
Own the last mile
Shape the future
Scale up excellence
Care & contribute
Make clearer deliberate choices on which brands and markets where we
have the right to win
Defend and grow SA
Accelerate our geographic diversification
Optimise our supply chain
Invest in
management systems
Invest in the front-end
Own the
relationship with the
customer and the
consumer
Change our operating
model
Deepen our talent
pipeline
Shape our culture
Build our
corporate reputation
Influence regulatory
policy
Transform and diversity our
business
Implement world class
sustainability
practices

22
Interim investor – December 2016
Financials

23
Interim investor – December 2016
Reported
'mReported Normalised
Normalised
FX#
Sales volumes 385.1 -3.1% -3.1% -3.1%
Revenue 12,516.4 2.4% 2.4% 3.0%
EBITDA* 1,864.9 -3.4% -0.3% 17.2%
Headline earnings 1,176.9 1.1% 1.1% 22.8%
Headline earnings per share 536.8c 1.0% 1.0% 22.6%
Growth in total assets 2.9% 2.8% 3.9%
Salient features Cost control assists to maintain growth in tough conditions
*Main difference between normalised and reported EBITDA (these impairments do not
form part of HLE):
o R38.8m impairment of Brand Phoenix investment o R20.0m impairment of Angola industrial property rights
# Throughout this presentation, “normalised FX” refers to normalised performance excluding exchange rate
movements

24
Interim investor – December 2016
South Africa
• Volumes down 1.1%
• Revenue up 5.1%
• High prior year base due to timing of price increase
• Increased domestic RTD competition
International recovering volumes
Sub-Sahara Africa (incl BLNS)
• Angola still challenging
Revenue on a NDP basis outside RSA comprises 28.9% of group revenue
Savings initiatives impact positively on group EBIT increase
79.9%
6.0%
14.1%
-12.8%
0.9%-1.1%
76.2%
11.1%
12.7%
South Africa
International
Africa (incl BLNS)
-8.0%
5.1%
-1.3%
Volumes
down 3.1%Revenue up
2.4%
77.6%
6.3%
16.1%
EBIT (before Service
Centres) up 9.8%
10.1%
22.5%
3.9%
EBIT = Earnings before
interest and taxIncrease/decrease
from previous year
Contribution per region Markets outside RSA contributing almost a quarter of revenue

25
Interim investor – December 2016 Contribution per category Strong growth in spirits adj GP; balanced revenue contribution
Note: Calculated excluding cash discounts and DVC where applicable
• High prior year base due to timing of price increase
• Increased domestic RTD competition
• Wine and spirits show revenue growth of 3.5%
• 4th Street showing strong revenue growth of 38.3%
• Viceroy revenue up 66.8%
9.2%
36.1%53.4%
-5.6%
0.6%
0.1%
33.1%
28.7%
38.1%
Spirits Wine
Cider/RTD Other
2.1%
Volumes
down 3.1%
Revenue up
2.4%
19.5%
29.4%
46.3%
Adjusted Gross Profit
up 6.1%
5.2%2.4%
7.6%3.5%
3.5%
Increase/decrease
from previous year

26
Interim investor – December 2016
Exchange rates Weaker pound creating drag on revenue growth
Currency 2016/17 2015/16
Change
on History
GBP 17.90 20.80 -13.9%
EUR 15.38 14.97 2.7%
USD 14.00 13.56 3.2%
CAD 10.62 10.27 3.4%
YTD December 2016
average rates
Average exchange rate strengthening 2.9% on History
27
Interim investor – December 2016
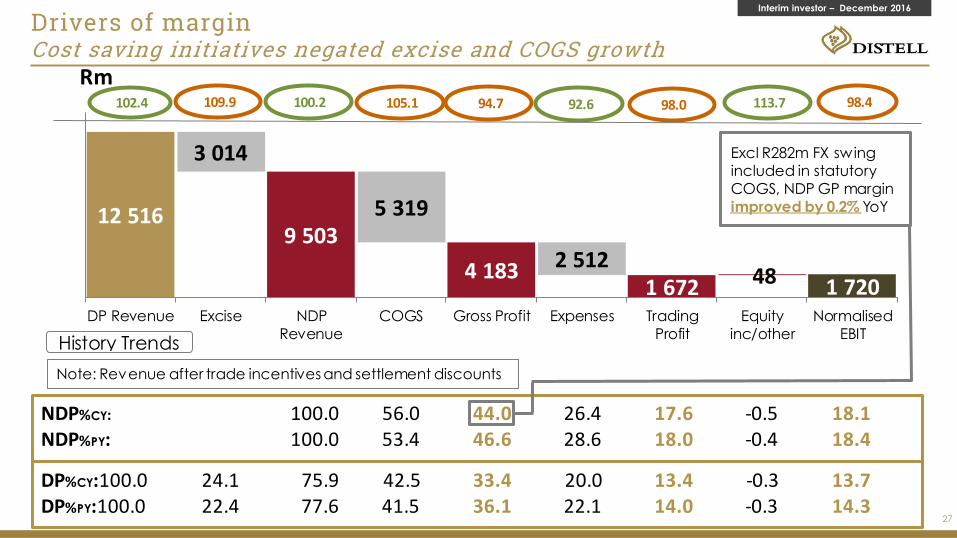
Drivers of margin Cost saving initiatives negated excise and COGS growth strategies
9 503
4 1831 672 1 720
3 014
5 319
2 512
12 516
48
DP Revenue Excise NDP
Revenue
COGS Gross Profit Expenses Trading
Profit
Equity
inc/other
Normalised
EBIT
Rm109.9 100.2 105.1 94.7 92.6 98.0 113.7 98.4 102.4
History Trends
NDP%CY: 100.0 56.0 44.0 26.4 17.6 -0.5 18.1NDP%PY: 100.0 53.4 46.6 28.6 18.0 -0.4 18.4
DP%CY:100.0 24.1 75.9 42.5 33.4 20.0 13.4 -0.3 13.7DP%PY:100.0 22.4 77.6 41.5 36.1 22.1 14.0 -0.3 14.3
Note: Revenue after trade incentives and settlement discounts
Excl R282m FX swing
included in statutory
COGS, NDP GP margin
improved by 0.2% YoY

28
Interim investor – December 2016 Drivers of revenue growth Price increase and volume decline resulting in net marginal growth Drivers of revenue growth
12,516
41174
12,223
72
678
28
2015 History
Volume Sales Mix Currency Price New/Disc prod + Other
2016 Actual
Rm
Index 102.4 0.2 5.5 (0.6)0.6 (3.4)100.0

29
Interim investor – December 2016
Exlcuding R282m FX swing included in statutory COGS, GP trend =
Drivers of gross profit
4 183
124 117 126426
120
4418
678
2015 History Volume Mix Currency Price Revenue
Price COGS
New/Disc prod + Other
2016 Actual
Rm
Index 94.7 (2.7)(9.6)15.3 (2.9)(2.6)(2.8)100.0
101.1
Drivers of gross profit Price increase not sufficient to counter negative impacts
30
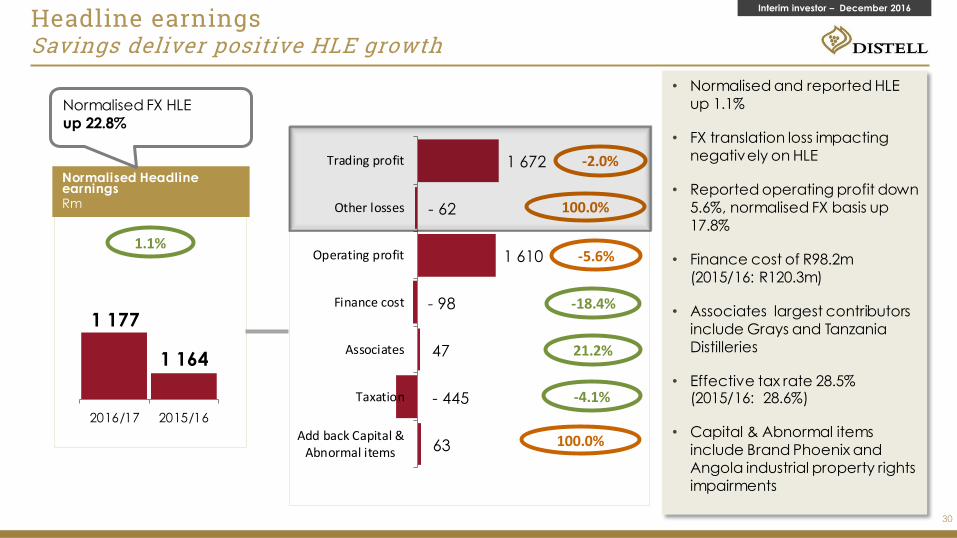
Interim investor – December 2016 Headline earnings Savings deliver positive HLE growth
• Normalised and reported HLE
up 1.1%
• FX translation loss impacting
negatively on HLE
• Reported operating profit down
5.6%, normalised FX basis up
17.8%
• Finance cost of R98.2m
(2015/16: R120.3m)
• Associates largest contributors
include Grays and Tanzania
Distilleries
• Effective tax rate 28.5% (2015/16: 28.6%)
• Capital & Abnormal items
include Brand Phoenix and
Angola industrial property rights
impairments
Normalised Headline earningsRm
1 177
1 164
2016/17 2015/16
1.1%
1 672
- 62
1 610
- 98
47
- 445
63
Trading profit
Other losses
Operating profit
Finance cost
Associates
Taxation
Add back Capital &Abnormal items
-5.6%
-18.4%
21.2%
-4.1%
100.0%
-2.0%
100.0%
Normalised FX HLE
up 22.8%
31
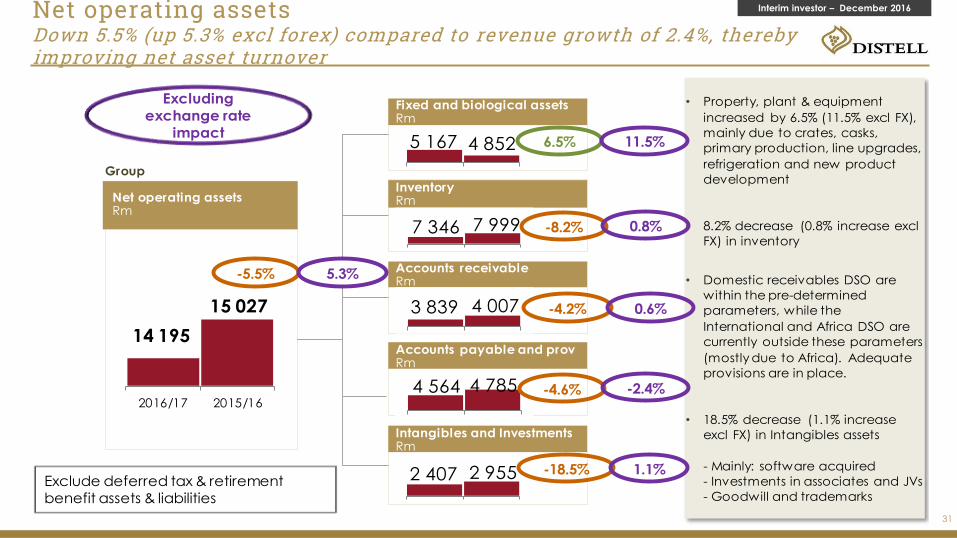
Interim investor – December 2016 Net operating assets Down 5.5% (up 5.3% excl forex) compared to revenue growth of 2.4%, thereby improving net asset turnover to net revenue growth of 2.4%, thereby improving net asset turn
18
• Property, plant & equipment
increased by 6.5% (11.5% excl FX),
mainly due to crates, casks,
primary production, line upgrades,
refrigeration and new product
development
• 8.2% decrease (0.8% increase excl
FX) in inventory
• Domestic receivables DSO are
within the pre-determined
parameters, while the
International and Africa DSO are
currently outside these parameters
(mostly due to Africa). Adequate
provisions are in place.
• 18.5% decrease (1.1% increase
excl FX) in Intangibles assets
- Mainly: software acquired
- Investments in associates and JVs
- Goodwill and trademarks
Fixed and biological assetsRm
InventoryRm
Accounts receivableRm
Accounts payable and provRm
Intangibles and InvestmentsRm
Group
Net operating assetsRm
14 195
15 027
2016/17 2015/16
5 167 4 852 6.5%
7 346 7 999 -8.2%
3 839 4 007 -4.2%
4 564 4 785 -4.6%
2 407 2 955 -18.5%
-5.5%
Exclude deferred tax & retirement
benefit assets & liabilities
5.3%
Excluding
exchange rate
impact11.5%
0.8%
0.6%
-2.4%
1.1%
32
Interim investor – December 2016
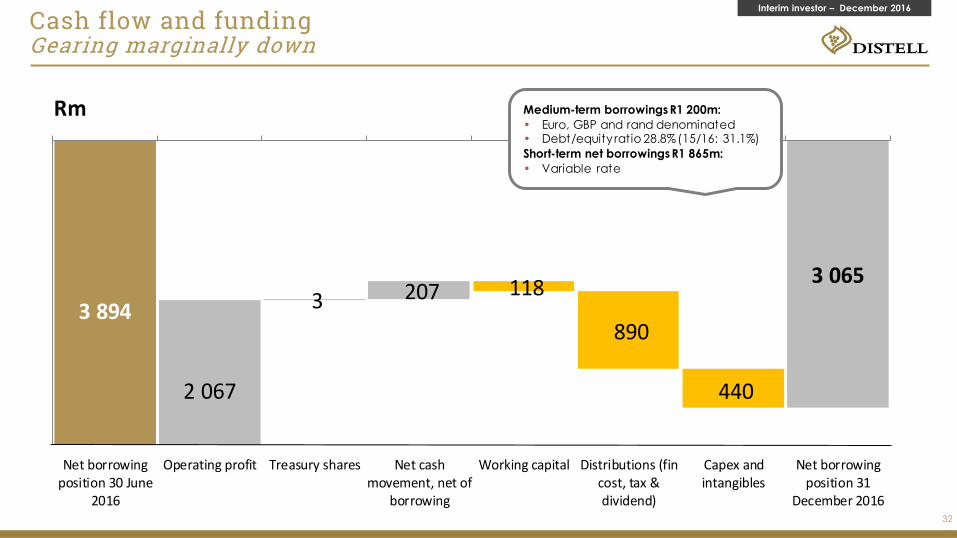
Cash flow and funding Gearing marginally down Cash flow and funding
3.4311.393
3.233
2 067
3 2073 065
3 894118
890
440
Net borrowingposition 30 June
2016
Operating profit Treasury shares Net cashmovement, net of
borrowing
Working capital Distributions (fincost, tax ÷nd)
Capex andintangibles
Net borrowingposition 31
December 2016
Rm Medium-term borrowings R1 200m:
• Euro, GBP and rand denominated• Debt/equity ratio 28.8% (15/16: 31.1%)
Short-term net borrowings R1 865m:
• Variable rate
33
Interim investor – December 2016
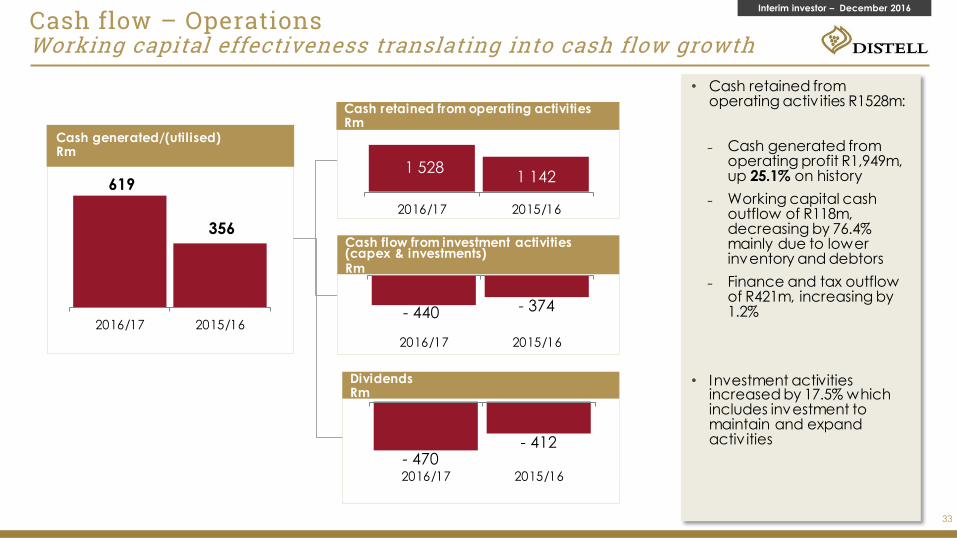
Cash flow – Operations Working capital effectiveness translating into cash flow growth activities
• Cash retained from operating activ ities R1528m:
Cash generated from operating profit R1,949m, up 25.1% on history
Working capital cash outflow of R118m, decreasing by 76.4% mainly due to lower inventory and debtors
Finance and tax outflow of R421m, increasing by 1.2%
• Investment activities increased by 17.5% which includes investment to maintain and expand activ ities
Cash retained from operating activitiesRm
Cash generated/(utilised)Rm
Cash flow from investment activities (capex & investments)Rm
DividendsRm
619
356
2016/17 2015/16
1 5281 142
2016/17 2015/16
- 440 - 374
2016/17 2015/16
- 470- 412
2016/17 2015/16

34
Interim investor – December 2016
In conclusion
Looking ahead:
South Africa will drive mainstream penetration and review premium opportunities
We will defend our cider position in South Africa with innovation and investments
Drive the mainstream wines and spirits opportunity
Internationally focus is on markets where we have established platforms
Measured African expansion with considered investments in RTM platforms
Capture mainstream opportunities and build scale in priority African markets
Continue on our journey for growth to build a leaner, focused and more agile organisation:
Focused portfolio-tail brand, SKU and asset rationalisation
Optimised supply chain network-ensure low cost and consistent quality
Align our organisation design-optimal ‘create-demand’ and ‘meet demand’ model
Inorganic activity is crucial to enhance existing markets and unlock new markets:
Strong pipeline with interesting potential for diversification and step change
Interim investor – December 2016
This presentation contains ‘forward-looking’ statements, including specifically all statements that express market
forecasts; Distell’s commentary on macro and industry related market trends; and projections related to Distell’s
business strategy.
All forward-looking statements contained in this presentation involve risk and uncertainty since they are dependent
on assumptions of circumstances that will occur in the future. There are multiple variables which could cause actual
results to differ from the forward-looking statements which are not within Distell’s management control. Such
variables include, but are not limited to, political, macro and socio-economic changes; legal and regulatory
changes; litigation developments; technological changes; environmental risks and changes in consumer trends,
among others. As such, Distell is not liable for any financial or other losses incurred arising from investment decisions
made on the basis of forward-looking statements contained in this presentation.
As such, you are cautioned not to place undue reliance on the forward-looking statements contained herein, as
they apply only as at the date of this presentation.
All forward-looking statements made by Distell apply only as of the date they are made. There is no obligation on
Distell in the future to provide updates on forward-looking statements contained in this presentation to reflect any
changes in Distell’s projections with regard thereto or any changes in events or underlying assumptions on which
any such statement is based.
Disclaimer