interim report 1st half year 2020 - wacker chemie...jul 30, 2020 · silicone and hybrid sealants,...
TRANSCRIPT

January through June 2020 Published on July 30, 2020
Interim Report
1st Half Year

Wacker Chemie AG — 1st Half Year 2020
2
Interim Report — WACKER at a Glance
Interim Report – January through June 2020
– Group sales for first half of 2020 total € 2.27 billion, down
9 percent from last year
– At € 280 million, EBITDA decreases 21 percent year over year
amid lower volumes due to the pandemic and lower prices for
solar-grade polysilicon and standard silicones
– EBIT of € 72 million is slightly above last year’s level, mainly due
to lower depreciation and amortization
–Net income for first half of 2020 comes in at € 73 million
–Net cash flow for the period reaches triple digits at € 159 million
– Due to pandemic-related risks, specific guidance for
full-year 2020 is still not possible
Title – Effective building protection: concrete rendered water-repellent by silicones offers reliable protection against moisture – as the droplet test shown here demonstrates. Silicone resins are incorporated into the liquid concrete mix to prevent ASR (alkali-silica reaction), which is a cause of crumbling concrete. This makes buildings and structures significantly more durable.

Wacker Chemie AG — 1st Half Year 2020
3
Interim Report — WACKER at a Glance
WACKER – At a Glance
€ million 6M 2020 6M 2019 Change in %
Results / Return / Cash Flow Sales 2,269.9 2,504.2 -9.4
EBITDA 279.5 352.7 -20.8
EBITDA margin (%) 12.3 14.1 -
EBIT 71.6 70.8 1.1
EBIT margin (%) 3.2 2.8 -
Financial result -23.2 -27.6 -15.9
Income before income taxes 48.4 43.2 12.0
Net income for the period 73.4 31.7 >100
Earnings per share (basic / diluted) (€) 1.38 0.52 >100
Capital expenditures 84.2 202.4 -58.4
Depreciation / amortization 207.9 281.9 -26.3
Net cash flow 159.4 -113.2 n.a.
€ million June 30, 2020 Dec. 31, 2019 Change in %
Financial Position Total assets 6,741.8 6,491.0 3.9
Equity 1,985.6 2,029.0 -2.1
Equity ratio (%) 29.5 31.3 -
Financial liabilities 1,423.0 1,258.9 13.0
Net financial debt 572.9 713.7 -19.7
Employees (number at end of period) 14,382 14,658 -1.9

Wacker Chemie AG — 1st Half Year 2020
4
Interim Report — To Our Shareholders
Dear Shareholders,
The coronavirus’s spread has caused the world economy to slump over the past several months. We too are noticing the effects of the pandemic. In the first half year, its impact differed in intensity depending on the market segment.
Solar volumes contracted markedly at the start of the year. At our chemical divisions, the slump in demand became increasingly apparent from April onward, for example in silicones for the automotive and textile segments. Demand remained comparatively stable in the construction market. That is why the declines were much less pronounced for silicone and hybrid sealants, dispersible polymer powders and construction dispersions. Business was very robust for products used in medical, health and hygiene applications. On balance, our chemical divisions saw sales and EBITDA decline versus the first half of last year.
Market conditions for solar-grade polysilicon remain difficult. The pandemic caused demand from photovoltaic manufacturers to contract markedly at times. The low price level is very challenging not only for WACKER POLYSILICON, but also for our competitors. Furthermore, structural overcapacity for solar-grade polysilicon persists among Chinese competitors. Due to these factors, WACKER POLYSILICON’s sales and EBITDA were lower than a year earlier. Our semiconductor business, in comparison, experienced a significantly better trend. Customer demand there remained at a high level.
To adjust our capacity to market demand, we already began in early May with short-time work in specific areas of WACKER.
The pandemic’s effects and the resulting world economic downturn underscore how critically important it is – now more than ever – to resolutely implement our Shape the Future efficiency program. The aim of this program, which was initiated in November 2019, is to strengthen our competitive edge by making WACKER leaner, faster and more flexible and by cutting our costs significantly. We want to save € 250 million a year, half in non-personnel costs and half in personnel costs.
We are making good progress here. While personnel cost savings will still be low in 2020, we expect to save more than € 50 million in non-personnel costs this year. We identified over 1,000 measures there, many of which are already being realized. Next year, the amount saved is likely to exceed € 100 million. From the end of 2022, we expect to achieve the program’s total target of € 250 million per year.
We prepared a detailed plan of WACKER’s new structure and the measures needed – and are now discussing that plan with employee representatives. Our joint goal is to reach an agreement swiftly, so that we can continue positioning WACKER effectively for a successful future.
Munich, July 30, 2020
The Executive Board of Wacker Chemie AG

Interim Report — WACKER Stock
Wacker Chemie AG — 1st Half Year 2020
5
WACKER Stock
After a good start to 2020, stock markets worldwide suffered massive losses due to the coronavirus pandemic. In just a few weeks, trillions of dollars in market capitalization were wiped out. Share prices recovered somewhat in the second quarter, supported by government aid packages and major central banks’ emergency measures. When restrictions to contain the pandemic were gradually lifted, the economy revived, benefiting stock-market performance.
German stock markets experienced huge losses because of the pandemic. Shortly after posting its all-time high on February 17, the DAX lost nearly 40 percent, but then reco-vered swiftly. Germany’s benchmark index finished trading at 12,310.93 points on June 30, down 7 percent versus the start of the year. The trend was similar for the MDAX and SDAX, which closed the January-through-June period down 9 percent and 8 percent, respectively.
WACKER’s share price started the year at € 67.64 (year-end closing price on Dec. 30, 2019). After trending down slightly in January, the stock began climbing and hit its half-year high of € 74.98 on February 20. As stock markets crashed, WACKER stock also fell strongly, reaching its six-month low of € 33.03 on March 19. It then gradually regained ground in line with the general market trend, closing at € 61.04 on June 30. That was 10 percent lower than at the start of the year and corresponded to a market capitalization of € 3.03 billion. » Please refer to the 2019 Annual Report (pages 34 to 36) and the internet (www.wacker.com/investor-relations) for more details about WACKER stock.
WACKER Share Performance in First Half of 2020 (indexed to 100)1
MDAXSDAXDAX30
WACKER
¹
70
60
50
40
80
90
100
110
120
130
140
¹ 100 = €67.64 (closing price on December 30, 2019)
AprilJanuary February March May June July

Interim Report — Interim Group Management Report
Wacker Chemie AG — 1st Half Year 2020
6
Interim Group Management Report
Overall Economic Situation, Economic Outlook and State of the IndustryPandemic Triggers Global Recession The global economy will shrink markedly this year as a result of the coronavirus pandemic. The International Monetary Fund (IMF) anticipates the deepest recession in almost a century. According to its latest estimates, global economic output will decline by around 5 percent in 2020, with the eurozone experiencing a drop of more than 10 percent. Italy and Spain will be hit particularly hard, both at –12.8 percent. For Germany, the IMF is forecasting a GDP decline of 7.8 percent. At the beginning of the year, the Fund’s projection for 2020 was for the global economy to grow by 3.3 percent and the eurozone by 1.3 percent.¹
The Organisation for Economic Co-operation and Develop-ment (OECD) expects GDP in many countries to contract by 20 to 30 percent in Q2 2020. For full-year 2020, the global economy is anticipated to shrink by 6 percent. The OECD estimates that global GDP could even drop by 7.6 percent if a second wave of infections occurs before the end of the year.²
Given the current situation, China’s government is hesitant to provide an outlook. For the first time since 1990, the People’s Republic has not published a growth target for the year.
Guided by the latest economic forecasts, WACKER expects global economic activity in 2020 to decline substantially versus last year’s level.
1 International Monetary Fund, World Economic Outlook Update, June 2020: A Crisis Like No Other, An Uncertain Recovery, Washington, June 24, 2020
2 Organisation for Economic Co-operation and Development (OECD), OECD Economic Outlook, Volume 2020 Issue 1: Preliminary version, No. 107, Paris, June 10, 2020
3 VCI (German Chemical Industry Association), The business situation of the global chemical industry in the 1st quarter 2020: Recession on the global chemical markets, Frankfurt am Main, June 16, 2020
GDP Trend1
% 2019Outlook for
2020
World 2.9 -4.9
Advanced economies 1.7 -8.0
Developing and emerging economies 3.7 -3.0
Eurozone 1.3 -10.2
Germany 0.6 -7.8
Asia 5.5 -0.8
China 6.1 1.0
India 4.2 -4.5
USA 2.3 -8.0
Slump in Chemical ProductionThe coronavirus pandemic slowed the global chemical industry over the past months. Production cutbacks in numerous industries negatively affected demand for chemical products. However, chemical demand simulta-neously rose in certain application areas, including sanitary products, packaging and pharmaceuticals. The decline in the chemical industry was therefore more moderate than in other sectors. For full-year 2020, the German Chemical Industry Association (VCI) expects chemical production to decrease by 2.5 percent worldwide and by 1.5 percent in Europe.³

Interim Report — Interim Group Management Report
Wacker Chemie AG — 1st Half Year 2020
7
German chemical companies are also likely to see a subs-tantial decline in both sales and production output this year. A VCI membership survey about the pandemic showed members initially struggling for months with disrupted supply chains, coronavirus-related personnel bottlenecks and transportation capacity shortages, but above all with a lack of orders – especially from the automotive industry.1
Given how difficult it is to assess the consequences of the pandemic, the VCI will not publish its annual forecast for the German chemical-pharmaceutical industry until the second half of the year.2
Selected Key Indicators by Industry
%Growth in
2019
Growth outlook for
2020
Chemical Industry
Production, worldwide3 2.7 -2.5
Production, EU3 3.4 -1.5
Production, Germany2 - -
Photovoltaic Industry
Newly installed photovoltaic capacity, worldwide4 13.0 -4.0
Experts anticipate the photovoltaic (PV) industry will cont-ract in 2020 after strong gains in 2019. Due to the pandemic, new global PV capacity is expected to be lower than last year. But the effects on installation rates will differ in the various countries and segments depending on how strong Covid-19’s impact has been and how governments have responded.
1 VCI (German Chemical Industry Association), Wirtschaftliche Auswirkungen der Corona-Pandemie, Ergebnisse der VCI-Mitgliederbefragung [Economic impacts of the coronavirus pandemic – Results of the VCI membership survey], Frankfurt am Main, May 28, 2020
2 VCI (German Chemical Industry Association), VCI report on the industry’s business situation in the 1st quarter 2020: Chemical industry: robust start in the crisis year, Frankfurt am Main, May 27, 2020
3 VCI (German Chemical Industry Association), The business situation of the global chemical industry in the 1st quarter 2020: Recession on the global chemical markets, Frankfurt am Main, June 16, 2020
4 SolarPower Europe, Global Market Outlook For Solar Power 2020–2024, Brussels, June 16, 2020
In their “medium” scenario for 2020, experts at solar industry association SolarPower Europe anticipate new global PV capacity to come in at 112 gigawatts, down 4 percent year over year. In subsequent years, they expect a return to double-digit growth rates.4
On the basis of its own market surveys, WACKER antici-pates that newly installed global PV capacity will amount to between 105 and 125 gigawatts this year.

Wacker Chemie AG — 1st Half Year 2020
8
Interim Report — Group Performance and Earnings
Group Performance and EarningsJanuary 1 to June 30, 2020
Sales
€ million 6M 2020 6M 2019 Change in %
WACKER SILICONES 1,123.0 1,254.9 -10.5
WACKER POLYMERS 628.4 676.9 -7.2
WACKER BIOSOLUTIONS 126.2 119.1 6.0
WACKER POLYSILICON 336.8 381.0 -11.6
Corporate functions / Other 65.8 83.4 -21.1
Consolidation -10.3 -11.1 -7.2
Group sales 2,269.9 2,504.2 -9.4
EBITDA
€ million 6M 2020 6M 2019 Change in %
WACKER SILICONES 186.7 247.9 -24.7
WACKER POLYMERS 120.3 97.2 23.8
WACKER BIOSOLUTIONS 24.3 13.2 84.1
WACKER POLYSILICON -48.7 -30.1 61.8
Corporate functions / Other -2.3 25.6 n.a.
Consolidation -0.8 -1.1 -27.3
Group EBITDA 279.5 352.7 -20.8
EBIT
€ million 6M 2020 6M 2019 Change in %
WACKER SILICONES 130.5 202.8 -35.7
WACKER POLYMERS 100.4 76.7 30.9
WACKER BIOSOLUTIONS 15.9 4.7 >100
WACKER POLYSILICON -130.4 -193.2 -32.5
Corporate functions / Other -44.0 -19.1 >100
Consolidation -0.8 -1.1 -27.3
Group EBIT 71.6 70.8 1.1

Wacker Chemie AG — 1st Half Year 2020
9
Interim Report — Group Performance and Earnings
In the first half of 2020, WACKER’s sales declined year over year. They came in at € 2,269.9 million in January through June, after € 2,504.2 million a year earlier – a drop of 9 percent.
This decrease was largely due to the economic impact of the coronavirus pandemic. Demand, and thus volumes, declined noticeably, particularly in the second quarter. Lower prices overall, especially for solar-grade polysilicon and standard silicones, also dampened the sales trend. On the other hand, sales benefited from exchange-rate effects with the US dollar’s year-over-year rise.
The pandemic’s impact differed in intensity depending on the application field. The strongest declines were in solar-grade polysilicon and silicones for the automotive and textile sectors. Demand in construction, although down year over year, was somewhat better. That is why the declines were much less pronounced for silicone and hybrid sealants, dispersible polymer powders and construction dispersions. The volume trend was very robust for products used in medical, health and hygiene applications.
Sales Decline in All RegionsIn the January-through-June period, Group sales decreased in all regions due to volumes and price effects. The drop was especially pronounced in Asia, where the Covid-19
outbreak already impacted the first quarter. Overall, sales in Asia fell by 14 percent for the first half of 2020. Sales in the Americas declined by 9 percent year over year, and in Europe by 7 percent.
Group Sales by Region
€ million 6M 2020 6M 2019 Change in % % of Group sales
Europe 979.4 1,047.8 -6.5 43
The Americas 426.5 469.4 -9.1 19
Asia 748.7 867.0 -13.6 33
Other regions 115.3 120.0 -3.9 5
Total sales 2,269.9 2,504.2 -9.4 100
2,5042,2709–81
–162
Group sales in 6M 2019
Sales-volume and product-mix effects
Price effects Exchange-rate effects Group sales in 6M 2020
Year-over-Year Sales Comparison
€ million

Wacker Chemie AG — 1st Half Year 2020
10
Interim Report — Group Performance and Earnings
EBITDA Totals € 280 Million, with EBITDA Margin at 12.3 PercentWACKER generated EBITDA of € 279.5 million in the report ing period. That was 21 percent less than a year earlier (€ 352.7 million). The decrease was due chiefly to volume
and product-mix effects and to lower average prices for solar-grade polysilicon and standard silicones. On the other hand, lower raw-material and energy prices had a positive effect. The Group’s EBITDA margin for the first six months of 2020 was 12.3 percent, after 14.1 percent a year earlier.
EBIT of € 72 Million on Par with Year-Earlier LevelGroup earnings before interest and taxes (EBIT) totaled € 71.6 million in the first half of 2020, compared with € 70.8 million a year earlier. That is a year-over-year increase of 1 percent, yielding an EBIT margin of 3.2 percent, versus 2.8 percent last year.
Aside from the factors already mentioned, EBIT bene-fited from a year-over-year drop in depreciation and amortization, which together amounted to € 207.9 million, after € 281.9 million a year earlier. That was a decrease of
26 percent. The decline stemmed partly from an impairment charge of € 760 million on polysilicon facilities that WACKER recognized on December 31, 2019, which reduced current depreciation of these facilities.
The cost-of-sales ratio was 84 percent in the first half of 2020, down two percentage points compared with the same period last year. The result was supported by low depreciation and amortization, the chemical divisions’ very good cost position and by measures taken to enhance efficiency.
Reconciliation of EBITDA to EBIT
€ million 6M 2020 6M 2019 Change in %
EBITDA 279.5 352.7 -20.8
Depreciation / amortization, impairments and reversals of fixed assets -207.9 -281.9 -26.3
EBIT 71.6 70.8 1.1
Reconciliation of EBIT to Net Income for the Period
€ million 6M 2020 6M 2019 Change in %
EBIT 71.6 70.8 1.1
Financial result -23.2 -27.6 -15.9
Income before income taxes 48.4 43.2 12.0
Income taxes 25.0 -11.5 n.a.
Net income for the period 73.4 31.7 >100
Of which
Attributable to Wacker Chemie AG shareholders 68.8 25.6 >100
Attributable to non-controlling interests 4.6 6.1 -24.6
Earnings per share in € (basic / diluted) 1.38 0.52 >100
Average number of shares outstanding (weighted) 49,677,983 49,677,983 -

Wacker Chemie AG — 1st Half Year 2020
11
Interim Report — Group Performance and Earnings
Result from InvestmentsThe result from investments in joint ventures and asso-ciates amounted to € 17.8 million in the reporting period, after € 36.6 million a year ago. It mainly comprised income from Siltronic AG, which is accounted for using the equity method.
Financial and Net Interest ResultIn the first half of 2020, WACKER’s financial result amounted to € –23.2 million, after € –27.6 million a year earlier. WACKER posted interest income of € 4.5 million, compared with last year’s € 3.9 million. Interest expenses were € 11.1 million, up from € 9.8 million a year earlier.
The other financial result amounted to € –16.6 million in the reporting period, after € –21.7 million a year ago. It included not only the interest-rate effects of provisions for pensions and other provisions, but also the costs of derivative finan-cial instruments used to hedge Group loans.
Income TaxesIn the first half of 2020, the income tax result was positive at € 25.0 million, versus income tax expense of € 11.5 million a year earlier. It comprised income from the capitalization of deferred tax assets on loss carryforwards, as well as from tax refunds.
Net Income for the PeriodDue to the effects mentioned above, net income for the first half of 2020 amounted to € 73.4 million, compared with € 31.7 million in the same period last year.
Earnings per ShareIn the first half of 2020, earnings per share came in at € 1.38, after € 0.52 a year earlier.

Interim Report — Division Performance
Wacker Chemie AG — 1st Half Year 2020
12
Division Performance
WACKER SILICONES
Sales at WACKER SILICONES totaled € 1,123.0 million in the first half of 2020, down 11 percent from a year earlier (€ 1,254.9 million). The main factors slowing sales were reduced volumes – due in particular to the pandemic- induced fall in demand – and lower prices for standard silicones. On the other hand, exchange-rate changes supported sales. While sales of silicones for release coatings, defoamers and industrial coatings rose some-what, sales in many key application fields fell substantially compared with the first half of 2019. The strongest declines were in silicones for automotive, textile and general industrial applications.
WACKER SILICONES generated January-through-June EBITDA of € 186.7 million, 25 percent below last year (€ 247.9 million). In addition to the sales decrease, plant utilization levels were lower, pushing up the cost of goods sold and dampening earnings. The EBITDA margin for the first half of 2020 was 16.6 percent, after 19.8 percent in the first half of 2019.
Following the completion of various major expansion projects last year, capital expenditures at WACKER SILICONES declined substantially. They totaled € 40.2 million in the reporting period, after € 113.9 million a year earlier. Capital spending focused on measures to expand capacity for intermediate and downstream products at the Burghausen and Nünchritz plants.
€ million 6M 2020 6M 2019 Change in %
External sales 1,123.0 1,254.8 -10.5
Internal sales - 0.1 -100.0
Total sales 1,123.0 1,254.9 -10.5
EBIT 130.5 202.8 -35.7
EBIT margin (%) 11.6 16.2 -
Depreciation / amortization 56.2 45.1 24.6
EBITDA 186.7 247.9 -24.7
EBITDA margin (%) 16.6 19.8 -
Capital expenditures 40.2 113.9 -64.7
R&D expenses 31.4 34.1 -7.9
As of June 30, 2020 Dec. 31, 2019
Employees (number) 5,079 5,267 -3.6

Interim Report — Division Performance
Wacker Chemie AG — 1st Half Year 2020
13
WACKER POLYMERS
Sales at WACKER POLYMERS totaled € 628.4 million in the reporting period, down 7 percent from a year earlier (€ 676.9 million). The pandemic-induced decline in volumes substantially slowed business, above all in dispersions for diverse industrial and consumer-goods applications. Demand from the construction industry, on the other hand, was only marginally lower year over year. Average prices of polymer products fell slightly in the reporting period, while changes in exchange rates benefited the sales trend. WACKER POLYMERS’ plant-utilization rate averaged around 80 percent from January through June.
The division’s EBITDA was € 120.3 million in the first half of 2020, after € 97.2 million a year earlier – an increase of 24 percent. EBITDA was mainly supported by the division’s very good cost structure and lower raw-material prices. The EBITDA margin was 19.1 percent in the reporting period, after 14.4 percent in the first half of 2019.
From January through June 2020, WACKER POLYMERS’ capital expenditures totaled € 16.0 million, versus € 32.4 million a year earlier. Investment projects included construction of a new dispersion reactor at the Ulsan site in South Korea.
€ million 6M 2020 6M 2019 Change in %
External sales 618.1 665.9 -7.2
Internal sales 10.3 11.0 -6.4
Total sales 628.4 676.9 -7.2
EBIT 100.4 76.7 30.9
EBIT margin (%) 16.0 11.3 -
Depreciation / amortization 19.9 20.5 -2.9
EBITDA 120.3 97.2 23.8
EBITDA margin (%) 19.1 14.4 -
Capital expenditures 16.0 32.4 -50.6
R&D expenses 16.3 17.6 -7.4
As of June 30, 2020 Dec. 31, 2019
Employees (number) 1,545 1,630 -5.2

Interim Report — Division Performance
Wacker Chemie AG — 1st Half Year 2020
14
WACKER BIOSOLUTIONS
WACKER BIOSOLUTIONS generated total sales of € 126.2 million in the first half of 2020, up 6 percent compared with the same period last year (€ 119.1 million). This increase was due primarily to higher volumes and positive product-mix effects. Bioengineered actives for the pharmaceutical industry and cyclodextrins performed especially well in the reporting period. Changes in exchange rates also had a positive effect on sales.
EBITDA at WACKER BIOSOLUTIONS reached € 24.3 million in the first half of 2020, up 84 percent versus a year earlier (€ 13.2 million). Earnings were also supported by sales gains, high plant utilization rates, a good cost structure and special income from a customer project. The EBITDA margin climbed to 19.3 percent in the first half of 2020, after 11.1 percent a year earlier.
WACKER BIOSOLUTIONS invested € 3.0 million in the reporting period, versus € 3.8 million last year.
€ million 6M 2020 6M 2019 Change in %
External sales 126.2 119.1 6.0
Internal sales - - -
Total sales 126.2 119.1 6.0
EBIT 15.9 4.7 >100
EBIT margin (%) 12.6 3.9 -
Depreciation / amortization 8.4 8.5 -1.2
EBITDA 24.3 13.2 84.1
EBITDA margin (%) 19.3 11.1 -
Capital expenditures 3.0 3.8 -21.1
R&D expenses 2.9 3.5 -17.1
As of June 30, 2020 Dec. 31, 2019
Employees (number) 751 754 -0.4

Interim Report — Division Performance
Wacker Chemie AG — 1st Half Year 2020
15
WACKER POLYSILICON
In the first half of 2020, WACKER POLYSILICON posted total sales of € 336.8 million. That was 12 percent less than a year earlier (€ 381.0 million). Sales were chiefly slowed by a marked volume decline and lower average prices for solar-grade polysilicon. The pandemic caused demand from photovoltaic manufacturers to contract markedly at times. Our semiconductor business, in comparison, experienced a significantly better trend. Customer demand there remained at a high level.
EBITDA at WACKER POLYSILICON came in at € –48.7 million in the reporting period. Compared with last year (€ –30.1 million), it decreased by € 18.6 million. Manufacturing efficiency improvements and further progress in reducing the cost of goods sold did not compensate for lower average polysilicon prices and reduced solar-sector demand. The division’s EBITDA was also dampened by inventory valuation adjustments and by lower plant utilization levels year over year. The EBITDA margin for January through June 2020 was –14.5 percent, after –7.9 percent in the first half of 2019.
WACKER POLYSILICON’s capital expenditures were € 8.8 million in the reporting period. A year earlier, capital expenditures had reached € 19.1 million.
€ million 6M 2020 6M 2019 Change in %
External sales 336.8 381.0 -11.6
Internal sales - - -
Total sales 336.8 381.0 -11.6
EBIT -130.4 -193.2 -32.5
EBIT margin (%) -38.7 -50.7 -
Depreciation / amortization 81.7 163.1 -49.9
EBITDA -48.7 -30.1 61.8
EBITDA margin (%) -14.5 -7.9 -
Capital expenditures 8.8 19.1 -53.9
R&D expenses 10.8 16.9 -36.1
As of June 30, 2020 Dec. 31, 2019
Employees (number) 2,250 2,333 -3.6

Wacker Chemie AG — 1st Half Year 2020
16
Interim Report — Net Assets and Financial Position
Net Assets and Financial PositionJune 30, 2020
WACKER’s balance sheet totaled € 6.74 billion as of June 30, 2020, after € 6.49 billion as of December 31, 2019. In June 2020, WACKER issued promissory notes (German Schuldscheine) in the amount of € 300 million, increasing both the company’s liquidity and financial liabilities as a result.
Fixed Assets Lower Due to Current Depreciation and AmortizationRelative to the end of last year, fixed assets (including equity-accounted investments) decreased slightly, coming in at € 3.33 billion (Dec. 31, 2019: € 3.50 billion). Investments in joint ventures and associates accounted for using the equity method declined by € 35.4 million. The dividend of € 27.8 million paid by Siltronic AG was a key factor here. While Siltronic AG’s result was positive, its higher pension
provisions (recognized in other comprehensive income) reduced the carrying amount of the investment. Depreciation and amortization of € 207.9 million (versus € 281.9 million a year earlier) reduced the carrying amount of property, plant and equipment. Capital expenditures added € 84.2 million to fixed assets.
Working Capital GrowsWorking capital climbed 8 percent to € 1.35 billion (Dec. 31, 2019: € 1.26 billion). Trade receivables and inven-tories rose only slightly. At the same time, trade payables declined by a substantial 15 percent. Due to lower output, WACKER also reduced its procurement volume.
Asset and Capital Structure
June 30, 2020
Total assets€ 6,741.8 million
Assets Equity and liabilities Assets Equity and liabilities
Dec. 31, 2019
Total assets€ 6,491.0 million
Liabilities / advance payments received
Liabilities / advance payments received
Financial liabilitiesFinancial liabilities
ProvisionsProvisions
EquityEquity Fixed assetsFixed assets
Inventories
Inventories
ReceivablesReceivables
Cash / securitiesCash / securities 10.3% 10.2%
19.4% 21.1%
39.0% 39.2%
31.3% 29.5% 53.9% 49.4%
15.1%
14.9%
22.6% 23.1%
8.4% 12.6%

Wacker Chemie AG — 1st Half Year 2020
17
Interim Report — Net Assets and Financial Position
Issue of Promissory Notes Increases LiquidityAs of June 30, 2020, WACKER recognized liquid assets (current and noncurrent securities, cash and cash equi-valents) of € 850.1 million (Dec. 31, 2019: € 545.2 million), up 56 percent. In June, WACKER issued new promissory notes (German Schuldscheine) for € 300 million.
Provisions for Pensions Rise Due to Lower Discount Rates and Reduction in Plan AssetsAs of the reporting date, provisions for pensions climbed to € 2.39 billion (Dec. 31, 2019: € 2.28 billion), up € 116.6 million. As a result of the stock markets’ response to the corona-virus crisis, the value of plan assets fell substantially. The discount rates applied were 1.24 percent in Germany (Dec. 31, 2019: 1.25 percent) and 2.49 percent in the USA (Dec. 31, 2019: 3.16 percent).
Equity Ratio at 29.5 PercentGroup equity decreased compared with year-end 2019. As of June 30, 2020, it amounted to € 1.99 billion (Dec. 31, 2019: € 2.03 billion). The corresponding equity ratio was 29.5 percent (Dec. 31, 2019: 31.3 percent). The decrease was chiefly attributable to changes in provisions for pensions. The change in provisions for pensions, which was recognized in other comprehensive income, reduced
equity by € 70.7 million. Exchange-rate effects lowered equity by € 44.2 million.
Gross Cash FlowCash flow from operating activities (gross cash flow) totaled € 266.2 million in the first half of 2020, after € 125.9 million in the same period last year. It mainly comprised net income for the period of € 281.3 million before depreciation and amortization, compared with € 313.6 million a year earlier. At € 132.5 million, cash outflows from working capital were lower than a year earlier (€ 241.1 million) and had a positive impact on gross cash flow.
Cash Flow from Investing ActivitiesIn the first half of 2020, cash flow from investing activities stood at € –106.8 million, less than the year-earlier figure (€ –239.1 million) because of reduced capital expenditures. The focus here was on ongoing investments in the chemical divisions.
Net Cash FlowDue to the effects described above, net cash flow in the first six months of 2020 amounted to € 159.4 million, compared with the prior year’s € –113.2 million.
Change in Working Capital
€ million June 30, 2020 Dec. 31, 2019 Change in %
Trade receivables 650.6 631.5 3.0
Inventories 1,006.3 979.8 2.7
Trade payables -302.3 -355.0 -14.8
Working capital 1,354.6 1,256.3 7.8
Net Cash Flow
€ million 6M 2020 6M 2019 Change in %
Cash flow from operating activities (gross cash flow) 266.2 125.9 >100
Cash flow from long-term investing activities before securities -106.8 -239.1 -55.3
Net cash flow 159.4 -113.2 n.a.

Wacker Chemie AG — 1st Half Year 2020
18
Interim Report — Net Assets and Financial Position
Cash Flow from Financing ActivitiesIn the first half of 2020, cash flow from financing activities was € 152.5 million, versus € 36.3 million a year earlier. It comprised, on the one hand, the effect of new promissory notes (German Schuldscheine) in the amount of € 300 million. The repayment of US$ 130 million on an American promissory note, on the other hand, had a contrary effect. In the prior year, WACKER had taken out new loans totaling € 200 million. Moreover, Wacker Chemie AG’s
2019 dividend of € 124.2 million was distributed in the first half of the year, while this year the dividend will not be paid out until August.
Financial Liabilities Rise 13 Percent Current and noncurrent financial liabilities were substan-tially higher as of the half-yearly reporting date, amounting to € 1.42 billion (Dec. 31, 2019: € 1.26 billion). Changes in exchange rates had only a marginal impact on financial liabilities. In June 2020, WACKER issued promissory notes (German Schuldscheine) for a total of € 300 million. The notes have maturities of four and six years.
Net Financial Debt DeclinesNet financial debt – the balance of noncurrent and current financial liabilities and liquid assets – declined markedly, from € 713.7 million to € 572.9 million. The decrease was due not only to positive cash flow from operating activities, but also to lower capital expenditures in the first half of 2020.
Net financial debt as of
Dec. 31, 2019
Cash flow from operating activities (gross cash flow)
Cash flow from long-term
investing activities before securities
Dividend paid, Wacker Chemie AG
Additions to lease liabilities
Exchange-rate effects, other
Net financial debt as of
June 30, 2020
Net Financial Debt
€ million
–713.7
266.2
0
–106.8
0.0
–572.9
–15.9 –2.7

Wacker Chemie AG — 1st Half Year 2020
19
Interim Report — Opportunities and Risks — Outlook Update
Opportunities and Risks
Assessments of Opportunities and Risks Remain UnchangedThe key risk areas that might adversely affect our business situation, net assets, financial position and earnings in 2020 were explained in detail in our 2019 Annual Report, as were the main opportunities for our business and the nature of our risk management system. » See 2019 Annual Report, pages 75 to 88
The statements and assessments made there did not change materially in the reporting period. We continue to regard the risks posed by the coronavirus pandemic as high. As was expected, the virus’s global spread has cast a dark cloud over the economic landscape. For this year, economists see a deep global recession of greater severity than the financial crisis of 2008 and 2009. Since the situation is evolving rapidly, it is not yet clear exactly how the pandemic will affect WACKER’s business during the rest of the year.
We have not identified any further significant risks or opportunities that go beyond what we described in the 2019 Annual Report. We can never rule out the existence of other business-related risks and opportunities that we are currently unaware of or currently consider to be insignificant. But we do not expect risks to occur which, either in isolation or in combination with other risks, might endanger the continued existence of WACKER as a going concern.
Outlook Update
Specific Full-Year Guidance Still Not PossibleWe detailed our projections for the Group’s performance this year in the Outlook section of our 2019 Annual Report. » See 2019 Annual Report, pages 89 to 94
In our interim report for Q1 2020, we refrained from issuing guidance for fiscal 2020 given the ever clearer risks from the pandemic and the continued surge in global infections. It is still not possible to reliably estimate how strongly or for how long government measures to contain the pandemic will dampen the Group’s business. Specific guidance for full-year 2020 is still not possible. However, as a result of the pandemic, we expect our sales, EBITDA and EBITDA margin for 2020 to be below last year’s level. With net cash flow, we anticipate a higher figure than a year ago.
Interim Report — Condensed Interim Consolidated Financial Statements
Wacker Chemie AG — 1st Half Year 2020
20
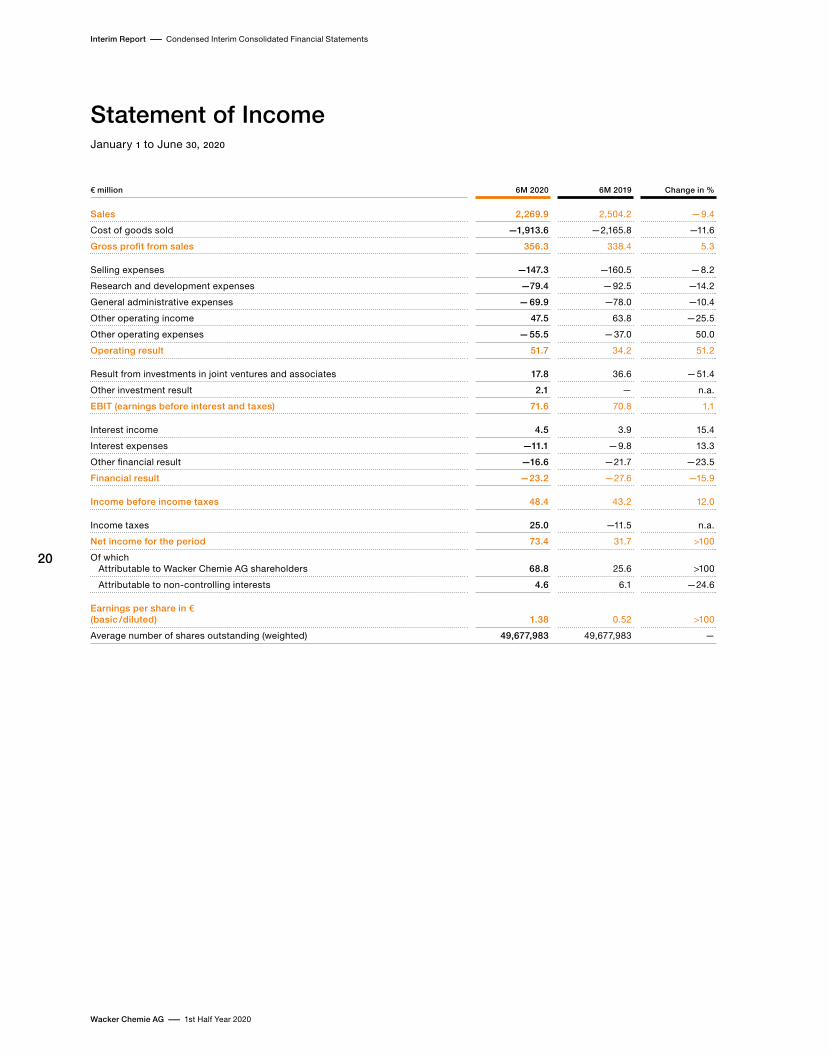
Statement of IncomeJanuary 1 to June 30, 2020
€ million 6M 2020 6M 2019 Change in %
Sales 2,269.9 2,504.2 -9.4
Cost of goods sold -1,913.6 -2,165.8 -11.6
Gross profit from sales 356.3 338.4 5.3
Selling expenses -147.3 -160.5 -8.2
Research and development expenses -79.4 -92.5 -14.2
General administrative expenses -69.9 -78.0 -10.4
Other operating income 47.5 63.8 -25.5
Other operating expenses -55.5 -37.0 50.0
Operating result 51.7 34.2 51.2
Result from investments in joint ventures and associates 17.8 36.6 -51.4
Other investment result 2.1 - n.a.
EBIT (earnings before interest and taxes) 71.6 70.8 1.1
Interest income 4.5 3.9 15.4
Interest expenses -11.1 -9.8 13.3
Other financial result -16.6 -21.7 -23.5
Financial result -23.2 -27.6 -15.9
Income before income taxes 48.4 43.2 12.0
Income taxes 25.0 -11.5 n.a.
Net income for the period 73.4 31.7 >100
Of which Attributable to Wacker Chemie AG shareholders 68.8 25.6 >100
Attributable to non-controlling interests 4.6 6.1 -24.6
Earnings per share in € (basic / diluted) 1.38 0.52 >100
Average number of shares outstanding (weighted) 49,677,983 49,677,983 -

Interim Report — Condensed Interim Consolidated Financial Statements
Wacker Chemie AG — 1st Half Year 2020
21
Statement of Comprehensive IncomeJanuary 1 to June 30, 2020
€ million 2020 2019
Before taxes
Deferredtaxes
After taxes
Before taxes
Deferredtaxes
After taxes
Net income for the period 73.4 31.7
Items not subsequently reclassified to the statement of income
Remeasurements of defined benefit plans -101.7 31.0 -70.7 -531.0 137.2 -393.8
Sum of items not reclassified to the statement of income -101.7 31.0 -70.7 -531.0 137.2 -393.8
Of which result from investments accounted for using the equity method -14.7 - -14.7 -39.7 - -39.7
Items subsequently reclassified to the statement of income
Difference from foreign currency translation adjustment -44.2 - -44.2 11.9 - 11.9
Of which recognized in profit or loss - - - - - -
Changes in fair value of securities – FVOCI - - - - - -
Impairments of securities – FVOCI - - - - - -
Changes in fair value of derivative financial instruments (cash flow hedge) 1.4 -0.5 0.9 3.0 -0.9 2.1
Of which recognized in profit or loss 3.1 -1.0 2.1 10.3 -3.3 7.0
Effects of net investments in foreign operations - - - - - -
Of which recognized in profit or loss - - - - - -
Sum of items reclassified to the statement of income -42.8 -0.5 -43.3 14.9 -0.9 14.0
Of which result from investments accounted for using the equity method -10.5 -0.2 -10.7 3.7 -0.3 3.4
Income and expenses recognized in equity -144.5 30.5 -114.0 -516.1 136.3 -379.8
Of which Attributable to Wacker Chemie AG shareholders -142.1 30.5 -111.6 -516.9 136.3 -380.6
Attributable to non-controlling interests -2.4 - -2.4 0.8 - 0.8
Total income and expenses reported -40.6 -348.1
Of which Attributable to Wacker Chemie AG shareholders -42.8 -355.0
Attributable to non-controlling interests 2.2 6.9

Interim Report — Condensed Interim Consolidated Financial Statements
Wacker Chemie AG — 1st Half Year 2020
22
Statement of Financial PositionAs of June 30, 2020
€ million June 30, 2020 Dec. 31, 2019 Change in %
Assets
Intangible assets 25.1 29.4 -14.6
Property, plant and equipment 2,513.0 2,644.0 -5.0
Right-of-use assets 119.0 119.8 -0.7
Investment property 8.3 8.6 -3.5
Investments in joint ventures and associates accounted for using the equity method 605.0 640.4 -5.5
Securities - - -
Other financial assets 57.1 58.8 -2.9
Other receivables and assets 8.9 9.1 -2.2
Deferred tax assets 685.1 632.9 8.2
Noncurrent assets 4,021.5 4,143.0 -2.9
Inventories 1,006.3 979.8 2.7
Trade receivables 650.6 631.5 3.0
Other financial assets 94.8 79.9 18.6
Other receivables and assets 83.7 63.0 32.9
Income tax receivables 34.8 48.6 -28.4
Securities and fixed-term deposits 237.7 109.4 >100
Cash and cash equivalents 612.4 435.8 40.5
Current assets 2,720.3 2,348.0 15.9
Total assets 6,741.8 6,491.0 3.9

Interim Report — Condensed Interim Consolidated Financial Statements
Wacker Chemie AG — 1st Half Year 2020
23
€ million June 30, 2020 Dec. 31, 2019 Change in %
Equity and Liabilities
Subscribed capital of Wacker Chemie AG 260.8 260.8 -
Capital reserves of Wacker Chemie AG 157.4 157.4 -
Treasury shares -45.1 -45.1 -
Retained earnings 2,630.4 2,561.6 2.7
Other equity items -1,079.4 -967.8 11.5
Equity attributable to Wacker Chemie AG shareholders 1,924.1 1,966.9 -2.2
Non-controlling interests 61.5 62.1 -1.0
Equity 1,985.6 2,029.0 -2.1
Provisions for pensions 2,391.9 2,275.3 5.1
Other provisions 226.8 232.6 -2.5
Financial liabilities 1,349.7 1,049.0 28.7
Other financial liabilities - 0.1 -100.0
Income tax liabilities 82.0 82.0 -
Contract liabilities 62.0 61.0 1.6
Other liabilities 0.9 0.5 80.0
Deferred tax liabilities 8.6 9.2 -6.5
Noncurrent liabilities 4,121.9 3,709.7 11.1
Other provisions 22.9 17.1 33.9
Financial liabilities 73.3 209.9 -65.1
Trade payables 302.3 355.0 -14.8
Other financial liabilities 30.7 14.3 >100
Income tax liabilities 8.3 13.1 -36.6
Contract liabilities 51.3 59.1 -13.2
Other liabilities 145.5 83.8 73.6
Current liabilities 634.3 752.3 -15.7
Liabilities 4,756.2 4,462.0 6.6
Total equity and liabilities 6,741.8 6,491.0 3.9

Interim Report — Condensed Interim Consolidated Financial Statements
Wacker Chemie AG — 1st Half Year 2020
24
Statement of Cash FlowsJanuary 1 to June 30, 2020
€ million 6M 2020 6M 2019 Change in %
Net income for the period 73.4 31.7 >100
Depreciation / amortization of fixed assets 207.9 281.9 -26.3
Result from disposal of fixed assets 0.7 3.7 -81.1
Other non-cash expenses and income 52.0 34.7 49.9
Result from equity accounting -17.8 -36.6 -51.4
Net interest income 6.6 5.9 11.9
Interest paid -15.5 -11.1 39.6
Interest received 2.5 1.9 31.6
Tax result -25.0 11.5 n.a.
Tax refunds 12.2 21.2 -42.5
Dividends received - 46.2 -
Change in inventories -71.8 -59.6 20.5
Change in trade receivables -34.9 -89.3 -60.9
Change in non-financial assets -23.7 -25.6 -7.4
Change in financial assets 13.5 16.6 -18.7
Change in provisions 37.2 22.0 69.1
Change in non-financial liabilities 63.8 0.1 >100
Change in financial liabilities -8.1 -96.9 -91.6
Change in contract liabilities -6.8 -32.4 -79.0
Cash flow from operating activities (gross cash flow) 266.2 125.9 >100
Cash receipts and payments for investments -107.5 -239.7 -55.2
Proceeds from the disposal of fixed assets 0.7 0.6 16.7
Cash payments for acquisitions - - -
Cash flow from long-term investing activities before securities -106.8 -239.1 -55.3
Cash receipts and payments for the acquisition / disposal of securities and fixed-term deposits -128.5 18.7 n.a.
Cash flow from investing activities -235.3 -220.4 6.8
Dividends paid -2.8 -130.9 -97.9
Change in financial liabilities 171.6 183.7 -6.6
Lease liabilities repaid -16.3 -16.5 -1.2
Cash flow from financing activities 152.5 36.3 >100
Change due to exchange-rate fluctuations -6.8 0.1 n.a.
Total change in cash and cash equivalents 176.6 -58.1 n.a.
At the beginning of the period 435.8 341.1 27.8
At the end of the period 612.4 283.0 >100

Interim Report — Condensed Interim Consolidated Financial Statements
Wacker Chemie AG — 1st Half Year 2020
25
Statement of Changes in EquityJanuary 1 to June 30, 2020
€ millionSubscribed
capitalCapital
reservesTreasury
sharesRetained earnings
Other equity items Total
Non-controlling
interests Total
Jan. 1, 2019, as reported 260.8 157.4 -45.1 3,328.0 -613.9 3,087.2 58.3 3,145.5
Effects of first-time appli-cation of new accounting standards - - - 0.4 - 0.4 - 0.4
Jan. 1, 2019 260.8 157.4 -45.1 3,328.4 -613.9 3,087.6 58.3 3,145.9
Net income for the period - - - 25.6 - 25.6 6.1 31.7
Income and expenses recognized in equity - - - - -380.6 -380.6 0.8 -379.8
Total comprehensive income - - - 25.6 -380.6 -355.0 6.9 -348.1
Dividends paid - - - -124.2 - -124.2 -6.7 -130.9
June 30, 2019 260.8 157.4 -45.1 3,229.8 -994.5 2,608.4 58.5 2,666.9
Jan. 1, 2020 260.8 157.4 -45.1 2,561.6 -967.8 1,966.9 62.1 2,029.0
Net income for the period - - - 68.8 - 68.8 4.6 73.4
Income and expenses recognized in equity - - - - -111.6 -111.6 -2.4 -114.0
Total comprehensive income - - - 68.8 -111.6 -42.8 2.2 -40.6
Dividends paid - - - - - - -2.8 -2.8
June 30, 2020 260.8 157.4 -45.1 2,630.4 -1,079.4 1,924.1 61.5 1,985.6

Interim Report — Condensed Interim Consolidated Financial Statements
Wacker Chemie AG — 1st Half Year 2020
26
Reconciliation of Other Equity ItemsJanuary 1 to June 30, 2020
€ million
Changes in fair value of
securities – FVOCI
Impairments of securities
– FVOCI
Difference from foreign
currency translation adjustment
Change in fair value
of derivative financial
instruments (cash flow
hedge)
Remeasure- ment of defined
benefit plans
Effects of net investments
in foreign operations Total
Attributable to Wacker Chemie AG shareholders
Jan. 1, 2019 - - 148.9 -1.1 -758.0 -3.7 -613.9
Changes recognized in equity - - - -4.9 -393.8 - -398.7
Reclassification to the statement of income - - - 7.0 - - 7.0
Changes in exchange rates - - 11.1 - - - 11.1
June 30, 2019 - - 160.0 1.0 -1,151.8 -3.7 -994.5
Jan. 1, 2020 - - 193.9 1.7 -1,159.7 -3.7 -967.8
Changes recognized in equity - - - -1.2 -70.7 - -71.9
Reclassification to the statement of income - - - 2.1 - - 2.1
Changes in exchange rates - - -41.8 - - - -41.8
June 30, 2020 - - 152.1 2.6 -1,230.4 -3.7 -1,079.4
Attributable to non-controlling interests
Jan. 1, 2019 - - -5.5 - - - -5.5
Changes in exchange rates - - 0.8 - - - 0.8
June 30, 2019 - - -4.7 - - - -4.7
Jan. 1, 2020 - - -5.5 - - - -5.5
Changes in exchange rates - - -2.4 - - - -2.4
June 30, 2020 - - -7.9 - - - -7.9

Interim Report — Notes to the Consolidated Financial Statements
Wacker Chemie AG — 1st Half Year 2020
27
Notes to the Consolidated Financial Statements
Notes to the Consolidated Financial StatementsJanuary 1 to June 30, 2020
Accounting and Valuation MethodsThe consolidated interim financial statements of Wacker Chemie AG as of June 30, 2020 have been prepared in accordance with the provisions of International Accounting Standard (IAS) 34 and presented in condensed form on the basis of the International Financial Reporting Standards (IFRSs) – as issued by the International Accounting Standards Board, London, endorsed by the European Union and applicable on the closing date – and on the basis of the interpretations of the IFRS Interpretations Committee. The accounting and valuation methods applicable in fiscal 2019 have been supplemented by the new accounting standards to be applied for the first time in 2020. There were no material changes to WACKER’s accounting and valuation methods in 2020. The accounting and valuation methods are otherwise unchanged.
The preparation of the interim financial statements neces-sitates assumptions and estimates affecting the amounts and the reporting of the recognized assets and liabilities, income and expenses, and contingent liabilities. All assumptions and estimates are based on projections that were valid on the reporting date. The actual values may differ from these assumptions and estimates if the economic conditions referred to do not develop in line with the expectations as of the reporting date. Taxes are calculated in the same manner as at year-end, namely by determining the tax expenses as of the interim reporting date. The option pursuant to IAS 34 of making an estimate is not exercised.
As of each reporting date, the net defined benefit obligation must be reassessed and the discount factor newly determined. Net pension provisions were determined as of June 30, 2020, using discount factors of 1.24 percent in Germany and 2.49 percent in the USA (June 30, 2019: 1.30 percent in Germany and 3.35 percent in the USA). As of December 31, 2019, the discount factors were 1.25 percent in Germany and 3.16 percent in the USA.
The interim report is an information tool that builds on the consolidated financial statements at year-end. The accounting, valuation and consolidation methods used and the exercising of options contained in the IFRSs are explained in detail in the Notes.
The Group’s parent company, Wacker Chemie AG, is a listed company under the laws of the Federal Republic of Germany and has its headquarters in Munich, Germany (entered in Munich’s commercial register under HRB 159705). Its registered office is at Hanns-Seidel-Platz 4, 81737 Munich, Germany.
Effects of the Coronavirus Pandemic The effects of the coronavirus pandemic on the WACKER Group’s business operations are described in the interim management report. WACKER applied for short-time work payments for its employees in Germany for the months of May and June. The affected divisions were WACKER POLYSILICON at the Burghausen and Nünchritz sites, and WACKER SILICONES at the Burghausen site. Reimbursements to employees are a transit item for WACKER. As of June 30, 2020, claims for reimbursement against the German Federal Employment Agency in the amount of € 1.5 million were recognized under current other financial assets. Reimbursements of social security contributions form part of the personnel expenses included in cost of goods sold and are classified as performance-related compensa-tion. They are also recognized as current financial assets. Receivables management revealed a slight increase in past-due trade receivables on the reporting date. As of the half-yearly reporting date, WACKER had not experienced any material defaults on receivables. As part of its risk management activities, WACKER determines the expected credit loss for trade receivables using a risk matrix. Due to the Covid-19 crisis, WACKER increased its risk estimation within the bandwidths for past-due payments. Losses from the impairment of trade receivables amounted to € 6.1 million in the first half of the year. An analysis of fixed assets as of June 30, 2020, did not result in any need to recognize impairment losses.
Seasonal InfluencesSales of polymer and silicone products to the construction industry are subject to seasonal fluctuations over the year. Volumes are higher in the summer months than in the winter, when the construction industry slows down. This effect can be cushioned by overseas business. Sales, particularly for the WACKER POLYMERS segment, are usually lower in Q1 and Q4 than in Q2 and Q3.

Interim Report — Notes to the Consolidated Financial Statements
Wacker Chemie AG — 1st Half Year 2020
28
Disaggregation of Revenue in Accordance with IFRS 15At WACKER, the sales revenue per segment corresponds to the Group’s different product categories. The differences between chemical products, and also between market and customer groups, are evident in the segments. The particular region to which WACKER supplies its products also has a major impact on revenue. WACKER recognizes the majority of its sales at specific delivery dates. In the case of customer-specific orders at WACKER BIOSOLUTIONS, sales are recognized over time. The following table shows the disaggregation of revenue in accordance with IFRS 15:
Other Financial ObligationsFor information on disclosures of other financial obliga-tions, please refer to the Notes to the consolidated financial statements in the 2019 Annual Report.
During the reporting period, there were no material changes to the information provided in the 2019 Annual Report.
Changes in the Scope of ConsolidationAs of June 30, 2020, the scope of consolidation comprised 54 companies (including Wacker Chemie AG). The interim financial statements comprised 50 fully consolidated companies. The scope of consolidation was unchanged compared with December 31, 2019.
Disaggregation of Revenue in Accordance with IFRS 15:
Jan. 1 to June 30, 2020
WACKER SILICONES
WACKER POLYMERS
WACKER BIOSOLUTIONS
WACKER POLYSILICON
Other / consolidation Total
€ million 2020 2019 2020 2019 2020 2019 2020 2019 2020 2019 2020 2019
Revenue by region
Europe 520.2 570.5 302.7 315.0 55.1 45.1 47.9 47.4 53.5 69.8 979.4 1,047.8
The Americas 215.0 238.8 161.2 178.7 46.1 45.8 3.8 5.5 0.4 0.6 426.5 469.4
Asia 311.6 365.5 130.0 147.7 20.5 24.0 285.1 327.9 1.5 1.9 748.7 867.0
Other regions 76.2 80.1 34.5 35.5 4.5 4.2 - 0.2 0.1 - 115.3 120.0
Total 1,123.0 1,254.9 628.4 676.9 126.2 119.1 336.8 381.0 55.5 72.3 2,269.9 2,504.2
Of which outside the scope of IFRS 15 - - - - - - - - 2.6 3.5 2.6 3.5
Time of revenue recognition
Point in time 1,123.0 1,254.9 628.4 676.9 92.7 95.6 336.8 381.0 55.5 72.3 2,236.4 2,480.7
Over time - - - - 33.5 23.5 - - - - 33.5 23.5
Total 1,123.0 1,254.9 628.4 676.9 126.2 119.1 336.8 381.0 55.5 72.3 2,269.9 2,504.2

Interim Report — Notes to the Consolidated Financial Statements
Wacker Chemie AG — 1st Half Year 2020
29
Segment ReportingPlease refer to the Division Performance section of this interim report for the required information on segments.
Information on Fair ValueThe fair value of a financial instrument is the price that would be achieved in the sale of an asset, or paid to transfer a liability, in an orderly transaction between market participants at the measurement date. The following table shows the carrying amounts and fair values of the Group’s financial assets and liabilities.
As was the case at the end of the previous fiscal year, WACKER measured equity instruments not held for trading in the amount of € 11.8 million at fair value pursuant to IFRS 9 and reallocated these to Level 3 of the fair value hierarchy. The instruments concerned consist mainly of small, regional investments in non-profits that operate infrastructure facilities.
Reconciliation with Segment Results
€ million 6M 2020 6M 2019 Change in %
EBIT of reporting segments 116.4 91.0 27.9
Corporate functions / Other -44.0 -19.1 >100
Consolidation -0.8 -1.1 -27.3
Group EBIT 71.6 70.8 1.1
Financial result -23.2 -27.6 -15.9
Income before income taxes 48.4 43.2 12.0
Carrying Amounts and Fair Values of Financial Instruments (IFRS 7)
€ million June 30, 2020 Dec. 31, 2019
Fair value Carrying amount Fair value Carrying amount
Trade receivables 650.6 650.6 631.5 631.5
Securities and fixed-term deposits (measured at amortized cost) 188.1 188.1 59.5 59.5
Securities (FVOCI)1 - - - -
Securities (FVPL)2 49.6 49.6 49.9 49.9
Other financial assets 151.9 151.9 138.7 138.7
Loans and other financial assets (measured at amortized cost) 136.3 136.3 121.6 121.6
Investments (FVPL)3 11.8 11.8 11.6 11.6
Derivative financial instruments (FVPL and FVOCI) 3.8 3.8 5.5 5.5
Cash and cash equivalents (measured at amortized cost) 612.4 612.4 435.8 435.8
Financial liabilities 1,308.4 1,285.9 1,130.1 1,121.1
Financial liabilities from lease liabilities 137.1 137.1 137.8 137.8
Trade payables 302.3 302.3 355.0 355.0
Other financial liabilities 30.7 30.7 14.4 14.4
Financial liabilities recognized at amortized cost 21.2 21.2 8.4 8.4
Derivative financial instruments (FVPL and FVOCI) 9.5 9.5 6.0 6.0
1 FVOCI = financial assets measured at fair value through other comprehensive income 2 FVPL = financial assets measured at fair value through profit or loss 3 The historical cost of these investments represents the best approximation of their fair value.

Interim Report — Notes to the Consolidated Financial Statements
Wacker Chemie AG — 1st Half Year 2020
30
The financial assets and liabilities measured at fair value in the statement of financial position were allocated to one of three categories in accordance with the fair value hierarchy described in IFRS 13. Allocation to these categories reveals which of the fair values reported were settled through market transactions and the extent to which the measurement was based on models in the absence of observable market transactions. Please refer
to the Financial Instruments section of the Notes to the consolidated financial statements in the 2019 Annual Report for a definition of the fair value hierarchy and the allocation of financial assets and liabilities to the categories in this hierarchy.
The following table shows the fair-value-hierarchy classifi-cation of financial assets and liabilities:
The market value determined in Level 1 is based on quoted, unadjusted prices in active markets for these assets and liabilities or identical ones. The financial instruments allocated to Level 2 are measured using methods based on parameters that are either directly or indirectly derived from observable market data. These include hedging and non-hedging derivative financial instruments, loans and financial liabilities. In Level 3, the market value is deter-mined on the basis of parameters for which no observable
prices are available. This includes WACKER investments not held for trading. At the respective reporting date of each quarter, WACKER reviews whether its financial instruments are still allocated to the appropriate levels of the fair value hierarchy. As was the case in the consolidated financial statements for 2019, no reclassifications were carried out between the levels of the fair value hierarchy in the first six months of 2020.
Fair Value Hierarchy
€ million Fair value hierarchy Fair value hierarchy
June 30, 2020 Dec. 31, 2019
Level 1 Level 2 Level 3 Total Level 1 Level 2 Level 3 Total
Financial assets measured at fair value
Fair value through profit or loss Derivatives that do not qualify for
hedge accounting (FVPL) - 1.6 - 1.6 - 2.7 - 2.7
Investments in equity instruments – trading (FVPL) - - 11.8 11.8 - - 11.6 11.6
Fair value through other comprehensive income / through profit or loss Derivatives that qualify for hedge accounting - 2.2 - 2.2 - 2.8 - 2.8
Securities – held-to-collect and for sale (FVOCI) - - - - - - - -
Securities – trading (FVPL) 49.6 - - 49.6 49.9 - - 49.9
Total 49.6 3.8 11.8 65.2 49.9 5.5 11.6 67.0
Financial assets measured at amortized cost
Loans – held-to-collect - 91.7 - 91.7 - 91.1 - 91.1
Total - 91.7 - 91.7 - 91.1 - 91.1
Financial liabilities measured at fair value
Fair value through profit or loss Derivatives that do not qualify for hedge accounting (FVPL) - 8.8 - 8.8 - 4.3 - 4.3
Fair value through other comprehensive income / through profit or loss Derivatives that qualify for hedge accounting - 0.7 - 0.7 - 1.7 - 1.7
Total - 9.5 - 9.5 - 6.0 - 6.0
Financial liabilities measured at amortized cost
Financial liabilities - 1,308.4 - 1,308.4 - 1,130.1 - 1,130.1
Total - 1,308.4 - 1,308.4 - 1,130.1 - 1,130.1

Interim Report — Notes to the Consolidated Financial Statements
Wacker Chemie AG — 1st Half Year 2020
31
In the period under review, no non-recurring fair value measurements were carried out.
Related Party DisclosuresIAS 24 stipulates that a person or company which controls, or is controlled by, Wacker Chemie AG must be disclosed unless this party is already included in Wacker Chemie AG’s consolidated financial statements as a consolidated company. Control exists if a shareholder holds more than half of the voting rights in Wacker Chemie AG or, by virtue of provisions in the Articles of Association or contractual arrangements, has the possibility of controlling the financial and business policy of the WACKER Group’s Executive Board.
The WACKER Group is affected by the IAS 24 rules mainly with respect to the business relations with Wacker Chemie AG’s joint ventures, major shareholders, and Executive and Supervisory Board members. The principles of IAS 24 also apply to all transactions with non-consolidated subsidiaries, associates and joint ventures, since Wacker Chemie AG exercises significant influence over them.
The WACKER Group is controlled by its majority share-holder, Dr. Alexander Wacker Familiengesellschaft mbH, which holds over 50 percent of the voting shares in Wacker Chemie AG.
The provision of services between Wacker Chemie AG and its majority shareholder, Dr. Alexander Wacker Familien-gesellschaft mbH, as well as with the shareholders of Dr. Alexander Wacker Familiengesellschaft mbH and their close family members, is of subordinate importance, and concerns, to a minor extent, the renting of office space and exchange of services. None of these services is of significant business scope. These transactions are conducted at arm’s length.
Wacker Chemie AG’s pension fund (Pensionskasse der Wacker Chemie V VaG) is also considered a related party pursuant to IAS 24. The provision of services takes place between the two entities in the area of company pension plan benefits. WACKER makes payments to plan assets to cover pension obligations. Wacker Chemie AG also rents its headquarters building and the land on which the building stands from a subsidiary of the pension fund. Since January 1, 2019, WACKER has accounted for the rental contract as a lease liability in accordance with IFRS 16. As of June 30, 2020, lease liabilities totaled € 46.2 million. Interest expense amounted to € 0.3 million in the first half of the year. Additional liabilities of € 2.5 million (Dec. 31, 2019: € 2.7 million) mainly related to outstanding contributions.
Further, WACKER Group companies have not conducted any material transactions with members of Wacker Chemie AG’s Executive or Supervisory Boards or with any other key management personnel or with companies of whose executive or supervisory bodies these persons are members. The same applies to close family members of the aforementioned persons.
Business with non-consolidated subsidiaries, the pension fund, and joint ventures and associates is conducted at arm’s length, i.e. under conditions that are customary between unrelated third parties. Contractually agreed transfer-price formulas have been defined for joint-venture and associated-company product shipments.
The table below shows the volume of supply and service activities with the above-mentioned related parties.
Related Party Disclosures
€ million 2020 2019
6M 2020 June 30, 2020 6M 2019 Dec. 31, 2019
Income Expenses Receivables Liabilities Income Expenses Receivables Liabilities
Associates 75.1 46.5 43.9 13.4 74.3 67.6 7.9 16.1
Joint ventures 1.8 0.6 0.7 0.1 2.1 0.5 1.0 0.2

Interim Report — Notes to the Consolidated Financial Statements
Wacker Chemie AG — 1st Half Year 2020
32
In addition, there was a loan to an associate totaling € 91.7 million (Dec. 31, 2019: € 91.1 million), € 52.0 million of which was recognized as a current financial receivable.
Major Events during the Interim Reporting PeriodEvents during the reporting period that are considered significant in terms of their impact, nature or frequency are described in the interim group management report.
Events after the Reporting DateNo major events subject to reporting requirements occurred by the authorization date of the half yearly finan-cial statements (July 30, 2020). There were no material or fundamental changes in the WACKER Group’s overall economic and business environment.
The Group’s legal and organizational structure remained unchanged.
Munich, July 30, 2020
The Executive Board of Wacker Chemie AG
Rudolf Staudigl Christian Hartel
Tobias Ohler Auguste Willems
Exchange Rates
Exchange rate as of Average exchange rate
June 30, 2020 Dec. 31, 2019 6M 2020 6M 2019
USD 1.12 1.12 1.10 1.13
CNY 7.93 7.81 7.75 7.67

Interim Report — Responsibility Statement
Wacker Chemie AG — 1st Half Year 2020
33
Responsibility Statement
To the best of our knowledge, and in accordance with the applicable reporting principles for interim financial reporting, the interim consolidated financial statements give a true and fair view of the Group’s earnings, net assets and financial position, and the Group’s interim management report provides both a fair review of the development and performance of the Group’s business and of its situation as well as a description of the principal opportunities and risks associated with the Group’s expected development for the remaining months of the fiscal year.
Munich, July 30, 2020
The Executive Board of Wacker Chemie AG
Rudolf Staudigl Christian Hartel
Tobias Ohler Auguste Willems

Wacker Chemie AG — 1st Half Year 2020
34
Interim Report — Review Report
Review ReportTo Wacker Chemie AG, Munich
We have reviewed the condensed interim consolidated financial statements of Wacker Chemie AG – comprising the consolidated statement of financial position, the consolidated statement of income, the consolidated statement of comprehensive income, the consolidated statement of cash flows, the statement of changes in equity and selected explanatory notes – together with the interim group management report of Wacker Chemie AG, for the period from January 1 through Tuesday, June 30, 2020, that are part of the semi-annual financial report according to § 115 WpH G [“Wertpapierhandelsgesetz”: “German Securities Trading Act”]. The preparation of the condensed interim consolidated financial statements in accordance with International Accounting Standard IAS 34 “Interim Financial Reporting” as adopted by the EU, and of the interim group management report in accordance with the requirements of the WpH G applicable to interim group management reports, is the responsibility of the Company’s management. Our responsibility is to issue a report on the condensed interim consolidated financial statements and on the interim group management report based on our review.
We performed our review of the condensed interim consolidated financial statements and the interim group management report in accordance with the German generally accepted standards for the review of financial statements promulgated by the Institut der Wirtschaftsprüfer (IDW). Those standards require that we plan and perform the review so that we can preclude through critical evaluation, with a certain level of assurance, that the condensed interim consolidated financial statements have not been prepared, in material respects, in accordance with IAS 34 “Interim Financial Reporting” as adopted by the EU, and that the interim group management report has not been prepared, in material respects, in accordance with the requirements of the WpH G applicable to interim group management reports. A review is limited primarily to inquiries of company employees and analytical assessments and therefore does not provide the assurance attainable in a financial statement audit. Since, in accordance with our engagement, we have not performed a financial statement audit, we cannot issue an auditor’s report.
Based on our review, no matters have come to our attention that cause us to presume that the condensed interim consolidated financial statements have not been prepared, in material respects, in accordance with IAS 34, “Interim Financial Reporting” as adopted by the EU, or that the interim group management report has not been prepared, in material respects, in accordance with the requirements of the WpH G applicable to interim group management reports.
Munich, July 30, 2020
KPMG AG
Wirtschaftsprüfungsgesellschaft
Original German version signed by:Andrejewski Hanshen
Wirtschaftsprüfer Wirtschaftsprüfer
[German Public Auditor] [German Public Auditor]

2020 Financial Calendar
Annual Shareholders’ Meeting
Interim Report on the 3rd Quarter of 2020
Contacts Publishing Details
Investor RelationsJoerg HoffmannHead of Investor RelationsTel. +49 89 [email protected]
Media RelationsChristof BachmairTel. +49 89 [email protected]
PublisherWacker Chemie AGCorporate CommunicationsHanns-Seidel-Platz 481737 Munich, GermanyTel. +49 89 6279-0Fax +49 89 6279-1770www.wacker.com
Overall ResponsibilityJörg Hettmann
Project CoordinationHeide Feja
DesignKirchhoff Consult AG, Hamburgwww.kirchhoff.de
This Interim Report contains forward-looking statements based on assumptions and estimates of WACKER’s Executive Board. Although we assume the expectations in these forward-looking statements are realistic, we cannot guarantee they will prove to be correct. The assumptions may harbor risks and uncertainties that may cause the actual figures to differ considerably from the forward-looking statements. Factors that may cause such discrepancies include, among other things, changes in the economic and business environment, variations in exchange and interest rates,
the introduction of competing products, lack of acceptance for new products or services, and changes in corporate strategy. WACKER does not plan to update its forward- looking statements, nor does it assume the obligation to do so.
Due to rounding, numbers presented throughout this and other reports may not add up precisely to the totals provided, and percentages may not precisely reflect the absolute figures.
AUGUST
4
OCTOBER
29

Wacker Chemie AGHanns-Seidel-Platz 481737 Munich, GermanyTel. +49 89 6279-0Fax +49 89 6279-1770www.wacker.com