interim report 2013
TRANSCRIPT

Interim Report 2013 1
Contents
Inside front cover Corporate Profile
2 Corporate Structure
3 Half-Year Financial Highlights
4 2013 Goals: Half-Year Review
8 Review of Operations
32 Financial Review
39
44
Condensed Interim Consolidated Financial Statements
Notes to the Condensed Interim Consolidated Financial Statements
67 Review Report of the Independent Auditors
68 Review Statement of the Audit Committee
69 Corporate Governance Report
70 Interests of Directors and Substantial Shareholders
72 Purchase, Sale or Redemption of Listed Securities
73 Information for Investors
74 Summary of Principal Investments

Corporate Structure
First Pacifi c Company Limited2
As at 27 August 2013
(1) Economic interest(2) In addition, Two Rivers Pacific Holdings Corporation, a Philippine affiliate of First Pacific, holds an additional 15.0% economic interest and 5.4%
economic interest in Philex and Philex Petroleum, respectively.(3) Includes an 8.1% effective economic interest in FPM Power held by First Pacific through its indirect interests in Meralco. Meralco’s wholly-owned
subsidiary company, Meralco PowerGen Corporation, holds a 40% economic interest in FPM Power.
25.6%(1)
50.1%(1)
31.2%(1)(2)
11.4%(2)
55.8%(1)
99.5%
50.0%
51.3%
5.2%
99.9%
33.4%-100%
80.5%
60.0%
6.7%
100%
100%
64.8%
99.8%
50.0%
92.9%
100%
72.1%
59.5%
46.0%
67.1%
100%(1)
100%
49.96% 100%
Intermediate investment holdingsubsidiaries and affiliates
Digital Telecommunications Philippines, Inc.
DMCI-MPIC Water Company, Inc.
Maynilad Water Services, Inc.
Metro Pacific Tollways Corporation
Metro Pacific Tollways Development Corporation
Hospitals
PT Indofood CBP Sukses Makmur Tbk
Indofood Agri Resources Ltd.
PT Salim Ivomas Pratama Tbk
PT Indomarco Adi Prima
PLDT Communications andEnergy Ventures, Inc.
Digitel Mobile Philippines, Inc.
Manila Electric Company
Cavitex Infrastructure Inc.
Manila North Tollways Corporation
Meralco PowerGen Corporation
Tollways Management Corporation
PT Perusahaan Perkebunan London Sumatra Indonesia Tbk
100%
Beacon Electric AssetHoldings, Inc.
Silangan Mindanao Mining Co., Inc.
Philex Petroleum Corporation
Pitkin Petroleum Plc
3.3%
70.0%
68.1%(1)(3)
FPM Power Holdings Limited
Forum Energy Plc Forum (GSEC 101) Limited
PacificLight Power Pte. Ltd.
100%
Smart Communications, Inc.
48.8%
50.3%

Half-Year Financial Highlights
Interim Report 2013 3
Financial Summary For the six months ended 30 June 2013 2012 changeUS$ millions (Restated) (i) Turnover 3,123.8 2,989.5 +4.5%Contribution from operations 250.3 249.2 +0.4%Recurring profit 185.1 201.9 -8.3%Foreign exchange and derivative (losses)/gains (15.4) 3.6 –(Loss)/gain on changes in fair value of plantations (23.6) 0.1 –Non-recurring items (3.4) 15.2 –Profit attributable to owners of the parent 142.7 220.8 -35.4%
US$ millions
At30 June
2013
At31 December
2012 (Restated) (i)
change Total assets 15,240.4 13,886.7 +9.7%Net debt 3,341.7 2,145.8 +55.7%Equity attributable to owners of the parent 3,239.1 3,240.0 –Total equity 7,393.8 7,250.7 +2.0%
Per Share Data For the six months ended 30 June 2013 2012 changeU.S. cents (Restated) (i) Recurring profit 4.72 5.14 -8.2%Basic earnings 3.64 5.62 -35.2%Dividend 1.03 1.03 –
At30 June
2013
At31 December
2012 change Adjusted net asset value (NAV)
– U.S. dollars 2.15 1.98 +8.6% – HK dollars 16.78 15.43 +8.7%
Financial Ratio
Times
At30 June
2013
At31 December
2012 (Restated) (i)
Gearing ratio(ii)
– Consolidated 0.45 0.30 – Head Office 0.95 0.67
(i) Refer to Note 1(B) to the condensed interim consolidated financial statements(ii) Calculated as net debt divided by total equity
300
240
180
120
60
0
09 10 11 12 13
Contribution from OperationsUS$ millions
250
200
150
100
50
0
09 10 11 12 13
Recurring ProfitUS$ millions

2013 Goals: Half-Year Review
First Pacifi c Company Limited4
Goal Achievement
Bring PacificLight Power on-line in December 2013 for contribution to Group earnings and cash flow in 2014
OngoingAs at 30 June 2013, the power plant construction and commissioning remain on track to meet target dates of operation.
Continue to explore investment opportunities in existing core businesses areas across the region
OngoingSenior management continue to research potential M&A and investment targets in emerging Asia in the sectors of telecommunications, infrastructure, consumer food products and natural resources.
Expand sources of production at Philex from just one mine, Padcal, to others, through organic growth and/or via acquisition
OngoingDevelopment of the Silangan project continues on schedule towards first ore production beginning in 2017 as First Pacific continues to examine potential investment opportunities in the mining sector in emerging Asia.
Continue to develop the infrastructure portfolio
Achieved and ongoingIn January 2013, MPIC subsidiary Metro Pacific Tollways Corporation (“MPTC”) expanded its toll road portfolio with an agreement to manage Manila-Cavitex Toll Expressway (“CAVITEX”), a 14-kilometer toll road running from Manila Cavite to Laguna with daily traffic averaging more than 100,000 vehicles. First Pacific and MPIC continue to investigate potential infrastructure investments across emerging Asia.

2013 Goals: Half-Year Review
Interim Report 2013 5
Goal Achievement
Maintain double-digit growth in broadband subscribers and revenues
Partially achieved and ongoingCombined broadband subscriber base at 3.2 million (1H12: 3.0 million) of which 2.3 million were wireless broadband subscribers and over 920,000 were Digital Subscriber Line (“DSL”) subscribers. To encourage usage, a wide range of packages, including offers bundled with engaging and compelling content have been launched and delivered through PLDT’s unrivalled fixed and wireless networks. Broadband service revenues increased 14% to Pesos 12.7 billion (US$306.3 million).
Return to earnings growth in 2013 OngoingOn track to achieve core income guidance of Pesos 38.3 billion in full-year 2013. Core income in the first half up 5% to Pesos 19.4 billion (US$467.8 million).
Fortify network advantage with capital expenditure of Pesos 29 billion
OngoingCapital expenditure for the first six months was Pesos 4.8 billion (US$115.8 million), 49% lower than in the first half of 2012 following higher levels of capital expenditure in 2011-2012 in connection with PLDT’s network modernization program. PLDT is on track to expand its 3G coverage to 90% of the Philippines population as well as expand the group’s fiber footprint to 76,000 kilometers by year-end 2013.
Continue initiatives for the further integration of Digitel/Sun into the PLDT group to realize greater operating synergies
Achieved and ongoingEBITDA up 2% to Pesos 40.0 billion (US$964.8 million) and EBITDA margin stood at 49% (1H12: 49%). The integration of Digitel/Sun has allowed PLDT to offer cross-network marketing and promotional offers unmatched by any other domestic telecommunications provider.
Complete the divestment of SPi business process outsourcing (“BPO”) business
AchievedOn 30 April 2013, PLDT completed the disposal of 100% interest in SPi Global to Asia Outsourcing Gamma Ltd. (“AOGL”), a company controlled by CVC Capital Partners. PLDT reinvested in 20% of AOGL. The net proceeds from the disposal and the reinvestment was approximately US$320 million. PLDT booked a net gain of Pesos 2.0 billion (US$48.2 million) from the sale.

First Pacifi c Company Limited6
2013 Goals: Half-Year Review
Goal Achievement
Participate in further development of the country’s infrastructure, such as airports or Manila’s light rail systems
OngoingMPIC submitted a conditional bid for Manila’s Light Rail Transit System Line 1 South Extension project. It is in the process of finalizing documents to bid for the redevelopment of the Cebu-Mactan Airport Project and is qualified to bid for the Automated Fare Collection System Project to provide a unified ticketing system for the Metro Rail Transit System.
Continue to grow the hospital network through investing in hospitals across the Philippines
Achieved and ongoingMPIC completed the acquisition of a 51.0% interest in De Los Santos Medical Center Inc. (“DLSMC”) and signed an investment agreement with Central Luzon Doctors’ Hospital (“CLDH”). It continues to evaluate opportunities for expansion through investing in additional hospitals in strategic areas of the Philippines, aiming for a total of 3,000 beds across 15 hospitals.
Continuous expansion of the toll road portfolio
Achieved and ongoingConstruction of NLEX Harbour Link’s first phase (Segment 9) started in May 2013. MPTC is working on construction plans for NLEX Harbour Link’s second phase (Segment 10), NLEX Citilink and the Connector Road projects, an expansion plan for CAVITEX and the integration of Subic Clark Tarlac Expressway (“SCTEX”) with North Luzon Expressway (“NLEX”).
Successful resolution of rate rebasing at Maynilad Water Services, Inc. (“Maynilad”) and continue expansion of the water business outside Metro Manila
OngoingThe review process for rate rebasing missed its July 2013 expected completion deadline. Maynilad is considering options for resolution of the matter, including arbitration proceedings. In March 2013, Maynilad acquired a 10% interest in Subic Water and Sewerage Co., Inc. (“Subic Water”) which serves 40,000 customers in Olongapo City and the Subic Bay Freeport Zone. It continues to explore investment opportunities in water distribution and sewerage management in the Philippines and abroad.
Support Manila Electric Company’s (“Meralco”) entry into power generation and participation in Open Access as a retail electricity supplier
Achieved and ongoingThrough their investments in FPM Power Holdings Limited (“FPM Power”), First Pacific and Meralco’s wholly-owned subsidiary Meralco PowerGen Corporation (“Meralco PowerGen”) acquired a 70% interest in PacificLight Power Pte Ltd. (“PacificLight”, former GMR Energy (Singapore) Pte Ltd.) based in Singapore. PacificLight’s combined cycle combustion turbine power project consists of two 400-megawatt (“MW”) natural gas-fired turbines which are on track to begin commercial electricity production by early 2014. When Retail Competition and Open Access for electricity commenced on 26 June 2013, Meralco’s Retail Electricity Supply unit (“MPower”) successfully signed over 60% of the initial registered contestable customers.

Interim Report 2013 7
2013 Goals: Half-Year Review
Goal Achievement
Accelerate growth by increasing new product innovation and expanding business categories
OngoingFourteen products among other three new flavors for bag noodles under the brand names of Sarimi and Supermi, jumbo cup noodles, soy bean chips with chili padi, ginger biscuits, and cereal snacks including packaging rejuvenation for dairy products were launched during the period. New investments in non-alcoholic beverage with Asahi is expected to commence commercial production in 2014, in oil and fat products with Tsukishima will add new margarine products, whipped non-dairy filling creams, batter conditioners, and oil and fat derivative products for the bakery, confectionery and restaurant industries.
Further enhance supply chain Achieved and ongoingInvested in a mainland Chinese vegetable producer and processor, established a beverage manufacturing and bottling businesses, and acquired an Indonesian forestry company. Details are in the Review of Operations section.
Further improve services OngoingContinue to increase service level to customers.
Goal Achievement
Resumption of permanent operations at the Padcal mine
OngoingOperations at the Padcal mine resumed on 8 March 2013 following the temporary lifting of the suspension order. Mining operations continue while consultations continue between the Company and the relevant government agencies.
Continue development of the Silangan Project
OngoingDeclaration of Mining Project Feasibility (“DMPF”) covering the Boyongan ore body was filed with the Philippine Mines and Geosciences Bureau (“MGB”) in February 2013. Exploration and development work continues and is on track to commence commercial production in 2017.
Fulfill the Company’s obligations under the Kalayaan joint venture agreement with Manila Mining Corporation
OngoingWork is ongoing in the preparation of the feasibility study that is required to be filed with Manila Mining Corporation by May 2014. Completion of this report and its acceptance by Manila Mining Corporation will allow the Company to increase its stake in this property from 5% to 60%.
Continue to enhance the public’s perception of the benefits of mining to the Philippines
OngoingThe strengthened Corporate Affairs Department is working closely with all stakeholders in the mining industry (including government agencies, non-government organizations, the Bureau of Mines, private institutions and the public) to improve the reputation of the mining industry and promote the benefit of mining to the Philippine economy.
Complete a capital raising exercise to enhance Philex’s financial position
OngoingIn March 2013, Philex’s board approved a rights offering of common shares to raise approximately Pesos 12.3 billion (US$284.7 million) mainly for the purposes of repaying US$128.6 million of loans from First Pacific and funding the development of the Silangan Project. The rights offering is expected to be launched in the second half of 2013.

Review of Operations
First Pacifi c Company Limited8
Improved operating results in the first half of 2013 signal an improved financial performance and outlook for First Pacific Group (“the Group”) companies going forward. PLDT returned to earnings growth while Indofood and MPIC delivered their strongest-ever half-year results. Philex’s Padcal mine returned to operations after a seven-month shutdown and immediately moved to full-rate production and improved grades of ore. Consolidated contribution from operations rose 0.4% to US$250.3 million in the period. First Pacific’s Board of Directors approved an interim dividend of HK8.0 cents (U.S. 1.03 cents), representing a payout of 24% of recurring profit. Last year’s interim dividend of HK8.0 cents (U.S. 1.03 cents) represented approximately 19% of that period’s recurring profit.
Below is an analysis of results by individual company.
Contribution Summary
TurnoverContribution toGroup profit(i)
For the six months ended 30 June 2013 2012 2013 2012US$ millions (Restated) (ii) PLDT(iii) – – 105.2 95.0MPIC 368.7 318.8 53.0 47.7Indofood 2,755.1 2,670.7 90.5 90.4Philex(iii) – – 3.2 16.1FPM Power – – (1.6) – Contribution from Operations(iv) 3,123.8 2,989.5 250.3 249.2 Head Office items:
– Corporate overhead (18.2) (11.3) – Net interest expense (42.5) (34.6) – Other expenses (4.5) (1.4)
Recurring Profit(v) 185.1 201.9Foreign exchange and derivative (losses)/gains(vi) (15.4) 3.6(Loss)/gain on changes in fair value of plantations (23.6) 0.1Non-recurring items(vii) (3.4) 15.2 Profit Attributable to Owners of the Parent 142.7 220.8
200
150
100
50
0
(50)
12 13 12 13 12 13
Contribution by CountryUS$ millions
Philippines Indonesia Singapore
(i) After taxation and non-controlling interests, where appropriate(ii) The Group has restated its 1H2012 contribution from PLDT to US$95.0 million from US$96.3 million
and non-recurring gains to US$15.2 million from US$15.3 million principally reflecting its adoption of Hong Kong Accounting Standard (HKAS) 19 (2011) “Employee Benefits” with effect from 1 January 2013. Accordingly, the Group’s 1H2012 recurring profit is restated to US$201.9 million from US$203.2 million and its 1H2012 profit attributable to owners of the parent is restated to US$220.8 million from US$222.2 million.
(iii) Associated companies(iv) Contribution from operations represents the recurring profit contributed to the Group by its operating
companies.(v) Recurring profit represents the profit attributable to owners of the parent excluding the effects of
foreign exchange and derivative losses/gains, loss/gain on changes in fair value of plantations and non-recurring items.
(vi) Foreign exchange and derivative losses/gains represent the losses/gains on foreign exchange translation differences on the Group’s unhedged foreign currency denominated net borrowings and payables and the changes in the fair values of derivatives.
(vii) Non-recurring items represent certain items, through occurrence or size, which are not considered as usual operating items. 1H13’s non-recurring losses of US$3.4 million mainly represent the Group’s debt refinancing costs (US$18.0 million), partly offset by share of PLDT’s gain on disposal of BPO business (US$12.1 million). 1H12’s non-recurring gains of US$15.2 million mainly represent the Group’s gain on dilution of a 0.2% interest in PLDT as a result of PLDT’s issuance of new shares upon its tender offer for Digitel’s shares in January 2012.

Interim Report 2013 9
Review of Operations – First Pacific
Turnover up 4% to US$3.1 billion from US$3.0 billion
• owing to strong sales growth at Indofood delivering a 3% increase in the Group’s turnover, followed by a 16% increase in MPIC’s sales
Contribution from operations to US$250.3 million from US$249.2 million
••
reflecting higher contribution from PLDT, MPIC and Indofoodmostly offset by lower contribution from Philex due to shorter operating period and lower realized metal prices
Recurring profit down 8% to US$185.1 million from US$201.9 million
• due to a 61% increase in corporate overhead to US$18.2 million• a 23% increase in net interest expense to US$42.5 million as a result of higher
average debt balance for the period and higher interest rates on debts with a longer average maturity
• offset by increase in contribution from operations
Non-recurring losses at US$3.4 million vs. gains of US$15.2 million
• mainly representing the Group’s debt refinancing costs, partly offset by share of PLDT’s gain on disposal of BPO business vs. gain on dilution of interest in PLDT recorded in the first half of 2012
Reported profit down 35% to • reflecting lower recurring profitUS$142.7 million from US$220.8million
• foreign exchange and derivative losses vs. gains in the first half of 2012• a loss on changes in the fair value of plantations of US$23.6 million• owing to non-recurring losses vs. gains in the first half of 2012
The Group’s operating results are denominated in local currencies, principally the peso, the rupiah and the Singapore dollar (S$), which are translated and consolidated to provide the Group’s results in U.S. dollar. The changes of these currencies against the U.S. dollar are summarized below.
Closing
At30 June
2013
At 31 December
2012Six months
change
At30 June
2012One year
change Peso 43.20 41.05 -5.0% 42.12 -2.5%Rupiah 9,929 9,670 -2.6% 9,480 -4.5%S$ 1.268 1.222 -3.6% 1.265 -0.2%
Average
Six monthsended
30 June2013
12 monthsended
31 December2012
Six monthschange
Six monthsended
30 June2012
One yearchange
Peso 41.46 42.08 +1.5% 42.72 +3.0%Rupiah 9,750 9,392 -3.7% 9,202 -5.6%S$ 1.247 1.245 -0.2% 1.260 +1.0%
During the period, the Group recorded net foreign exchange and derivative losses of US$15.4 million (1H12: gains of US$3.6 million), which may be further analyzed as follows: For the six months ended 30 June 2013 2012US$ millions Head Office (2.4) (2.6)PLDT (6.0) 5.6MPIC 0.1 0.4Indofood (3.7) 0.4Philex (0.7) (0.2)FPM Power (2.7) – Total (15.4) 3.6

First Pacifi c Company Limited10
Review of Operations – First Pacific
Rights IssueOn 10 July 2013, First Pacific completed a rights offering on the basis of one rights share for every eight existing shares at a price of HK$8.1 (US$1.04) per rights share. The offering raised over US$500 million (before expenses) to finance potential acquisitions and strategic investments, and for any residual balance for general corporate purpose.
Additional InvestmentsInfrastructureOn 15 March 2013, Maynilad acquired a 10% interest in Subic Water for a consideration of Pesos 211 million (US$5.1 million). Subic Water serves 40,000 customers in Olongapo City and the Subic Bay Freeport Zone.
On 28 March 2013, First Pacific and Meralco’s wholly-owned subsidiary Meralco PowerGen completed the acquisition of 70% of PacificLight, a company building a power plant located on Jurong Island, Singapore, for a total investment cost of approximately US$550 million. First Pacific holds 60% of the investment vehicle FPM Power and Meralco PowerGen owns the remaining 40%. PacificLight’s combined cycle combustion turbine power project consists of two 400 megawatt natural gas-fired turbines which are on track to begin commercial electricity production by early 2014. The remaining 30% of the project continues to be held by Petronas Power Sdn Bhd, a subsidiary of Malaysia’s state-owned oil and gas company.
On 3 June 2013, MPIC completed the acquisition of 51.0% interest in DLSMC in Quezon City, Metro Manila which has an authorized bed capacity of 150, for a consideration of Pesos 133 million (US$3.1 million).
On 24 June 2013, MPIC signed an investment agreement with CLDH in Tarlac City, which has bed capacity of 200.
In July 2013, MPIC’s 50%-owned company Beacon Electric Asset Holdings, Inc. (“Beacon Electric”) acquired an additional 18.3 million shares of Meralco for a consideration of Pesos 5.1 billion (US$118.1 million). This increased Beacon Electric’s interest in Meralco to 49.96% from 48.3%.
Foods/ConsumerIn February 2013, Indofood acquired an aggregate of 29.3% interest in China Minzhong Food Corporation Limited (“CMFC”) for a total consideration of approximately S$195.2 million (US$158.4 million). CMFC is a leading integrated vegetable processor in the People’s Republic of China with cultivation, processing and sales capabilities. It is listed in Singapore.
On 27 June 2013, PT Indofood CBP Sukses Makmur Tbk (“ICBP”) through joint venture companies with Asahi Group Holdings Southeast Asia Pte. Ltd. signed a conditional share purchase agreement to acquire all outstanding shares of PCIB for a total consideration of US$30 million. PCIB is involved in the manufacturing, marketing and distribution of non-alcoholic drinks.
Natural ResourcesOn 8 March 2013, PT Salim Ivomas Pratama Tbk (“SIMP”) and its subsidiary PT PP London Sumatra Indonesia Tbk (“Lonsum”) invested a total of Rupiah 330 billion (US$34.0 million) for SIMP to acquire an effective interest of 79.7% in PT Mentari Pertiwi Makmur (“MPM”). MPM is an investment company, through its subsidiary it engages in industrial forest plantations totaling 73,330 hectares in East Kalimantan Province.
On 5 April 2013, Philex Petroleum Corporation (“Philex Petroleum”) increased its interest in Pitkin Petroleum Plc (“Pitkin”) to 50.3% from 18.5% by acquiring new and existing shares for a total consideration of approximately US$34.8 million.
On 25 June 2013, Indofood Agri Resources Ltd. (“IndoAgri”), completed the acquisition of a 50% interest in Companhia Mineira de Açúcar e Álcool Participações (“CMAA”) for a consideration of approximately Brazilian Real 143.4 million (US$66.6 million). CMAA is involved in the sugar, ethanol and co-generation industry in Brazil.

Interim Report 2013 11
Review of Operations – First Pacific
Capital ManagementInterim DividendThe First Pacific Board has declared an interim dividend of HK8.0 cents (U.S. 1.03 cents) (1H12: HK8.0 cents (U.S. 1.03 cents)) per share (unchanged from a year earlier). The interim dividend represents a payout ratio of 24% of recurring profit to shareholders.
The Board has confirmed that capital allocation will remain as a combination of dividends and share repurchases taking into consideration economic conditions in the markets of Group operating companies and Head Office finances and investment plans. Full-year dividend payments will be at least 25% of recurring profit while the approved share repurchases budget for the last two financial years were 10% of recurring profit.
Share Repurchase ProgramFirst Pacific completed the two-year share repurchase program on 4 June 2012. As part of the focus on shareholder returns, during the first half of 2013, First Pacific repurchased and cancelled a total of 4.9 million shares at an average price of HK$9.77 (US$1.25) per share. The share repurchase was limited by the blackout of the Company’s corporate activities.
Debt ProfileAt 30 June 2013, net debt at the Head Office stood at US$1.6 billion while gross debt stood at US$1.7 billion with an average maturity of approximately 6.6 years. Approximately 14% of the Head Office’s borrowings were floating rate bank loans while fixed rate bonds comprised the remainder. Unsecured debts accounted for approximately 60% of Head Office borrowings. Blended interest rate was approximately 5.5% per annum.
Net interest expense increased 23% during the first half of 2013 to US$42.5 million as a result of a higher average debt level and higher interest rates on debts with a longer average maturity.
Interest CoverFor the first half of 2013, Head Office recurring operating cash inflow before interest expenses was approximately US$140.9 million and net cash interest payments were approximately US$42.5 million. For the 12 months ended 30 June 2013, the cash interest cover was approximately 3.6 times.
Foreign Currency HedgingThe Company actively reviews the potential benefits of hedging based on forecast dividend flows and enters into hedging arrangements (including the use of forward exchange contracts) for managing its foreign currency exposure in respect of dividend income and payments in foreign currencies on a transactional basis. There is no hedging arrangement for the balance sheet.
2013 OutlookAfter a difficult 2012 for PLDT and Philex, there is a turnaround in the fortunes of these two companies even as Indofood and MPIC drive to new record high half-year earnings in 2013.
The economies of emerging Asia, in particular Indonesia and the Philippines, continue to power ahead with high growth rates and much of our earnings are protected in a downturn, though there is risk of contagion from the Eurozone’s economic and financial difficulties, slower growth in China and uncertainty in the U.S.
Following First Pacific’s recent US$500 million capital-raising and refinancing of US$640 million bank borrowings, and in light of continuing financial prudence by the Group’s operating companies, the Group is in a strong position to satisfy our investment ambitions.
The management is continuing to seek value-creating investments in the four areas of telecommunications, infrastructure, consumer food products and natural resources.

First Pacifi c Company Limited12
Review of Operations – PLDT
PLDT contributed a profit of US$105.2 million to the Group (1H12 restated: US$95.0 million). This represents approximately 42% (1H12: 38%) of First Pacific’s aggregate contribution derived from the operations of subsidiary and associated companies for the period. The 11% improvement in profit contribution principally reflected higher recurring profit and a 3% appreciation of the average peso rate against the U.S. dollar.
Consolidated core net income up 5% to Pesos 19.4 billion (US$467.8 million) from Pesos 18.4 billion (US$431.7 million)
• reflecting higher wireless and fixed line service revenues, lower compensation and benefits expense, depreciation and provision for income tax
• includes gains from the sale of Philweb Corporation (“Philweb”) shares• partly offset by higher subsidies
Reported net income up 2% to Pesos 19.7 billion (US$475.3 million) from Pesos 19.3 billion (US$451.4 million)
• due to higher core net income and gain from the sale of BPO business• offset by higher foreign exchange and derivative losses and adjustment of
certain manpower reduction related expenses due to the adoption of the revised Philippine Account Standard (“PAS”) 19
Consolidated service revenues up 2% to Pesos 81.1 billion (US$2.0 billion) from Pesos 79.7 billion (US$1.9 billion)
• reflecting rise in non-SMS data revenues• broadband and internet revenues, including mobile internet browsing revenues,
up 13% to account for 21% of total service revenues• partly offset by declines in service revenues from national long distance,
international long distance, cellular international voice and satellite revenues, which represent 19% of total service revenues
• cellular SMS, cellular domestic voice and local exchange revenues, which constitute 60% of total service revenues, remained stable
EBITDA up 2% to Pesos 40.0 billion (US$964.8 million) from Pesos 39.1 billion (US$915.3 million)
• reflecting higher revenues and lower cash operating expenses in the first half of 2013 (excluding the effect of adopting revised PAS 19) as Pesos 1.7 billion (US$39.8 million) of manpower reduction expenses were booked in the first half of 2012
EBITDA margin stood at 49% • reflecting wireless margin of 49%• fixed line margin improved to 37% from 34%
Consolidated free cash flow down 1% to Pesos 20.7 billion (US$499.3 million) from Pesos 20.8 billion (US$486.9 million)
• reflecting lower cash from deconsolidated operations offset by higher cash from continuing operations and lower capital expenditure

Interim Report 2013 13
Review of Operations – PLDT
Capital ExpenditureCapital expenditure for 2013 is estimated at Pesos 29.0 billion (US$699.5 million), 20% lower than in 2012. Capital expenditure for the period was Pesos 4.8 billion (US$115.8 million), 49% lower than in the first half of 2012. PLDT is on track to expand its 3G coverage to 90% of the Philippine population by year end 2013, as well as expand its fiber footprint to 76,000 kilometers. Network expansion and enhancement, which at the end of June 2013 included the roll out of 1,100 LTE sites, 71,000 kilometers of fiber and new systems to implement its multi-media strategy, enables PLDT to offer a wide array of wireless, fixed line and broadband services.
Debt ProfileAs at 30 June 2013, PLDT recorded a consolidated net debt of US$1.8 billion, down from US$1.9 billion as at 31 December 2012, reflecting cash and cash equivalents higher by US$68.8 million resulting from higher cash flows from operating activities and proceeds from sale of investments. Gross debt at US$2.7 billion of which 70% due in and after 2015, 51% was U.S. dollar-denominated, only 36% of the total debt is unhedged after take into account of hedging in place and U.S. dollar cash on hand.
Capital ManagementInterim DividendPLDT’s Board of Directors declared an interim dividend of Pesos 63 (US$1.5) per share payable on 27 September 2013 to stockholders on record as of 30 August 2013, fulfilling PLDT’s commitment to pay out a regular dividend of 70% of core net income. The interim dividend paid in 2012 was Pesos 60 (US$1.4) per share.
Share BuybackIn 2008, PLDT’s board approved a share buyback program of up to 5 million shares. As of 30 June 2013, PLDT had bought back 2.7 million shares into treasury at an average cost of Pesos 2,388 (US$58) per share. Under the approved share buyback program, PLDT may still acquire up to 2.3 million shares from the market on an opportunistic basis.
Asset DisposalOn 30 April 2013, PLDT completed the disposal of 100% interest in its business process outsourcing business under SPi Global to AOGL, a company controlled by CVC Capital Partners. PLDT reinvested in 20% of AOGL. The net proceeds from the disposal and reinvestment was approximately US$320 million. PLDT booked a net gain of Pesos 2.0 billion (US$48.2 million) from the sale.
Financial Investment in Philippine Depositary Receipts (“PDRs”) of MediaQuest Holdings, Inc. (“MediaQuest”)In May 2012, PLDT announced its financial investment, through ePLDT, of Pesos 6.0 billion (US$140.4 million) in PDRs to be issued by MediaQuest, which would give PLDT a 40% economic interest in MediaScape Inc. (“MediaScape”) which operates a direct-to-home (“DTH”) pay-TV business under the brand name CignalTV. MediaQuest is a wholly-owned entity of the PLDT Beneficial Trust Fund, its major investments in media assets including TV5 and CignalTV. At the end of July 2013, CignalTV had over 515,000 subscribers.
In March 2013, PLDT announced an additional financial investment through ePLDT of Pesos 3.6 billion (US$86.8 million) in MediaQuest PDRs, for a 40% economic interest in SatVentures Inc. (a wholly-owned subsidiary of MediaQuest), which in turn holds the residual 60% economic interest in MediaScape. ePLDT will also invest Pesos 1.95 billion (US$47.0 million) in additional MediaQuest PDRs for 100% economic interest in Hastings Holdings (a wholly-owned subsidiary of MediaQuest), which holds minority stakes in the Philippine Star, the Philippine Daily Inquirer and BusinessWorld, three major newspapers in the Philippines. As of 31 July 2013, PLDT has advanced Pesos 3.1 billion (US$71.8 million) as deposit for future PDR subscriptions.

First Pacifi c Company Limited14
Review of Operations – PLDT
These financial investments are part of PLDT’s overall strategy of broadening the PLDT group’s distribution platforms to enhance its ability to deliver multi-media content across PLDT group’s extensive broadband and mobile networks.
WirelessPLDT Group’s combined cellular subscriber base grew by 5% to 73.4 million (31 December 2012: 69.9 million) representing approximately 67% of the total cellular market in the Philippines based on subscribers and approximately 60% in terms of revenues. Smart and Sun’s combined prepaid subscriber base increased 5% to 71.2 million, accounting for 97% of its total cellular subscriber base. Postpaid subscribers dipped by 3% to 2.2 million from end 2012 largely due to elimination of inactive accounts in the Sun brand during the first quarter. PLDT’s combined postpaid market share remained the biggest in the Philippine market with 54% of all postpaid cellular subscribers. A total of 54% of PLDT postpaid subscribers own smartphones.
At the end of the period, the cellular SIM penetration rate (counting multiple SIM) in the Philippines was over 110%.
Combined broadband subscribers – DSL fixed and wireless – stood at 3.2 million. This accounted for approximately 64% of the broadband subscriber market in the Philippines. Wireless broadband subscribers amounted to 2.3 million of which 1.8 million were using the Smart network and the remaining were Sun subscribers.
Wireless service revenues up 2% to Pesos 57.7 billion (US$1.4 billion) from Pesos 56.7 billion (US$1.3 billion)
• reflecting continued growth of non-SMS data revenues• wireless broadband revenues, inclusive of mobile internet revenues, up 21%• a 2% increase in cellular voice revenues• partly offset by slightly lower cellular-SMS revenues
Wireless EBITDA down 1% to Pesos 28.1 billion (US$677.8 million) from Pesos 28.2 billion (US$660.1 million)
• due to higher handsets subsidies in line with efforts to increase smartphone ownership under postpaid plans to further seed growth of data revenues
• postpaid cellular revenues up 15%, accounting for 18% of total cellular revenues
EBITDA margin to 49% from 50% • resulting from lower EBITDA
The wireless business has been implementing various marketing programs to increase its revenues, including launching competitive offers aimed at stabilizing ARPUs, expanding the postpaid subscriber base and businesses, and promoting mobile internet usage. On the PLDT cellular networks, average smartphone penetration was 10% overall and 54% for the postpaid subscriber base. To enrich content offers, Smart Music has launched a three-year exclusive partnership agreement with MCA Music to offer more than 3 million tracks from MCA Music’s global content to PLDT cellular subscribers, at approximately half the price of other online music stores. In addition to audio services, smartphone or tablet users can watch real-time television broadcast feeds of CignalTV through Cignal’s TV-To-Go service.

Interim Report 2013 15
Review of Operations – PLDT
Fixed LineThe number of PLDT fixed line subscribers remained stable at 2.1 million, the same as at the end of December 2012.
PLDT continues to lead in fixed line as it has the largest share in each of the retail and corporate segments of the market.
Fixed line service revenue up 3% to Pesos 26.5 billion (US$639.2 million) from Pesos 25.8 billion (US$603.9 million)
• reflecting a 7% increase in DSL revenues and a 10% rise in third party corporate data revenues
• contributed from newly acquired data center, data center revenues up 86%• offset partly by lower revenues from national long distance, international long
distance and local exchange carrier services
Fixed line EBITDA up 15% to Pesos 11.4 billion (US$275.0 million) from Pesos 9.9 billion (US$231.7 million)
• growth in service revenues more than offset the rise in expenses
EBITDA margin to 37% from 34% • due to Pesos 1.7 billion (US$39.8 million) of manpower reduction program expenses booked in the first half of 2012
The fixed line network has been upgraded to an all-IP next generation network (“NGN”) to enable PLDT to offer improved voice, data, and other services with vastly expanded network capacity. In addition, PLDT has commenced roll out of fiber-to-the home (“Fibr”) which enables the delivery of high-speed broadband of up to 100 million bits per second (“mbps”). Approximately 45% of PLDT’s fixed line subscribers are DSL subscribers. PLDT recently announced the Philippine’s first triple play service that includes landline, Fibr, the fixed line network’s high-speed broadband service, and content from CignalTV.
MeralcoPLDT Communications and Energy Ventures, Inc., a 99.7%-owned subsidiary of Smart, owns 50% of Beacon Electric, a special purpose company jointly owned with MPIC. As of 27 August 2013, Beacon Electric owns approximately 49.96% of Meralco.
Meralco, the largest electricity distribution utility in the Philippines, has a franchise that allows it to distribute electricity in most of Luzon until 2028. The franchise area produces nearly half of the Philippines’ gross domestic product. Meralco accounts for over half of the total electricity sales in the Philippines. To help manage the high demand and cost of power, and in search of new sources of growth, Meralco is investing in power generation.
On 28 March 2013, First Pacific and Meralco’s wholly-owned subsidiary Meralco PowerGen acquired a 70% interest in PacificLight based in Singapore. PacificLight’s combined cycle combustion turbine power project consists of two 400- megawatt (“MW”) natural gas-fired turbines which are on track to begin commercial electricity production by early 2014.
Meralco’s performance in the first half of 2013 can be found in the MPIC section of this report.

First Pacifi c Company Limited16
Review of Operations – PLDT
2013 OutlookPLDT is on track to achieve its core income guidance of Pesos 38.3 billion. Improving economic conditions have increased consumers’ purchasing power, lifted retail and corporate demand for internet usage and content through both fixed and mobile networks. In addition, the competitive environment in the cellular space is now allowing both players to register growth. The acquisition of Digitel/Sun and substantial investments made in network capacity and new platforms are beginning to deliver synergies that would allow PLDT to expand its revenue sources by capitalizing on its network and content strengths. The combined impact of multi-media and the internet on the mainstream telecommunications business will help propel PLDT’s growth.
Reconciliation of Reported Results Between PLDT and First PacificPLDT’s operations are principally denominated in peso, which averaged Pesos 41.46 (1H12: Pesos 42.72) to the U.S. dollar. Its financial results are prepared under Philippine Generally Accepted Accounting (GAAP) and reported in peso. First Pacific’s financial results are prepared under Hong Kong GAAP and reported in U.S. dollars. Philippine GAAP and Hong Kong GAAP are largely based on International Financial Reporting Standards (IFRSs), however, certain adjustments need to be made to PLDT’s reported peso results to ensure full compliance with Hong Kong GAAP. An analysis of these adjustments follows.
For the six months ended 30 June 2013 2012Peso millions (Restated)(i) Net income under Philippine GAAP 19,707 19,282Preference dividends(ii) (31) (25) Net income attributable to common shareholders 19,676 19,257Differing accounting and presentational treatments(iii)
– Reclassification of non-recurring items (1,291) 93 – Others (2,301) (2,547)
Adjusted net income under Hong Kong GAAP 16,084 16,803Foreign exchange and derivative losses/(gains)(iv) 979 (935) PLDT’s net income as reported by First Pacific 17,063 15,868 US$ millions Net income at prevailing average rates for
1H13: Pesos 41.46 and 1H12: Pesos 42.72 411.6 371.4Contribution to First Pacific Group profit, at an average shareholding of
1H13: 25.6% and 1H12: 25.6% 105.2 95.0 (i) After adopting revised PAS 19 “Employee Benefits”, PLDT has restated its 1H12 net income to Pesos 19,282 million from Pesos 19,502 million.(ii) First Pacific presents net income after deduction of preference dividends.(iii) Differences in accounting treatment under Philippine GAAP, compared with Hong Kong GAAP, and other presentational differences. The principal
adjustments include:– Reclassification of non-recurring items: Certain items, through occurrence or size, are not considered usual operating items which are reallocated and
presented separately. Adjustment for 1H13 of Pesos 1,291 million mainly represents gain on disposal of BPO business of Pesos 2.0 billion, partly offset by manpower reduction costs of Pesos 0.8 billion. Adjustment for 1H12 of Pesos 93 million represents share of Meralco’s non-recurring losses.
– Others: The adjustments principally relate to the accrual of withholding tax on PLDT’s net income in accordance with the requirements of HKAS 12 “Income Taxes”, and the recognition of amortization for certain intangible assets identified as a result of the Group’s acquisition of an additional 2.7% interest in PLDT in November 2011.
(iv) To illustrate the underlying operational results and profit contributions, foreign exchange and derivative losses/gains (net of related tax) are excluded and presented separately.

Interim Report 2013 17
Review of Operations – MPIC
MPIC’s infrastructure portfolio as at 27 August 2013 comprises the following assets offering water distribution, electricity distribution, toll roads and hospital services:
• 52.8% in Maynilad• 50.0% in Beacon Electric which owns 49.96% of Meralco• 99.9% in MPTC which owns 67.1% of Manila North Tollways Corporation (“MNTC”), 46.0% of Tollways Management
Corporation (“TMC”) and 100% of Cavitex Infrastructure Corporation (“CIC”)• 33.4% in Medical Doctors, Inc.• 100% in Colinas Verdes Hospital Managers Corporation, the operator of Cardinal Santos Medical Center (“CSMC”)• 51.0% in Riverside Medical Center, Inc. (“RMCI”)• 34.9% in Davao Doctors Hospital, Inc. (“DDH”)• 100% in East Manila Hospital Managers Corporation, the operator of Our Lady of Lourdes Hospital (“OLLH”)• 85.6% in Asian Hospital, Inc. (“AHI”) which owns 100% of Asian Hospital and Medical Center• 51.0% in DLSMC
MPIC’s contribution to the Group rose 11% to US$53.0 million (1H12: US$47.7 million) in the period as a result of double-digit contribution increases from each of its businesses, an appreciation of the average peso exchange rate against the U.S. dollar, reduced somewhat by higher net interest expense and operating expenses at the MPIC head office level.
Consolidated core net income up 14% to Pesos 3.9 billion (US$95.1 million) from Pesos 3.5 billion (US$80.9 million)
•
•
Maynilad, Meralco, MPTC and Hospitals accounted for 44%, 30%, 20% and 6%, respectively, of MPIC consolidated profit contribution from operationsreflecting a 20% rise in contribution from Maynilad to Pesos 2.1 billion (US$50.2 million) on higher tariffs and billed water volume
• a 10% increase in contribution from Meralco to Pesos 1.4 billion (US$34.9 million) on higher average distribution rate, growth in energy sales and in preferred share dividends from Beacon Electric
• an 18% rise in contribution from MPTC to Pesos 931 million (US$22.5 million) on a higher traffic volumes and average kilometers travelled on NLEX, and consolidation of CAVITEX’s earnings
• a 27% rise in contribution from Hospitals to Pesos 262 million (US$6.3 million)• partly offset by a 62% increase in MPIC head office interest expense for funding
the acquisition of CAVITEX which was repaid in March 2013• a 24% increase in MPIC head office’s operating expenses, principally in respect of
personnel- and public relations-related expenses
Consolidated reported net incomeup 7% to Pesos 3.7 billion (US$89.0million) from Pesos 3.4 billion(US$80.6 million)
• due largely to higher core net income• partly offset by non-recurring charges of Pesos 252 million (US$6.1 million), mainly
representing debt refinancing costs at Maynilad, Beacon Electric and MPIC head office
Revenues up 12% to Pesos 15.3 billion (US$ 368.7 million) from Pesos 13.6 billion (US$318.8 million)
• referred to above

First Pacifi c Company Limited18
Review of Operations – MPIC
Equity PlacementIn January 2013, MPIC raised Pesos 6.1 billion (US$147.6 million) by placing 1.33 billion new shares at Pesos 4.6 (U.S. 11.1 cents) per share. The funds will be used for expansion of current investments and potential new projects, including CAVITEX, Cavite-Laguna (“CALA”) Expressway and Cebu-Mactan Airport. The expansion proposal for CAVITEX has been submitted to the Department of Public Works and Highways of the Philippines and the deadline for submitting the pre-qualification documents for CALA Expressway is 23 September 2013.
Debt ProfileAs at 30 June 2013, MPIC recorded a consolidated debt of Pesos 53.2 billion (US$1.2 billion), up 22% from Pesos 43.6 billion (US$1.1 billion) as at 31 December 2012.
Additional InvestmentsOn 15 March 2013, Maynilad acquired a 10% interest in Subic Water for a consideration of Pesos 211 million (US$5.1 million). Subic Water serves 40,000 customers in Olongapo City and the Subic Bay Freeport Zone.
On 28 March 2013, First Pacific and Meralco’s wholly-owned subsidiary Meralco PowerGen completed the acquisition of 70% of PacificLight, a company building a power plant located on Jurong Island, Singapore, for a total investment cost of approximately US$550 million. First Pacific holds 60% of the investment vehicle FPM Power and Meralco PowerGen owns the remaining 40%. PacificLight’s combined cycle combustion turbine power project consists of two 400 megawatt natural gas-fired turbines which are on track to begin commercial electricity production by early 2014. The remaining 30% of the project continues to be held by Petronas Power Sdn Bhd, a subsidiary of Malaysia’s state-owned oil and gas company.
On 3 June 2013, MPIC completed the acquisition of 51.0% interest in DLSMC in Quezon City, Metro Manila which has an authorized bed capacity of 150, for a consideration of Pesos 133 million (US$3.1 million).
On 24 June 2013, MPIC signed an investment agreement with CLDH in Tarlac City, which has bed capacity of 200.
In July 2013, MPIC’s 50% owned company Beacon Electric acquired additional 18.3 million shares of Meralco for a consideration of Pesos 5.1 billion (US$118.1 million). This increased Beacon Electric’s interest in Meralco to 49.96% from 48.3%.
Interim DividendThe MPIC board of Directors declared an interim cash dividend of Pesos 0.015 (U.S. 0.035 cent) per share, up 25% from Peso 0.012 (U.S. 0.028 cent) per share a year earlier. In addition, a cash dividend of 10% based on par value for Class A preferred shares or an amount of Pesos 2.5 million (US$0.06 million) was declared.
MayniladMaynilad operates a concession that runs until 2037 for water distribution and sewerage for the West Zone of Metro Manila, comprising a population of 9.7 million people in 12 cities and 5 municipalities as at 30 June 2013. During the period, Maynilad spent Pesos 3.9 billion (US$94.1 million) in capital expenditure on its water distribution system, of which Pesos 676 million (US$16.3 million) was used for improving and expanding its waste and sewerage water services. Maynilad’s system currently delivers 24-hour water supply to 95% of its customers while almost 100% of customers receive water pressure of at least seven pounds per square inch. Residential customers accounted for 80% of Maynilad customer base while the remaining 20% are commercial users.

Interim Report 2013 19
Review of Operations – MPIC
During the period, Maynilad drew 6% less water from the Angat Dam and achieved a 3% increase in the volume of water sold as a result of its substantial capital investment for improving the water system since it was acquired by MPIC in 2007.
Core net income up 23% to Pesos 4.1 billion (US$98.9 million) from Pesos 3.3 billion (US$77.2 million)
• owing largely to higher billed water volume and average effective tariff
Reported net income down 1% to Pesos 3.29 billion (US$79.4 million) from Pesos 3.33 billion (US$77.9 million)
• reflecting debt refinancing costs, despite higher core net income
Revenues up 11% to Pesos 8.5 billion (US$205.0 million) from Pesos 7.7 billion (US$180.2 million)
• reflecting a 7% rise in average effective tariff, a 3% increase in billed water volume and a 6% increase in billed customers
Average non-revenue water down to 40% from 45%
• reflecting lower leakage as a result of 22,560 leaks repaired, lower theft, continue pipe rehabilitation and more efficient management of water pressure and supply
• the above resulted in recovery of over 156 million liters of water per day
Total billed water volume up 3% to 219 million cubic meters from 212 million cubic meters
• reflecting a 6% rise in billed customers to 1,101,463 from 1,041,980
In September 2012, Maynilad submitted its revised business plan to the regulator for the water tariff in the next rate rebasing period. The review process failed to complete in July 2013 as expected. Maynilad is considering options for going forward, including arbitration proceedings.
Maynilad continues exploring investment opportunities in water distribution and sewerage management projects.
MeralcoDuring the period, the volume of electricity sold by Meralco rose 4% to 16,863 GWh with growth driven by a 5% increase in demand from the commercial sector, a 4% increase in residential demand and a 3% increase in demand from industrial customers.
Meralco’s average distribution charge increased by 10% to Pesos 1.66/kilowatt hour (“kWh”) from Pesos 1.50/kWh, while the average customer retail rate decreased 1% to Pesos 9.45/kWh, reflecting an 17% decrease in the transmission charge, a 3% fall in the generation charge and an 11% decline in the system loss charge, offset by a 10% increase in the distribution charge and a 12% increase in the taxes and universal charge. Generation, transmission and distribution charges accounted for 57%, 9% and 18%, respectively, of customers’ electricity bills, while the system loss charge accounted for 5% and the remaining 11% was the taxes and universal charge.
System loss fell to a new record low of 6.85% at end-June 2013 from 7.35% a year earlier, reflecting Meralco’s continuing refinement of its loss reduction programs and a steady decline in electricity theft. Meralco continues to invest in its electricity distribution system for a franchise area which produces over half of the Philippines’ gross domestic product.

First Pacifi c Company Limited20
Review of Operations – MPIC
Core net income up 2% to Pesos 9.2 billion (US$221.9 million) from Pesos 9.0 billion (US$210.7 million)
• reflecting the Pesos 1.6 billion (US$37.5 million) of local franchise tax recovery recorded in the first half of 2012, without the above recovery, growth would have been at 24%
Reported net income down 3% to Pesos 9.4 billion (US$226.7 million) from Pesos 9.8 billion (US$229.4 million)
• reflecting lack of the above recovery in the first half of 2013 and non-core income recorded in the first half of 2012
Revenues down 1% to Pesos 141.7 billion (US$3.4 billion) from Pesos 143.6 billion (US$3.4 billion)
• reflecting a bigger decline in pass-through revenues than the rise in distribution and other revenues
EBITDA margin stood at 11% • reflecting the increase in distribution charge compensating the lack of the above recovery
Meralco continues its efforts to reduce electricity costs, further improve operational efficiency and increase service reliability. During the period, its capital expenditure was Peso 3.7 billion (US$89.2 million).
As at 30 June 2013, Meralco’s consolidated gross debt remained stood at Pesos 25.4 billion (US$588.0 million) with maturity spread through 2022, 89% of which is peso-denominated long-term debt including current maturities, with an average interest rate at 5.4% for long-term peso debt and 3.9% for short-term peso loan. Its US$28 million short-term U.S. dollar-denominated loan bears an interest rate of 1.5%.
For prepaid electricity services, Meralco plans to enroll up to 2,000 households for commercial pilot testing by mid-September 2013, and targets a commercial launch in the first quarter of 2014.
Retail Competition and Open Access for electricity commenced on 26 June 2013 with MPower successfully signing over 60% of the initial registered contestable customers.
In power generation, Meralco is the controlling joint venture partner in Redondo Peninsula Energy, Inc. which is building two 300 MW coal-fired base load plants with operations commencing in 2017. Two liquefied natural gas (“LNG”) projects with capacity of 1,500 MW each are being evaluated.
MPTCMPTC, through its interests in MNTC, TMC and CIC operates the NLEX, the Subic Freeport Expressway, the SCTEX and CAVITEX. The concession for NLEX runs until 2037, for SCTEX until 2043 and for CAVITEX until 2033 for the original toll road and to 2046 for its extension.
With effect from 2 January 2013, MPTC expanded its toll road portfolio with an agreement to manage CAVITEX, which is a 14-kilometer toll road running from Parañaque to Cavite with daily traffic averaging more than 100,000 vehicles.
Core net income up 27% to Pesos 1.0 billion (US$24.1 million) from Pesos 810 million (US$19.0 million)
• reflecting strong traffic growth, lower operating costs on NLEX• inclusion of CAVITEX’s earnings• lower interest expenses and effective tax rate
Reported net income up 21% to Pesos 981 million (US$23.7 million) from Pesos 808 million (US$18.9 million)
• reflecting higher core net income• partly offset by non-core business development expenses
Revenues up 20% to Pesos4.1 billion (US$98.9 million) from Pesos 3.4 billion (US$79.6 million)
• reflecting a 5% rise in average daily vehicle entries to NLEX and longer travel journey• inclusion of CAVITEX’s revenue which reflects its 8% increase in average daily
vehicle entries
Core EBITDA up 23% to Pesos 2.8 billion (US$67.5 million) from Pesos 2.3 billion (US$53.8 million)
• due mainly to the inclusion of CAVITEX

Interim Report 2013 21
Review of Operations – MPIC
The construction of the 8-kilometer NLEX Harbour Link extension is on track and its first stage is expected to open in 2014. This extension will link NLEX to the North Manila Port area. MPTC is in discussion with the Philippine Government in relation to the construction of the NLEX Citilink project to extend NLEX eastward by 8 kilometers and add new entrance ramps.
MNTC, a subsidiary of MPTC, continues to coordinate with the Bases Conversion and Development Authority and the Philippine Government to complete the turnover of management of SCTEX. MPTC plans to invest Pesos 400 million (US$9.3 million) to integrate SCTEX with NLEX to facilitate seamless travel between the two expressways.
The discussion with the Philippine Government on building an elevated expressway that will connect the northern and southern toll road systems is ongoing. MPTC’s Connector Road Project, a four-lane elevated expressway, aims to connect the Harbour Link to Southern Luzon. MPTC expects the Connector Road to increase traffic on the existing northern and southern toll road systems by enabling commercial vehicles to traverse Metro Manila without violating the truck ban and slashing travel time between systems to no more than 20 minutes from over an hour today.
MPTC and MPIC plan to fund the estimated total of approximately Pesos 41 billion (US$949.1 million) for construction of NLEX Harbour Link, NLEX Citilink and the Connector Road projects and the expansion of CAVITEX over the next few years by internal resources and external borrowing.
HospitalsMPIC’s Hospital group, including CLDH, will comprise eight full-service hospitals and is the largest private provider of premier hospital services in the Philippines which delivers services including diagnostic, therapeutic and preventive medicine services through all three major island groupings in the country. This division comprises Makati Medical Center (“MMC”), CSMC, OLLH, Asian Hospital, DLSMC and CLDH in Metro Manila, as well as Riverside Medical Center in Bacolod City and Davao Doctors Hospital in Davao City, with approximately 2,150 beds.
Excluding CLDH, there were a total of 5,219 accredited medical doctors and consultants at the end of June 2013 and an average of 3,342 students for the period. Average bed occupancy rate was 73%.
In addition to the traditional hospital services, MPIC made its first investment in a non-hospital-based diagnostic center Megaclinic at SM Megamall in Metro Manila. Megaclinic is an affiliate of DLSMC.
Core net income up 29% to Pesos 397 million (US$ 9.6 million) from Pesos 307 million (US$7.2 million)
• reflecting higher revenues from patients• lower losses at nursing schools attached to the hospitals• lower operating expenses as a result of strict cost control
Reported net income up 31% to Pesos 402 million (US$9.7 million) from Pesos 306 million (US$7.2 million)
• reflecting higher core net income
Revenues up 10% to Pesos 5.9 billion (US$142.3 million) from Pesos 5.4 billion (US$126.4 million)
• reflecting a 15% rise in revenues from MMC, 11% from RMCI, 9% from CSMC and 8% from OLLH. The inclusion of DLSMC also contributed 1% of the revenues

First Pacifi c Company Limited22
Review of Operations – MPIC
The Hospital division is in the process of completing the acquisition of the CLDH by the second half of 2013. It continues to evaluate opportunities for expansion through investing in additional hospitals in strategic areas of the Philippines, aiming for a total of 3,000 beds across 15 hospitals.
This division continues to invest in improving infrastructure, equipment and facilities by leveraging its technical and professional expertise to expand services and enhance operational efficiency across its hospitals, and by extending its healthcare services through shopping mall-based diagnostic centers.
2013 OutlookOwing to economic growth and continuing cost controls, all of MPIC’s businesses are expected to continue strong earnings growth. Its core net income guidance for 2013 full year is Pesos 7 billion though uncertainties surrounding the Maynilad rate rebasing and pending tariff increases on NLEX and CAVITEX may impact this guidance.
For new infrastructure investment opportunities in the Philippines, MPIC submitted a conditional bid for Manila’s Light Rail Transit System Line 1 South Extension project and is in the process of finalizing documentation to bid for the redevelopment of the Cebu-Mactan Airport Project, and is qualified to bid for the Automated Fare Collection System Project to provide a unified ticketing system for the Metro Rail Transit System.
Reconciliation of Reported Results Between MPIC and First PacificMPIC’s operations are principally denominated in peso, which averaged Pesos 41.46 (1H12: Pesos 42.72) to the U.S. dollar. Its financial results are prepared under Philippine GAAP and reported in peso. First Pacific’s financial results are prepared under Hong Kong GAAP and reported in U.S. dollars. Philippine GAAP and Hong Kong GAAP are largely based on IFRSs, however, certain adjustments need to be made to MPIC’s reported peso results to ensure full compliance with Hong Kong GAAP. An analysis of these adjustments follows.
For the six months ended 30 June 2013 2012Peso millions Net income under Philippine GAAP 3,690 3,444Preference dividends(i) (3) (2) Net income attributable to common shareholders 3,687 3,442Differing accounting and presentational treatments(ii)
– Reclassification of non-recurring items 262 37– Others (3) (4)
Adjusted net income under Hong Kong GAAP 3,946 3,475Foreign exchange and derivative gains(iii) (10) (25) MPIC’s net income as reported by First Pacific 3,936 3,450 US$ millions Net income at prevailing average rates for
1H13: Pesos 41.46 and 1H12: Pesos 42.72 94.9 80.8Contribution to First Pacific Group profit, at an average shareholding of
1H13: 55.9% and 1H12: 59.0% 53.0 47.7 (i) First Pacific presents net income after deduction of preference dividends.(ii) Differences in accounting treatment under Philippine GAAP, compared with Hong Kong GAAP, and other presentational differences. The principal
adjustments include:– Reclassification of non-recurring items: Certain items, through occurrence or size, are not considered usual operating items which are reallocated and
presented separately. Adjustment for 1H13 of Pesos 262 million principally represents debt refinancing costs of MPIC parent company, Maynilad and Beacon Electric. Adjustment for 1H12 of Pesos 37 million principally represents write-off of certain project costs.
(iii) To illustrate the underlying operational results and profit contributions, foreign exchange and derivative gains (net of related tax) are excluded and presented separately.

Interim Report 2013 23
Review of Operations – Indofood
Indofood’s contribution to the Group was flat at US$90.5 million (1H12: US$90.4 million) principally reflecting higher core net income offset by a 6% depreciation of the average rupiah rate against the U.S. dollar. Core net income increased 6% in rupiah terms.
Core net income up 6% to Rupiah 1.8 trillion (US$181.9 million) from Rupiah 1.7 trillion (US$182.1 million)
• owing to higher contributions from the Consumer Branded Products (“CBP”), Bogasari and Distribution groups
• inclusion of earnings at CMFC• partly offset by weaker performance of the Agribusiness group owing to lower
prices for palm products and rubber as well as lower sales volumes at the Edible Oils & Fats (“EOF”) division
Net income up 1% to Rupiah 1.70 trillion (US$174.7 million) from Rupiah 1.68 trillion (US$183.0 million)
• due to higher core net income• partly offset by foreign exchange losses
Consolidated net sales up 9% to Rupiah 26.9 trillion (US$2.8 billion) from Rupiah 24.6 trillion (US$2.7 billion)
• reflecting higher sales contributed from the CBP, Bogasari and Distribution groups• partly offset by lower sales from Agribusiness• sales contribution from CBP, Bogasari, Agribusiness and Distribution amounted to
44.8%, 26.6%, 20.6% and 8.0% of the total, respectively
Gross profit margin to 24.0% from 27.4%
• due mainly to weaker performance of the Plantations division owing to lower prices for palm products and rubber as well as higher production costs
Consolidated operating expenses up 12% to Rupiah 3.5 trillion (US$359.0 million) from Rupiah 3.2 trillion (US$347.8 million)
• due mainly to increase in staffing to strengthen organization and expansion• higher spending on advertising and promotion• higher freight and handling expenses in conjunction with the increase in sales
volumes
EBIT margin to 10.9% from 14.5% • reflecting a lower gross profit margin and higher operating expenses as referred to above
Net gearing to 0.14 times from 0.06 times at the end of 2012
• an increase in net debt due to higher borrowings primarily for funding new investments

First Pacifi c Company Limited24
Review of Operations – Indofood
Debt ProfileAs at 30 June 2013, Indofood recorded gross debt of Rupiah 18.0 trillion (US$1.8 billion), up from Rupiah 15.3 trillion (US$1.6 billion) as at the end of December 2012. Of this total, Rupiah 10.4 trillion (US$1.0 billion) matures within one year. The remaining Rupiah 7.6 trillion (US$0.8 billion) matures between July 2014 and 2019.
Additional InvestmentsIn February 2013, Indofood acquired an aggregate of 29.3% interest in CMFC for a total consideration of approximately S$195.2 million (US$158.4 million). CMFC is a leading integrated vegetable processor in the People’s Republic of China with cultivation, processing and sales capabilities. It is listed in Singapore.
On 8 March 2013, SIMP and its subsidiary Lonsum invested a total of Rupiah 330 billion (US$34.0 million) for SIMP to acquire an effective interest of 79.7% in MPM. MPM is an investment company, through its subsidiary it engages in industrial forest plantations totaling 73,330 hectares in East Kalimantan Province.
On 25 June 2013, IndoAgri, completed the acquisition of a 50% interest in CMAA for a consideration of approximately Brazilian Real 143.4 million (US$66.6 million). CMAA is involved in the sugar, ethanol and co-generation industry in Brazil.
On 27 June 2013, ICBP through joint venture companies with Asahi Group Holdings Southeast Asia Pte. Ltd. signed a conditional share purchase agreement to acquire all outstanding shares of PCIB for a total consideration of US$30 million. PCIB is involved in the manufacturing, marketing and distribution of non-alcoholic drinks.
CBPThe CBP group comprises Noodles, Dairy, Snack Foods (including Biscuits), Food Seasonings and Nutrition & Special Foods.
Indofood’s Noodles division is one of the world’s largest producers of instant noodles. It has 15 production plants in Indonesia and one in Malaysia with a combined annual production capacity of around 16.4 billion packs per year. Indomie, Supermi, Sarimi, Sakura, Pop Mie, Pop Bihun and Mi Telur Cap 3 Ayam are popular Indofood brands.
PT Indolakto, the operating subsidiary in Dairy, is one of the largest dairy products manufacturers in Indonesia with the flagship brand Indomilk encompassing sweetened condensed milk, UHT milk, sterilized bottled milk, pasteurized liquid milk as well as powdered milk. Other brands include Indoeskrim for ice cream and Orchid for butter. Consumption per capita for dairy products in Indonesia remains low at around 12 liters per year while it is approximately 20 liters for ASEAN as a whole. Indolakto’s annual production capacity for all of its dairy products is 474 thousand tonnes.
The Snack Foods division maintained its leadership position through its leading brands Chitato and Lays (potato chips), and Qtela (cassava and soybean chips, as well as curly and prawn crackers). Biscuits are marketed under the brand names Trenz and Wonderland. Three factories have combined annual production capacity of 49 thousand tonnes.
The Food Seasonings division manufactures a wide range of culinary products, of which instant seasonings and chili sauce are the most popular. The division also produces soy sauce, tomato sauce and other condiments, with combined annual production capacity of 126 thousand tonnes. Its culinary products are marketed and sold through a 50-50 joint venture with Nestle SA.
The Nutrition & Special Foods division produces food for babies and children, and milk for expectant and lactating mothers under two brands; Promina caters to higher-income groups, while SUN is targeted to the mass-market segment. It has an annual production capacity of 24 thousand tonnes.

Interim Report 2013 25
Review of Operations – Indofood
Sales up 12% to Rupiah 12.1 trillion (US$1.2 billion) from Rupiah 10.8 trillion (US$1.2 billion)
• reflecting an increase in sales at all main divisions• mainly driven by volume growth and higher average selling prices
Sales volume • Noodles up 4% to 6.6 billion packs from 6.3 billion packs• Dairy up 18% to 178.1 thousand tonnes from 150.7 thousand tonnes• Snack Foods up 10% to 16.2 thousand tonnes from 14.7 thousand tonnes• Food Seasonings up 12% to 54.3 thousand tonnes from 48.4 thousand tonnes• Nutrition & Special Foods up 2% to 7.8 thousand tonnes from 7.7 thousand tonnes
EBIT margin to 12.9% from 13.8% • due mainly to higher advertising and promotion expenses• higher employee-related costs• higher freight and handling expenses in conjunction with the increase in sales
volumes
The CBP group is focusing on product innovation, expanding its product range and strengthening marketing initiatives. The new investment in non-alcoholic beverages with Asahi is expected to commence commercial production in 2014, with Tsukishima Foods Industry Co., Ltd. for oil and fat products will add new margarine products, whipped non-dairy filling creams, batter conditioners, and oil and fat derivative products for the bakery, confectionery and restaurant industries.
BogasariBogasari has been operating in Indonesia for more than four decades and has long been a member of the Indofood group, with flour mills located in Jakarta and Surabaya. Bogasari produces wheat flour as well as pasta for domestic and international markets. Its brands include Cakra Kembar, Segitiga Biru, Kunci Biru and Lencana Merah for wheat flour, and La Fonte for pasta. Bogasari also has its own maritime unit employing two Panamax and five Handymax vessels mainly to transport wheat from suppliers in Australia and the northern hemisphere. In addition, it operates a packaging factory that produces polypropylene bags.
Sales up 18% to Rupiah 9.0 trillion (US$927.4 million) from Rupiah 7.7 trillion (US$834.2 million)
• due mainly to higher sales volumes and higher average selling prices in conjunction with a rise in international wheat prices
Sales volume of food flour up 7% to 1,404 thousand tonnes from 1,307 thousand tonnes
• owing to higher demand from internal and external consumers
EBIT margin to 9.0% from 7.6%
The flour industry is expected to continue growing steadily in the years ahead as wheat consumption at around 27 kg per capita annually is still low in comparison with the global average of 95 kg per year. The growing popularity of modern fast-food franchises and associated lifestyle changes primarily within younger generations will accelerate urbanization and growth in the industry. However, competition remains strong with the continuing entry of new producers into the market.

First Pacifi c Company Limited26
Review of Operations – Indofood
AgribusinessThe Agribusiness group consists of two divisions: Plantations and EOF, which operate through Indofood’s 60.0%-owned Singapore-listed subsidiary IndoAgri and IndoAgri’s 72.1%-owned Indonesia-listed subsidiary SIMP, which in turn owns 59.5% of Indonesia-listed subsidiary Lonsum. The Agribusiness group is one of the leading players in Indonesia’s branded cooking oil segment, and is one of the lowest cost palm oil producers in the world.
The Agribusiness group is vertically integrated, producing a number of leading food products derived from palm oil. Its operations cover the entire value chain from research and development, oil palm seed breeding and oil palm cultivation to milling, refining, branding and marketing of cooking oil, margarine, shortening and other palm oil products. The group also operates rubber, sugar cane, cocoa and tea plantations.
PlantationsSIMP and Lonsum have a total planted area of 269,162 hectares. Oil palm is the dominant crop, with 33% of oil palms younger than seven years and an average age of approximately 13 years. Total planted area of oil palm was 233,002 hectares, up 1% from 230,919 hectares at the end of December 2012. Due to lower production in Sumatra and younger and less productive oil palm trees, production of fresh fruit bunch nucleuses declined 5% period-on-period combined with a decline in purchases of fresh fruit bunches from third parties. This decline resulted in an 11% fall in crude palm oil (“CPO”) production to 356 thousand tonnes. This division operates 21 palm oil mills with a total annual processing capacity of 5.2 million tonnes of fresh fruit bunches.
The division also operates 36,160 hectares planted with other crops including rubber, sugar cane, cocoa and tea. At the end of June 2013, the total planted area of rubber was 21,463 hectares, the planted area of sugar cane was 11,359 hectares and the planted area of remaining crops was 3,338 hectares. Due to a later start in the sugar harvest in 2013 than in 2012, sugar cane harvested fell 13% to 194 thousand tonnes and sugar production declined 27% to 15 thousand tonnes.
EOFThis division manufactures cooking oils and fats and markets products under various brands for both export and domestic consumption. Bimoli and Simas Palmia are leading cooking oil and margarine brands in Indonesia. The division also produces crude coconut oil and derivative products, most of which are exported to the United States, Europe and Asia. The division has refinery capacity of 1.4 million tonnes of CPO per annum as of 30 June 2013 and most of this division’s input needs are sourced from the plantation division’s CPO production.
Sales down 7% to Rupiah 6.4 trillion (US$658.9 million) from Rupiah 6.9 trillion (US$754.2 million)
• due mainly to the decline in average selling prices of main crops• average selling prices of CPO, palm kernel and rubber fell 17%, 29% and 20%,
respectively
EBIT margin to 4.8% from 19.2% • reflecting lower average selling prices and higher production costs
Sales volume • due to reduction in stock levels, CPO up 8% to 433 thousand tonnes from 402 thousand tonnes and sugar up 65% to 20 thousand tonnes from 12 thousand tonnes
• EOF down 6% to 397 thousand tonnes from 423 thousand tonnes due to lower coconut oil and bulk oil sales
The Indonesian economy continues to expand and has become one of the world’s largest consumers of palm oil. To support the large domestic demand for palm and consumer products, the Agribusiness group’s expansion focuses on new oil palm and sugar plantings. It is building new palm oil mills in South Sumatra and Kalimantan, expanding the capacity of two existing palm oil mills and increasing the utilization of facilities for transporting CPO to refineries to expand CPO production capacity and improve the supply chain infrastructure. It continues to promote its branded oil and fat products with new packaging launches and brand positioning. The investments in MPM and CMAA fit into Indofood group’s agriculture business model and diversify its crop portfolio.

Interim Report 2013 27
Review of Operations – Indofood
DistributionThe Distribution group is a major component of Indofood’s Total Food Solutions chain of operations as it has the most extensive distribution network of stock points in Indonesia for Indofood and third party products. Indofood increased its market penetration and service standard through its stock points which are located in areas with a high density of retail outlets, ensuring high product availability. To ensure product visibility and increase availability, the group engages merchandisers and canvassers, in conjunction with marketing efforts and promotions.
Sales up 15% to Rupiah 2.1 trillion (US$220.3 million) from Rupiah 1.9 trillion (US$202.1 million)
• partly reflecting stronger sales of the CBP group
EBIT margin to 3.6% from 4.0%
The Distribution group continues to leverage its distribution network to boost product penetration. Strong internal controls continue to ensure high cost efficiency. Its sales force continues to enhance communication with retail outlets to better understand and respond to customers’ needs while its team of merchandisers continues to ensure high product visibility in retail outlets.
2013 OutlookThe steady economic growth in Indonesia and strong domestic demand for processed foods are expected to continue over the medium term. The continuing facilities expansion across all divisions enables Indofood to meet growing demand for its products. The investment in CMFC, new investments in non-alcoholic beverages and the EOF businesses will widen Indofood’s product range and create new synergies and new markets and further diversify revenue sources.
Reconciliation of Reported Results Between Indofood and First PacificIndofood’s operations are principally denominated in rupiah, which averaged Rupiah 9,750 (1H12: Rupiah 9,202) to the U.S. dollar. Its financial results are prepared under Indonesian GAAP and reported in rupiah. First Pacific’s financial results are prepared under Hong Kong GAAP and reported in U.S. dollars. Accordingly, certain adjustments need to be made to Indofood’s reported rupiah results to ensure full compliance with Hong Kong GAAP. An analysis of these adjustments follows.
For the six months ended 30 June 2013 2012Rupiah billions Net income under Indonesian GAAP 1,703 1,684Differing accounting and presentational treatments(i)
– (Loss)/gain on changes in fair value of plantations (459) 2– Foreign exchange accounting 27 27– Others (39) (42)
Adjusted net income under Hong Kong GAAP 1,232 1,671Foreign exchange and derivative losses/(gains)(ii) 71 (7)Loss/(gain) on changes in fair value of plantations(ii) 459 (2) Indofood’s net income as reported by First Pacific 1,762 1,662 US$ millions Net income at prevailing average rates for
1H13: Rupiah 9,750 and 1H12: Rupiah 9,202 180.7 180.6Contribution to First Pacific Group profit, at an average shareholding of
1H13: 50.1% and 1H12: 50.1% 90.5 90.4 (i) Differences in accounting treatment under Indonesian GAAP, compared with Hong Kong GAAP, and other presentational differences. The principal
adjustments include:– Loss/gain on changes in fair value of plantations: Under Indonesian GAAP, Indofood measures its plantations (biological assets) on a historical cost
basis. HKAS 41 “Agriculture” requires the measurement of plantations at fair value less costs to sell. The adjustment relates to the change in fair value of plantations during the period.
– Foreign exchange accounting: The adjustment relates to the reversal of the amortization of foreign exchange losses that were previously capitalized by Indofood on certain fixed assets under construction, as the originating capitalized foreign exchange losses have already been written off by First Pacific.
– Others: The adjustments principally relate to the accrual of withholding tax on Indofood’s net income in accordance with the requirements of HKAS 12 “Income Taxes” and reversal of amortization of plantations. Under Indonesian GAAP, Indofood amortizes plantations over their estimated useful lives. HKAS 41 “Agriculture” requires the measurement of plantations at fair value less costs to sell.
(ii) To illustrate the underlying operational results and profit contributions, foreign exchange and derivative losses/gains (net of related tax) and loss/gain on changes in fair value of plantations are excluded and presented separately.

First Pacifi c Company Limited28
Review of Operations – Philex
Philex’s natural resources portfolio comprises:
Philex for metal-related assets• 100% in Philex Gold Philippines, Inc.• 100% in Silangan Mindanao Mining Co., Inc.
Philex Petroleum* for energy-related assets• 50.3% in Pitkin which owns oil and gas exploration assets in Peru and the Philippines• 48.8%** in Forum Energy Plc (“Forum”) which owns 70.0% of Service Contract 72 and a 2.3% interest in the oil
producing Galoc field, both of these assets are located in the West Philippine Sea
* 11.4% directly held by First Pacific, 5.4% held by Two Rivers Pacific Holdings Corporation (a Philippine affiliate of First Pacific) and 64.8% held by Philex Mining Corporation
** 3.3% directly held by First Pacific, 36.4% is held directly by Philex Petroleum and 24.1% is held by its 51.2%-owned Canadian subsidiary FEC Resources Inc.
Philex’s first half contribution to the Group decreased 80.1% to US$3.2 million (1H12: US$16.1 million) principally due to mining operations not commencing until 8 March 2013 resulting in lower volumes of metals sold, significantly lower realized metal prices and a net loss of Pesos 162 million (US$3.9 million) at Philex Petroleum.
Philex paid Pesos 1 billion (approximately US$25 million) of tailings fee that was accrued in 2012. During the period, it received US$25 million in insurance claims settlement related to the tailings discharge.
During the period, Philex completed the clean up of Balog Creek in Itogon, Benguet which was affected by the discharge mentioned above. Philex is currently waiting for regulatory permits to clean up the convergence area of the Balog Creek and affected area of Agno River.
In addition to the continuous use of Tailings Storage Facility No. 3 (“TSF3”), Philex has completed the construction of two of the three planned drainage chutes of a new open spillway for managing water draining into TSF3, over 90% of which comes from the surrounding hillsides with the remainder from the mine.
Total ore milled declined to 3.0 million tonnes (1H12: 4.7 million tonnes) owing to fewer days of operation, with an average grade of 0.523 grams (1H12: 0.500 grams) of gold per tonne of ore and 0.249% (1H12: 0.221%) copper. The contribution from the higher metal grade was offset by the shortened production period of less than four months (1H12: six months), resulting in a 28% decline in concentrate production to 23,867 dry metric tons (1H12: 33,233 dry metric tons). Gold production fell 30% to 40,845 ounces (1H12: 58,681 ounces) and copper production declined 25% to 13.7 million pounds (1H12: 18.3 million pounds).
During the period in operation, the average realized price for gold fell 19% to US$1,313 per ounce (1H12: US$1,618 per ounce) and the average realized copper price was down 23% to US$3.13 per pound (1H12: US$4.05 per pound).
Philex has drawn down a total loan of approximately US$128.6 million from a facility of up to approximately US$200 million provided by First Pacific, of which US$104.4 million was drawn during the period. The funds were used for the development of the Silangan Project and the rehabilitation of areas impacted by the tailings discharge at the Padcal mine.
As at 30 June 2013, Philex had Pesos 4.2 billion (US$98.3 million) of cash and cash equivalents, and Pesos 6.5 billion (US$150.4 million) of borrowings comprising loans from First Pacific and banks.

Interim Report 2013 29
Review of Operations – Philex
Core net income down 61% to Pesos 818 million (US$19.7 million) from Pesos 2.1 billion (US$49.4 million)
• due primarily to lower production volumes as there were less than four months of operation at the Padcal mine in the period
• significantly lower realized metal prices
Net income down 49% to Pesos 1.1 billion (US$25.9 million) from Pesos 2.1 billion (US$48.9 million)
• reflecting lower core net income• partly offset by a non-recurring gain from an insurance settlement under its
Pollution Legal Liability Insurance Policy, 60% of which gain relating to business interruption caused by the suspension of operations at the Padcal mine was reflected as core net income
Operating revenue down 44% to Pesos 4.2 billion (US$101.3 million) from Pesos 7.5 billion (US$175.6 million)
• reflecting production of gold down 30% and of copper down 25% due to the shorter period of operation of the Padcal mine
• significantly lower realized metal prices slightly eased by higher grades of ore
EBITDA down 36% to Pesos 2.2 billion (US$53.1 million) from Pesos 3.4 billion (US$79.6 million)
• due to lower operating revenues• maintenance costs of Pesos 440 million (US$10.6 million) at the Padcal mine as
a result of the cost of labor retention during the period of suspension of mine operations
Operating costs and expenses down 32% to Pesos 3.0 billion (US$72.4 million) from Pesos 4.4 billion (US$103.0 million)
• due to lower volumes of ore milled reflecting operation of less than four months
Operating cost per tonne of ore milled down 6% to Pesos 749 (US$18.1) from Pesos 795 (US$18.6)
• reflecting lower production volume
Capital expenditure (including exploration costs) up 41% to Pesos 2.1 billion (US$50.7 million) from Pesos 1.5 billion (US$35.1 million)
• reflecting exploration expenditure for the Silangan Project and capital expenditure for the Padcal mine

First Pacifi c Company Limited30
Review of Operations – Philex
DividendGiven the suspension of operation at Padcal mine, the board of directors of Philex did not declare an interim dividend in respect of the first half of 2013 (1H12: Pesos 0.11 (US$0.003) per share).
Additional Investment/Asset DisposalOn 5 April 2013, Philex Petroleum increased its interest in Pitkin to 50.3% from 18.5% by acquiring new and existing shares for a total consideration of approximately US$34.8 million.
On 16 July 2013, Pitkin sold its entire interest in Vietnam American Exploration Company LLC for a total cash consideration of approximately Pesos 2.1 billion (US$48.6 million) and realized a gain of approximately Pesos 200 million (US$4.6 million).
Silangan ProjectThe gold and copper mine development project is located in Surigao del Norte, Northern Mindanao in the Philippines, and comprises the Boyongan and Bayugo deposits. A portion of the Bayugo deposits are located on what is known as the Kalayaan property which is subject to a joint venture agreement with Manila Mining Corporation.
It is currently estimated that the bankable definitive feasibility study for the Kalayaan property and the Bayugo deposit will be completed by the end of 2014. After this milestone the capital expenditure required to put the Silangan project into production are estimated to be in excess of US$1.2 billion and most of which will be incurred between 2015 and 2017.
Mineral Resources and Proved Reserves Listed below are the most recently reported mineral resources and proved reserves of the Padcal mine and Silangan Project:
Silangan Project (as at 5 August 2011)
Padcal mine(As at 31 December 2012*) Boyongan Bayugo
Resources(million tonnes) 184(i) 273(i) 125(i)
Gold (gram/tonne) 0.49 0.72 0.66Copper (%/tonne) 0.24 0.52 0.66
Contained copper (thousand lbs) 975,999 3,120,000 1,820,000Contained gold (ounces) 2,930,000 6,300,000 2,700,000Copper equivalent(ii) cutoff (%) 0.317 – –Copper equivalent cutoff (%) – 0.50 0.50 Proved reserves (million tonnes) 73.5
Gold (gram/tonne) 0.43Copper (%/tonne) 0.21
Recoverable copper (thousand lbs) 275,300Recoverable gold (ounces) 737,000Copper equivalent(ii) cutoff (%) 0.317 * Based on the Competent Person’s report issued in April 2013(i) Measured and indicated(ii) Copper equivalent = % copper + 0.317 x gram/tonne gold; Metal prices: US$3.00/lb copper, US$1,500/oz gold; Metal recoveries: 82% copper, 72% gold

Interim Report 2013 31
Review of Operations – Philex
Service Contract 72 (“SC72”)In April 2012, Forum received a Competent Person’s report which interrupted the 2D and 3D seismic data obtained in 2011. The report produced a best estimate of 2.6 trillion cubic feet of gas-in-place and 65 million barrels of oil-in-place classified as Contingent Resources, and 8.8 trillion cubic feet of gas-in-place and 220 million barrels of oil-in-place classified as Prospective Resources.
The property covered by SC72 is located in the West Philippine Sea in an area where the Philippine and Chinese governments both claim sovereignty. Given this geopolitical dispute is ongoing, in January 2013, the Department of Energy granted a two-year extension to August 2015 to allow the completion of a two well drilling program with an estimated total cost of US$75 million. At present it is uncertain when the dispute between the governments of the Philippines and China will be resolved.
2013 OutlookManagement continue to work on obtaining consents to allow operations at the Padcal mine to continue on a permanent basis. Work on the Silangan project, including the Kalayaan joint venture, continues. Depending on market conditions, Philex hopes to complete its planned rights issue in the second half of 2013.
Reconciliation of Reported Results Between Philex and First PacificPhilex’s operations are principally denominated in peso, which averaged Pesos 41.46 (1H12: Pesos 42.72) to the U.S. dollar. Its financial results are prepared under Philippine GAAP and reported in peso. First Pacific’s financial results are prepared under Hong Kong GAAP and reported in U.S. dollars. Philippine GAAP and Hong Kong GAAP are largely based on IFRSs, however, certain adjustments need to be made to Philex’s reported peso results to ensure full compliance with Hong Kong GAAP. An analysis of these adjustments follows.
For the six months ended 30 June 2013 2012Peso millions Net income under Philippine GAAP 1,075 2,089Differing accounting and presentational treatments(i)
– Reclassification of non-recurring items (293) –– Revenue recognition regarding sale of mine products (239) (196)– Depreciation of revaluation increment of assets (136) (190)– Others (156) (235)
Adjusted net income under Hong Kong GAAP 251 1,468Foreign exchange and derivative losses(ii) 36 20 Philex’s net income as reported by First Pacific 287 1,488 US$ millions Net income at prevailing average rates for
1H13: Pesos 41.46 and 1H12: Pesos 42.72 6.9 34.8Contribution to First Pacific Group profit, at an average shareholding of
1H13: 46.2% and 1H12: 46.3% 3.2 16.1 (i) Differences in accounting treatments under Philippine GAAP, compared with Hong Kong GAAP, and other presentational differences. The principal
adjustments include:– Reclassification of non-recurring items: Certain items, through occurrence or size are not considered usual operating items which are reallocated and
presented separately. Adjustment for 1H13 of Pesos 293 million principally represents a gain on insurance settlement of Pesos 285 million in respect of clean-up costs and damages in respect of the accidental discharge of water and tailings from its tailing pond No. 3 in August 2012.
– Revenue recognition regarding sale of mine products: Philex recognizes revenue based on the production of mine products. HKAS 18 “Revenue” requires the recognition of revenue based on the satisfaction of certain conditions, which includes the transfer of significant risks and rewards of ownership of the products to the buyers and the absence of continuing managerial involvement to the degree usually associated with ownership and effective control over the products sold.
– Depreciation of revaluation increment of assets: A fair value assessment was performed at the date of acquisition of Philex and certain revaluation increment adjustments have been made to property, plant and equipment. The adjustment relates to the recognition of additional depreciation based on the revalued fair value of property, plant and equipment.
– Others: The adjustments principally relate to the adjustments for the Group’s direct share of Philex Petroleum’s results and accrual of withholding tax on Philex’s net income in accordance with the requirements of HKAS 12 “Income Taxes”.
(ii) To illustrate the underlying operational results and profit contributions, foreign exchange and derivative losses (net of related tax) are excluded and presented separately.

Financial Review
First Pacifi c Company Limited32
Liquidity and Financial ResourcesNet Debt and Gearing(A) Head Office Net Debt
The increase in net debt principally reflects investment financings to FPM Power, with respect to US$330 million investment in PacificLight, and loans of US$104.4 million to Philex. The Head Office’s borrowings at 30 June 2013 comprise bonds of US$1,482.7 million (with an aggregated face value of US$1,500 million) which are due for redemption between 2017 and 2023, and bank loans of US$249.6 million (with an aggregated face value of US$250 million) which are due for repayment in 2016 and 2018.
Changes in Head Office Net Debt
US$ millions Borrowings
Cashand cash
equivalentsNet
debt At 1 January 2013 1,717.9 (584.1) 1,133.8Movement 14.4 428.8 443.2 At 30 June 2013 1,732.3 (155.3) 1,577.0
Head Office Cash Flow
For the six months ended 30 June 2013 2012US$ millions Dividend and fee income 153.4 161.6Head Office overhead expense (12.5) (10.4)Net cash interest expense (38.6) (32.2)Taxes (0.2) (0.3) Net cash inflow from operating activities 102.1 118.7Net investments(i) (363.9) (5.8)Loans to Philex (104.4) –Financing activities
– Proceeds from the issue of unsecured bonds, net 395.1 395.9– Proceeds from the issue of shares upon the exercise of share options 9.1 8.3– Net loan (repayments)/borrowings (393.7) 46.2– Dividends paid (64.2) (64.2)– Repurchase of shares (8.9) (39.4)
(Decrease)/Increase in Cash and Cash Equivalents (428.8) 459.7Cash and cash equivalents at 1 January 584.1 102.5 Cash and Cash Equivalents at 30 June 155.3 562.2 (i) Includes US$330 million investment financings to FPM Power

Interim Report 2013 33
Financial Review
(B) Group Net Debt and GearingAn analysis of net debt and gearing for principal consolidated and associated companies follows.
Consolidated
At 30 June 2013 At 31 December 2012
US$ millionsNet
debt(i)
Totalequity
Gearing(times)
Netdebt(i)
Totalequity
Gearing(times)
(Restated) (Restated) Head Office 1,577.0 1,665.9 0.95x 1,133.8 1,693.1 0.67xMPIC 920.3 2,502.6 0.37x 807.2 2,290.9 0.35xIndofood 475.2 3,800.9 0.13x 204.8 4,005.7 0.05xFPM Power 369.2 287.1 1.29x – – –Group adjustments(ii) – (862.7) – – (739.0) – Total 3,341.7 7,393.8 0.45x 2,145.8 7,250.7 0.30x
Associated
At 30 June 2013 At 31 December 2012
US$ millionsNet
debtTotal
equityGearing(times)
Net debt/(cash)
Totalequity
Gearing(times)
(Restated) (Restated) PLDT 1,800.4 3,328.4 0.54x 1,915.9 3,550.2 0.54xPhilex 52.1 593.8 0.09x (5.3) 538.2 – (i) Includes pledged deposits and restricted cash(ii) Group adjustments mainly represents elimination of goodwill arising from acquisitions prior
to 1 January 2001 against the Group’s retained earnings and other standard consolidation adjustments to present the Group as a single economic entity.
Head Office’s gearing increased principally because of its investment financings to FPM Power and loans to Philex. MPIC’s gearing increased principally because of an increase in net debt which reflects its consolidation of CIC and payments for capital expenditure, partly offset by a growth of its equity as a result of a share placement, sell down of interest in Maynilad and its profit recorded for the period. Indofood’s gearing increased principally because of an increase in net debt which reflects its payments for capital expenditure, investments in CMFC, CMAA and MPM, partly offset by its operating cash inflow. FPM Power had a net debt principally reflecting PacificLight’s bank borrowings for financing its construction of power plant. PLDT’s gearing remained flat, which principally reflects a reduction in net debt as a result of its strong operating cash inflow and reduced equity because of dividends paid. Philex changed from a net cash position to a net debt position principally because of a reduction in its operating cash flow as a result of its suspension of the Padcal mine’s operations from 1 August 2012 to 7 March 2013 following an accidental discharge of water and tailings from its TSF3 in August 2012 and its payments for capital expenditure and additional investment in Pitkin.
The Group’s gearing increased to 0.45 times level principally as a result of the higher net debt level reflecting the acquisition and consolidation of PacificLight and CIC, MPIC’s and Indofood’s payments for investments and capital expenditure, partly offset by a growth of its equity.
3.5
3.0
2.5
2.0
1.5
1.0
0.5
0
0.5
0.4
0.3
0.2
0.1
0
Dec 12 Jun 13
Net Debt and GearingNet debtUS$ billions
Gearing(times)
Gearing (times)
Net debt30 June 201331 December 2012

First Pacifi c Company Limited34
Financial Review
Maturity ProfileThe maturity profile of debt of consolidated and associated companies follows.
Consolidated
Carrying amounts Nominal values
US$ millions
At30 June
2013
At31 December
2012
At30 June
2013
At31 December
2012 Within one year 1,137.1 926.5 1,141.2 926.6One to two years 231.2 501.2 230.7 504.0Two to five years 1,650.3 1,536.6 1,647.1 1,552.2Over five years 2,216.0 1,400.7 2,225.6 1,408.5 Total 5,234.6 4,365.0 5,244.6 4,391.3
The change in the Group’s debt maturity profile from 31 December 2012 to 30 June 2013 principally reflects (i) MPIC’s consolidation of CIC, repayments and refinancing of short-term borrowings with long-term borrowings; (ii) Indofood’s reclassification between long-term borrowings and short-term borrowings and (iii) Head Office’s refinancing of US$650 million of short-term and long-term secured borrowings with US$400 million of ten-year unsecured bonds issued in April 2013 and US$250 million of unsecured long-term borrowings drawn in June 2013.
Associated PLDT Philex
Carrying amounts Nominal values Carrying amounts Nominal values
US$ millions
At 30June2013
At 31December
2012
At 30June2013
At 31December
2012
At 30June2013
At 31December
2012
At 30June2013
At 31December
2012 Within one year 709.2 316.4 711.2 318.4 149.8 35.3 149.8 35.3One to two years 185.7 471.4 202.6 498.5 0.6 – 0.6 –Two to five years 1,130.5 1,268.4 1,132.2 1,271.1 – – – –Over five years 704.0 765.0 704.3 765.4 – – – – Total 2,729.4 2,821.2 2,750.3 2,853.4 150.4 35.3 150.4 35.3
The change in PLDT’s debt maturity profile from 31 December 2012 to 30 June 2013 principally reflects loan repayments and new borrowings arranged to finance capital expenditure and/or refinance its loan obligations which were utilized for service improvements and expansion programs. The increase in Philex’s debt principally reflects additional loans borrowed from Head Office.
Charges on Group AssetsAt 30 June 2013, certain bank and other borrowings were secured by the Group’s property, plant and equipment, plantations, available-for-sale assets, accounts receivable, pledged deposits, cash and cash equivalents and inventories equating to a net book value of US$1,145.3 million (31 December 2012: US$1,120.8 million), receipts from future toll collections and funds in the related accounts of CIC and the Group’s interests of 6.9% (31 December 2012: 16.4%) in PLDT, 43.0% (31 December 2012: 45.5%) in MPIC, 100% (31 December 2012: Nil) in CIC, nil (31 December 2012: 14.6%) in Philex, nil (31 December 2012: 46.8%) in Maynilad and nil (31 December 2012: 99.8%) in MPTC.
22%
4%
32%
42%
Maturity Profile ofConsolidated Debt
30 June 2013
Within one yearOne to two yearsTwo to five yearsOver five years
1,137.1231.2
US$ millions
1,650.32,216.0
Total 5,234.6
21%
12%
35%
32%
Maturity Profile ofConsolidated Debt31 December 2012
Within one yearOne to two yearsTwo to five yearsOver five years
926.5501.2
US$ millions
1,536.61,400.7
Total 4,365.0

Interim Report 2013 35
Financial Review
Financial Risk ManagementForeign Currency Risk(A) Company Risk
As the Head Office debts are currently denominated in U.S. dollars, foreign currency risk relates mainly to the receipt of cash dividends and to the translation of non-U.S. dollar denominated investments in subsidiary and associated companies.
The Company actively reviews the potential benefits of hedging based on forecast dividend flows and enters into hedging arrangements (including the use of forward exchange contracts) for managing its foreign currency exposure in respect of dividend income and payments in foreign currency on a transactional basis. However, the Company does not actively seek to hedge risks arising on the translation of foreign currency denominated investments due to (i) the non-cash nature of such exposure until the values of the investments are realized and (ii) the high costs associated with such hedging. Accordingly, the Company is exposed to the impact of foreign currency fluctuations on the translated U.S. dollar value of its foreign currency denominated investments.
With the exception of the Head Office, the principal components of the Group’s NAV relate to investments denominated in the peso and the rupiah. Accordingly, any change in these currencies, against their respective 30 June 2013 exchange rates, would have an effect on the Group’s NAV in U.S. dollar terms.
The following table illustrates the estimated effect on the Group’s adjusted NAV for a one per cent change of the peso and rupiah exchange rates against the U.S. dollar.
Effect onadjusted NAV
Effect onadjusted NAV
per shareCompany Basis US$ millions HK cents PLDT (i) 37.6 7.63MPIC (i) 17.8 3.60Indofood (i) 32.5 6.61Philex (i) 5.3 1.07Philex Petroleum (i) 0.7 0.14FPM Power (ii) 3.3 0.67Head Office – Other assets (iii) 1.3 0.26Total 98.5 19.98
(i) Based on quoted share prices as at 30 June 2013 applied to the Group’s economic interest(ii) Based on investment cost in FPM Power(iii) Based on loans receivable from Philex
(B) Group RiskThe results of the Group’s operating units are denominated in local currencies, principally the peso, the rupiah and the Singapore dollar, which are translated and consolidated to give the Group’s results in U.S. dollars.
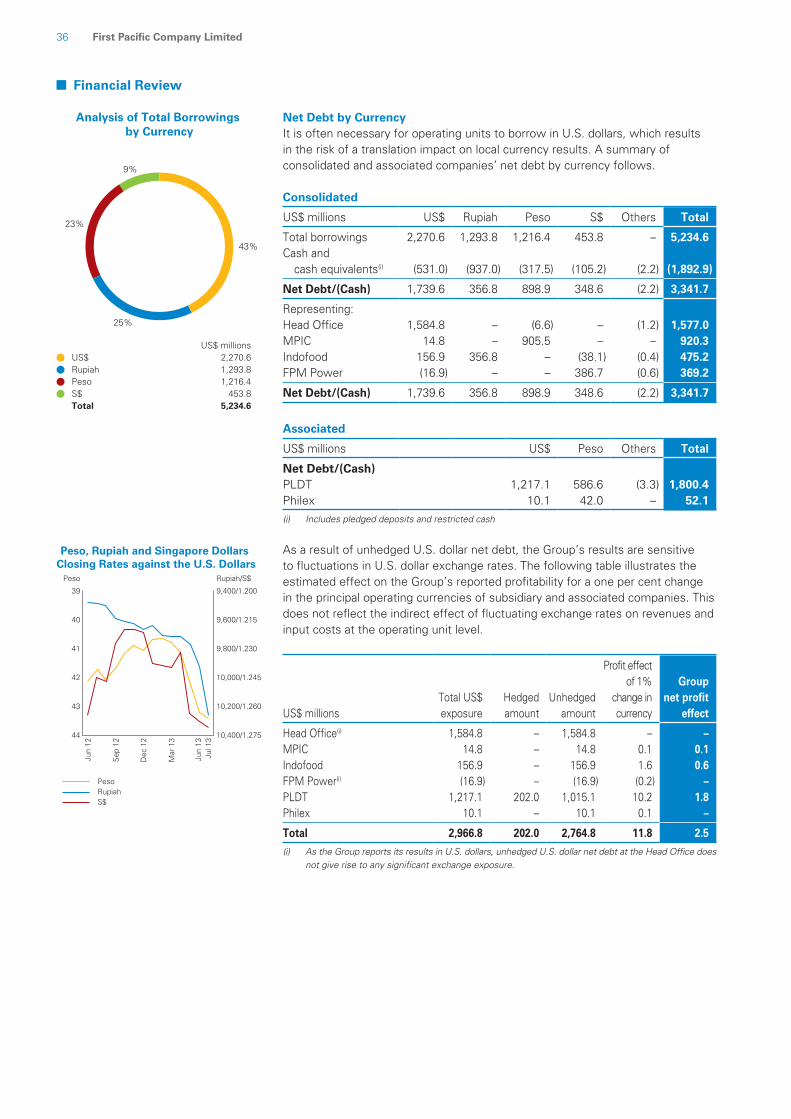
First Pacifi c Company Limited36
Financial Review
Net Debt by CurrencyIt is often necessary for operating units to borrow in U.S. dollars, which results in the risk of a translation impact on local currency results. A summary of consolidated and associated companies’ net debt by currency follows.
Consolidated US$ millions US$ Rupiah Peso S$ Others Total Total borrowings 2,270.6 1,293.8 1,216.4 453.8 – 5,234.6Cash and
cash equivalents(i) (531.0) (937.0) (317.5) (105.2) (2.2) (1,892.9) Net Debt/(Cash) 1,739.6 356.8 898.9 348.6 (2.2) 3,341.7 Representing:Head Office 1,584.8 – (6.6) – (1.2) 1,577.0MPIC 14.8 – 905.5 – – 920.3Indofood 156.9 356.8 – (38.1) (0.4) 475.2FPM Power (16.9) – – 386.7 (0.6) 369.2 Net Debt/(Cash) 1,739.6 356.8 898.9 348.6 (2.2) 3,341.7
Associated US$ millions US$ Peso Others Total Net Debt/(Cash)PLDT 1,217.1 586.6 (3.3) 1,800.4Philex 10.1 42.0 – 52.1 (i) Includes pledged deposits and restricted cash
As a result of unhedged U.S. dollar net debt, the Group’s results are sensitive to fluctuations in U.S. dollar exchange rates. The following table illustrates the estimated effect on the Group’s reported profitability for a one per cent change in the principal operating currencies of subsidiary and associated companies. This does not reflect the indirect effect of fluctuating exchange rates on revenues and input costs at the operating unit level.
US$ millionsTotal US$exposure
Hedgedamount
Unhedgedamount
Profit effectof 1%
change incurrency
Groupnet profit
effect Head Office(i) 1,584.8 – 1,584.8 – –MPIC 14.8 – 14.8 0.1 0.1Indofood 156.9 – 156.9 1.6 0.6FPM Power(i) (16.9) – (16.9) (0.2) –PLDT 1,217.1 202.0 1,015.1 10.2 1.8Philex 10.1 – 10.1 0.1 – Total 2,966.8 202.0 2,764.8 11.8 2.5 (i) As the Group reports its results in U.S. dollars, unhedged U.S. dollar net debt at the Head Office does
not give rise to any significant exchange exposure.
43%
25%
23%
9%
Analysis of Total Borrowings by Currency
US$RupiahPesoS$
2,270.61,293.8
US$ millions
1,216.4453.8
Total 5,234.6
39
40
41
42
43
44
9,400/1.200
9,600/1.215
9,800/1.230
10,000/1.245
10,200/1.260
10,400/1.275
Jun
12
Jul 1
3Ju
n 13
Mar
13
Dec
12
Sep
12
Peso, Rupiah and Singapore Dollars Closing Rates against the U.S. Dollars
Peso Rupiah/S$
PesoRupiahS$

Interim Report 2013 37
Financial Review
Equity Market RiskAs the majority of the Company’s investments are listed, the Company is exposed to fluctuations in the equity market values of such investments. In addition, the value of the Company’s investments may be impacted by sentiment towards specific countries.
First Pacific’s listed investments are located in the Philippines, Indonesia and Singapore. Accordingly, in addition to operating factors within the Company’s control, the Company also has an equity market risk in respect of general investor sentiment towards these countries. Changes in the stock market indices of the Philippines, Indonesia and Singapore are summarized as follows.
Philippine
CompositeIndex
JakartaComposite
Index
SingaporeStraits Times
Index At 31 December 2012 5,813 4,317 3,167At 30 June 2013 6,465 4,819 3,150
Change during the first half of 2013 +11.2% +11.6% -0.5%
Interest Rate RiskThe Company and its operating units are exposed to changes in interest rates to the extent that they impact the cost of variable interest rate borrowings. An analysis of this for consolidated and associated companies follows.
Consolidated
US$ millions
Fixedinterest rateborrowings
Variable interest rateborrowings
Cash andcash
equivalents(i)
Netdebt
Head Office 1,482.7 249.6 (155.3) 1,577.0MPIC 905.5 326.1 (311.3) 920.3Indofood 435.8 1,381.2 (1,341.8) 475.2FPM Power(ii) 429.5 24.2 (84.5) 369.2 Total 3,253.5 1,981.1 (1,892.9) 3,341.7
Associated
US$ millions
Fixedinterest rateborrowings
Variable interest rateborrowings
Cash andcash
equivalentsNet
debt PLDT 1,854.4 875.0 (929.0) 1,800.4Philex 33.6 116.8 (98.3) 52.1 (i) Includes pledged deposits and restricted cash(ii) At 30 June 2013, PacificLight, a subsidiary company of FPM Power, had interest rate swap
agreements which effectively changed US$429.5 million of its bank loans from Singapore Swap Offer Rate (SOR)-based variable interest rate to fixed interest rate.
8,000
7,000
6,000
5,000
4,000
3,000
2,000
Dec
12
Mar
13
Jun
13
Jul 1
3
Stock Market IndicesPCI/JCI/SSTI
Philippine Composite Index (PCI) Jakarta Composite Index (JCI) Singapore Straits Times Index (SSTI)
62%
38%
Interest Rate Profile
FixedVariableTotal
3,253.51,981.1
US$ millions
5,234.6

First Pacifi c Company Limited38
Financial Review
The following table illustrates the estimated effect on the Group’s reported profitability for a one per cent change in average annual interest rates in respect of the variable interest rate borrowings.
US$ millions
Variable interest rate borrowings
Profit effect of1% change ininterest rates
Groupnet profit
effect Head Office 249.6 2.5 2.5MPIC 326.1 3.3 1.3Indofood 1,381.2 13.8 5.2FPM Power 24.2 0.2 0.1PLDT 875.0 8.7 1.6Philex 116.8 1.2 0.4 Total 2,972.9 29.7 11.1
Adjusted NAV Per ShareThere follows a calculation of the Group’s underlying worth.
US$ millions Basis
At30 June
2013
At31 December
2012 PLDT (i) 3,759.7 3,404.8MPIC (i) 1,775.0 1,574.4Indofood (i) 3,254.2 2,659.5Philex (i) 525.5 832.6Philex Petroleum (i) 69.3 208.1FPM Power (ii) 330.0 -Head Office – Other assets (iii) 128.6 26.8 – Net debt (1,577.0) (1,133.8) Total Valuation 8,265.3 7,572.4 Number of Ordinary Shares in Issue (millions) 3,841.6 3,827.6 Value per share – U.S. dollar 2.15 1.98 – HK dollars 16.78 15.43Company’s closing share price (HK$) 8.31 8.51Share price discount to HK$ value per share (%) 50.5 44.8 (i) Based on quoted share prices applied to the Group’s economic interest(ii) Represents investment cost in FPM Power(iii) Represents loans receivable from Philex
Employee InformationThe following information relates to the Head Office and its subsidiary companies.
For the six months ended 30 June 2013 2012US$ millions Employee Remuneration
(including Directors’ Remuneration)Basic salaries 197.8 173.8Bonuses 48.3 43.3Benefits in kind 41.9 42.6Pension contributions 31.1 24.4Equity-settled share option expense 4.7 1.6 Total 323.8 285.7
2013 2012
Number of employees– At 30 June 85,128 76,476– Average for the period 80,837 74,960
For details regarding the Group’s remuneration policies for Directors and senior executives, please refer to pages 65 and 66 of the Company’s 2012 Annual Report.
18
16
14
12
9.15
4.45
8.31
16.78
10
8
4
6
Jun
09
Jun
13
Dec
12
Jun
12
Dec
11
Jun
11
Dec
10
Jun
10
Dec
09
Share Price vsAdjusted NAV Per Share
HK$
Adjusted NAV per share Share price
63%
34%
3%
Adjusted NAV by Country30 June 2013
PhilippinesIndonesiaSingaporeTotal
6,129.53,254.2
US$ millions
330.09,713.7

Condensed Interim Consolidated Financial Statements
Interim Report 2013 39
Condensed Consolidated Income Statement
(Unaudited)
For the six months ended 30 June 2013 2012US$ millions Notes (Restated) (i) Turnover 2 3,123.8 2,989.5Cost of sales (2,216.7) (2,046.6) Gross Profit 907.1 942.9Gain on dilutions, net – 14.4Distribution expenses (228.4) (208.4)Administrative expenses (255.3) (229.0)Other operating (expenses)/income, net (168.5) 13.2Interest income 37.2 39.9Finance costs 3 (158.3) (130.5)Share of profits less losses of associated companies and joint ventures 162.6 152.1 Profit Before Taxation 4 296.4 594.6Taxation 5 (42.5) (111.8) Profit for the Period 253.9 482.8 Attributable to:
Owners of the parent 6 142.7 220.8Non-controlling interests 111.2 262.0
253.9 482.8 Earnings Per Share Attributable to Owners of the Parent (U.S. cents) 7
Basic 3.64 5.62Diluted 3.59 5.53
(i) Refer to Note 1(B)
Details of the dividend declared for the period is disclosed in Note 8 to the Condensed Interim Consolidated Financial Statements.
The accompanying notes form an integral part of these Condensed Interim Consolidated Financial Statements.

First Pacifi c Company Limited40
Condensed Interim Consolidated Financial Statements
Condensed Consolidated Statement of Comprehensive Income
(Unaudited)
For the six months ended 30 June 2013 2012US$ millions (Restated) (i) Profit for the Period 253.9 482.8 Other Comprehensive (Loss)/IncomeItems that may be Reclassified Subsequently to Profit or Loss:
Exchange differences on translating foreign operations (221.5) (93.9)Unrealized gains/(losses) on available-for-sale assets 17.6 (6.0)Realized gain on available-for-sale assets (0.8) –Unrealized gains on cash flow hedges 7.9 0.2Realized losses on cash flow hedges – 2.8Income tax related to cash flow hedges (0.9) –Share of other comprehensive income of associated companies and joint ventures (68.3) 31.2
Items that will not be Reclassified to Profit or Loss:Actuarial (losses)/gains on defined benefit pension plans (2.7) 0.4Revaluation deficit of assets (1.6) –Share of other comprehensive income of associated companies and joint ventures (2.7) –
Other Comprehensive Loss for the Period, Net of Tax (273.0) (65.3) Total Comprehensive (Loss)/Income for the Period (19.1) 417.5 Attributable to:
Owners of the parent (7.6) 243.6Non-controlling interests (11.5) 173.9
(19.1) 417.5 (i) Refer to Note 1(B)
The accompanying notes form an integral part of these Condensed Interim Consolidated Financial Statements.

Interim Report 2013 41
Condensed Interim Consolidated Financial Statements
Condensed Consolidated Statement of Financial Position
At30 June
2013
At31 December
2012US$ millions Notes (Unaudited) (Restated) (i) Non-current Assets
Property, plant and equipment 9 2,714.0 1,824.3Plantations 1,177.6 1,301.5Associated companies and joint ventures 10 3,426.1 3,299.1Goodwill 1,155.2 808.2Other intangible assets 11 2,467.3 2,305.8Accounts receivable, other receivables and prepayments 12 30.8 190.6Available-for-sale assets 174.3 41.9Deferred tax assets 156.8 132.3Pledged deposits 13 11.1 11.1Other non-current assets 263.0 288.4
11,576.2 10,203.2 Current Assets
Cash and cash equivalents 1,808.2 2,175.0Restricted cash 13 73.6 33.1Available-for-sale assets 75.4 58.7Accounts receivable, other receivables and prepayments 12 928.7 600.0Inventories 778.3 816.7
3,664.2 3,683.5 Current Liabilities
Accounts payable, other payables and accruals 14 1,281.9 984.4Short-term borrowings 1,137.1 926.5Provision for taxation 47.8 39.0Current portion of deferred liabilities, provisions and payables 15 145.8 119.7
2,612.6 2,069.6 Net Current Assets 1,051.6 1,613.9 Total Assets Less Current Liabilities 12,627.8 11,817.1 Equity
Issued share capital 38.4 38.3Retained earnings 1,550.8 1,479.8Other components of equity 1,649.9 1,721.9 Equity attributable to owners of the parent 3,239.1 3,240.0Non-controlling interests 4,154.7 4,010.7
Total Equity 7,393.8 7,250.7 Non-current Liabilities
Long-term borrowings 4,097.5 3,438.5Deferred liabilities, provisions and payables 15 745.1 691.2Deferred tax liabilities 391.4 436.7
5,234.0 4,566.4 12,627.8 11,817.1
(i) Refer to Note 1(B)
The accompanying notes form an integral part of these Condensed Interim Consolidated Financial Statements.
On behalf of the Board of Directors
MANUEL V. PANGILINANManaging Director and Chief Executive Officer28 August 2013

First Pacifi c Company Limited42
Condensed Interim Consolidated Financial Statements
Condensed Consolidated Statement of Changes in Equity
Equity attributable to owners of the parent Differences
Other comprehensive
arising from changes in
Issued Share equities of Capital Non- (Unaudited)share Share options income/(loss) subsidiary and other Retained controlling Total
US$ millions Notes capital premium issued (Note 16) companies reserves earnings Total interests equity Balance at 1 January 2012
As previously reported 38.5 1,289.2 39.7 109.8 248.6 12.3 1,284.6 3,022.7 3,856.5 6,879.2Prior year adjustments – – – 0.6 – – (0.6) – – – As restated(i) 38.5 1,289.2 39.7 110.4 248.6 12.3 1,284.0 3,022.7 3,856.5 6,879.2
Profit for the periodAs previously reported – – – – – – 222.2 222.2 262.3 484.5Prior year adjustments 1(B) – – – – – – (1.4) (1.4) (0.3) (1.7) As restated(i) – – – – – – 220.8 220.8 262.0 482.8
Other comprehensive income/(loss) for the periodAs previously reported – – – 22.7 – – – 22.7 (88.4) (65.7)Prior year adjustments – – – 0.1 – – – 0.1 0.3 0.4 As restated(i) – – – 22.8 – – – 22.8 (88.1) (65.3)
Total comprehensive income for the period – – – 22.8 – – 220.8 243.6 173.9 417.5 Issue of shares upon the exercise of
share options 0.2 12.0 (3.9) – – – – 8.3 – 8.3Repurchase and cancellation of shares (0.4) – – – – 0.4 (40.1) (40.1) – (40.1)Equity-settled share option arrangements – – 1.7 – – – – 1.7 – 1.7Acquisition, dilution and divestment of
interests in subsidiary companies – – – – 1.1 – – 1.1 12.6 13.7Dilution of interests in associated companies – – – – (0.3) – – (0.3) – (0.3)2011 final dividend paid – – – – – – (64.2) (64.2) – (64.2)Dividends payable and paid to
non-controlling shareholders – – – – – – – – (149.6) (149.6) Balance at 30 June 2012 38.3 1,301.2 37.5 133.2 249.4 12.7 1,400.5 3,172.8 3,893.4 7,066.2 Balance at 1 January 2013
As previously reported 38.3 1,312.2 33.8 174.9 242.3 0.5 1,431.3 3,233.3 4,010.7 7,244.0Prior year adjustments 1(B) – – – (41.8) – – 48.5 6.7 – 6.7 As restated(i) 38.3 1,312.2 33.8 133.1 242.3 0.5 1,479.8 3,240.0 4,010.7 7,250.7
Profit for the period – – – – – – 142.7 142.7 111.2 253.9Other comprehensive loss for the period – – – (149.4) – (0.9) – (150.3) (122.7) (273.0) Total comprehensive loss for the period – – – (149.4) – (0.9) 142.7 (7.6) (11.5) (19.1) Issue of shares upon the exercise of
share options 0.2 13.2 (4.3) – – – – 9.1 – 9.1Repurchase and cancellation of shares (0.1) – – – – 0.1 (6.1) (6.1) – (6.1)Equity-settled share option arrangements – – 4.1 – – – – 4.1 – 4.1Reserve of a disposal group of
associated companies classified as held for sale – – – – – 13.3 – 13.3 – 13.3Dilution and divestment of interests in
subsidiary companies – – – (6.7) 57.2 – – 50.5 177.6 228.1Revaluation deficit of assets transferred to
retained earnings – – – – – 1.4 (1.4) – – –2012 final dividend paid – – – – – – (64.2) (64.2) – (64.2)Acquisition of subsidiary companies – – – – – – – – 27.4 27.4Capital contribution from non-controlling shareholders – – – – – – – – 115.2 115.2Dividends payable and paid to
non-controlling shareholders – – – – – – – – (164.7) (164.7) Balance at 30 June 2013 38.4 1,325.4 33.6 (23.0) 299.5 14.4 1,550.8 3,239.1 4,154.7 7,393.8 (i) Refer to Note 1(B)
The accompanying notes form an integral part of these Condensed Interim Consolidated Financial Statements.

Interim Report 2013 43
Condensed Interim Consolidated Financial Statements
Condensed Consolidated Statement of Cash Flows
(Unaudited)
For the six months ended 30 June 2013 2012US$ millions Notes (Restated) (i) Profit Before Taxation 296.4 594.6Adjustments for:
Loss/(gain) on changes in fair value of plantations 4 164.6 (7.1)Finance costs 158.3 130.5Depreciation 4 79.3 66.0Amortization of other intangible assets 4 43.6 46.0Decrease/(increase) in other non-current assets 17.3 (12.6)Foreign exchange and derivative losses, net 4 15.2 3.5Equity-settled share option expense 4.7 1.6Loss/(gain) on sale of property, plant and equipment 4 0.3 (0.9)Share of profits less losses of associated companies and joint ventures (162.6) (152.1)Interest income (37.2) (39.9)Increase in accounts receivables, other receivables and
prepayments (Non-current) (27.0) (31.5)Gain on dilution of interests in associated companies 4 – (14.4)Others (15.8) (5.2)
537.1 578.5(Increase)/decrease in working capital (181.2) 81.1 Net cash generated from operations 355.9 659.6Interest received 35.4 38.8Interest paid (147.9) (122.9)Taxes paid (97.8) (111.5) Net Cash Flows From Operating Activities 145.6 464.0 Dividends received from associated companies 148.1 159.7Proceeds from disposal of available-for-sale assets 12.9 –Preferred share dividends received from a joint venture 9.8 6.6Proceeds from disposal of property, plant and equipment 8.5 1.5Dividends received from available-for-sale assets 2.6 –Proceeds from disposal of plantations 1.0 –Decrease in time deposits with original maturity of more than three months 0.3 0.5Acquisition of subsidiary companies 17(A) (456.5) –Purchase of property, plant and equipment (304.6) (181.9)Investments in associated companies 17(B) (165.1) (15.0)Loans to an associated company 17(C) (104.4) –Investments in other intangible assets (89.7) (83.1)Investments in joint ventures 17(D) (66.7) –Investments in plantations (49.0) (45.7)(Increase)/decrease in restricted cash (42.3) 12.6Acquisition of available-for-sale assets (5.5) (6.3)Increased investments in associated companies (2.6) (3.6)Purchase of preferred shares of a joint venture – (83.4)Increased investments in a joint venture – (63.2) Net Cash Flows Used in Investing Activities (1,103.2) (301.3) Net borrowings raised 371.8 377.1Proceeds from issue of shares to non-controlling shareholders by
subsidiary companies 149.3 2.8Capital contribution from non-controlling shareholders 115.2 –Proceeds from divestment of interest in subsidiary companies 85.2 1.3Proceeds from issue of shares upon the exercise of share options 9.1 8.3Dividends paid to shareholders (64.2) (64.2)Dividends paid to non-controlling shareholders by subsidiary companies (29.6) (47.8)Repurchase of shares (8.9) (39.4)Repurchase of subsidiary companies’ shares – (2.1) Net Cash Flows From Financing Activities 627.9 236.0 Net (Decrease)/Increase in Cash and Cash Equivalents (329.7) 398.7Cash and cash equivalents at 1 January 2,161.7 1,874.9Exchange translation (39.7) (37.4) Cash and Cash Equivalents at 30 June 1,792.3 2,236.2 RepresentingCash and cash equivalents as stated in
the condensed consolidated statement of financial position 1,808.2 2,251.6Less bank overdrafts (15.9) (15.4) Cash and Cash Equivalents at 30 June 1,792.3 2,236.2 (i) Refer to Note 1(B)
The accompanying notes form an integral part of these Condensed Interim Consolidated Financial Statements.

Notes to the Condensed Interim Consolidated Financial Statements
First Pacifi c Company Limited44
1. Basis of Preparation, Changes in Accounting Policies and Impact of New and Revised HKFRSs
(A) Basis of PreparationThe condensed interim consolidated financial statements have been prepared in accordance with HKAS 34 “Interim Financial Reporting” issued by the Hong Kong Institute of Certified Public Accountants (HKICPA) and the disclosure requirements of the Rules Governing the Listing of Securities on the Stock Exchange of Hong Kong Limited (the Listing Rules) issued by The Stock Exchange of Hong Kong Limited (SEHK). The condensed interim consolidated financial statements have been prepared on a basis consistent with the accounting policies adopted in the Group’s 2012 audited financial statements, except for the adoption of new financial reporting standards and interpretations effective on 1 January 2013 as described below.
(B) Changes in Accounting Policies and Impact of New and Revised HKFRSsDuring the second half of 2012, the Group has changed its accounting policy for obligations for defined benefit pension plans by recognizing all actuarial gains/losses on defined benefit pension plans in the period which they occur in other comprehensive income (i.e. directly into equity) instead of in the income statement.
In addition, with effect from 1 January 2013, the Group has adopted the following new and revised Hong Kong Financial Reporting Standards (HKFRSs) (which include all HKFRSs, HKASs and Hong Kong (International Financial Reporting Interpretations Committee)-Interpretations (HK(IFRIC)-Ints)) issued by the HKICPA:
HKAS 1 Amendments “Presentation of Items of Other Comprehensive Income”(i)
HKAS 19 (2011) “Employee Benefits”(ii)
HKAS 27 (2011) “Separate Financial Statements”(ii)
HKAS 28 (2011) “Investments in Associates and Joint Ventures”(ii)
HKFRS 1 Amendments “Government Loans”(ii)
HKFRS 7 Amendments “Offsetting Financial Assets and Financial Liabilities”(ii)
HKFRS 10 “Consolidated Financial Statements”(ii)
HKFRS 11 “Joint Arrangements”(ii)
HKFRS 12 “Disclosure of Interests in Other Entities”(ii)
HKFRS 10, HKFRS 11 and HKFRS 12 Amendments “Transition Guidance”(ii)
HKFRS 13 “Fair Value Measurement”(ii)
HK(IFRIC)-Int 20 “Stripping Costs in the Production Phase of a Surface Mine”(ii)
Improvements to HKFRSs “Annual Improvements to HKFRSs 2009-2011 Cycle”(ii)
(i) Effective for annual periods commencing on or after 1 July 2012(ii) Effective for annual periods commencing on or after 1 January 2013
The Group’s adoption of the above pronouncements, except for HKAS 19 (2011), has had no effect on both the profit attributable to owners of the parent for the six-month periods ended 30 June 2013 and 30 June 2012 and the equity attributable to owners of the parent at 30 June 2013 and 31 December 2012, but has only resulted in certain changes to the presentation and disclosures of financial statements. In particular, the Group’s adoption of HKAS 1 Amendments has resulted in a change in the presentation of its consolidated statement of comprehensive income in a way that items that could be reclassified (or recycled) to profit or loss at a future point of time when specific conditions are met are now presented separately from items which will never be reclassified (or recycled). The Group’s adoption of HKFRS 13 has resulted in the inclusion of certain disclosures specifically required for financial instruments in interim financial statements, which have been included in Note 21 to the condensed interim consolidated financial statements. The impacts of the Group’s adoption of HKAS 19 (2011) are summarized as follows:
HKAS 19 (2011) includes a number of amendments to the accounting treatments for obligations for defined benefit pension plans and other employee benefits. The Group’s adoption of HKAS 19 (2011) has resulted in additional changes in its accounting policies which include (a) the replacement of interest cost on defined benefit obligations and expected returns on plan assets recognized in the profit or loss with net interest on net defined benefit liability or asset calculated using the discount rate used to measure the pension benefit obligations; (b) recognition of all past service costs in the period they occur in the income statement instead of on a straight-line basis over the vesting period; and (c) recognition of termination benefits only when the Group can no longer withdraw the offer of those benefits instead of accruing their related costs based on the existence of formal plans.

Interim Report 2013 45
Notes to the Condensed Interim Consolidated Financial Statements
The effects of the above changes are summarized below:
(a) Effects on the Condensed Consolidated Statement of Financial Position at 30 June 2013 and 31 December 2012
At 30 June/31 December 2013 2012US$ millions AssetsIncrease in associated companies and joint ventures 2.0 6.7
2.0 6.7 EquityIncrease in actuarial losses on defined benefit pension plans (44.7) (41.8)Increase in retained earnings 46.7 48.5
2.0 6.7
(b) Effects on the Condensed Consolidated Income Statement for the Periods Ended 30 June 2013 and 2012 For the period ended 30 June 2013 2012(i)
US$ millions Increase in administrative expenses (0.3) (0.3)Decrease in other operating income, net – (0.5)Increase in interest income 0.3 0.3Decrease in share of profits less losses of associated companies and
joint ventures (4.7) (1.3)Decrease in taxation – 0.1 Decrease in profit for the period (4.7) (1.7) Attributable to:
Owners of the parent (4.7) (1.4)Non-controlling interests – (0.3)
Decrease in profit for the period (4.7) (1.7) Decrease in earnings per share attributable to owners of the parent (U.S. cent)
Basic (0.12) (0.04)Diluted (0.12) (0.04)
(i) Included the effects of the Group’s change in the accounting policy for obligations for defined benefit pension plans in the second half of 2012
2. Turnover and Operating Segmental Information For the six months ended 30 June 2013 2012US$ millions TurnoverSale of goods 2,713.4 2,617.5Rendering of services 410.4 372.0 Total 3,123.8 2,989.5
Operating Segmental InformationAn operating segment is a component of the Group that engages in business activities from which it may earn revenues and incur expenses (including revenues and expenses relating to transactions with other components of the Group), whose operating results are regularly reviewed by the Group’s chief operating decision maker who makes decisions about how resources are to be allocated to the segment and assesses its performance, and for which discrete financial information is available to him.
The Board of Directors considers the business from both product or service and geographical perspectives. From the product or service perspective, the Group’s business interests are divided into four main segments, which are telecommunications, infrastructure, consumer food products and natural resources. Geographically, the Board of Directors considers the businesses of the Group are operating in the Philippines, Indonesia and Singapore. Details of the Group’s principal investments are provided on page 74.
First Pacifi c Company Limited46
Notes to the Condensed Interim Consolidated Financial Statements
The Board of Directors assesses the performance of the operating segments based on a measure of recurring profit. This basis measures the profit attributable to owners of the parent excluding the effects of foreign exchange and derivative gains/losses, gain/loss on changes in fair value of plantations and non-recurring items. Non-recurring items represent certain items, through occurrence or size, which are not considered as usual operating items.
The revenue, results and other information for the six months ended 30 June 2013 and 2012, and total assets and total liabilities at 30 June 2013 and 31 December 2012 regarding the Group’s operating segments are as follows.
By Principal Business Activity and Geographical Market – 2013 The Philippines Indonesia Singapore
For the six months ended/at 30 June Consumer Telecom- Natural Food Head 2013
US$ millions munications Infrastructure Resources Products Infrastructure Office Total RevenueTurnover – 368.7 – 2,755.1 – – 3,123.8 ResultsRecurring profit 105.2 53.0 3.2 90.5 (1.6) (65.2) 185.1 Assets and LiabilitiesNon-current assets (other than financial instruments and
deferred tax assets)– Associated companies and joint ventures 1,491.3 1,038.7 628.6 267.5 – – 3,426.1– Others – 2,760.7 – 3,911.5 1,012.8 36.1 7,721.1
1,491.3 3,799.4 628.6 4,179.0 1,012.8 36.1 11,147.2Other assets – 738.7 – 2,967.2 97.6 289.7 4,093.2 Total assets 1,491.3 4,538.1 628.6 7,146.2 1,110.4 325.8 15,240.4 Borrowings – 1,231.6 – 1,817.0 453.7 1,732.3 5,234.6Other liabilities – 864.6 – 1,429.5 204.6 113.3 2,612.0 Total liabilities – 2,096.2 – 3,246.5 658.3 1,845.6 7,846.6 Other InformationDepreciation and amortization – (44.2) – (77.5) – (5.9) (127.6)Loss on changes in fair value of plantations – – – (164.6) – – (164.6)Impairment losses – (0.2) – – – – (0.2)Interest income – 6.2 – 25.7 – 5.3 37.2Finance costs – (53.6) – (49.0) – (55.7) (158.3)Share of profits less losses of
associated companies and joint ventures 116.6 28.8 7.0 10.2 – – 162.6Taxation – (8.8) – (26.1) 0.3 (7.9) (42.5)Additions to non-current assets (other than
financial instruments and deferred tax assets) – 242.9 – 494.6 290.9 35.0 1,063.4

Interim Report 2013 47
Notes to the Condensed Interim Consolidated Financial Statements
By Principal Business Activity and Geographical Market – 2012 The Philippines Indonesia
For the six months ended 30 June/at 31 December Consumer 2012Telecom- Natural Food Head (Restated)
US$ millions munications Infrastructure Resources Products Office Total RevenueTurnover – 318.8 – 2,670.7 – 2,989.5 ResultsRecurring profit 95.0 47.7 16.1 90.4 (47.3) 201.9 Assets and LiabilitiesNon-current assets (other than financial instruments and
deferred tax assets) – Associated companies and joint ventures 1,560.0 1,065.8 642.7 30.6 – 3,299.1 – Others – 2,472.4 – 3,999.7 – 6,472.1
1,560.0 3,538.2 642.7 4,030.3 – 9,771.2Other assets – 615.6 – 2,875.6 624.3 4,115.5 Total assets 1,560.0 4,153.8 642.7 6,905.9 624.3 13,886.7 Borrowings – 1,062.5 – 1,584.6 1,717.9 4,365.0Other liabilities – 862.4 – 1,298.8 109.8 2,271.0 Total liabilities – 1,924.9 – 2,883.4 1,827.7 6,636.0 Other InformationDepreciation and amortization – (44.6) – (67.5) (1.5) (113.6)Gain on changes in fair value of plantations – – – 7.1 – 7.1Impairment losses – (0.5) – – – (0.5)Interest income – 9.0 – 30.4 0.5 39.9Finance costs – (43.5) – (52.3) (34.7) (130.5)Share of profits less losses of
associated companies and joint ventures 108.2 26.7 18.2 (1.0) – 152.1Taxation – (10.3) – (91.4) (10.1) (111.8)Additions to non-current assets (other than
financial instruments and deferred tax assets) – 256.4 3.6 239.3 – 499.3
A reconciliation between profit before taxation as shown in the condensed consolidated income statement and recurring profit is as follows.
For the six months ended 30 June 2013 2012US$ millions (Restated) Profit before taxation 296.4 594.6Exclusion of:
– Foreign exchange and derivative losses/(gains), net (Note 6) 22.6 (4.3)– Loss/(gain) on changes in fair value of plantations (Note 4) 164.6 (7.1)– Non-recurring items 16.7 (10.0)
Deduction of attributable taxation and non-controlling interests (315.2) (371.3) Recurring profit 185.1 201.9

First Pacifi c Company Limited48
Notes to the Condensed Interim Consolidated Financial Statements
3. Finance Costs For the six months ended 30 June 2013 2012US$ millions Finance costs on bank loans and other loans
– Wholly repayable within five years 107.3 76.1– Not wholly repayable within five years 57.6 58.1
Less: Finance costs capitalized in – Property, plant and equipment (4.1) (0.8)– Plantations (2.5) (2.9)
Total 158.3 130.5
4. Profit Before Taxation For the six months ended 30 June 2013 2012US$ millions Profit Before Taxation is Stated after (Charging)/CreditingCost of inventories sold (1,570.7) (1,450.1)Employees’ remuneration (323.8) (285.7)(Loss)/gain on changes in fair value of plantations (Note 2) (164.6) 7.1Cost of services rendered (116.4) (123.2)Depreciation (Note 9) (79.3) (66.0)Amortization of other intangible assets (43.6) (46.0)Foreign exchange and derivative losses, net (Note 6) (15.2) (3.5)(Loss)/gain on sale of property, plant and equipment (0.3) 0.9Impairment losses for accounts receivable(i) (0.2) (0.5)Dividends received from available-for-sale assets 2.6 –Gain on disposal of available-for-sale assets 0.9 –Gain on dilution of interests in associated companies – 14.4 (i) Included in distribution expenses
5. TaxationNo Hong Kong profits tax (2012: Nil) has been provided as the Group had no estimated assessable profits (2012: Nil) arising in Hong Kong for the period. Taxation on assessable profits generated outside Hong Kong has been provided at the rates of taxation prevailing in the countries in which the Company’s subsidiary companies operate.
For the six months ended 30 June 2013 2012US$ millions (Restated) Subsidiary Companies – OverseasCurrent taxation 58.9 121.0Deferred taxation (16.4) (9.2) Total 42.5 111.8
Included within the share of profits less losses of associated companies and joint ventures is taxation of US$35.0 million (2012: US$47.8 million (Restated)) and which is analyzed as follows.
For the six months ended 30 June 2013 2012US$ millions (Restated) Associated Companies and Joint Ventures – OverseasCurrent taxation 41.4 42.1Deferred taxation (6.4) 5.7 Total 35.0 47.8
Interim Report 2013 49
Notes to the Condensed Interim Consolidated Financial Statements
6. Profit Attributable to Owners of the ParentThe profit attributable to owners of the parent includes US$15.4 million of net foreign exchange and derivative losses (2012: US$3.6 million of gains), which represent the foreign exchange translation differences on the Group’s unhedged foreign currency denominated borrowings and payables and the changes in the fair values of derivatives, US$23.6 million of loss (2012: US$0.1 million of gain) on changes in fair value of plantations and US$3.4 million of net non-recurring losses (2012: US$15.2 million of net non-recurring gains (Restated)).
Analysis of Foreign Exchange and Derivative (Losses)/Gains, Net For the six months ended 30 June 2013 2012US$ millions Foreign exchange and derivative (losses)/gains, net
– Subsidiary companies (Note 4) (15.2) (3.5)– Associated companies and joint ventures (7.4) 7.8
Subtotal (Note 2) (22.6) 4.3Attributable taxation and non-controlling interests 7.2 (0.7) Total (15.4) 3.6
The non-recurring losses for 2013 mainly represent the Group’s debt refinancing costs (US$18.0 million), partly offset by PLDT’s gain on disposal of business process outsourcing business (US$12.1 million). The non-recurring gains for 2012 mainly represent the Group’s gain on dilution of a 0.2% interest in PLDT as a result of PLDT’s issuance of new shares upon its tender offer for Digital Telecommunications Philippines, Inc. (Digitel)’s shares in January 2012.
7. Earnings Per Share Attributable to Owners of the ParentThe calculation of basic earnings per share is based on the profit for the period attributable to owners of the parent of US$142.7 million (2012: US$220.8 million (Restated)) and the weighted average number of ordinary shares of 3,917.9 million (2012: 3,928.8 million (Restated)) in issue during the period.
The calculation of diluted earnings per share is based on: (a) the profit for the period attributable to owners of the parent of US$142.7 million (2012: US$220.8 million (Restated)) reduced by the dilutive impact of US$0.1 million (2012: US$0.1 million) in respect of the exercise of share options issued by its subsidiary and associated companies and (b) a share base equal to the aggregate of the weighted average number of ordinary shares of 3,917.9 million (2012: 3,928.8 million (Restated)) in issue during the period (as used in the basic earnings per share calculation) and the weighted average number of ordinary shares of 49.1 million (2012: 60.3 million (Restated)) assumed to have been issued at no consideration on the deemed exercise of share options of the Company during the period.
The weighted average number of ordinary shares in issue and assumed to have been issued at no consideration on the deemed exercise of share options of the Company during the period and the prior comparative period have been adjusted to reflect the rights issue of the Company completed subsequent to the end of the reporting period in July 2013.
8. Ordinary Share DividendAt a meeting held on 28 August 2013, the Directors declared an interim cash dividend of U.S. 1.03 cents (2012: U.S. 1.03 cents) per ordinary share, equivalent to a total amount of US$44.3 million (2012: US$39.6 million).

First Pacifi c Company Limited50
Notes to the Condensed Interim Consolidated Financial Statements
9. Property, Plant and EquipmentThe movements in property, plant and equipment are set out below.
US$ millions 2013 2012 At 1 January 1,824.3 1,651.7Exchange translation (69.3) (62.3)Additions 309.7 182.6Acquisition of subsidiary companies (Note 17(A)) 737.4 –Depreciation (Note 4) (79.3) (66.0)Disposals (8.8) (0.6) At 30 June 2,714.0 1,705.4
10. Associated Companies and Joint Ventures At At
30 June 31 December2013 2012
US$ millions (Restated) PLDT 1,491.3 1,560.0MPIC(i) 1,038.7 1,065.8Philex(ii) 628.6 642.7Indofood(iii) 267.5 30.6 Total 3,426.1 3,299.1 (i) Principally represents MPIC’s investments in Beacon Electric’s common shares and preferred shares(ii) As a result of an accidental discharge of water and tailings from one of the two underground tunnels that drain water from its TSF3 of the Padcal mine on 1
August 2012, Philex suspended its Padcal mine’s operations to conduct a remediation and rehabilitation of its TSF3 since August 2012. In connection with this accident, Philex has paid in February 2013 Pesos 1.0 billion (approximately US$25 million) of tailings fee charged by the Mines and Geosciences Bureau (MGB) of the Philippine government. Philex has substantially recovered the payment of this fee through a receipt of US$25 million (approximately Pesos 1.0 billion) from an insurance claim in February 2013. Following the payment of this fee, MGB issued an order granting Philex the authority to resume operations for a period of four months starting from 8 March 2013 to undertake urgent remediation measures for its tailings pond No. 3. After the lapse of the four-month period, Padcal mine continues to operate following an indefinite extension of the temporary lifting of the suspension order.
(iii) Principally represents Indofood’s investments in China Minzhong Food Corporation (CMFC) and Companhia Mineira de Açúcar e Álcool Participações (CMAA) and PT Asahi Indofood Beverage Makmur (AIBM)
11. Other Intangible Assets At At
30 June 31 DecemberUS$ millions 2013 2012 Concession assets – Water distribution 1,578.5 1,592.8Concession assets – Toll roads 595.3 401.6Brands 293.5 311.4 Total 2,467.3 2,305.8
Concession assets – Water distribution represents the exclusive right granted by Metropolitan Waterworks and Sewerage System (MWSS) on behalf of the Philippine government for Maynilad to provide water distribution and sewerage services and charge users for these services provided in the area of West Metro Manila during its concession period. Concession assets – Toll roads represent the concession comprising the rights, interests and privileges to finance, design, construct, operate and maintain toll roads, toll facilities and other facilities generating toll-related and non-toll related income held by (a) MNTC in respect of the Manila North Expressway (also known as NLEX) and (b) CIC in respect of CAVITEX during their concession periods. Brands represent the brands held by PT Indolakto for its various milk-related products, which include Indomilk, Cap Enaak, Tiga Sapi, Indoeskrim, Nice and Orchid.

Interim Report 2013 51
Notes to the Condensed Interim Consolidated Financial Statements
12. Accounts Receivable, Other Receivables and PrepaymentsIncluded in accounts receivable, other receivables and prepayments are accounts receivable of US$442.7 million (31 December 2012: US$369.9 million) with an ageing profile as follows.
At At
30 June 31 DecemberUS$ millions 2013 2012 0 to 30 days 408.4 336.931 to 60 days 14.7 9.161 to 90 days 5.2 8.7Over 90 days 14.4 15.2 Total 442.7 369.9
Indofood generally allows local customers an average of 30 days of credit and export customers 60 days of credit. MPIC (a) allows 14 days of credit for its water service customers, (b) collects toll fees by CIC, and through its associated company, Tollways Management Corporation (TMC), by cash, by prepaid and reloadable electronic toll collection devices and by credit card payment and (c) generally collects charges when services are rendered to its hospital customers, except for certain corporate customers which are allowed an average of 30 days of credit.
13. Pledged Deposits and Restricted CashAt 30 June 2013, the Group had US$11.1 million (31 December 2012: US$11.1 million) of pledged bank deposits and US$73.6 million (31 December 2012: US$33.1 million) of cash which was set aside to cover principal and interest payments of certain borrowings and restricted as to use.
14. Accounts Payable, Other Payables and AccrualsIncluded in accounts payable, other payables and accruals are accounts payable of US$384.5 million (31 December 2012: US$288.8 million) with an ageing profile as follows.
At At
30 June 31 DecemberUS$ millions 2013 2012 0 to 30 days 350.9 261.031 to 60 days 8.3 7.861 to 90 days 3.5 6.7Over 90 days 21.8 13.3 Total 384.5 288.8

First Pacifi c Company Limited52
Notes to the Condensed Interim Consolidated Financial Statements
15. Deferred Liabilities, Provisions and Payables Long-term 2013 2012
US$ millions Pension liabilities Others Total Total At 1 January 355.4 296.8 158.7 810.9 744.8Exchange translation (10.0) (13.7) (9.4) (33.1) 4.3Additions 26.8 27.5 21.9 76.2 77.5Acquisition of subsidiary companies (Note 17(A)) 0.6 78.0 47.5 126.1 –Payment and utilization (1.6) (69.4) (18.2) (89.2) (63.5) At 30 June 371.2 319.2 200.5 890.9 763.1 Presented as:Current Portion – 28.5 117.3 145.8 122.6Non-current Portion 371.2 290.7 83.2 745.1 640.5 Total 371.2 319.2 200.5 890.9 763.1
The pension relates to accrued liabilities in relation to defined benefit retirement schemes and long service payments.
The long-term liabilities mainly relate to (a) Maynilad’s concession fees payable to MWSS, including a provision for certain additional concession fees payable and related interest amounts in dispute between Maynilad and MWSS recognized by the Group upon its acquisition of Maynilad, and deferred credits (which represent foreign exchange gains and other payables which will be refunded to the customers and foreign exchange differences arising from retranslation of the portion of Maynilad’s foreign currency denominated concession fees payable and loans); (b) unsecured loans provided by the 30% non-controlling shareholder of PacificLight, Petronas Power Sdn Bhd (Petronas), pro rata to its economic interest in PacificLight; and (c) Indofood’s accrued liabilities for dismantlement, removal or restoration in relation to property, plant and equipment. In respect of the disputed amounts with MWSS, no final resolution has been reached at 30 June 2013.
The others mainly represent provisions for various claims and potential claims against the Group.
16. Other Comprehensive Income Attributable to Owners of the Parent Unrealized Unrealized Income Actuarial
gains/ gains/ tax gains/(losses) on (losses) on related (losses) on available- cash to cash defined
Exchange for-sale flow flow benefitUS$ millions Note reserve assets hedges hedges pension plans Total Balance at 1 January 2012
As previously reported 52.4 51.5 9.4 (3.5) – 109.8Prior year adjustments – – – – 0.6 0.6 As restated 52.4 51.5 9.4 (3.5) 0.6 110.4
Other comprehensive income/(loss) for the periodAs previously reported 31.6 (8.0) (2.6) 1.7 – 22.7Prior year adjustments – – – – 0.1 0.1 As restated 31.6 (8.0) (2.6) 1.7 0.1 22.8
Balance at 30 June 2012 84.0 43.5 6.8 (1.8) 0.7 133.2 Balance at 1 January 2013
As previously reported 142.0 29.6 4.4 (1.1) – 174.9Prior year adjustments 1(B) – – – – (41.8) (41.8) As restated 142.0 29.6 4.4 (1.1) (41.8) 133.1
Other comprehensive (loss)/income for the period (148.3) 0.4 1.8 (0.4) (2.9) (149.4)Dilution and divestment of interests in
subsidiary companies (6.7) – – – – (6.7) Balance at 30 June 2013 (13.0) 30.0 6.2 (1.5) (44.7) (23.0)

Interim Report 2013 53
Notes to the Condensed Interim Consolidated Financial Statements
17. Notes to the Condensed Consolidated Statement of Cash Flows(A) Acquisition of Subsidiary Companies
Provisionalfair value
recognizedon acquisition
Carrying amount immediately before the
acquisitions
US$ millions
FPM Power’s acquisition of
PacificLight
MPTC’s acquisition
of CIC
Indofood’s acquisition
of MPM Others Total Total ConsiderationCash and cash equivalents 478.6 – 34.0 3.1 515.7Other receivables – 165.7 – – 165.7 Total 478.6 165.7 34.0 3.1 681.4 Net AssetsProperty, plant and equipment (Note 9) 732.1 0.6 0.5 4.2 737.4 737.3Plantations – – 27.3 – 27.3 25.1Other intangible assets – 234.3 – – 234.3 187.5Available-for-sale assets (Non-current) – 147.8 – – 147.8 143.0Deferred tax assets 3.0 0.7 0.3 0.2 4.2 4.2Other non-current assets – 18.0 0.3 0.4 18.7 6.2Cash and cash equivalents 37.1 18.2 – 3.9 59.2 59.2Accounts receivable, other receivables
and prepayments (Current) 7.7 0.6 5.4 2.8 16.5 16.5Inventories 4.4 – – 0.4 4.8 4.8Accounts payable, other payables and accruals (11.5) (13.9) (5.3) (4.0) (34.7) (34.7)Short-term borrowings – (25.0) – (1.5) (26.5) (25.0)Current portion of deferred liabilities, provisions
and payables (Note 15) (15.1) – – – (15.1) (15.1)Long-term borrowings (435.3) (291.0) – – (726.3) (709.5)Deferred liabilities, provisions and payables (Note 15) (71.6) (38.8) – (0.6) (111.0) (84.2)Deferred tax liabilities – (5.5) (0.6) – (6.1) (5.5) Total Net Assets 250.8 46.0 27.9 5.8 330.5 309.8Non-controlling interests (24.3) – (0.2) (2.9) (27.4) (27.4) Total Net Assets Acquired 226.5 46.0 27.7 2.9 303.1 282.4 Goodwill 252.1(i) 119.7(i) 6.3(i) 0.2(i) 378.3 Net Cash Outflow per the Condensed
Consolidated Statement of Cash Flows (441.5) 18.2 (34.0) 0.8 (456.5) (i) Provisional amounts determined based on the book values of identifiable assets acquired and liabilities assumed of PacificLight and the
management’s best estimates of the fair values of the identifiable assets acquired, liabilities and contingent liabilities assumed of CIC, MPM and others, which are subject to revision upon their further assessment

First Pacifi c Company Limited54
Notes to the Condensed Interim Consolidated Financial Statements
On 28 March 2013, FPM Power (a 60%-owned subsidiary company of the Company, with the remaining 40% interest held by Meralco PowerGen Corporation (Meralco PowerGen), a wholly-owned subsidiary of Meralco), purchased (a) a 70% equity interest in PacificLight and (b) in aggregate approximately US$170 million of shareholders’ loans due from PacificLight to the sellers for a total consideration of approximately S$595 million (US$478.6 million). PacificLight is a company established for the construction, operation and maintenance of a two-unit natural gas fueled power plant in Singapore. The transaction costs of US$9.1 million incurred by FPM Power for the business combination have been recognized as other operating expenses in the condensed consolidated income statement.
On 2 January 2013, MPTC, a 99.9%-owned subsidiary company of MPIC, acquired the management control and a 100% economic interest in CIC for a consideration of Pesos 6.8 billion (US$165.7 million). CIC holds a concession for the operations and maintenance of CAVITEX, which is a 14-kilometer long road built in two segments running from Parañaque to Cavite in the Philippines. No transaction costs were incurred for the business combination.
On 8 March 2013, Indofood through its indirect subsidiary companies, SIMP and Lonsum, subscribed 50.7% and 48.7% interest in MPM for consideration of Rupiah 168 billion (US$17.3 million) and Rupiah 162 billion (US$16.7 million), respectively. As a result of these transactions, SIMP owns an effective interest of 79.7% in MPM. MPM engages in industrial forest plantations and has three concession areas in East Kailmantan of Indonesia. No transaction costs were incurred for the business combination.
The goodwill arising from the above acquisitions pertains, but is not limited to, the expected synergies in the Group arising from the acquisitions.
Since the date of acquisition, the above acquired companies recorded a loss for the period of US$2.6 million which is included in the condensed consolidated income statement of the Group. If the acquisition had taken place on 1 January 2013, the turnover and net profit of the Group for the period ended 30 June 2013 would have been US$3,127.5 million and US$252.3 million, respectively. The subsidiary companies acquired during the period had net cash outflows from operating activities of US$8.3 million, net cash outflows of US$30.9 million in respect of investing activities and net cash inflows of US$26.5 million in respect of financing activities during the period.
(B) Investments in Associated Companies2013’s cash outflow of US$165.1 million principally represents Indofood’s investments (including transaction costs of US$3.5 million) of US$161.9 million in a 29.3% interest in CMFC, an integrated vegetable processor in China with cultivation, processing and sales capabilities. 2012’s cash outflow of US$15.0 million represents Indofood’s investment in a 26.4% interest in Heliea Technology Holdings, Inc., a company engaged in the development and production of fertilizer and other chemicals.
(C) Loans to an Associated Company2013’s cash outflow of US$104.4 million represents loans to Philex.
(D) Investment in Joint Ventures2013’s cash outflow of US$66.7 million principally represents Indofood’s investment of US$66.6 million in a 50% interest in CMAA. CMAA principally engages in the cultivation and processing of sugar cane for the production and marketing of sugar and ethanol, as well as cogeneration of electric power from sugar cane bagasse.
18. Commitments and Contingent Liabilities(A) Capital Expenditure
At At30 June 31 December
US$ millions 2013 2012 Commitments in respect of subsidiary companies:Authorized, but not contracted for 561.7 1,132.1Contracted, but not provided for 394.3 256.0 Total 956.0 1,388.1
The Group’s capital expenditure commitments principally relate to Indofood’s and PacificLight’s purchase of property, plant and equipment, Indofood’s investments in plantations, and Maynilad’s, MNTC’s and CIC’s construction of water and toll road infrastructures.
Interim Report 2013 55
Notes to the Condensed Interim Consolidated Financial Statements
(B) Contingent Liabilities(a) At 30 June 2013, except for US$105.1 million (31 December 2012: US$99.8 million) guarantees given by
Indofood for loan facilities obtained by certain plantation farmers in relation to arrangements for those farmers’ production and sale of fresh fruit bunches to Indofood, the Group had no significant contingent liabilities (31 December 2012: Nil).
(b) In the Gamboa Case, the Supreme Court of the Philippines in its decision dated 28 June 2011, or the Gamboa Case Decision, held that “the term ‘capital’ in Section 11, Article XII of the 1987 Constitution refers only to shares of stock entitled to vote in the election of directors and thus, in the case of PLDT, only to voting common shares, and not to the total outstanding capital stock (common and non-voting preferred shares)”. The Gamboa Case Decision reversed earlier opinions issued by the Philippine Securities and Exchange Commission (SEC) that non-voting preferred shares are included in the computation of the 60%-40% Filipino-alien equity requirement of certain economic activities, such as telecommunications which is a public utility under Section 11, Article XII of the 1987 Constitution. Several Motions for Reconsideration of the Gamboa Case Decision were filed by the parties. On 18 October 2012, the Gamboa Case Decision became final and executory.
While PLDT was not a party to the Gamboa Case, the Supreme Court of the Philippines directed the Philippine SEC in the Gamboa Case “to apply this definition of the term ‘capital’ in determining the extent of allowable foreign ownership in PLDT, and if there is a violation of Section 11, Article XII of the Constitution, to impose the appropriate sanctions under the law.”
On 5 July 2011, the Board of Directors of PLDT approved the amendments to the Seventh Article of PLDT’s Articles of Incorporation consisting of the sub-classification of its authorized preferred capital stock into preferred shares with full voting rights, or Voting Preferred Stock, and serial preferred shares without voting rights, and other conforming amendments, or the Amendments. The Amendments were approved by the stockholders of PLDT on 22 March 2012 and by the Philippine SEC on 5 June 2012.
On 12 October 2012, the Board of Directors of PLDT approved the specific rights, terms and conditions of the Voting Preferred Stock and authorized the subscription and issuance thereof to BTF Holdings, Inc. (BTFHI), a Filipino corporation. On 16 October 2012, BTFHI subscribed to 150 million newly issued shares of Voting Preferred Stock, or the Voting Preferred Shares, at a subscription price of Peso 1.00 per share for a total subscription price of Pesos 150 million pursuant to a subscription agreement dated 15 October 2012 between BTFHI and PLDT. As a result of the issuance of the Voting Preferred Shares, PLDT’s foreign ownership decreased from 58.4% of outstanding Common Stock as at 15 October 2012 to 34.5% of outstanding Voting Stocks (Common Stock and Voting Preferred Stock) as at 16 October 2012.
On 30 May 2013, the Philippine SEC issued SEC Memorandum Circular No. 8, or the Philippine SEC Guidelines, which provides under Section 2 thereof, as follows: “All covered corporations shall, at all times, observe the constitutional or statutory ownership requirement. For purposes of compliance therewith, the required percentage of Filipino ownership shall be applied to both: (a) the total number of outstanding shares of stock entitled to vote in the election of directors; and (b) the total number of outstanding shares of stock, whether or not entitled to vote in the election of directors.” PLDT was, and continues to be, compliant with the Philippine SEC Guidelines. As at end of July 2013, PLDT’s foreign ownership was 32.87% of its outstanding shares entitled to vote (Common and Voting Preferred Shares), and 18.07% of its total outstanding capital stock.
On 10 June 2013, PLDT was served a copy of a Petition for Certiorari under Rule 65 of the Revised Rules of Court, or the Petition, filed with the Supreme Court by Jose M. Roy III as petitioner against the Chairperson of the Philippine SEC, Teresita Herbosa, the Philippine SEC and PLDT as respondents. The Petition primarily questions the constitutionality of the Philippine SEC Guidelines in determining the nationality of a Philippine company pursuant to the Gamboa Case Decision and Section 11, Article XII of the Constitution. Per the Philippine SEC Guidelines, the Philippine nationality requirement of Section 11, Article XII of the Constitution is met if at least 60% of: (a) the outstanding voting stocks; and (b) the outstanding capital stock of the company is owned by Filipinos.

First Pacifi c Company Limited56
Notes to the Condensed Interim Consolidated Financial Statements
The Petition admits that if the Philippine SEC Guidelines were to be followed, PLDT would be compliant with the nationality requirement of the Philippine Constitution. However, the Petition claims that the Philippine SEC Guidelines do not conform to the letter and spirit of the Constitution and the Gamboa Case Decision supposedly requiring the application of the 60%-40% ownership requirement in favor of Filipino citizens separately to each class of shares, whether common, preferred non-voting, preferred voting or any other class of shares. The Petition also claims that the PLDT Beneficial Trust Fund does not satisfy the effective Filipino-control test for purposes of incorporating BTFHI which acquired the 150 million Voting Preferred Shares.
PLDT has yet to file its Comments to the Petition before the Supreme Court of the Philippines.
19. Share OptionsParticulars of the share options of the Company and its subsidiary company granted to the Directors and senior executives of the Company and its subsidiary company at 30 June 2013 are set out below.
(A) Particulars of the Company’s Share Option Scheme
Shareoptionsheld at
1 January2013
Shareoptions
exercisedduring
the period
Shareoptionsgranted
during theperiod
Shareoptionsheld at
30 June2013
Shareoption
exerciseprice per
share(i)
(HK$)
Marketprice per share atthe dateof grant
(HK$)
Marketprice per
share duringthe period
of exercise(HK$) Grant date Fully vested by Exercisable from Exercisable until
Executive DirectorsManuel V. Pangilinan 19,098,934 – – 19,098,934 5.0569 5.0569 – 5 September 2007 September 2012 September 2008 September 2017
– – 10,000,000 10,000,000 10.46 10.46 – 22 March 2013 September 2017 September 2013 March 2023Edward A. Tortorici – – 5,000,000 5,000,000 10.46 10.46 – 22 March 2013 September 2017 September 2013 March 2023
– – 10,121,000 10,121,000 10.504 10.22 – 4 June 2013 September 2017 September 2013 June 2023Robert C. Nicholson 16,337,388 – – 16,337,388 5.0569 5.0569 – 5 September 2007 September 2012 September 2008 September 2017
– – 6,500,000 6,500,000 10.46 10.46 – 22 March 2013 September 2017 September 2013 March 2023– – 7,121,000 7,121,000 10.504 10.22 – 4 June 2013 September 2017 September 2013 June 2023
Non–Executive DirectorsBenny S. Santoso 2,993,431 (2,993,431) – – 1.6698 1.6698 10.52 – 10.84 1 June 2004 June 2005 – –
3,330,719 (2,288,000) – 1,042,719 5.0569 5.0569 10.70 – 10.82 5 September 2007 September 2008 September 2008 September 2017– – 700,000 700,000 10.46 10.46 – 22 March 2013 September 2017 September 2013 March 2023– – 1,073,000 1,073,000 10.504 10.22 – 4 June 2013 September 2017 September 2013 June 2023
Napoleon L. Nazareno 3,330,000 – – 3,330,000 5.0569 4.61 – 11 December 2009 December 2010 December 2010 December 2019– – 1,073,000 1,073,000 10.504 10.22 – 4 June 2013 September 2017 September 2013 June 2023
Independent Non–Executive DirectorsGraham L. Pickles 3,330,719 (3,330,719) – – 5.0569 5.0569 10.62 – 10.84 5 September 2007 September 2008 – –
– – 1,400,000 1,400,000 10.46 10.46 – 22 March 2013 September 2017 September 2013 March 2023– – 1,073,000 1,073,000 10.504 10.22 – 4 June 2013 September 2017 September 2013 June 2023
Prof. Edward K.Y. Chen, GBS, CBE, JP 412,394 – – 412,394 1.6698 1.6698 – 1 June 2004 June 2005 June 2005 May 20143,330,719 – – 3,330,719 5.0569 5.0569 – 5 September 2007 September 2008 September 2008 September 2017
– – 1,073,000 1,073,000 10.504 10.22 – 4 June 2013 September 2017 September 2013 June 2023Margaret Leung Ko May Yee, SBS, JP (ii) – – 700,000 700,000 10.46 10.46 – 22 March 2013 March 2018 March 2015 March 2023
– – 1,073,000 1,073,000 10.504 10.22 – 4 June 2013 March 2018 March 2015 June 2023Philip Fan Yan Hok(ii) – – 700,000 700,000 10.46 10.46 – 22 March 2013 March 2018 March 2015 March 2023
– – 1,073,000 1,073,000 10.504 10.22 – 4 June 2013 March 2018 March 2015 June 2023Jun Tang(iii) 3,330,000 (3,330,000) – – 5.0569 4.61 10.32 – 10.82 11 December 2009 December 2011 – –Senior Executives 6,538,201 (4,187,038) – 2,351,163 1.6698 1.6698 9.27 – 10.80 1 June 2004 December 2008 June 2005 May 2014
743,113 – – 743,113 3.1072 3.0834 – 7 June 2006 December 2010 June 2007 June 201641,300,938 (2,512,270) – 38,788,668 5.0569 5.0569 8.98 – 9.48 5 September 2007 September 2012 September 2008 September 20174,740,000 (200,000) – 4,540,000 5.31 5.31 8.55 – 10.82 18 June 2010 June 2015 June 2012 June 2020
– – 15,300,000 15,300,000 10.46 10.46 – 22 March 2013 September 2017 September 2013 March 2023– – 31,220,000 31,220,000 10.504 10.22 – 4 June 2013 September 2017 September 2013 June 2023
Total 108,816,556 (18,841,458) 95,200,000 185,175,098(iv) (i) Adjusted for the effect of the Company’s rights issues completed in December 2009 for the prices prior to the trading of the Company’s shares
on an ex-rights basis on 29 October 2009(ii) Mrs. Margaret Leung Ko May Yee and Mr Philip Fan Yan Hok were appointed as Independent Non-executive Directors of the Company with
effect from 21 December 2012.(iii) Mr. Jun Tang retired from the Board of Directors with effect from 30 May 2013.(iv) The number of outstanding options vested and exercisable at 30 June 2013 was 87,815,098.

Interim Report 2013 57
Notes to the Condensed Interim Consolidated Financial Statements
Share options held at
1 January 2012
Share options
exercised during the
period
Share options held at
30 June 2012
Share option
exercise price per
share(i)
(HK$)
Market price per share at the date of grant(i)
(HK$)
Market price per
share during the period
of exercise (HK$) Grant date Fully vested by Exercisable from Exercisable until
Executive DirectorsManuel V. Pangilinan 31,831,556 (6,366,311) 25,465,245 5.0569 5.0569 8.91 5 September 2007 September 2012 September 2008 September 2017Edward A. Tortorici 6,483,256 (2,646,604) 3,836,652 5.0569 5.0569 7.45 5 September 2007 September 2012 September 2008 September 2017Robert C. Nicholson 5,000,000 (2,000,000) 3,000,000 1.6698 1.6698 9.02 1 June 2004 December 2008 June 2005 May 2014
16,337,388 – 16,337,388 5.0569 5.0569 – 5 September 2007 September 2012 September 2008 September 2017Non–Executive DirectorsBenny S. Santoso 2,993,431 – 2,993,431 1.6698 1.6698 – 1 June 2004 June 2005 June 2005 May 2014
3,330,719 – 3,330,719 5.0569 5.0569 – 5 September 2007 September 2008 September 2008 September 2017Napoleon L. Nazareno 3,330,000 – 3,330,000 5.0569 4.61 – 11 December 2009 December 2010 December 2010 December 2019Independent Non–Executive DirectorsGraham L. Pickles 3,330,719 – 3,330,719 5.0569 5.0569 – 5 September 2007 September 2008 September 2008 September 2017Prof. Edward K.Y. Chen, GBS, CBE, JP 412,394 – 412,394 1.6698 1.6698 – 1 June 2004 June 2005 June 2005 May 2014
3,330,719 – 3,330,719 5.0569 5.0569 – 5 September 2007 September 2008 September 2008 September 2017Jun Tang(ii) 3,330,000 – 3,330,000 5.0569 4.61 – 11 December 2009 December 2011 December 2011 December 2019Dr. Christine K. W. Loh, JP, OBE,
Chevalier de l’Ordre National du Merite(iii) 3,330,000 – 3,330,000 7.44 7.44 – 30 August 2011 August 2013 August 2013 August 2021Senior Executives 8,982,843 (2,444,642) 6,538,201 1.6698 1.6698 7.47 – 9.10 1 June 2004 December 2008 June 2005 May 2014
1,743,113 (1,000,000) 743,113 3.1072 3.0834 8.90 – 9.00 7 June 2006 December 2010 June 2007 June 201642,500,938 (1,200,000) 41,300,938 5.0569 5.0569 8.87 – 9.13 5 September 2007 September 2012 September 2008 September 2017
5,400,000 (400,000) 5,000,000 5.31 5.31 7.98 18 June 2010 June 2015 June 2012 June 2020 Total 141,667,076 (16,057,557) 125,609,519(iv)
(i) Adjusted for the effect of the Company’s rights issue completed in December 2009 for the prices prior to the trading of the Company’s shares on an ex-rights basis on 29 October 2009
(ii) Mr. Jun Tang retired from the Board of Directors with effect from 30 May 2013.(iii) Dr. Christine K.W. Loh resigned from the Board of Directors of the Company with effect from 12 September 2012.(iv) The number of outstanding options vested and exercisable at 30 June 2012 was 95,588,873.
On 22 March 2013, 40,300,000 share options under a share option scheme (the Scheme) approved by the shareholders of First Pacific Company Limited (the Company) (at the Company’s annual general meeting held on 31 May 2012) were granted. The average fair value of options granted as calculated by Towers Watson Hong Kong Limited, based on the binomial model, was HK$3.04 per share or an aggregate value of US$15.7 million for all options granted. The assumptions used were as follows:
Share price at the date of grant HK$10.46 per shareExercise price HK$10.46 per shareExpected volatility (based on historical volatility of the Company’s shares commensurate with the average expected life of the options granted) 38%Option life 10 yearsExpected dividend yield 2.7% per annumAverage risk-free interest rate (based on the Hong Kong Exchange Fund Notes) 0.7% per annum
Taking into account the expected turnover rate of the senior executives and the early exercise behavior, the average expected life of the options granted was estimated to be around 6.6 years. The early exercise behavior assumes that option holders will exercise the options when the share price is at least 150% higher than the exercise price.
On 4 June 2013, 54,900,000 share options under the Company’s Scheme were granted. The average fair value of options granted as calculated by Towers Watson Hong Kong Limited, based on the binomial model, was HK$2.94 per share or an aggregate value of US$20.7 million for all options granted. The assumptions used were as follows:
Share price at the date of grant HK$10.22 per shareExercise price HK$10.504 per shareExpected volatility (based on historical volatility of the Company’s shares commensurate with the average expected life of the options granted) 38%Option life 10 yearsExpected dividend yield 2.7% per annumAverage risk-free interest rate (based on the Hong Kong Exchange Fund Notes) 1.0% per annum

First Pacifi c Company Limited58
Notes to the Condensed Interim Consolidated Financial Statements
Taking into account the expected turnover rate of the senior executives and the early exercise behavior, the average expected life of the options granted was estimated to be around 6.6 years. The early exercise behavior assumes that option holders will exercise the options when the share price is at least 150% higher than the exercise price.
The binomial model, applied for determining the estimated values of the share options granted under the Company’s Scheme, was developed for use in estimating the fair value of the traded options that are fully transferable. Such an option pricing model requires input of highly subjective assumptions, including the expected stock price volatility. As the Company’s share options have characteristics significantly different from those of the traded options, changes in the subjective input assumptions can materially affect the estimated value of the options granted.
Further information regarding the Company’s share option scheme and share award scheme have been set out on pages 158 to 162, 165 and 166 of the Company’s 2012 Annual Report.
(B) Particulars of MPIC’s Share Option Scheme
Share options held at
1 January 2013
Share options
exercised during the
period
Share options
cancelled during the
period
Share options held at
30 June 2013
Share option
exercise price per
share (Peso)
Market price per share at the date of grant
(Peso)
Market price per
share during the period
of exercise (Peso) Grant date Fully vested by Exercisable from Exercisable until
Executive DirectorRobert C. Nicholson 10,000,000 – – 10,000,000 2.73 2.65 – 2 July 2010 July 2013 January 2011 July 2015Senior Executives 15,000,000 (10,000,000) (5,000,000) – 2.12 2.10 4.59 9 December 2008 January 2010 – –
25,050,000 (22,550,000) (2,500,000) – 2.73 2.65 5.00 – 5.44 10 March 2009 March 2010 – –77,485,000 (34,915,000) – 42,570,000 2.73 2.65 4.88 – 6.02 2 July 2010 July 2013 January 2011 July 201510,000,000 (6,500,000) – 3,500,000 3.50 3.47 4.97 – 5.89 21 December 2010 August 2013 August 2011 August 2015
1,000,000 (650,000) – 350,000 3.53 3.53 4.97 – 6.61 8 March 2011 March 2014 March 2012 March 20162,750,000 (500,000) – 2,250,000 3.66 3.66 5.45 – 5.87 14 April 2011 April 2013 April 2012 April 2016
Total 141,285,000 (75,115,000) (7,500,000) 58,670,000(i)
(i) The number of outstanding share options vested and exercisable at 30 June 2013 was 43,690,000.
Share options held at
1 January 2012
Share options
exercised during the
period
Share options held at
30 June 2012
Share option
exercise price per
option (Peso)
Market price per share at the date of grant
(Peso)
Market price per
share during the period
of exercise (Peso) Grant date Fully vested by Exercisable from Exercisable until
Executive DirectorRobert C. Nicholson 10,000,000 – 10,000,000 2.73 2.65 – 2 July 2010 July 2013 January 2011 July 2015Senior Executives 26,075,000 (1,475,000) 24,600,000 2.12 2.10 3.54 – 4.42 9 December 2008 January 2010 January 2009 January 2013
29,000,000 (1,750,000) 27,250,000 2.73 2.65 4.17 – 4.34 10 March 2009 March 2010 March 2009 March 201382,740,000 (1,140,000) 81,600,000 2.73 2.65 4.13 – 4.34 2 July 2010 July 2013 January 2011 July 201510,000,000 – 10,000,000 3.50 3.47 – 21 December 2010 August 2013 August 2011 August 2015
1,000,000 – 1,000,000 3.53 3.53 – 8 March 2011 March 2014 March 2012 March 20163,000,000 (250,000) 2,750,000 3.66 3.66 4.22 14 April 2011 April 2013 April 2012 April 2016
Total 161,815,000 (4,615,000) 157,200,000(i)
(i) The number of outstanding share options vested and exercisable at 30 June 2012 was 125,740,000.
Further information regarding MPIC’s share option scheme has been set out on pages 163 to 165 of the Company’s 2012 Annual Report.

Interim Report 2013 59
Notes to the Condensed Interim Consolidated Financial Statements
20. Related Party TransactionsSignificant related party transactions entered into by the Group during the period are disclosed as follows:
(A) Asia Link B.V. (ALBV), a wholly-owned subsidiary company of the Company, has a technical assistance agreement with Smart Communications, Inc. (Smart), a wholly-owned subsidiary company of PLDT, for ALBV to provide Smart with technical support services and assistance in the operations and maintenance of cellular mobile telecommunications services for a period of four years from 23 February 2012, subject to renewal upon mutual agreement between the parties. The agreement provides for payments of technical service fees equivalent to 0.5% (2012: 0.5%) of the consolidated net revenue of Smart.
The fees under the above arrangement amounted to Pesos 142 million (US$3.4 million) for the period ended 30 June 2013 (2012: Pesos 188 million or US$4.4 million). At 30 June 2013, the outstanding technical service fee payable amounted to Pesos 333 million (US$7.7 million) (31 December 2012: Pesos 252 million or US$6.1 million).
(B) In October 2012, the Company agreed to provide Philex an aggregate loan facility of up to US$200 million by installment, principally for financing Philex’s capital expenditure of its Silangan project and Padcal mine, and for general working capital purposes. During November 2012 to March 2013, the Company, through certain indirect wholly-owned subsidiary companies, entered into loan agreements of Pesos 2.1 billion (US$48.6 million) and US$150 million with Philex. The loans made under these loan agreements are unsecured, with an interest rate at 5% per annum and 1% of facility fee on the total amount, and are repayable within one year after drawdown. Philex has drawn down loans of Pesos 2.1 billion (US$48.6 million) and US$80 million under these loan agreements during November 2012 to March 2013 (equivalent to approximately US$128.6 million), respectively, which remained outstanding at 30 June 2013 (31 December 2012: Pesos 1.1 billion (US$26.8 million)) and included in current accounts receivable, other receivables and prepayments.
(C) On 5 April 2013, ALBV sold 9.6 million of Pitkin Petroleum Plc shares to Philex Petroleum Corporation for a total consideration of US$7.2 million.
(D) In March 2013, Meralco PowerGen, through its wholly-owned subsidiary company, MPG Asia Limited, provided a loan of US$110 million to FPM Power. The loan is unsecured, interest free and have no fixed term of repayment. The loan of US$110 million remained outstanding at 30 June 2013 and included in accounts payable, other payables and accruals.
(E) At 30 June 2013, Petronas, the 30% shareholder of PacificLight has outstanding loans due from PacificLight of S$55.1 million (US$43.5 million) and US$35.9 million, equivalent to approximately US$79.4 million, which have been included in non-current deferred liabilities, provisions and payables (Note 15). The loans are unsecured, subject to a variable London Interbank Offered Rate and Singapore Swap Offer Rate, which are payable semi-annually. The tenor for each loan is 10 years with principal repayment commencing on 31 December 2014. During April 2013 to June 2013, Petronas earned interest income of S$1.5 million (US$1.2 million) from PacificLight. At 30 June 2013, PacificLight has approximately US$42,000 of outstanding interest payable due to Petronas which has been included in accounts payable, other payables and accruals.
(F) At 30 June 2013, Mr. Robert C. Nicholson, a Director of the Company, owned US$400,000 (31 December 2012: US$400,000) of bonds due 2017 issued by FPMH Finance Limited, US$200,000 (31 December 2012: US$200,000) of bonds due 2020 issued by FPT Finance Limited and US$600,000 (31 December 2012: US$600,000) of bonds due 2019 issued by FPC Finance Limited, all of which are wholly owned subsidiary companies of the Company. For the period ended 30 June 2013, Mr. Nicholson received interest income of US$39,125 (2012: US$21,125) on these bonds.
(G) At 30 June 2013, Mr. Edward A. Tortorici, a Director of the Company, owned US$600,000 (31 December 2012: US$600,000) of bonds due 2019 issued by FPC Finance Limited, a wholly-owned subsidiary company of the Company. For the period ended 30 June 2013, Mr. Tortorici received interest income of US$18,000 (2012: Nil) on these bonds.

First Pacifi c Company Limited60
Notes to the Condensed Interim Consolidated Financial Statements
(H) Key Management Personnel Compensation
Consolidated
For the six months ended 30 JuneUS$ millions
2013 2012
Non-performance based
– Salaries and benefits 28.9 26.2 – Pension contributions 0.9 0.8
Performance based – Bonuses and long-term monetary incentive awards 26.7 22.4
Equity-settled share option expense 4.7 1.6Fees 0.4 0.1 Total 61.6 51.1
(I) In December 2012, ICBP, a subsidiary company of Indofood, entered into a conditional sales and purchase agreement with AIBM, an associated company of Indofood, for the sale of a parcel of land for a total consideration of Rupiah 42 billion (US$4.2 million). During December 2012 and January 2013, AIBM paid a deposit of Rupiah 4 billion (US$0.4 million) and the remaining amount of Rupiah 38 billion (US$3.8 million), respectively, to ICBP in connection with this transaction.
(J) In the ordinary course of business, Indofood has engaged in trade transactions with certain of its associated companies, joint ventures and affiliated companies under certain framework agreements which are related to the Salim Family either through its control or joint control. Mr. Anthoni Salim is the Chairman and a substantial shareholder of the Company and is the President Director and Chief Executive Officer of Indofood.
All significant transactions with related parties, whether or not conducted under normal terms and conditions similar to those with non-related parties, are disclosed as follows:
Nature of Transactions Consolidated
For the six months ended 30 June 2013 2012US$ millions Income Statement ItemsSales of finished goods
– to associated companies and joint ventures 40.3 34.8 – to affiliated companies 35.9 42.3
Purchases of raw materials – from associated companies and joint ventures 55.8 46.7 – from affiliated companies 14.5 17.7
Management and technical services fee income and royalty income – from associated companies and joint ventures 1.5 1.2 – from affiliated companies 7.2 6.8
Insurance expenses – to affiliated companies 2.6 2.3
Rental expenses – to affiliated companies 1.1 0.6
Transportation and pump services expenses – to affiliated companies 0.2 0.3
Approximately 3% (2012: 3%) of Indofood’s sales and 3% (2012: 3%) of its purchases were transacted with these related parties.
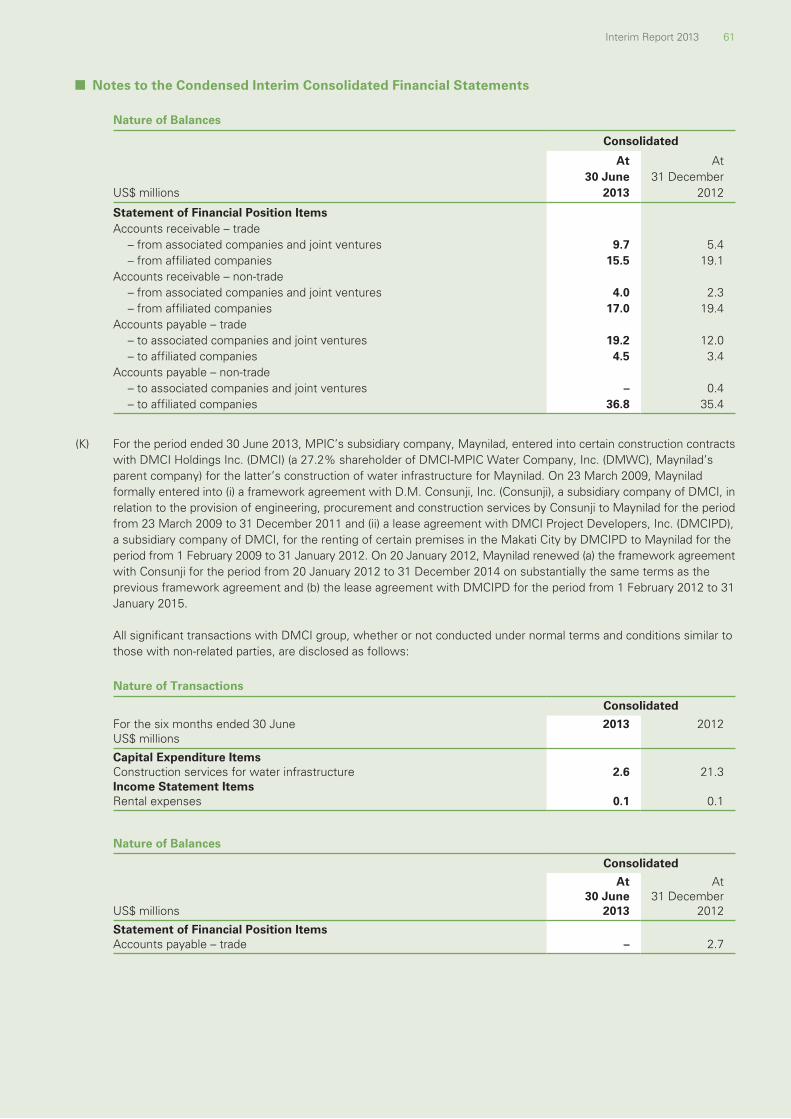
Interim Report 2013 61
Notes to the Condensed Interim Consolidated Financial Statements
Nature of Balances Consolidated
US$ millions
At30 June
2013
At31 December
2012 Statement of Financial Position ItemsAccounts receivable – trade
– from associated companies and joint ventures 9.7 5.4 – from affiliated companies 15.5 19.1
Accounts receivable – non-trade – from associated companies and joint ventures 4.0 2.3 – from affiliated companies 17.0 19.4
Accounts payable – trade – to associated companies and joint ventures 19.2 12.0 – to affiliated companies 4.5 3.4
Accounts payable – non-trade – to associated companies and joint ventures – 0.4 – to affiliated companies 36.8 35.4
(K) For the period ended 30 June 2013, MPIC’s subsidiary company, Maynilad, entered into certain construction contracts with DMCI Holdings Inc. (DMCI) (a 27.2% shareholder of DMCI-MPIC Water Company, Inc. (DMWC), Maynilad’s parent company) for the latter’s construction of water infrastructure for Maynilad. On 23 March 2009, Maynilad formally entered into (i) a framework agreement with D.M. Consunji, Inc. (Consunji), a subsidiary company of DMCI, in relation to the provision of engineering, procurement and construction services by Consunji to Maynilad for the period from 23 March 2009 to 31 December 2011 and (ii) a lease agreement with DMCI Project Developers, Inc. (DMCIPD), a subsidiary company of DMCI, for the renting of certain premises in the Makati City by DMCIPD to Maynilad for the period from 1 February 2009 to 31 January 2012. On 20 January 2012, Maynilad renewed (a) the framework agreement with Consunji for the period from 20 January 2012 to 31 December 2014 on substantially the same terms as the previous framework agreement and (b) the lease agreement with DMCIPD for the period from 1 February 2012 to 31 January 2015.
All significant transactions with DMCI group, whether or not conducted under normal terms and conditions similar to those with non-related parties, are disclosed as follows:
Nature of Transactions Consolidated
For the six months ended 30 June 2013 2012US$ millions Capital Expenditure ItemsConstruction services for water infrastructure 2.6 21.3Income Statement ItemsRental expenses 0.1 0.1
Nature of Balances Consolidated
At At30 June 31 December
US$ millions 2013 2012 Statement of Financial Position ItemsAccounts payable – trade – 2.7

First Pacifi c Company Limited62
Notes to the Condensed Interim Consolidated Financial Statements
(L) For the period ended 30 June 2013, MPIC’s subsidiary company, MNTC, collected toll fees through TMC, an associated company of MPIC.
All significant transactions with TMC, whether or not conducted under normal terms and conditions similar to those with non-related parties, are disclosed as follows:
Nature of Transactions Consolidated
For the six months ended 30 June 2013 2012US$ millions Income Statement ItemsOperator’s fee 18.7 16.7Management income 0.8 0.5Guarantee income 0.3 0.3Interest income 0.1 0.1
Nature of Balances Consolidated
US$ millions
At30 June
2013
At31 December
2012 Statement of Financial Position ItemsAccounts receivable – trade 4.2 4.3Accounts payable – trade 7.6 7.9
(M) For the period ended 30 June 2013, MPIC and its subsidiary companies were charged for electricity expenses by Meralco, an associated company of a Group’s joint venture.
All significant transactions with Meralco, whether or not conducted under normal terms and conditions similar to those with non-related parties, are disclosed as follows:
Nature of Transactions Consolidated
For the six months ended 30 June 2013 2012US$ millions Income Statement ItemsElectricity expenses 10.8 10.3
Nature of Balances Consolidated
At At30 June 31 December
US$ millions 2013 2012 Statement of Financial Position ItemsAccounts receivable – trade 0.7 0.1Accounts payable – trade 0.4 1.7
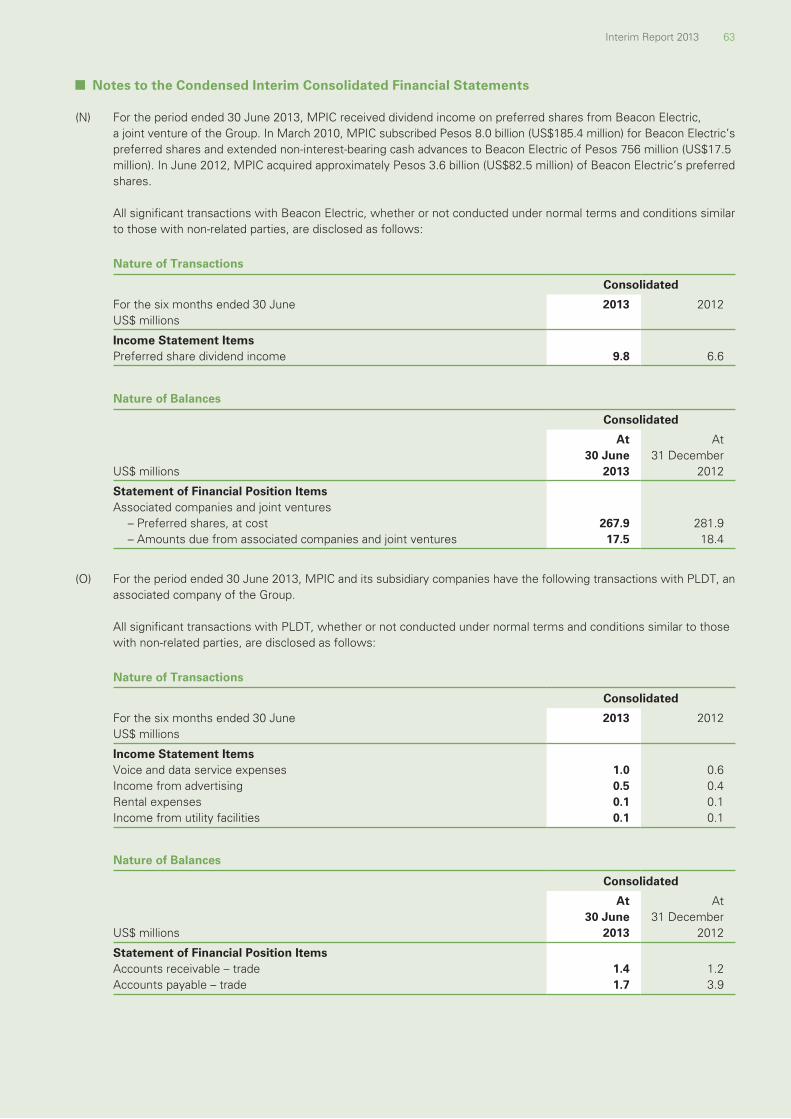
Interim Report 2013 63
Notes to the Condensed Interim Consolidated Financial Statements
(N) For the period ended 30 June 2013, MPIC received dividend income on preferred shares from Beacon Electric, a joint venture of the Group. In March 2010, MPIC subscribed Pesos 8.0 billion (US$185.4 million) for Beacon Electric’s preferred shares and extended non-interest-bearing cash advances to Beacon Electric of Pesos 756 million (US$17.5 million). In June 2012, MPIC acquired approximately Pesos 3.6 billion (US$82.5 million) of Beacon Electric’s preferred shares.
All significant transactions with Beacon Electric, whether or not conducted under normal terms and conditions similar to those with non-related parties, are disclosed as follows:
Nature of Transactions Consolidated
For the six months ended 30 June 2013 2012US$ millions Income Statement ItemsPreferred share dividend income 9.8 6.6
Nature of Balances Consolidated
At At30 June 31 December
US$ millions 2013 2012 Statement of Financial Position ItemsAssociated companies and joint ventures
– Preferred shares, at cost 267.9 281.9 – Amounts due from associated companies and joint ventures 17.5 18.4
(O) For the period ended 30 June 2013, MPIC and its subsidiary companies have the following transactions with PLDT, an associated company of the Group.
All significant transactions with PLDT, whether or not conducted under normal terms and conditions similar to those with non-related parties, are disclosed as follows:
Nature of Transactions Consolidated
For the six months ended 30 June 2013 2012US$ millions Income Statement ItemsVoice and data service expenses 1.0 0.6Income from advertising 0.5 0.4Rental expenses 0.1 0.1Income from utility facilities 0.1 0.1
Nature of Balances Consolidated
At At30 June 31 December
US$ millions 2013 2012 Statement of Financial Position ItemsAccounts receivable – trade 1.4 1.2Accounts payable – trade 1.7 3.9

First Pacifi c Company Limited64
Notes to the Condensed Interim Consolidated Financial Statements
21. Financial Instruments(A) Financial Instruments by Category
(a) Financial Assets
US$ millionsLoans and
receivablesAvailable-for-sale financial assets
At30 June
2013Total
Accounts and other receivables (Non-current) 30.8 – 30.8Available-for-sale assets (Non-current) – 174.3 174.3Pledged deposits 11.1 – 11.1Other non-current assets 56.0 – 56.0Cash and cash equivalents 1,808.2 – 1,808.2Restricted cash 73.6 – 73.6Available-for-sale assets (Current) – 75.4 75.4Accounts and other receivables (Current) 849.2 – 849.2 Total 2,828.9 249.7 3,078.6
(b) Financial Liabilities
US$ millions
Financialliabilities at
amortized cost
Financialliabilities at
fair value
At30 June
2013Total
Accounts payable, other payables and accruals 1,192.2 – 1,192.2Short-term borrowings 1,137.1 – 1,137.1Current portion of deferred liabilities, provisions and payables 28.5 6.9 35.4Long-term borrowings 4,097.5 – 4,097.5Deferred liabilities, provisions and payables 269.3 – 269.3 Total 6,724.6 6.9 6,731.5
At 30 June 2013, there were US$6.9 million of derivative liabilities measured at fair value included in deferred liabilities, provisions and payables.
(B) Fair Values of Financial InstrumentsThe fair values of the financial assets and liabilities are determined as the price that would be received to sell an asset or paid to transfer a liability in an orderly transaction between market participants at the measurement date. The following methods and assumptions were used to estimate the fair value of each class of financial instruments:
• Fair values of cash and cash equivalents, pledged deposits, restricted cash, current accounts and other receivables, accounts payable, other payables and accruals, short-term borrowings and other current liabilities approximate to their carrying amounts largely due to the short-term maturities of these instruments.
• Fair values of non-current accounts and other receivables and other assets are evaluated based on the discounted values of future cash flows using the interest rates that are specific to the tenor of the instruments’ cash flows.
• Fair value of available-for-sale assets is derived from quoted market prices in active markets, if available.
• Fair value of unquoted available-for-sale assets are measured by reference to the most recent transaction prices or carried at cost less any accumulated impairment losses.

Interim Report 2013 65
Notes to the Condensed Interim Consolidated Financial Statements
• Long-term borrowings with fixed interest rates and other non-current financial liabilities are evaluated based on the discounted value of future cash flows using the prevailing market rates for similar types of liabilities. Long-term borrowings with variable interest rates approximate to their carrying amounts because of regular repricing based on market conditions.
• Derivative assets/liabilities in respect of derivative financial instruments, such as interest rate swaps and foreign exchange forward contracts, are valued using valuation techniques with market observable inputs. The most frequently applied valuation techniques include forward pricing and swap models, using present value calculations of future cash flows. The models incorporate various inputs including the foreign exchange spot and forward rates and interest rate curves.
The following table shows a comparison between the carrying amounts and fair values of the Group’s financial instruments with carrying amounts not equal or reasonably approximating to their fair values at 30 June 2013. The Group’s financial instruments with carrying amounts equal or reasonably approximating to their fair values and unquoted available-for-sale assets that are measured at cost less any accumulated impairment losses at 30 June 2013 are not included in this table.
At 30 June 2013
US$ millionsCarryingamount
Fairvalue
Financial Assets/LiabilitiesAccounts receivables and other receivables (Non-current) 30.8 36.8Long-term borrowings 4,097.5 4,206.1Deferred liabilities, provisions and payables (Non-current) (269.3) (346.4) Net Amount 3,859.0 3,896.5
(C) Fair Value HierarchyThe Group uses the following hierarchy for determining and disclosing the fair values of financial instruments:
• Level 1: fair values measured based on quoted prices (unadjusted) in active markets for identical assets or liabilities.
• Level 2: fair values measured based on valuation techniques for which all inputs which have a significant effect on the recorded fair values are observable, either directly or indirectly.
• Level 3: fair value measured based on valuation techniques for which any inputs which have a significant effect on the recorded fair values that are not based on observable market data (unobservable inputs).
The Group held the following financial instruments measured at fair value at the end of the period:
US$ millions Level 1 Level 2 Level 3
At30 June
2013Total
Available-for-sale assets – Listed equity investments 74.6 – – 74.6 – Listed debentures 15.0 – – 15.0 – Unlisted investments – 2.4 – 2.4
Derivative liabilities(i) – (6.9) – (6.9) Net Amount 89.6 (4.5) – 85.1 (i) Included within deferred liabilities, provisions and payables

First Pacifi c Company Limited66
Notes to the Condensed Interim Consolidated Financial Statements
The fair value of unlisted investments and derivative liabilities in Level 2 are measured by reference to the most recent transaction prices and using the valuation techniques as described in Note 21(B) to the condensed interim consolidated financial statements, respectively.
For financial instruments that are recognized at fair value on a recurring basis, the Group determines whether transfers have occurred between Levels in the hierarchy by re-assessing categorization (based on the lowest level input that is significant to the fair value measurement as a whole) at the end of each reporting period. During the period, there were no transfers between Level 1 and Level 2 fair value measurements, whereas in the Level 3 fair value measurements, the unlisted investments measured at cost less impairment provisions are no longer included and unlisted investments measured at fair value by reference to the most recent transaction prices have been reclassified to Level 2 fair value measurement.
22. Events after Reporting Period(A) On 27 May 2013, the Company announced its proposal to raise not less than approximately HK$3,883.3 million
(approximately US$500 million) before expenses, by way of a fully underwritten rights issue with a subscription ratio of one rights share for every eight existing shares held at a subscription price of HK$8.10 per one rights share. The rights issue was completed in July 2013 which increased First Pacific’s number of shares issued from 3,842 million to 4,322 million. The Company raised net proceeds of approximately HK$3,853.2 million (approximately US$494 million). First Pacific intends to apply the net proceeds of the rights issue principally to finance potential acquisitions and strategic investments and, for any residual balance, for general corporate purpose.
(B) Indofood, a 50.1%-owned subsidiary company of the Group, has a 29.3% interest in CMFC, a company listed on the Singapore Stock Exchange, acquired at investment costs of approximately US$161.9 million.
CMFC issued a statement referring to a report from Glaucus Research Group regarding certain affairs of CMFC and stating it was in the process of reviewing the report and will provide its response shortly. The report has caused a substantial (48%) decrease in the share price of CMFC on 26 August 2013, and CMFC suspended trading of its shares.
Indofood is awaiting the response from CMFC and will inform the market of any further developments if deemed necessary.
23. Comparative AmountsAs explained in Note 1(B) to the condensed interim consolidated financial statements, due to the changes in the Group’s accounting policies for obligations for defined benefit pension plans and other employee benefits following its change in accounting policy in the second half of 2012 and its adoption of HKAS 19 (2011) “Employee Benefits” with effect from 1 January 2013, certain prior year adjustments have been made and certain comparative amounts have been restated to conform with the current period’s accounting treatments and presentation. In addition, the earnings per share information for the six months ended 30 June 2012 have been adjusted retrospectively to reflect the effects of the Company’s rights issue completed subsequent to the end of the reporting period in July 2013.
24. Approval of the Condensed Interim Consolidated Financial StatementsThe condensed interim consolidated financial statements of the Company were approved and authorized for issue by the Board of Directors on 28 August 2013.

Review Report of the Independent Auditors
Interim Report 2013 67
To the Board of Directors of First Pacific Company Limited(Incorporated in Bermuda with limited liability)
IntroductionWe have reviewed the condensed interim consolidated financial statements set out on pages 39 to 66, which comprise the condensed consolidated statement of financial position of First Pacific Company Limited as at 30 June 2013 and the related condensed consolidated statements of income, comprehensive income, changes in equity and cash flows for the six-month period then ended, and explanatory notes. The Rules Governing the Listing of Securities on The Stock Exchange of Hong Kong Limited require the preparation of a report on condensed interim consolidated financial information to be in compliance with the relevant provisions thereof and Hong Kong Accounting Standard 34 “Interim Financial Reporting” (HKAS 34) issued by the Hong Kong Institute of Certified Public Accountants.
The Directors are responsible for the preparation and presentation of these condensed interim consolidated financial statements in accordance with HKAS 34. Our responsibility is to express a conclusion on these condensed interim consolidated financial statements based on our review. Our report is made solely to you, as a body, in accordance with our agreed terms of engagement, and for no other purpose. We do not assume responsibility towards or accept liability to any other person for the contents of this report.
Scope of ReviewWe conducted our review in accordance with Hong Kong Standard on Review Engagements 2410 “Review of Interim Financial Information Performed by the Independent Auditor of the Entity” issued by the Hong Kong Institute of Certified Public Accountants. A review of interim financial information consists of making inquiries, primarily of persons responsible for financial and accounting matters, and applying analytical and other review procedures. A review is substantially less in scope than an audit conducted in accordance with Hong Kong Standards on Auditing and consequently does not enable us to obtain assurance that we would become aware of all significant matters that might be identified in an audit. Accordingly, we do not express an audit opinion.
ConclusionBased on our review, nothing has come to our attention that causes us to believe that the condensed interim consolidated financial statements are not prepared, in all material respects, in accordance with HKAS 34.
ERNST & YOUNGCertified Public Accountants
22/F CITIC Tower1 Tim Mei AvenueCentral, Hong Kong
28 August 2013

Review Statement of the Audit Committee
First Pacifi c Company Limited68
In accordance with the requirements of paragraph 39 of Appendix 16 of the Listing Rules issued by SEHK, the Audit Committee has reviewed the Interim Report for the six months ended 30 June 2013, including the accounting policies and practices adopted by the Group. The Audit Committee also has discussed auditing, internal control, risk management, and financial reporting matters with the Company’s management and its external auditors. The Company’s external auditors were engaged by the Audit Committee to perform a review of the unaudited condensed interim consolidated financial statements for the six months ended 30 June 2013. The Review Report of the Independent Auditors is set out on page 67.

Corporate Governance Report
Interim Report 2013 69
Corporate Governance PracticesFirst Pacific is committed to building and maintaining high standards of corporate governance. Throughout the six months ended 30 June 2013, First Pacific has applied the principles and complied with all Code Provisions as contained in its own Corporate Governance Code (the First Pacific Code), which incorporates the principles and requirements set out in the Corporate Governance Code (Appendix 14 of the Listing Rules), where appropriate, with the exception of Code Provision A.6.8, as one of our Non-executive Directors, Mr. Tedy Djuhar was unable to attend the Company’s annual general meeting held on 30 May 2013 due to important engagements.
On 28 August 2013, the Board adopted the Policy on Board Diversity and made relevant amendments to the First Pacific Code. The Company’s corporate governance information can be found in the Corporate Governance section of the Company’s website.
Compliance of the Model Code for Securities Transactions by Directors of Listed IssuersThe Company has adopted its own Model Code for Securities Transactions by Directors (the Model Code) on terms no less exacting than the required standards of the Model Code for Securities Transactions by Directors of Listed Issuers, as set out in Appendix 10 of the Listing Rules. All Directors have confirmed, following specific enquiries by the Company, that they have complied with the required standards set out in the Model Code throughout the six months ended 30 June 2013.
Continuing Connected TransactionsDuring the period, in relation to the following continuing connected transactions, the Directors (including the Independent Non-executive Directors) approved the transactions and their disclosure in the form of a published announcement:
• 6 May 2013 announcement: Following the acquisition of a majority interest in PT Indomobil Sukses Internasional Tbk (Indomobil) and its subsidiaries by an associate of Mr. Anthoni Salim, Indomobil has become an associate of Mr. Anthoni Salim and, thus, a connected person of the Company. Indomobil has, prior to completion of the acquisition, entered into transactions with Indofood group in connection with the sale and rental of vehicles, provision of vehicle services and sale of spare parts to Indofood group. As a result of the acquisition, prior transactions between Indomobil and the Indofood group have become continuing connected transactions of the Company and are required to be disclosed pursuant to the Listing Rule requirements.
Internal Control and Risk ManagementThe Board is responsible for maintaining an adequate system of internal controls in the Group and reviewing their effectiveness through the Audit Committee.
During the period ended 30 June 2013, the Audit Committee reviewed and advised that:
• The internal controls and accounting systems of the Group function effectively and are designed to provide reasonable assurance that material assets are protected, business risks attributable to the Group are identified and monitored, material transactions are executed in accordance with management’s authorization and the financial statements are reliable for publication and compliant with all relevant laws and regulations.
• There are processes in place for identifying, evaluating and managing the material business risks faced by the Group. Such processes are incorporated in all the Group’s businesses.
• There are adequate resources, qualified and experienced staff, training programs and budget for the Group’s accounting and financial reporting function.

Interests of Directors and Substantial Shareholders
First Pacifi c Company Limited70
Interests of Directors in the Company and its Associated CorporationsAs at 30 June 2013, the interests and short positions of the Directors and chief executive of the Company in the shares of the Company, underlying shares and debentures of the Company or any of its associated corporation (within the meaning of Part XV of the Securities and Futures Ordinance (Chapter 571 of the Laws of Hong Kong) (SFO)) which (a) were recorded in the register required to be kept under section 352 of Part XV of the SFO; or (b) were notified to the Company and SEHK pursuant to the Model Code as adopted by the Company were as follows:
(A) Long Positions in Shares in the Company
Name Ordinary shares
Approximatepercentage of
issued sharecapital (%)
Ordinaryshare
options Anthoni Salim 1,940,556,038(C)(i)(ii) 44.90(ii) –Manuel V. Pangilinan 54,890,768(P) 1.27 29,098,934Edward A. Tortorici 37,274,149(P) 0.86 15,121,000Robert C. Nicholson 14,528(P) 0.00 29,958,388Benny S. Santoso – – 2,815,719Graham L. Pickles – – 2,473,000Prof. Edward K.Y. Chen, GBS, CBE, JP – – 4,816,113Napoleon L. Nazareno – – 4,403,000Margaret Leung Ko May Yee, SBS, JP – – 1,773,000Philip Fan Yan Hok – – 1,773,000
(C) = Corporate interest, (P) = Personal interest
(i) Anthoni Salim indirectly owns 100% of First Pacific Investments (B.V.I.) Limited. His indirect interests in First Pacific Investments (B.V.I.) Limited are held through Salerni International Limited (a company of which Anthoni Salim directly holds 100% of the issued share capital). First Pacific Investments (B.V.I.) Limited and Salerni International Limited are interested in 633,186,599 shares and 517,140,075 shares(ii) respectively in the Company. Anthoni Salim also owns 56.8% of First Pacific Investments Limited which, in turn, is interested in 790,229,364 shares in the Company. Of this, 10.0% is held by Anthoni Salim directly, and 46.8% by Salerni International Limited. The remaining 43.2% interest in First Pacific Investments Limited is owned as to 30.0% by Sutanto Djuhar (a former Non-executive Director of the Company), 10.0% by Tedy Djuhar (a Non-executive Director of the Company) and 3.2% by a company controlled by the estate of the late Ibrahim Risjad (a former Non-executive Director of the Company).
(ii) For the purposes of Part XV of the SFO, as at 30 June 2013, Anthoni Salim is deemed to be interested in (1) 213,488,391 rights shares provisionally allotted to him and/or his associates which he has undertaken to subscribe or procure subscription for and (2) 19,160,493 excess rights shares which he has undertaken to apply or procure application to be made for, in connection with the rights issue announced by the Company on 27 May 2013. Accordingly, his approximate percentage holding is calculated based on the total issued share capital of the Company as enlarged by the rights issue.
On 11 July 2013, the Company received notices from Anthoni Salim that following completion of the rights issue, Anthoni Salim was interested in 1,925,474,957 shares in the Company, through his interests in Salerni International Limited, First Pacific Investments (B.V.I.) Limited and First Pacific Investments Limited, representing approximately 44.55% of the Company’s issued share capital as at that date. The total number of issued shares of the Company after completion of the rights issue in July 2013 was 4,321,754,110.
(B) Long positions in Shares in associated corporations• Manuel V. Pangilinan owned 21,342,404 common shares(P) (0.08%)* in MPIC, 229,033 common shares(P)
(0.11%)* in PLDT as beneficial owner and a further 15,417 common shares (less than 0.01%)* in PLDT as nominee, 4,655,000 common shares(P) (0.09%)* in Philex, 891,250 common shares(P) (0.05%)* in Philex Petroleum, as well as 25,000 common shares(P) (less than 0.01%)* in Meralco.
• Edward A. Tortorici owned 69,596 common shares(C) and 10,660,000 common shares(P) (collectively 0.04%)* in MPIC, 104,874 common shares(P) (0.05%)* in PLDT, 3,285,100 common shares(P) (0.07%)* as well as 1,515,000 share options in Philex, and 37,512 common shares(P) (less than 0.01%)* in Philex Petroleum as well as US$600,000 of bonds due 2019 issued by FPC Finance Limited, which is a wholly-owned subsidiary of the Company.
• Robert C. Nicholson owned 1,250 common shares(P) (less than 0.01%)* and 3,750,000 share options in Philex, 156 common shares(P) (less than 0.01%)* in Philex Petroleum, 10,000,000 share options in MPIC, as well as US$400,000 of bonds due 2017 issued by FPMH Finance Limited, US$200,000 of bonds due 2020 issued by FPT Finance Limited and US$600,000 of bonds due 2019 issued by FPC Finance Limited, all of which are wholly-owned subsidiaries of the Company.
• Tedy Djuhar owned 15,520,335 ordinary shares(C) (0.18%)* in Indofood.• Anthoni Salim owned 1,329,770 ordinary shares(P) (0.02%)* in Indofood and an indirect interest of
4,396,103,450 Indofood shares (50.07%)* through the Company’s group companies, a direct interest of 2,007,788 shares(C) (0.14%)* in IndoAgri through his controlled corporations other than the Company and an indirect interest of 1,018,200,000 IndoAgri shares (70.99%)* through the Company’s group companies and a direct interest of 20,483,364 shares (0.13%)* in SIMP through his controlled corporations other than the Company and an indirect interest of 12,448,625,000 SIMP shares (78.71%)* through the Company’s group companies.
• Napoleon L. Nazareno owned 6,648 common shares(P) (less than 0.01%)* in MPIC, 19,927 common shares(P) (less than 0.01%)* in PLDT as well as 110,000 common shares(P) (0.01%)* in Meralco.
(P) = Personal interest, (C) = Corporate interest
* Approximate percentage of the issued capital of the respective class of shares in the respective associated corporations as at 30 June 2013

Interim Report 2013 71
Interests of Directors and Substantial Shareholders
Save for those disclosed above, as at 30 June 2013, none of the Directors and chief executive of the Company had any interests or short positions in respect of shares, underlying shares or debentures of the Company or any of its associated corporations (within the meaning of Part XV of the SFO) as recorded in the register required to be kept under Section 352 of the SFO, or as otherwise notified to the Company pursuant to the Model Code.
Interests of Substantial Shareholders in the CompanyThe interests and short positions of substantial shareholders in the shares and underlying shares of the Company as at 30 June 2013 as recorded in the register required to be kept under Section 336 of the SFO are set out below:
(a) Salerni International Limited (Salerni), which was incorporated in the British Virgin Islands, was interested in 1,940,556,038 ordinary shares# of the Company (long position) at 30 June 2013, representing approximately 44.90% of the Company’s issued share capital (as enlarged by the rights issue) at that date, by way of its interest in 517,140,075 ordinary shares of the Company and also its 46.80% interest in First Pacific Investments Limited (FPIL-Liberia) and 100% interest in First Pacific Investments (B.V.I.) Limited (FPIL-BVI). Anthoni Salim, Chairman of the Company, beneficially owns the entire issued share capital of Salerni and, accordingly, is taken to be interested in the shares owned by Salerni.
(b) FPIL-Liberia, which was incorporated in the Republic of Liberia, beneficially owned 790,229,364 ordinary shares as at 30 June 2013, representing approximately 18.28% of the Company’s issued share capital (as enlarged by the rights issue) at that date. FPIL-Liberia is owned by Anthoni Salim (Chairman of the Company) and Tedy Djuhar (a Non-executive Director of the Company), the estate of the late Ibrahim Risjad (a former Non-executive Director of the Company) and Sutanto Djuhar (a former Non-executive Director of the Company), in the proportion specified in note (i) of the table on page 70. Anthoni Salim, Chairman of the Company, is taken to be interested in the shares owned by FPIL-Liberia.
(c) FPIL-BVI, which was incorporated in the British Virgin Islands, beneficially owned 633,186,599 ordinary shares as at 30 June 2013, representing approximately 14.65% of the Company’s issued share capital (as enlarged by the rights issue) at that date. Anthoni Salim, Chairman of the Company, beneficially owns the entire issued share capital of FPIL-BVI and, accordingly, is taken to be interested in the shares owned by FPIL-BVI.
(d) Lazard Asset Management LLC (Lazard), a United States incorporated company, notified the Company that it held 301,481,399 ordinary shares of the Company as at 26 June 2013, representing approximately 7.84% of the Company’s issued share capital at that time. As at 30 June 2013, the Company has not received any other notification from Lazard of any change to such holding.
(e) HSBC Holdings plc, incorporated as a public limited company in England, notified the Company that it and its controlled corporations were interested in a long position in 260,157,400 ordinary shares of the Company as at 27 May 2013, representing approximately 5.89% of the Company’s issued share capital (as enlarged by the rights issue) at that date, which includes the maximum number of Rights Shares underwritten by HSBC pursuant to the Underwriting Agreement. As at 30 June 2013, the Company has not received any other notification from HSBC Holdings plc of any change to such interests.##
# For the purposes of Part XV of the SFO, as at 30 June 2013, Salerni is deemed to be interested in (1) 213,488,391 rights shares provisionally allotted to Anthoni Salim and/or his associates which Anthoni Salim has undertaken to subscribe or procure subscription for and (2) 19,160,493 excess rights shares which Anthoni Salim has undertaken to apply or procure application to be made for, in connection with the rights issue announced by the Company on 27 May 2013. Accordingly, Salerni’s approximate percentage holding is calculated based on the total issued share capital of the Company as enlarged by the rights issue.
On 11 July 2013, the Company received notices from Anthoni Salim that following completion of the rights issue, Anthoni Salim was interested in 1,925,474,957 shares in the Company, through his interests in Salerni, FPIL-BVI and FPIL-Liberia, representing approximately 44.55% of the Company’s issued share capital at that date. On 11 July 2013, Salerni also notified the Company that it held interests in 1,925,474,957 ordinary shares of the Company by way of its direct interest in 502,058,994 ordinary shares of the Company and its 46.80% interest in FPIL-Liberia and 100% interest in FPIL-BVI.
## On 15 July 2013, the Company received notice from HSBC Holdings plc that it held 4,649,495 ordinary shares of the Company, representing approximately 0.11% of the Company’s issued share capital as at that date.
Other than as disclosed above, the Company had not been notified of any person (other than Directors or chief executive of the Company) as at 30 June 2013 who had an interest or short position in the shares or underlying shares of the Company to be recorded in the register required to be kept under Section 336 of Part XV of the SFO.

Purchase, Sale or Redemption of Listed Securities
First Pacifi c Company Limited72
On 20 March 2012, the Company’s Directors approved a share repurchase program to spend, subject to the state of the financial markets, economic conditions affecting group companies and potential merger and acquisition opportunities, up to 10% of its annual recurring profit on share repurchases. Under this program, the Company has allocated approximately US$42.3 million, representing approximately 10% of the Group’s recurring profit of US$423.0 million in respect of the financial year ended 31 December 2011, to repurchase shares in the Company by way of “on-market” repurchases. In addition, the Company has allocated approximately 50% of US$36.0 million, representing approximately 10% of the Group’s recurring profit of US$360.0 million in respect of the financial year ended 31 December 2012, to repurchase shares in the Company by way of “on-market” repurchases during the period from 1 June 2013 to 31 May 2014.
During the period ended 30 June 2013, the Company repurchased 4,870,000 (2012: 37,020,000) ordinary shares on SEHK at an aggregate consideration of HK$47.6 million (US$6.1 million) (2012: HK$309.9 million or US$40.1 million). These shares have been subsequently cancelled. Details of the repurchases are summarized as follows:
Month of repurchases
Number ofordinary
shares
Purchase pricepaid per share
Aggregateconsideration
paidHighest Lowestrepurchased HK$ HK$ HK$ millions US$ millions
January 2013 200,000 9.00 8.98 1.8 0.2February 2013 3,800,000 9.74 9.68 36.9 4.8March 2013 870,000 10.18 10.10 8.9 1.1 Total 4,870,000 47.6 6.1
The repurchases were effected by the Directors with a view to benefiting the shareholders as a whole by enhancing the Company’s net assets and earnings per share.
Except as disclosed above, neither the Company, nor any of its subsidiary companies, has made any purchase, sale or redemption of any of the Company’s listed securities during the period.

Information for Investors
Interim Report 2013 73
Financial DiaryPreliminary announcement of
2013 interim results 28 August 2013Last day to register for interim dividend 11 September 2013Payment of interim dividend 24 September 2013Interim report posted to shareholders 24 September 2013Financial year-end 31 December 2013Preliminary announcement of 2013 results 19 March 2014*
* Subject to confirmation
Head Office24th Floor, Two Exchange Square8 Connaught PlaceCentral, Hong Kong SARTelephone : +852 2842 4388Fax : +852 2845 9243Email : [email protected]
Registered OfficeCanon’s Court22 Victoria StreetHamilton HM12, BermudaTelephone : +1 441 295 2244Fax : +1 441 292 8666
Web Sitewww.firstpacific.com
Share InformationFirst Pacific shares are listed on The Stock Exchange of
Hong Kong Limited and are traded over the counter in the United States in the form of American Depositary Receipts
Listing date : 12 September 1988Par value : U.S.1 cent per shareLot size : 2,000 sharesNumber of ordinary shares issued: 3,841,559,209
Stock CodesSEHK : 00142Bloomberg : 142 HKThomson Reuters : 0142.HK
American Depositary Receipts (ADRs) InformationLevel: 1ADRs Code: FPAFYCUSIP reference number: 335889200ADRs to ordinary shares ratio: 1:5ADRs depositary bank: Deutsche Bank Trust Company
Americas
To Consolidate ShareholdingsWrite to our principal share registrar and
transfer office in Bermuda at:Butterfield Fulcrum Group (Bermuda) Limited26 Burnaby StreetHamilton HM11, Bermuda
Or the Hong Kong branch registrar at:Computershare Hong Kong Investor Services Limited
Registrar Office17M Floor, Hopewell Centre183 Queen’s Road East, Wanchai, Hong Kong SARTelephone : +852 2862 8555Fax : +852 2865 0990/+852 2529 6087Email : [email protected]
Transfer OfficeShops 1712-1716, 17th Floor, Hopewell Centre183 Queen’s Road East, Wanchai, Hong Kong SAR
A Chinese Version of this Report, or Additional Information
Available at:www.firstpacific.com
Or contact:Sara CheungVice PresidentGroup Corporate CommunicationsFirst Pacific Company Limited24th Floor, Two Exchange Square8 Connaught PlaceCentral, Hong Kong SARTelephone : +852 2842 4317Fax : +852 2845 9243Email : [email protected]
AuditorsErnst & Young22nd Floor, CITIC Tower1 Tim Mei Avenue, Central, Hong Kong SAR
SolicitorsReed Smith Richards Butler20th Floor, Alexandra House16-20 Chater RoadCentral, Hong Kong SAR
GW & Associates in association withGibson, Dunn & Crutcher LLP
32nd Floor, Gloucester TowerThe Landmark, 15 Queen’s Road CentralHong Kong SAR
Principal BankersBank of America NACredit Agricole Corporate and Investment BankMalayan Banking BerhadMizuho Corporate Bank, Ltd.Standard Chartered Bank (Hong Kong) LimitedSumitomo Mitsui Banking CorporationThe Hongkong & Shanghai Banking CorporationBank of Philippine IslandsChina Banking CorporationMetropolitan Bank & Trust Company

Summary of Principal Investments
First Pacifi c Company Limited74
As at 30 June 2013
Philippine Long Distance Telephone CompanyPLDT (PSE: TEL; NYSE: PHI) is the leading telecommunications service provider in the Philippines. Its shares are listed on the Philippine Stock Exchange and its American Depositary Receipts are listed on the New York Stock Exchange. It has one of the largest market capitalizations among Philippine listed companies. Through its principal business groups, PLDT offers a wide range of telecommunications services: Wireless (principally through subsidiary companies, Smart Communications, Inc. and Digitel Mobile Philippines, Inc. (“Sun”)) and Fixed Line (principally through PLDT, ePLDT and Digital Telecommunications Philippines, Inc. (“Digitel”)). PLDT has developed the Philippines’ most extensive fiber optic backbone, and cellular and fixed line networks.
Sector : TelecommunicationsPlace of incorporation/business area : The PhilippinesOutstanding number of shares : 216.1 millionParticulars of outstanding shares held : Common shares of Pesos 5 par valueEconomic/voting interest : 25.6%/15.1%
Further information on PLDT can be found at www.pldt.com
Metro Pacific Investments CorporationMPIC (PSE: MPI; ADR code: MPCIY) is a Philippine-listed investment management and holding company focused on infrastructure development.
Sector : Infrastructure, Utilities and HospitalsPlace of incorporation/business area : The PhilippinesIssued number of shares : 24.6 billionParticulars of issued shares held : Common shares of Peso 1 par valueEconomic/voting interest : 55.8%/62.9%
Further information on MPIC can be found at www.mpic.com.ph
PT Indofood Sukses Makmur TbkIndofood (IDX: INDF) is a leading Total Food Solutions company with operations in all stages of food manufacturing from the production of raw materials and their processing through to consumer products and distribution to wholesalers/retailers. It is based and listed in Jakarta; Indofood’s Consumer Branded Products subsidiary PT Indofood CBP Sukses Makmur Tbk (“ICBP”) and agribusiness subsidiaries PT Salim Ivomas Pratama Tbk (“SIMP”) and PT PP London Sumatra Indonesia Tbk (“Lonsum”) are also listed in Jakarta. Another agribusiness subsidiary, Indofood Agri Resources Ltd. (“IndoAgri”), is listed in Singapore. Through its four complementary strategic business groups, Indofood manufactures and distributes a wide range of food products: Consumer Branded Products (“CBP”) (noodles, dairy, snack foods, food seasonings and nutrition and special foods), Bogasari (flour and pasta), Agribusiness (oil palm, rubber, sugar cane, cocoa and tea plantations, cooking oils, margarine and shortening) and Distribution.
Indofood is one of the world’s largest wheat flour instant noodle manufacturers by volume, one of the largest plantation companies by area and the largest flour miller in Indonesia. Indofood also has an extensive distribution network.
Sector : Consumer Food ProductsPlace of incorporation/business area : IndonesiaIssued number of shares : 8.8 billionParticulars of issued shares held : Shares of Rupiah 100 par valueEconomic and voting interests : 50.1%
Further information on Indofood can be found at www.indofood.com
Philex Mining CorporationPhilex (PSE: PX) is a Philippine-listed company engaged in the exploration and mining of mineral resources and, through a listed subsidiary Philex Petroleum Corporation, in oil and gas exploration.
Sector : Natural ResourcesPlace of incorporation/business area : The PhilippinesIssued number of shares : 4.9 billionParticulars of issued shares held : Common shares of Peso 1 par valueEconomic and voting interests : 31.2%*
* Two Rivers Pacific Holdings Corporation, a Philippine affiliate of First Pacific, holds an additional 15.0% economic and voting interests in Philex.
Further information on Philex can be found at www.philexmining.com.ph
FPM Power Holdings LimitedFPM Power controls PacificLight Power Pte Ltd., the operator of Singapore’s newest gas-fired power plant.
Sector : Infrastructure/UtilitiesPlace of incorporation/business area : British Virgin Islands/SingaporeIssued number of shares : 10,000Particulars of issued shares held : Shares of US$1 par valueEconomic/voting interest : 67.9%**/60.0%
** Includes a 7.9% effective economic interest in FPM Power held by First Pacific through its indirect interests in Meralco.

A Chinese version of this interim report is available at www.fi rstpacifi c.com or from the Company on request.
本中期報告之中文版可瀏覽 www.fi rstpacifi c.com 或向本公司索取。
Design and production : GenNex Financial Media Limited
24th Floor, Two Exchange Square
8 Connaught Place, Central, Hong Kong SAR
Tel : +852 2842 4388
Fax : +852 2845 9243
Email : info@fi rstpacifi c.com
Website : www.fi rstpacifi c.com