interim report - cisionmb.cision.com/main/302/9487630/175624.pdf · ework scandinavia ab 4 interim...
TRANSCRIPT

1eWork Scandinavia AB Interim report Q3 2013
Jul–Sep Jul–Sep Jan–Sep Jan–Sep Rolling 4 quarters Full year SEK million 2013 2012 2013 2012 Oct 2012–Sep 2013 2012
Net sales 775.8 768.8 2,661.9 2,515.8 3,671.1 3,525.1
Operating profit 6.0 13.7 33.3 43.6 51.6 61.9
Profit before tax 6.0 13.8 33.3 43.9 51.6 62.3
Profit after tax 4.8 10.5 25.8 32.8 39.8 46.7
Cash flow, operating activities 45.3 –30.2 –21.5 15.2 28.9 65.6
Operating margin, % 0.8 1.8 1.3 1.7 1.4 1.8
Equity/assets ratio, % 11.8 12.8 11.8 12.8 11.8 12.4
Earnings per share before dilution (SEK) 0.28 0.62 1.52 1.93 2.34 2.75
Earnings per share after dilution (SEK) 0.28 0.62 1.52 1.93 2.34 2.74
Max number of consultants on assignment 3,164 3,016 3,164 3,016 3,164 3,150
Average number of employees 153 148 154 149 154 150
Sales per employee (SEK thousand) 5,071 5,195 17,285 16,885 23,838 23,500
Net sales and operating profit
Operating profit (right)Net sales (left)
SEK million SEK million
2009 2010 2011 20132012
0
250
500
750
1,000
1,250
0
4
8
12
16
20
Q3Q2Q1Q4Q3Q2Q1Q4Q3Q2Q1Q4Q3Q2Q1Q4Q3Q2Q1
Order intakeSEK million
Q4Q3Q2Q1
0
500
1,000
1,500
2,000
2012201120102009201320122011201020092013201220112010200920132012201120102009
Interim ReportJanuary - September 2013
Third quarter 2013 compared with 2012• Net sales increased by 1 percent to SEK 775.8 million
(768.8).
• Operating profit decreased to SEK 6.0 million (13.7).
• Order intake amounted to SEK 845 million (731), a 16 percent increase.
• Profit after tax per share after dilution was SEK 0.28 (0.62).
• New framework agreements signed on accounts including Telenor in Sweden, the Swedish Migration Board and Swed-ish local government organisation SKL in the period.
• New MSP (managed service provider) deal signed with NASDAQ OMX.
• Extension of current MSP agreement with Sony Mobile Communications, eWork’s largest client.
• The fairly weak quarterly earnings are a result of hesitant demand and expenses for continued aggressive initiatives.
First nine months 2013 compared with 2012• Net sales increased by 6 percent to SEK 2,661.9 million
(2,515.8).
• Operating profit decreased to SEK 33.3 (43.6) million.
• Profit after tax per share after dilution was SEK 1.52 (1.93).
• Market demand remained hesitant, with relatively few new consultant appointments.
• eWork saw good demand for takeover business and MSP collaborations, which compensated for the effect of hesitant demand in volume terms.
• The growing share of MSP and takeover contracts in the sales mix, plus initial expenses associated with developing in these businesses explain the lower operating profit.

2eWork Scandinavia AB Interim report Q3 2013
CEO’s commentaryeWork continued to encounter a hesitant market in the quarter. A less advantageous sales mix and expenses for continued aggressive initiatives caused fairly weak earnings. However, order intake was positive, and eWork did achieve some growth in this quarter too, thanks to our successes in business that consolidates our clients’ consultant delivery.
We published several positive news items in the quarter, which corroborate our belief that we’ve developed an attrac-tive concept that creates clear value for our clients.
Sony Mobile Communications, our largest client, extended our collaboration agreement. This is an important milestone by being the first collaboration agreement where we have the capacity to apply a model for large-scale outsourcing of the client’s consultant delivery.
Now we’ve really proved that our concept satisfies expecta-tions of rationalisation, savings and quality improvements. We beat our targets for most control parameters, not least those applying to new consultant appointments.
We are also proud of having signed an MSP agreement with Nasdaq OMX. We’ll also be appointing a dedicated account team here, partly on-site with the client. This is the second major agreement in quick succession in the financial sector, demonstrating that we’re advancing our position in this important segment.
Our large-scale MSP deal with Tetra Pak signed in June commenced according to plan in the period. This collabora-tion has started well, our client team is on site with the client, and already demonstrating how the client is making savings. TetraPak marks a breakthrough in the technology consultant segment. We are now continuing to work on developing our positioning for the long term. Notably, we’re conducting
activities that strengthen our consultant network to create the prospects for building sales and delivery capacity in this seg-ment for the long term.
Thus eWork’s client offering is faring well as consultant pur-chasers continue to consolidate and rationalise their procure-ment. This model is inherently long term and it takes time before any one collaboration agreement becomes profitable. Initially, we incur a lot of expenses on assignments. Once as-signments mature and market demand normalises, we have very good prospects of making positive and profitable progress.
Our fairly weak earnings for the quarter are a result of hesitant demand and continued aggressive initiatives. Despite good transaction frequency, with a fairly low volume of new enquiries, we were unable to secure enough standard contracts to compensate for the number of consultants whose assign-ments concluded. Our aggressive initiatives are continuing, and the increased to our employee headcount is linked to our initiatives related to MSP contracts. We’ve built a dedicated sales team to work exclusively on selling these deals. We’ve also incurred expenses to improve our organisation further in Norway and Denmark.
In the longer term, we see the prospects for our model having an impact on all our Nordic markets. In the slightly longer term, our initiatives make a good contribution to eWork’s continued growth and earnings capacity.
Claes Ruthberg, President and CEOStockholm, Sweden, 25 October 2013
”Now we’ve really proved that our concept satisfies expectations of rationalisation, savings and quality improvements.

3eWork Scandinavia AB Interim report Q3 2013
Market and operations
MarketThe Nordic consulting market remained hesitant in the third quarter of the year. The tendency was the same as previously in the year, and consistent with the expectations stated in the two previous quarterly Interim Reports.
As previously, interest in MSP business, where clients inte-grate current consulting deliveries from several providers onto one or two providers, was brisk. eWork also noted continued high market interest in the concept it has developed of out-sourcing complete purchasing functions to a single provider.
eWork judges that the IT consultant market contracted somewhat in the period compared to the previous year. Despite this, eWork thinks the consultant broker market has grown, and secured additional market shares on the consul-tant market thanks to the increased share of consolidating business.
In the technology consultant segment, interest in the broker model continued to grow, although the sales cycles are long and the broker model still has a very low market share in this segment. Interest in the broker model is increasing, and in the long term, is expected to drive the technology consul-tant market’s onward development.
The market tendency is basically unchanged from earlier in the year, with minor variations between eWork’s geograph-ical markets. In the quarter, the Swedish market remained hesitant. Some slowdown was detectable on the Norwegian market compared to earlier in the year. The Finnish and Dan-ish markets remained hesitant at a level established several quarters ago. However, growing interest in consolidating business was apparent.
eWork’s own demand indicators suggested a continued poor, but stable, market. Those parameters covered include
the number of client enquiries received and applications etc. The number of applicants per assignment was stable at a fairly high level. This indicates continued low capacity utilisation on the consultant market, and thus continued good access to consultants for eWork. Overall, eWork anticipates a contin-ued hesitant market in the final quarter of the year.
The Group’s net salesThe Group’s net sales for the third quarter increased margin-ally to SEK 775.8 million (768.8). Net sales in the Swedish business increased, were largely unchanged in Denmark, and decreased in the Norwegian and Finnish businesses. In the first nine months of 2013, net sales increased by 6 percent to SEK 2,661.9 million (2,515.8). This increase is sourced from operations in Sweden and Norway.
The Group’s profitThe Group’s operating profit for the third quarter decreased to SEK 6.0 million (13.7). In the first nine months of 2013, op-erating profit was SEK 33.3 million (43.6). The profit down-turn is due partly to an altered sales mix with a higher share of MSP business, partly to expenses relating to the developing MSP offering and large individual assignments.
The profit after financial items was SEK 6.0 million (13.8) for the third quarter 2013 and SEK 33.3 million (43.9) for the first nine months of 2013. Profit after tax was SEK 4.8 million (10.5) for the third quarter 2013, and SEK 25.8 mil-lion (32.8) for the first nine months of 2013.
Operational developmentsThe Group’s sales progressed positively in the third quarter, and order intake amounted to SEK 845 million (731), a 16 percent
eWork is a full-range consulting provider in the Nordic consulting market in IT, technology, telecom and business development. eWork is the leader in the Nordic consulting broker market.
Sales breakdown, July – September 2013
Norway 8.1%
Denmark 4.4%
Finland 4.3%
Sweden 83.2%
Max. no. of consultants on assignment
0
500
1,000
1,500
2,000
2,500
3,000
3,500
Q3Q2Q1Q4Q3Q2Q1Q4Q3Q2Q1Q4Q3Q2Q1Q4Q3Q2Q1
20132012201120102009
4eWork Scandinavia AB Interim report Q3 2013
increase. The maximum number of consultants on assignment was 3,164. The growth is largely explained by new MSP assign-ments, as well as other large assignments where eWork helps consolidate the client’s consultant delivery onto fewer providers.
In year-on year terms, standard contracts where eWork appoints consultants were at an unchanged level in terms of order intake, but reduced as a share of consultants on assign-ment. The explanation is that new consultant appointments did not compensate for the number of assignments that expired. A number of assignments concluded in the period coincident with the termination of one major framework agreement, as reported in the first quarter.
SwedenProgress was positive in Sweden, with rising sales and im-proved profits. Net sales increased by 7 percent in the quarter to SEK 645.2 million (605.2). In the first nine months, net sales increased by 9 percent to SEK 2,165.4 million (1,987.2). Standard contracts were fairly unchanged on the previous year, with the sales increase primarily sourced from MSP contracts and takeover and specific selection contracts.
The large-scale MSP contract signed with TetraPak com-menced. An MSP contract with Nasdaq OMX, and framework agreements with the Swedish Migration Board, Telenor in Sweden and Swedish local government organisation SKL were signed in the period. eWork’s collaboration with its single larg-est client, Sony Mobile Communications, was extended for a further two-year period from the coming year-end.
Operating profit was SEK 8.8 million (13.7) for the third quarter, and SEK 35.7 million (42.7) for the first nine months. The profit decrease is mainly due to the sales mix including a higher share of lower-margin volume business and expenses incurred for starting up large individual assignments.
FinlandIn Finland, net sales for the third quarter were SEK 33.5 million (56.0). Net sales for the first nine months were SEK 147.6 million (216.3). The Finnish operation was affected by a large-scale partnership that terminated, which new contracts did not fully compensate for.
Operating profit/loss was SEK –0.5 million (0.0), and SEK 0.4 million (1.2) for the first nine months. The profit decrease is explained by lower invoicing not fully offsetting the cost reductions. This operation incurred expenses as a result of reinforcing its sales and marketing organisation.
eWork still regards the Finnish market as weak. eWork has continued to address the technology consulting market, encountering significant market interest, albeit with long sales cycles.
DenmarkNet sales were SEK 34.5 million (34.9) in the third quarter, and net sales for the first nine months decreased to SEK 108.0 million (116.8). This operation is showing signs of recovery, and saw brisk activity when addressing its market for new
business despite the market remaining hesitant. This business maintained high growth in the financial sector.
Operating profit/loss in the third quarter was SEK –1.3 million (0.0).
Operating profit/loss for the first nine months was SEK –3.6 million (-0.2). The profit downturn is due to increased expenses as a result of reinforcing the sales and marketing organisation.
NorwayThe Norwegian operations had a poorer quarter after high sales growth in recent quarters. Net sales for the quarter de-creased to SEK 62.6 million (72.8). The decrease is explained by some demand slowdown and factors relating to a small number of current assignments. Operating profit/loss was SEK –1.0 million (0.0). The share of MSP contracts remained fairly high, which combined with lower net sales, explains the poor earnings.
Net sales for the first nine months amounted to SEK 240.8 million (195.5), a 23 percent increase. Operating profit for the first nine months was SEK 0.8 million (–0.1).
Market conditions revealed some slowdown compared to earlier in the year. Interest in continued consolidation of sup-plier bases was high among current and potential customers. A new framework agreement was signed with Skatteetaten, the Norwegian Tax Administration, in the period.
Financial position and cash flowThe equity/assets ratio was 11.8 percent (12.8) on 30 Septem-ber 2013. The lower equity/assets ratio is due to higher work-ing capital as a result of higher sales. Cash flow from operating activities for the third quarter was SEK 45.3 million (–30.2).
For the first three quarters, cash flow from operating activi-ties was SEK –21.5 million (15.2). Changes to working capital at different reporting dates are mainly due to all payments from customers and consultants being scheduled at month-ends. For this reason, a small timing difference in payments made or received can have a major effect on cash flow at a specific time.
The Group’s net interest-bearing assets were SEK 91.1 million (103.3) at the end of the reporting period.
WorkforceThe number of employees of the Group continued to increase year on year, due to eWork’s focus on MSP assignments.
The average number of permanent employees of the Group in the third quarter 2013 was 153 (148) excluding consul-tants employed on a project basis. Consultants employed on a project basis are included in ‘cost of consultants on assign-ment’ under operating costs.
Other informationA stock option program expired in the period and 25,500 share warrants were subscribed. Subsequently, the total num-ber of shares is 16,983,975. Share capital increased by SEK 3,315 to SEK 2,207,916.75. The dilution resulting from new share subscription is 0.2 percent.

5eWork Scandinavia AB Interim report Q3 2013
The stock option program is part of eWork’s incentive program for all permanent employees. The share warrants subscribed were issued in 2010.
Parent CompanyThe Parent Company’s net sales for the third quarter were SEK 645.2 million (605.2). Profit before financial items was SEK 8.8 million (13.7) and profit after tax was SEK 6.7 mil-lion (9.3).
For the three first quarters, the Parent Company’s net sales were SEK 2,165.4 million (1,987.2). Profit before financial items was SEK 35.7 million (42.7) and profit after tax was SEK 27.8 million (30.5).
The Parent Company’s shareholders’ equity at the end of the quarter amounted to SEK 108.7 million (120.8), and the equity/assets ratio was 13.6 percent (15.0). Otherwise, where appropriate, the above comments regarding the Group’s finan-cial position also apply to the Parent Company.
Material risks and uncertainty factorseWork’s material business risks, for the Group and Parent Com-pany, consist of reduced demand for consulting services, diffi-culties in attracting and retaining skilled staff, credit risks, and to a lesser extent, currency risks. The Company is not aware of any new material business risks in the forthcoming six months. For a more detailed review of material risks and uncertainty factors, please refer to eWork’s Annual Report.
Subsequent eventsNo significant events have occurred since the end of the reporting period.
OutlookeWork expects the demand for IT and business development consultants to be fairly hesitant in 2013. The trend of clients implementing rationalisation measures, such as reducing the number of suppliers, is continuing. Demand for MSP projects, where all of a client’s consultant contracts are subcontracted to one party, is expected to increase.
eWork believes it has the right prospects to keep perform-ing positively. eWork’s structural capital, in the form of a large and growing number of framework agreements, a base of some 60,000 consultants and systems and processes accumu-lated to manage client business effectively, is a contributory factor. In addition, eWork is continuing to conduct business development to sharpen its competitiveness, extend its offer-ing and streamline delivery.
Continued streamlining and economies of scale through increased volumes are expected to make a positive contribu-tion to profitability in the long term. The sales mix and cycli-cal reduction in demand for ongoing consultant appointments is expected to have a negative impact on operating profit.
Overall, the Board of Directors’ opinion is that eWork has good prospects of continuing to grow and strengthen its posi-tion on a relatively weak market.
Shareholders, eWork’s five largest owners (30 September 2013)Name No. of shares %
Salénia AB 4,147,546 24.4%
Magnus Berglind (endowment insurance) 3,000,000 17.7%
PSG Small Cap 1,311,667 7.7%
Öresund Investment AB 1,303,284 7.7%
Anders Ström Core Holdings Ltd 990,084 5.8%
Reporting calendar21 February 2014 Year-end Report 2013
Contacts for more informationClaes Ruthberg, President and CEO, +46 (0)8 506 05500Magnus Eriksson, CFO, +46 (0)8 506 05500, +46 (0)73 382 8480
The President hereby certifies that this quarterly Interim Report gives a true and fair view of the company’s and the Group’s operations, financial position and results of operations and states the significant risks and uncertainty factors facing the company and Group companies.
Claes RuthbergPresident and CEO
Stockholm, Sweden, 25 October 2013
This Report has been subject to review by the company’s auditor
The information disclosed in this Interim Report is mandatory for eWork Scandinavia AB (publ) to publish pursuant to the Swedish Securities Markets Act. This information will be submitted for publication at 8:00 a.m. (CET) on 25 October 2013.
0
250
500
750
1,000
1,250
0
10
20
30
40
50
20132012201120102009
eWork Weekly share turnoverIndex
SEK Weekly share turnover, thousands
Q3Q2Q1Q4Q3Q2Q1Q4Q3Q2Q1 Q4Q3Q2Q1 Q4Q3Q2Q1
Share price and turnover
6eWork Scandinavia AB Interim report Q3 2013
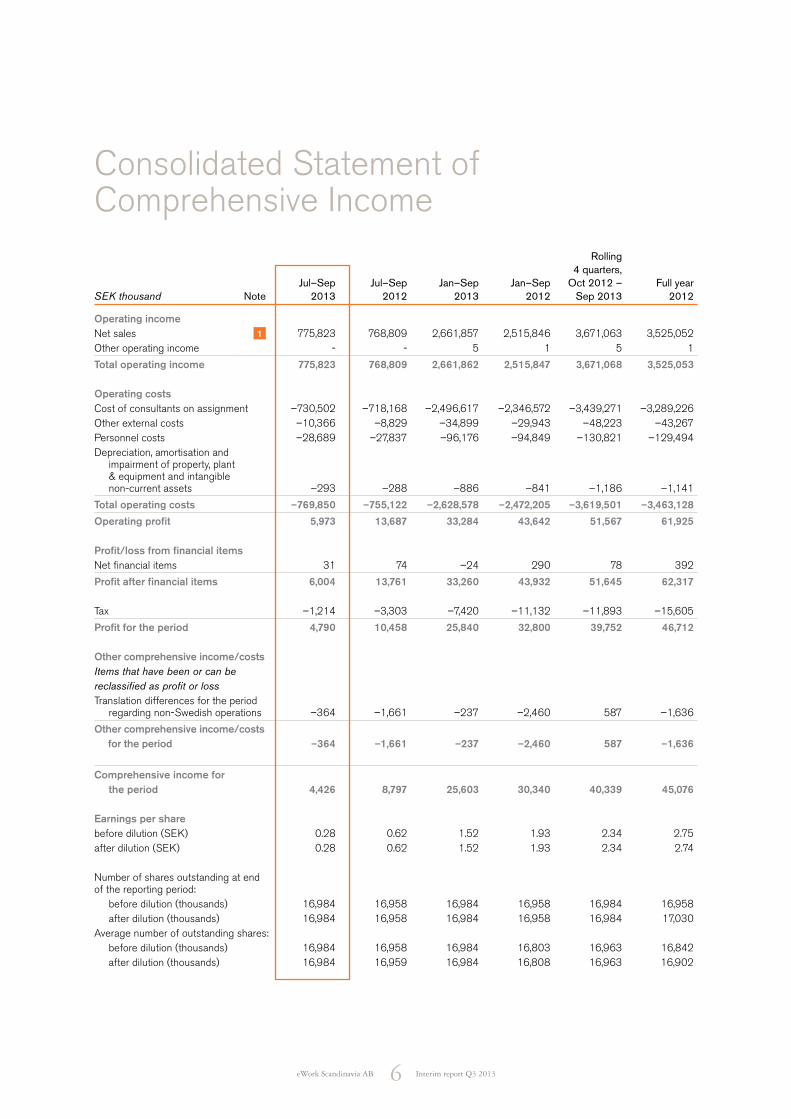
Rolling 4 quarters, Jul–Sep Jul–Sep Jan–Sep Jan–Sep Oct 2012 – Full yearSEK thousand Note 2013 2012 2013 2012 Sep 2013 2012 Operating income Net sales 1 775,823 768,809 2,661,857 2,515,846 3,671,063 3,525,052Other operating income - - 5 1 5 1
Total operating income 775,823 768,809 2,661,862 2,515,847 3,671,068 3,525,053 Operating costs Cost of consultants on assignment –730,502 –718,168 –2,496,617 –2,346,572 –3,439,271 –3,289,226Other external costs –10,366 –8,829 –34,899 –29,943 –48,223 –43,267Personnel costs –28,689 –27,837 –96,176 –94,849 –130,821 –129,494Depreciation, amortisation and impairment of property, plant & equipment and intangible non-current assets –293 –288 –886 –841 –1,186 –1,141
Total operating costs –769,850 –755,122 –2,628,578 –2,472,205 –3,619,501 –3,463,128
Operating profit 5,973 13,687 33,284 43,642 51,567 61,925 Profit/loss from financial items Net financial items 31 74 –24 290 78 392
Profit after financial items 6,004 13,761 33,260 43,932 51,645 62,317 Tax –1,214 –3,303 –7,420 –11,132 –11,893 –15,605
Profit for the period 4,790 10,458 25,840 32,800 39,752 46,712 Other comprehensive income/costs Items that have been or can be reclassified as profit or lossTranslation differences for the period regarding non-Swedish operations –364 –1,661 –237 –2,460 587 –1,636
Other comprehensive income/costs for the period –364 –1,661 –237 –2,460 587 –1,636
Comprehensive income for the period 4,426 8,797 25,603 30,340 40,339 45,076 Earnings per sharebefore dilution (SEK) 0.28 0.62 1.52 1.93 2.34 2.75after dilution (SEK) 0.28 0.62 1.52 1.93 2.34 2.74 Number of shares outstanding at end of the reporting period: before dilution (thousands) 16,984 16,958 16,984 16,958 16,984 16,958 after dilution (thousands) 16,984 16,958 16,984 16,958 16,984 17,030Average number of outstanding shares: before dilution (thousands) 16,984 16,958 16,984 16,803 16,963 16,842 after dilution (thousands) 16,984 16,959 16,984 16,808 16,963 16,902
Consolidated Statement of Comprehensive Income

7eWork Scandinavia AB Interim report Q3 2013
30 Sep 30 Sep 31 Dec SEK thousand 2013 2012 2012
ASSETSNon-current assetsIntangible non-current assets 931 1,168 1,037Property, plant and equipment 1,419 1,590 1,589Non-current receivables 440 838 655Deferred tax recoverable 3,268 3,179 3,233
Total non-current assets 6,058 6,775 6,514 Current assets Income taxes recoverable 1,958 - -Accounts receivable - trade 892,665 820,219 917,924Prepaid expenses and accrued income 17,234 13,805 11,784Other receivables 2,925 634 1,792Cash and cash equivalents 91,116 103,327 154,599
Total current assets 1,005,898 937,985 1,086,099
TOTAL ASSETS 1,011,956 944,760 1,092,613 EQUITY AND LIABILITIESEquityShare capital 2,207 2,205 2,204Other paid-up capital 62,416 61,276 61,320Reserves –5,764 –6,351 –5,527Retained earnings including profit for the period 60,904 63,548 77,460
Total equity 119,763 120,678 135,457 Non-current liabilitiesDeferred tax liability 3,237 - 3,237 Current liabilitiesAccounts payable - trade 858,729 780,478 908,789Tax liabilities - 9,091 8,606Other liabilities 14,295 19,540 16,980Accrued expenses and deferred income 15,932 14,973 19,544
Total current liabilities 888,956 824,082 953,919
TOTAL EQUITY AND LIABILITIES 1,011,956 944,760 1,092,613
Consolidated Statement of Financial Position

8eWork Scandinavia AB Interim report Q3 2013
Other Retained Share paid-up Translation earnings incl. Total SEK thousand capital capital reserve profit for the period equity
Opening equity, 1 Janury 2012 2,174 54,643 –3,891 61,689 114,615Comprehensive income for the period Profit for the period 32,800 32,800Other comprehensive income/costs for the period –2,460 –2,460
Comprehensive income for the period –2,460 32,800 30,340
Transactions with the Group’s shareholders Dividends –30,941 –30,941Share options exercised by staff 30 6,364 6,394Premiums deposited on issuing share warrants 269 269
Closing equity, 30 September 2012 2,204 61,276 –6,351 63,548 120,677 Opening equity, 1 October 2012 2,204 61,276 –6,351 63,548 120,677Comprehensive income for the period Profit for the period 13,912 13,912Other comprehensive income/costs for the period 824 824
Comprehensive income for the period 824 13,912 14,736
Transactions with the Group’s shareholders Share options exercised by staff 44
Closing equity, 31 December 2012 2,204 61,320 –5,527 77,460 135,457 Opening equity, 1 Janury 2013 2,204 61,320 –5,527 77,460 135,457Comprehensive income for the period Profit for the period 25,840 25,840Other comprehensive income/costs for the period –237 –237
Comprehensive income for the period –237 25,840 25,603
Transactions with the Group’s shareholders Dividends –42,396 –42,396Share options exercised by staff 3 888 891Premiums deposited on issuing share warrants 208 208
Closing equity, 30 September 2013 2,207 62,416 -5,764 60,904 119,763
Consolidated Statement of Changes in Equity

9eWork Scandinavia AB Interim report Q3 2013
Rolling 4 quarters, Jul–Sep Jul–Sep Jan–Sep Jan–Sep Oct 2012 – Full yearSEK thousand 2013 2012 2013 2012 Sep 2013 2012 Operating activities Cash flow from operating activities before changes in working capital 1,942 11,598 16,200 37,102 33,055 53,957Cash flow from changes in working capital 43,335 –41,751 –37,680 –21,855 –4,201 11,624
Cash flow from operating activities 45,277 –30,153 –21,480 15,247 28,854 65,581
Cash flow from investing activities –18 –263 –381 –904 –381 –890Cash flow from financing activities 1,099 6,707 –41,297 –24,234 –41,297 –24,234
Cash flow for the period 46,358 –23,709 –63,158 –9,891 –12,824 40,457 Cash and cash equivalents at beginning of period 45,236 128,526 154,599 115,450 103,327 115,450Exchange rate differences –478 –1,490 –325 –2,232 613 –1,308
Cash and cash equivalents at end of period 91,116 103,327 91,116 103,327 91,116 154,599
Consolidated Statement of Cash Flows

10eWork Scandinavia AB Interim report Q3 2013
Rolling 4 quarters, Jul–Sep Jul–Sep Jan–Sep Jan–Sep Oct 2012 – Full yearSEK 2013 2012 2013 2012 Sep 2013 2012 Earnings per share before dilution 0.28 0.62 1.52 1.93 2.34 2.75Earnings per share after dilution 0.28 0.62 1.52 1.93 2.34 2.74Eget kapital per aktie före utspädning 7.1 7.1 7.1 7.2 7.1 8.0 Eget kapital per aktie after dilution 7.1 7.1 7.1 7.2 7.1 8.0 Cash flow from operating activities per share before dilution 2.7 –1.8 –1.3 0.9 1.7 3.9Cash flow from operating activities per share after dilution 2.7 –1.8 –1.3 0.9 1.7 3.9Number of shares outstanding at end of the reporting period before dilution (thousands) 16,984 16,958 16,984 16,958 16,984 16,958Number of shares outstanding at end of the reporting period after dilution (thousands) 16,984 16,958 16,984 16,958 16,984 17,030Average number of outstanding shares before dilution (thousands) 16,984 16,958 16,984 16,803 16,963 16,842Average number of outstanding shares after dilution (thousands) 16,984 16,959 16,984 16,808 16,963 16,902
Key performance data per share
Rolling 4 quarters, Jul–Sep Jul–Sep Jan–Sep Jan–Sep Oct 2012 – Full yearSEK thousand 2013 2012 2013 2012 Sep 2013 2012 Sales growth, % 0.9 34.9 5.8 35.9 12.0 35.0Operating margin, % 0.8 1.8 1.3 1.7 1.4 1.8Return on equity, % 15.9 37.2 28.7 37.2 33.1 37.4Equity/assets ratio, % 11.8 12.8 11.8 12.8 11.8 12.4Acid test ratio, % 113 114 113 114 113 114Average number of employees 153 148 154 149 154 150 Sales per employee 5,071 5,195 17,285 16,885 23,838 23,500
Key performance data

11eWork Scandinavia AB Interim report Q3 2013
Rolling 4 quarters, Jul–Sep Jul–Sep Jan–Sep Jan–Sep Oct 2012 – Full yearSEK thousand 2013 2012 2013 2012 Sep 2013 2012 Operating incomeNet sales 645,195 605,207 2,165,422 1,987,226 2,959,543 2,781,347Other operating income 2,102 1,798 6,316 6,992 7,254 7,930
Total operating income 647,297 607,005 2,171,738 1,994,218 2,966,797 2,789,277 Operating costs Cost of consultants on assignment –608,127 –564,722 –2,032,846 –1,853,801 –2,774,288 –2,595,243Other external costs –8,953 –6,951 –29,688 –23,248 –41,961 –35,521Personnel costs –21,174 –21,356 –72,676 –73,718 –99,045 –100,087Depreciation, amortisation and impairment of property, plant & equipment and intangible non-current assets –275 –258 –823 –764 –1,084 –1,025
Total operating costs –638,529 –593,287 –2,136,033 –1,951,531 –2,916,378 –2,731,876
Operating profit 8,768 13,718 35,705 42,687 50,419 57,401 Profit/loss from financial itemsOther interest income and similar items 154 175 443 641 2,513 2,711Interest expense and similar items –284 –1,240 –398 –1,885 –435 –1,922
Profit after financial items 8,638 12,653 35,750 41,443 52,497 58,190 Appropriations - - - - –14,713 –14,713 Tax –1,947 –3,343 –7,990 –10,975 –8,623 –11,608
PROFIT FOR THE PERIOD* 6,691 9,310 27,760 30,468 29,161 31,869 * Profit for the period corresponds to comprehensive income for the period.
Parent Company Income Statement

12eWork Scandinavia AB Interim report Q3 2013
30 Sep 30 Sep 31 Dec SEK thousand 2013 2012 2012
ASSETSNon-current assetsIntangible non-current assets 931 1,168 1,037Property, plant and equipment 943 1,123 1,080
Financial non-current assetsParticipations in Group companies 15,829 15,829 15,829
Total financial non-current assets 15,829 15,829 15,829Total non-current assets 17,703 18,120 17,946
Current assetsAccounts receivable - trade 778,147 677,668 763,959Receivables from Group companies 20,360 33,179 32,652Other receivables 865 165 48Prepaid expenses and accrued income 10,039 8,082 5,734
Cash and bank balances 57,465 68,576 107,381
Total current assets 866,876 787,670 909,774TOTAL ASSETS 884,579 805,790 927,720
EQUITY AND LIABILITIESEquityRestricted equityShare capital (16,983,975 shares with par value of SEK 0.13) 2,207 2,205 2,205Statutory reserve 6,355 6,355 6,355
Total restricted equity 8,562 8,560 8,560
Non-restricted equity Share premium reserve 56,455 55,316 55,360Retained earnings 15,924 26,450 26,450Profit for the period 27,760 30,468 31,869
Total non-restricted equity 100,139 112,234 113,679Total equity 108,701 120,794 122,239
Untaxed reserves 14,713 - 14,713
Current liabilities Accounts payable - trade 739,115 651,099 754,912Tax liabilities - 10,540 8,929Other liabilities 11,749 12,507 12,157Accrued expenses and deferred income 10,301 10,850 14,770
Total current liabilities 761,165 684,996 790,768TOTAL EQUITY AND LIABILITIES 884,579 805,790 927,720
Parent Company Balance Sheet
30 Sep 30 Sep 31Dec SEK thousand 2013 2012 2012
Pledged assets None None NoneContingent liabilities None None None
Parent Company pledged assets and contingent liabilities

13eWork Scandinavia AB Interim report Q3 2013
Accounting principlesThe Interim Report for the Group has been prepared in accordance with IAS 34 Interim Financial Reporting and the appropriate provisions of the Swedish Annual Accounts Act. The Interim Report for the Parent Company has been prepared in accordance with the Swedish Annual Accounts Act. The same accounting principles and basis of calculation have been applied as in the Annual Report for 2012.
Notes on the financial statements
1NOT Koncernens rörelsesegment
First nine months 2013 compared to 2012
Sweden Finland Denmark Norway Total
Jan–Sep Jan–Sep Jan–Sep Jan–Sep Jan–Sep Jan–Sep Jan–Sep Jan–Sep Jan–Sep Jan–Sep SEK thousand 2013 2012 2013 2012 2013 2012 2013 2012 2013 2012
Income from clients 2,165,422 1,987,226 147,615 216,286 108,024 116,824 240,796 195,510 2,661,857 2,515,846
Profit per segment 67,961 80,384 2,581 4,552 –2,105 944 3,418 2,449 71,855 88,329
Group-wide expenses –32,256 –37,697 –2,183 –3,303 –1,512 –1,176 –2,620 –2,511 –38,571 –44,687
Operating profit/loss 35,705 42,687 398 1,249 –3,617 –232 798 –62 33,284 43,642
Net financial items - - - - - - - - –24 290
Profit/loss for the period before tax 33,260 43,932
Third quarter 2013 compared to 2012
Sweden Finland Denmark Norway Total
Jul–Sep Jul–Sep Jul–Sep Jul–Sep Jul–Sep Jul–Sep Jul–Sep Jul–Sep Jul–Sep Jul–Sep SEK thousand 2013 2012 2013 2012 2013 2012 2013 2012 2013 2012
Income from clients 645,195 605,207 33,503 55,966 34,516 34,882 62,609 72,755 775,823 768,810
Profit per segment 19,490 26,283 212 1,025 –779 –53 –127 796 18,796 28,051
Group-wide expenses –10,722 –12,565 –739 –1,060 –511 83 –851 –822 –12,823 –14,364
Operating profit/loss 8,768 13,718 –527 –35 –1,290 30 –978 –26 5,973 13,687
Net financial items - - - - - - - - 31 74
Profit/loss for the period before tax 6,004 13,761

14eWork Scandinavia AB Interim report Q3 2013
Auditor’s report on a limited review of interim financial statements
IntroductionWe have conducted a limited review of the enclosed Balance Sheet of eWork Scandinavia AB (publ) as of 30 September 2013 and the associated statements of income, changes in equity and changes in cash flow in the nine-month period that concluded on this date, and a summary of the material accounting policies and other supplementary disclosures. The preparation and fair presentation of these interim financial statements pursuant to IAS 34 are the responsibility of the Board of Directors and Chief Executive Officer. Our respon-sibility is to report our conclusions concerning these interim financial statements on the basis of our limited review.
Orientation and scope of limited reviewWe have conducted our limited review pursuant to the Standard for Limited Review (SÖG) 2410, limited review of interim financial information conducted by the Company’s appointed auditor. A limited review consists of making inqui-ries, primarily to individuals responsible for financial and ac-counting matters, as well as performing analytical procedures
and taking other limited review measures. A limited review has a different focus and significantly less scope than an audit according to ISA and generally accepted auditing practice. The review procedures undertaken in a limited review do not enable us to obtain a level of assurance where we would be aware of all important circumstances that would have been identified had an audit been conducted. Therefore, a conclu-sion reported on the basis of a limited review does not have the level of certainty of a conclusion reported on the basis of an audit.
ConclusionBased on our limited review, no circumstances have come to our attention that would give us reason to believe that the at-tached interim financial statements do not give a true and fair view of the Company’s financial position as the 30 September 2013 and its results of operations and cash flow for the nine-month period that concluded on this date pursuant to IAS 34, in all material respects.
To the Board of Directors of eWork Scandinavia AB (publ) Corporate identity no. 556587-8708
Stockholm, Sweden, 25 October 2013KPMG AB
Mattias JohanssonAuthorised Public Accountant

eWork’s Business ConcepteWork’s business concept is to cost-efficiently provide the client with consultants who have the right specialist competence for each assignment, and to manage the related administration, quality assurance and follow-up. Corre-spondingly, consultants that sell their services via eWork are provided with challenging and profitable assignments.
eWork’s Business ModeleWork does not have any consultants on the payroll, but instead collaborates with experienced, competent and specialist people, many of whom come from small consulting firms. eWork has a unique network of consultants where an objective and professional selection is made upon each inquiry. eWork’s business model is based on a unique matching method that enables purchasers to rapidly find consultants with optimal skills on site. eWork is a contractual partner with the client, and enters into an equivalent agreement with the consultant, in addition to managing all administration and follow-up on each assignment.
eWork’s GlossaryCompletion frequency Contracted assignments in relation to received consultant inquiries.Consultant broker Companies that provide consultant purchasers with consultants who are not their
employees, by entering into an agreement with both the client and the consultant.Framework agreement An agreement with the consultant purchaser that enables eWork to provide consultants for
particular requirements, although most often without a guaranteed volume.
MSP Managed service provider: term describing eWork’s function on outsourcing assignments. Outsourcing is a type of collaboration where eWork’s role is to manage the client’s operational procurement function for consultant purchasing for consultant delivery. All the client’s consultant purchasing is contracted via eWork.
Specific selection The client selects a specific consultant for an assignment, but contracts the consultant via eWork.
Standard contract eWork finds the right consultant for the client at the right price and at the right time for a new assignment.
Takeover contracts eWork takes over an existing consultant agreement during an ongoing consultant delivery.Volume business General description of larger transactions, often referring to outsourcing of consultant
purchasing, but also covering large-scale takeover contracts, for example.
eWork Scandinavia AB (publ). (corporate ID no. 556587-8708)Klarabergsgatan 60 • 111 21 Stockholm • Sweden • +46 (0)8 506 055 00 • www.ework.se • e-mail: [email protected]
eWork Scandinavia AB is a complete consultant supplier with over 3,000 consultants on assignment within the fields of IT, telecoms, technology, and business development. eWork offers an objective selection of specialists from the largest consultant network on the market, offering clients better pricing, quality and time efficiency. eWork has framework agreements with more
than 130 clients among the Nordic region’s leading companies active in most sectors.
The Company’s share is listed on NASDAQ OMX Stockholm.