interim report - expolanka
TRANSCRIPT

Interim ReportThree Months Ended 30th June 2016

Dear Stakeholder,
The revenue for the first quarter of the financial year 2016/17 of Rs.14.9 billion is an increase of 7% over Rs 13.9 million recorded in the same period last year. The profit attributed to the equity holders for the first quarter of the financial year 2016/17 at Rs.182 million reflects a 18 per cent decrease over the corresponding period in the previous financial year.
The Group profit before tax (PBT) for the first quarter of the financial year 2016/17 at Rs 378 million was a decrease of 6 per cent over the PBT of Rs.401 million recorded in the corresponding period in the previous financial year. The decline in Group PBT is mainly on account of the non-cash write down in passive investments held at the group level. However Operating Profit which excludes other income and finance cost for the Quarter at Rs 400 million recorded a growth of 20% driven by healthy performance in logistic and leisure sector.
Revised Segmentation
Expolanka Group currently operates in four reportable segments namely Freight and Logistics, Travel and Leisure, International Trading and Manufacturing and Investment and Services. Pursuant to the strategy adopted by the Group few years back to focus on growth sectors and divest from non-core assets, the timing is right for a revision in the reportable segments to better reflect the performance of core businesses. In addition, the respective divestments have had an impact on the relative size and significance in those sectors over the last 2 years. Going Forward, the new segments will be established as Logistics, Leisure & Ventures. Accounting policies used in each segment are consistent with the policies outlined in the last annual report and there will be no change in way we evaluate new segment revenue, expense and operating results when compared with previous segments.
Logistics
The performance of your core sector logistics is encouraging recording a revenue of Rs. 12.4 billion with a growth of 5% over corresponding period last year. Previous Year first quarter had a surge in revenue on account of west coast Port Crisis in USA which resulted in higher air freight shipments. Considering this impact the performance for the quarter is noteworthy. Both Air freight and Ocean freight recorded double digit volume growth. The Group’s core markets in India, Bangladesh and Sri Lanka performed well fueled by the healthy volume growth in US trade lane. Far East businesses such as Indonesia Vietnam and Hong Kong recorded notable performances thereby contributing to the overall growth in the sector. In addition, cost rationalization exercises and global procurement efforts conducted over the past few years paid off in boosting the bottom line growth of the sector.
Ventures
The sector recorded a revenue of Rs. 1.2 billion during the quarter. Non-recurring charge of Rs 48 million related to restructure cost affected the profits before tax.
Your group is well positioned to capitalize on the emerging growth opportunities both locally as well as regionally given its strong fundamentals and therefore, remain optimistic of the future.
Leisure
Leisure sector recoded a revenue Rs. 1.4 Billion with a growth of 64 percent in comparison to the corresponding period in the previous year. The Group’s outbound business travel operations recorded positive results, further boosting the healthy growth that the sector continued to show throughout last year. However our Indian outbound operation did not enjoy similar success given challenges on margins and cost increases in operations. The results were lower than expectation and plans are in place to address low profitability in this business. As part of the strategy your Group will continue to focus its attention towards growing the Leisure Sector.
CEO Message
01
Hanif YusoofGroup CEO
03rd August 2016

CONSOLIDATED STATEMENT OF FINANCIAL POSITION
02
…………………………………
Mushtaq AhamedDirector - Group Finance
03rd August 2016
[SIGNED]
The Board of Directors is responsible for the preparation and presentation of these �nancial statements. Signed for and on behalf of the Board by,
These �nancial statements are in compliance with the requirements of the Companies Act No. 7 of 2007.
[SIGNED]………………………………… Hanif Yusoof Director
Sanjay KulatungaDirector
[SIGNED]…………………………………
As at Un Audited30.06.2016 31.03.2016
ASSETSNon-current AssetsProperty, Plant and Equipment 3,372,962,482 3,422,884,974 Intangible Assets 459,287,875 468,006,886 Investment in an Associate and Joint Ventures 377,733,232 377,526,242 Other Financial Assets 220,758,793 245,139,682 Deferred Tax Assets 80,845,738 75,845,754
4,511,588,120 4,589,403,538 Current AssetsInventories 199,732,939 182,375,113 Trade and Other Receivables 10,612,079,249 12,224,467,805 Prepayments 2,021,521,663 1,886,006,779 Other Financial Assets 563,981,878 610,142,949 Income Tax Recoverable 41,411,249 44,714,257 Cash and Cash Equivalents 3,486,774,624 3,137,502,679
16,925,501,602 18,085,209,582 Total Assets 21,437,089,722 22,674,613,120
EQUITY AND LIABILITIESStated Capital 4,097,985,000 4,097,985,000 Reserves 352,008,092 408,515,548 Retained Earnings 7,530,231,743 7,347,912,590 Equity Attributable to Equity Holders of Parent 11,980,224,835 11,854,413,138 Non-controlling Interest 1,307,742,350 1,265,715,845 Total Equity 13,287,967,185 13,120,128,983
Non-current liabilitiesFinancing and Lease (Ijara) Payables 222,336,338 183,300,244 Deferred Income Tax liabilities 36,028,679 29,920,646 Retirement Bene�t Obligation 461,500,071 464,676,143
719,865,088 677,897,033 Current liabilities Financing and Lease (Ijara) Payables 1,706,149,309 1,609,279,107 Trade and Other Payables 5,210,335,818 6,749,540,208 Income Tax liabilities 512,772,322 517,767,789
7,429,257,449 8,876,587,104 Total Equity and liabilities 21,437,089,722 22,674,613,120
Net asset per share 6.13 6.06
03
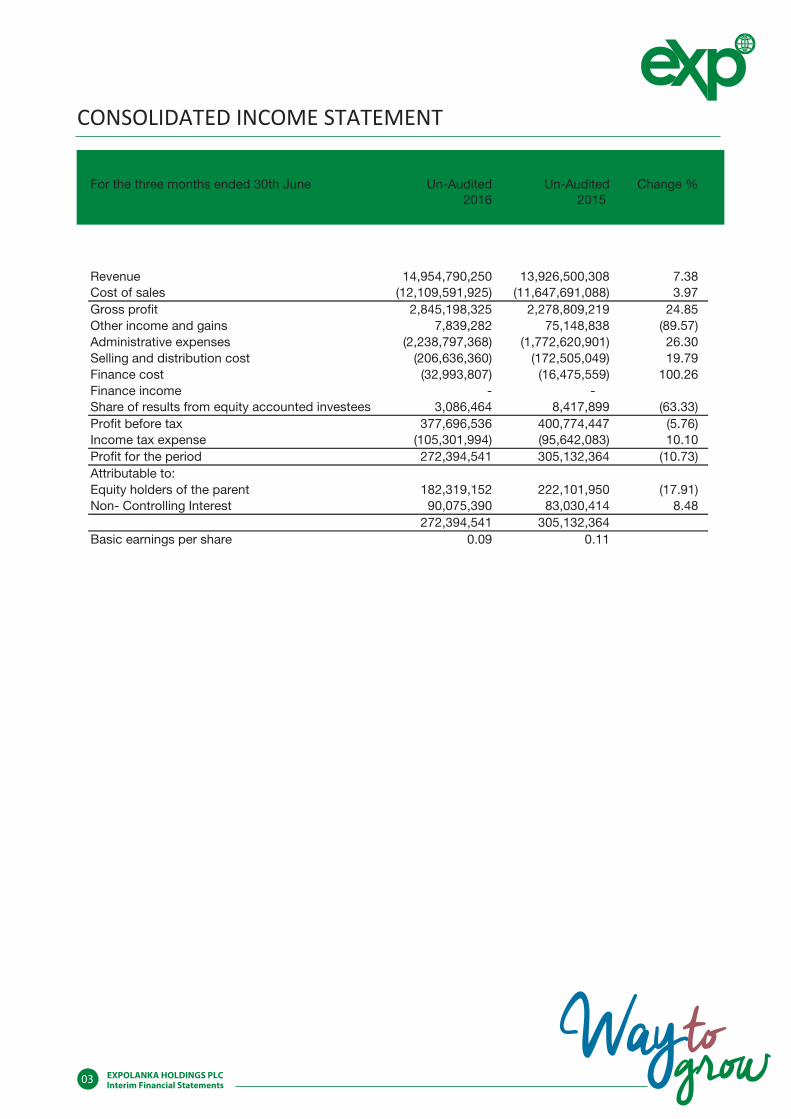
CONSOLIDATED INCOME STATEMENT
For the three months ended 30th June Un-Audited2016
Un-Audited2015
Change %
Revenue 14,954,790,250 13,926,500,308 7.38 Cost of sales (12,109,591,925) (11,647,691,088) 3.97 Gross pro�t 2,845,198,325 2,278,809,219 24.85 Other income and gains 7,839,282 75,148,838 (89.57) Administrative expenses (2,238,797,368) (1,772,620,901) 26.30 Selling and distribution cost (206,636,360) (172,505,049) 19.79 Finance cost (32,993,807) (16,475,559) 100.26 Finance income - - Share of results from equity accounted investees 3,086,464 8,417,899 (63.33) Pro�t before tax 377,696,536 400,774,447 (5.76) Income tax expense (105,301,994) (95,642,083) 10.10 Pro�t for the period 272,394,541 305,132,364 (10.73) Attributable to:Equity holders of the parent 182,319,152 222,101,950 (17.91) Non- Controlling Interest 90,075,390 83,030,414 8.48
272,394,541 305,132,364 Basic earnings per share 0.09 0.11
04
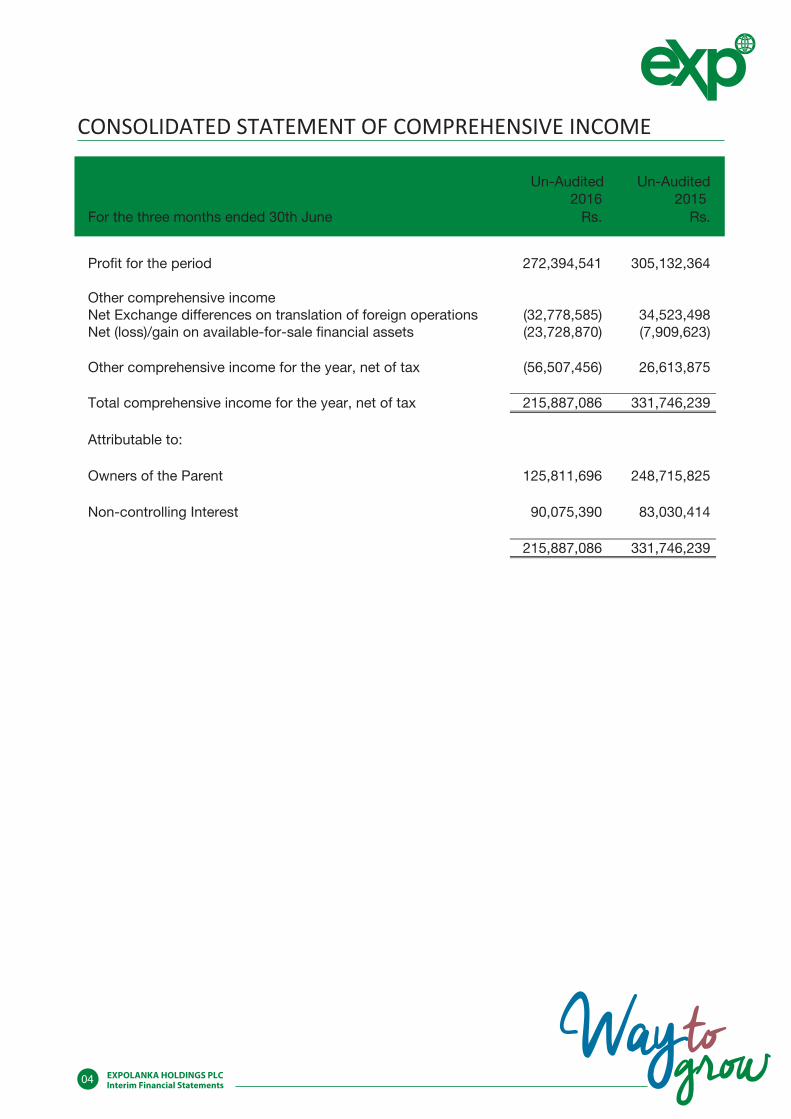
CONSOLIDATED STATEMENT OF COMPREHENSIVE INCOME
For the three months ended 30th June2016
Un-AuditedUn-Audited2015
Rs. Rs.
Pro�t for the period 272,394,541 305,132,364
Other comprehensive incomeNet Exchange differences on translation of foreign operations (32,778,585) 34,523,498 Net (loss)/gain on available-for-sale �nancial assets (23,728,870) (7,909,623)
Other comprehensive income for the year, net of tax (56,507,456) 26,613,875
Total comprehensive income for the year, net of tax 215,887,086 331,746,239
Attributable to:
Owners of the Parent 125,811,696 248,715,825
Non-controlling Interest 90,075,390 83,030,414
215,887,086 331,746,239
05
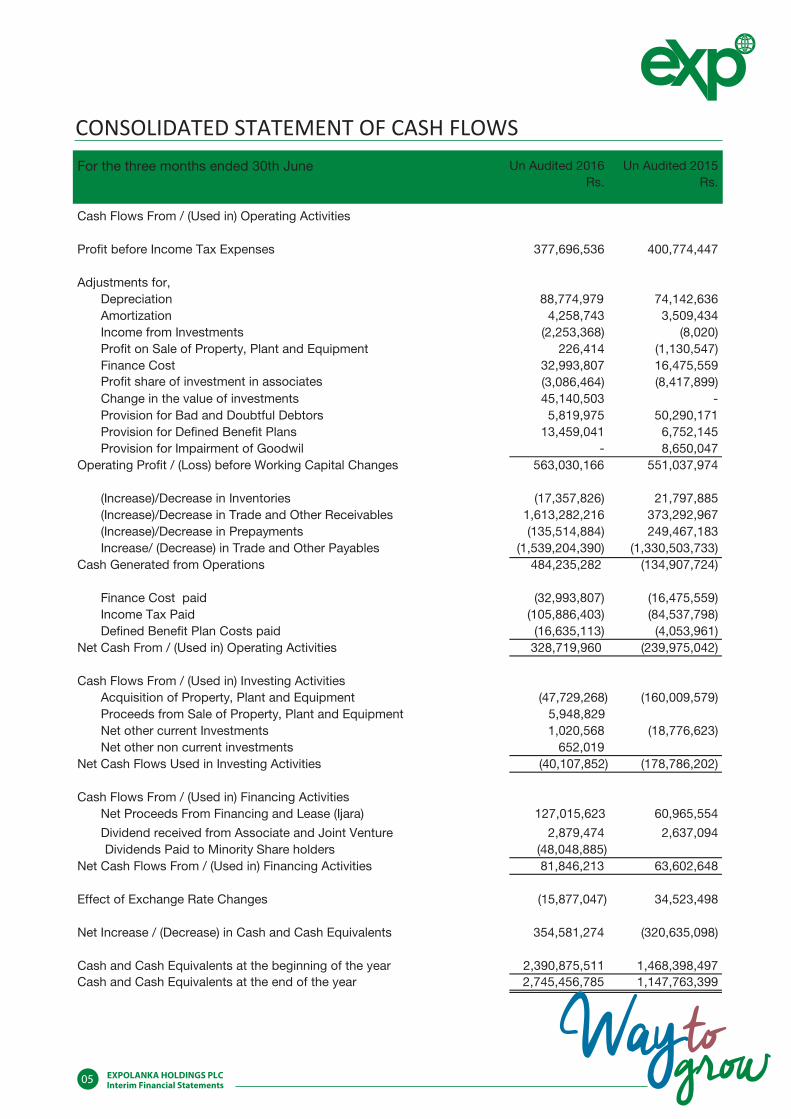
CONSOLIDATED STATEMENT OF CASH FLOWSFor the three months ended 30th June Un Audited 2016 Un Audited 2015
Rs. Rs.
Cash Flows From / (Used in) Operating Activities
Pro�t before Income Tax Expenses 377,696,536 400,774,447
Adjustments for, Depreciation 88,774,979 74,142,636
Amortization 4,258,743 3,509,434 Income from Investments (2,253,368) (8,020) Pro�t on Sale of Property, Plant and Equipment 226,414 (1,130,547) Finance Cost 32,993,807 16,475,559 Pro�t share of investment in associates (3,086,464) (8,417,899) Change in the value of investments 45,140,503 - Provision for Bad and Doubtful Debtors 5,819,975 50,290,171 Provision for De�ned Bene�t Plans 13,459,041 6,752,145 Provision for Impairment of Goodwil - 8,650,047
Operating Pro�t / (Loss) before Working Capital Changes 563,030,166 551,037,974
(Increase)/Decrease in Inventories (17,357,826) 21,797,885 (Increase)/Decrease in Trade and Other Receivables 1,613,282,216 373,292,967 (Increase)/Decrease in Prepayments (135,514,884) 249,467,183 Increase/ (Decrease) in Trade and Other Payables (1,539,204,390) (1,330,503,733)
Cash Generated from Operations 484,235,282 (134,907,724)
Finance Cost paid (32,993,807) (16,475,559) Income Tax Paid (105,886,403) (84,537,798) De�ned Bene�t Plan Costs paid (16,635,113) (4,053,961)
Net Cash From / (Used in) Operating Activities 328,719,960 (239,975,042)
Cash Flows From / (Used in) Investing ActivitiesAcquisition of Property, Plant and Equipment (47,729,268) (160,009,579) Proceeds from Sale of Property, Plant and Equipment 5,948,829 Net other current Investments 1,020,568 (18,776,623) Net other non current investments 652,019
Net Cash Flows Used in Investing Activities (40,107,852) (178,786,202)
Cash Flows From / (Used in) Financing ActivitiesNet Proceeds From Financing and Lease (Ijara) 127,015,623 60,965,554
Dividend received from Associate and Joint Venture 2,879,474 2,637,094 Dividends Paid to Minority Share holders (48,048,885)
Net Cash Flows From / (Used in) Financing Activities 81,846,213 63,602,648
Effect of Exchange Rate Changes (15,877,047) 34,523,498
Net Increase / (Decrease) in Cash and Cash Equivalents 354,581,274 (320,635,098)
Cash and Cash Equivalents at the beginning of the year 2,390,875,511 1,468,398,497 Cash and Cash Equivalents at the end of the year 2,745,456,785 1,147,763,399
06
CON
SOLI
DATE
D ST
ATEM
ENT
OF
CHAN
GES
IN E
QU
ITY
Sta
ted
A
vaila
ble
for
sale
Fore
ign
Cur
renc
yR
etai
ned
To
tal
Non
-co
ntro
lling
Tota
lC
apita
lR
eser
veTr
ansl
atio
nE
arni
ngs
Inte
rest
Eq
uity
Res
erve
Rs.
Rs.
Rs.
Rs.
Rs.
Rs.
Rs.
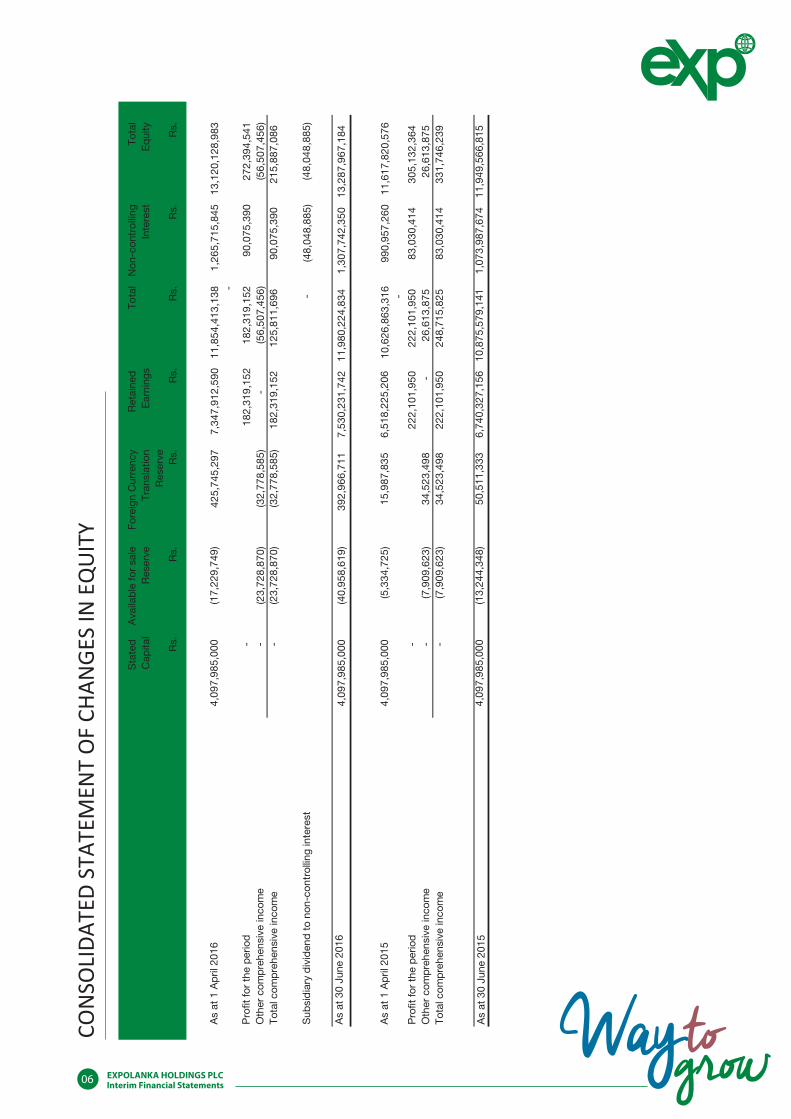
As
at 1
Ap
ril 2
016
4
,097
,985
,000
(17,
229,
749)
425,
745,
297
7,34
7,91
2,59
0
11
,854
,413
,138
1,
265,
715,
845
13,1
20,1
28,9
83
-
Pro
�t fo
r th
e p
erio
d
-
18
2,31
9,15
2
182,
319,
152
90
,075
,390
27
2,39
4,54
1
Oth
er c
omp
rehe
nsiv
e in
com
e
-
(2
3,72
8,87
0)
(3
2,77
8,58
5)
-
(5
6,50
7,45
6)
(56,
507,
456)
To
tal c
omp
rehe
nsiv
e i n
com
e
-
(23
,728
,870
)
(3
2,77
8,58
5)
1
82,3
19,1
52
125,
811,
696
9
0,07
5,39
0
2
15,8
87,0
86
Sub
sid
iary
div
iden
d t
o no
n-co
ntro
lling
inte
rest
-
(48,
048,
885)
(4
8,04
8,88
5)
As
at 3
0 Ju
ne 2
016
4
,097
,985
,000
(40,
958,
619)
392
,966
,711
7,53
0,23
1,74
2
11,9
80,2
24,8
34
1,
307,
742,
350
13
,287
,967
,184
As
at 1
Ap
ril 2
015
4
,097
,985
,000
(5
,334
,725
)
1
5,98
7,83
5
6,5
18,2
25,2
06
10,6
26,8
63,3
16
990,
957,
260
11
,617
,820
,576
-
P
ro�t
for
the
per
iod
-
22
2,10
1,95
0
2
22,1
01,9
50
83,
030,
414
305
,132
,364
O
ther
com
pre
hens
ive
inco
me
-
(7,9
09, 6
23)
34,
523,
498
-
2
6,61
3,87
5
26,
613,
875
Tota
l com
pre
hens
ive
inco
me
-
(7,9
09,6
23)
34,
523,
498
222
,101
,950
24
8,71
5,82
5
83,
030,
414
331
,746
,239
As
at 3
0 Ju
ne 2
015
4
,097
,985
,000
(13,
244,
348)
50
,511
,333
6,74
0,32
7,15
6
10,8
75,5
79,1
41
1,
073,
987,
674
11
,949
,566
,815

COMPANY STATEMENT OF FINANCIAL POSITION
07
[SIGNED]
[SIGNED]
………………………………… Mushtaq Ahamed Director - Group Finance
03 August 2016
The Board of Directors is responsible for the preparation and presentation of these �nancial statements. Signed for and on behalf of the Board by,
………………………………… Hanif Yusoof Director
Sanjay KulatungaDirector
[SIGNED]…………………………………
Unaudited AuditedAs at 30.06.2016 31.03.2016
ASSETSNon-current assetsProperty, plant and equipment 26,750,618 30,183,952 Investments in subsidiaries 3,745,815,348 3,745,815,348 Investment in associate 43,990,000 43,990,000 Other investments 186,064,716 209,793,587
4,002,620,683 4,029,782,887
Current assetsTrade and other receivables 1,151,580,890 1,237,802,073 Prepayments 37,576,177 31,931,896 Other Financial assets 442,376,929 487,517,432 Cash and cash equivalents 270,725,343 272,679,860
1,902,259,340 2,029,931,261 Total Assets 5,904,880,022 6,059,714,148
EQUITY AND LIABILITIES
Stated capital 4,097,985,000 4,097,985,000 Reserves (43,985,003) (20,256,133) Retained earnings/ (losses) 1,685,409,290 1,786,534,392 Total equity 5,739,409,287 5,864,263,259
Non-current liabilitiesFinancing and lease (ijara) payables 23,247,115 93,838,822 Retirement bene�t obligation 16,276,196 23,660,399
39,523,311 117,499,221
Current liabilities Financing and lease (ijara) payables 4,417,856 5,476,166 Trade and other payables 121,529,568 72,475,502 Income Tax Liabilities - -
125,947,425 77,951,668 Total equity and liabilities 5,904,880,022 6,059,714,148
Net asset per share 2.94 3.00
These �nancial statements are in compliance with the requirements of the Companies Act No. 7 of 2007.

COMPANY INCOME STATEMENT
08
For the three months ended 30 June
(Unaudited) 2016
(Unaudited) 2015
Change %
Revenue 26,627,391 31,285,490 (14.89)
Other income and gains 61,738,389 13,902,201 344.09
Administrative expenses (188,373,993) (85,381,628) 120.63
Selling and distribution costs (948,818) (1,036,961) (8.50)
Finance cost (168,070) (417,528) (59.75)
Loss before tax (101,125,102) (41,648,427) 142.81
Income tax expense - -
Loss for the period (101,125,102) (41,648,427) 142.81
Basic Earnings / (Loss) per share (0.05) (0.02)

COMPANY STATEMENT OF COMPREHENSIVE INCOME
09
(Un audited) (Un audited)2016 2015
Loss for the period (101,125,102) (41,648,427)
Other comprehensive income
Net Exchange differences on translation of foreign operationsNet (loss)/gain on available-for-sale �nancial assets (23,728,870) (7,909,623)
- -
Other comprehensive income for the year, net of tax (23,728,870) (7,909,623)
Total comprehensive income for the year, net of tax (124,853,972) (49,558,050)
For the three months ended 30 June

COMPANY STATEMENT OF CASH FLOW
10
For the three months endedUnaudited Unaudited
30.06.2016 30.06.2015
CASH FLOWS FROM / (USED IN) OPERATING ACTIVITIES
Loss before income tax expenses (101,125,102) (41,648,427)
Adjustments for, Depreciation 4,196,731 4,964,951
Income from investments (9,578) (10,464,168) Pro�t on sale of Property, Plant & Equipment (112,181) - Change in the value of investments 45,140,503 - Finance cost 168,070 417,528 Provision for de�ned bene�t plans 1,029,147 1,049,466
Operating pro�t / (loss) before working capital changes (50,712,410) (45,680,650)
(Increase)/Decrease in trade and other receivables 86,230,761 (276,233,258) (Increase)/Decrease in Prepayments (5,644,282) (4,827,518) Increase/(Decrease) in trade and other payables 49,054,068 (14,179,840)
Cash generated from / (used in) operations 78,928,138 (340,921,265)
Finance cost paid (168,070) (417,528) De�ned bene�t plan costs paid (8,413,350) -
Net cash from / (used in) operating activities 70,346,718 (341,338,793)
CASH FLOWS FROM / (USED IN) INVESTING ACTIVITIESInvestment income received - 897,707 Acquisition of property, plant and equipment (651,216) (221,701) Net proceeds from treasury investments - 13,000,000
Net cash �ows from / (used in) investing activities (651,216) 13,676,006
CASH FLOWS FROM / (USED IN) FINANCING ACTIVITIES
Net proceeds from �nancing and lease (ijara) (1,308,543) (1,146,410) Net cash �ows from / (used in) �nancing activities (1,308,543) (1,146,410)
NET INCREASE / (DECREASE) IN CASH AND CASH EQUIVALENTS 68,386,958 (328,809,197)
CASH AND CASH EQUIVALENTS AT THE BEGINNING 179,424,604 265,775,665 CASH AND CASH EQUIVALENTS AT THE END 247,811,562 (63,033,532)
(0) (0)

COMPANY STATEMENT OF CHANGES IN EQUITY
11
Stated Available for sale Retained TotalCompany Capital Reserve Earnings
Rs. Rs. Rs. Rs.
As at 01 April 2015 4,097,985,000 (12,346,510) 2,283,893,311 6,369,531,806
Loss for the period - - (41,648,427) (41,648,427) Other comprehensive income - (7,909,623) - (7,909,623) Total comprehensive income - (7,909,623) (41,648,427) (49,558,050)
As at 30 June 2015 4,097,985,000 (20,256,133) 2,242,244,884 6,319,973,756
As at 1 April 2016 4,097,985,000 (20,256,133) 1,786,534,393 5,864,263,260
Loss for the period - - (101,125,102) (101,125,102) Other comprehensive income - (23,728,870) - (23,728,870) Total comprehensive income - (23,728,870) (101,125,102) (124,853,972)
As at 30 June 2016 4,097,985,000 (43,985,003) 1,685,409,291 5,739,409,288

12
SEGMENT ANALYSIS OF REVENUE AND PROFIT
Logistics
For the three months ended 30th June Un-Audited 2016 Un-Audited 2015
Change
%
Revenue 12,404,969,008 11,851,059,844 5
Earnings Before �nance cost and Tax 498,139,553 420,352,124 19
Pro�t before tax 485,157,088 410,071,830 18
Pro�t for the period 389,517,791 317,429,747 23
Ventures
For the three months ended 30th June Un-Audited 2016 Un-Audited 2015
Change
%
Revenue 1,166,846,523 1,231,001,840 (5)
Earnings Before �nance cost and Tax (147,014,277) (64,540,819) 128
Pro�t before tax (157,392,346) (62,973,283) 150
Pro�t for the period (163,592,346) (62,973,283) 160
Leisure
For the three months ended 30th June
Un-Audited
2016
Un-Audited
2015
Change
%
Revenue 1,382,974,718 844,438,623 64
Earnings Before �nance cost and Tax 59,565,067 61,438,701 (3)
Pro�t before tax 49,931,793 53,675,900 (7)
Pro�t for the period 46,469,096 50,675,900 (8)

13
NOTES TO THE FINANCIAL STATEMENTS
1. Corporate Information
Expolanka Holdings PLC is a public limited Company incorporated and domiciled in Sri Lanka and ordinary shares of the
Company are listed on the Colombo Stock Exchange. The interim �nancial statements of the Group and the Company for
the three months ended 30 June 2016 were authorized for issue by the Board of Directors on 03 August 2016
2. Basis for preparation
The condensed interim �nancial statements of Expolanka Holdings PLC are for the three months ended 30 June 2016.
They have been prepared in accordance with LKAS 34, Interim Financial Reporting.
3. Share Information
3.1 Public share holding
The percentage of shares held by the public as at 30 June 2016 was
Issued Share Capital as at 30th June 2016 1,954,915,000
Less
Parent Company 1,319,165,681
Subsidiaries or Associate Companies of Parent 0
Subsidiaries or Associate Companies 0
Directors shareholding 147,021,464
Key Management Personnel 0
Spouses & Children under 18 of Directors 0
Chief Executive Of�cer's Shareholding (included in Directors shareholding) 0
CEO's Spouse & Children(included in Spouses & Children under 18 of Directors) 0
Public Holding 488,727,855
Public Holding as a % of Issued Share Capital 25.00%
Total No.of Shareholders representing the Public Holding as at 30th June 2016 6,970

14
NOTES TO THE FINANCIAL STATEMENTS
3.2 Directors share holdings
The number of shares held by the Board of Directors are as follows;
30.06.2016 31.03.2016 No of Shares No of Shares
N. Kondo Hanif Yusoof Osman Kassim
Nil
147,021,464 Nil
Nil
147,021,464 Nil
Sanjay Kulatunga Nil Nil Harsha Amarasekera Nil Nil N. Kawasaki Nil Nil Y. Matsubara Nil Nil M. Matzusono Nil Nil T. Shiho Nil Nil

15
NOTES TO THE FINANCIAL STATEMENTS
3.3 Twenty largest shareholders of the Company are as follows;
3 .4 . Stated capital
Stated capital is represented by the number of shares in issue as given below;
Name of Shareholder As at 30 June 16 % As at 31 Mar 16 % 1
2.
SG Holdings Global PTE.LTD Hanif Yusoof
1,319,165,681
147,021464
67.48%
7.52%
1,319,165,681
147,021,464
67.48%
7.52%
3 Farook Kassim 110,533,865
5.65% 110,533,865
5.65 %
4 Shafik Kassim 100,150,129
5.12% 100,150,129
5.12 %
5 Sattar Kassim 80,205,923 4.10 %
108,490,132 5.55 %
6
HSBC INTL NOM LTD-BBH-MATTHEWS EMERGING ASIA FUND 38,766,072 1.98 % 10,496,963 0.54%
7 HSBC INTL NOM LTD- SSBT-WASATCH INTERNATIONAL OPPORTUNITES FUND
34,679,767 1.71 % 57,183,777 2.93 %
8 Janashakthi General Insurance limited 10,038,263 0.51%
10,038,263 0.51%
9 Guardian Capital Partners PLC
6,845,150
0.35% 6,845,150
0.35%
10 People’s Bank
6,000,000 0.31% 6,000,000 0.31%
11 Janashakthi Insurance PLC (Policy Holders)
3,780,100 0.19% 3,780,100 0.19%
12 13 14. 15.
Employees Trust Fund Board MAS Capital (Private) Limited SEYLAN Bank PLC/ARC Capital (PVT) LTD SRI LANKA INSURANCE CORPORATION LTD –LIFE FUND
3,486,700
3,000,000
3,000,000
2,500,000
0.18%
0.15%
0.15%
0.13%
3,486,700
-
-
-
0.18% - - -
16. 17. 18.
Mohamed Haji Omar Hatton National Bank PLC A/C No.4 (HNB Retirement Pension Fund) Amana Bank PLC
2,102,990
2,000,000
1,800,000
0.11%
0.10%
0.09%
2,102,990
-
580,050
0.11% -
0.03%
19. Bank of Ceylon No.1 Account
1,716,193 0.09% 1,716,193
0.09%
20. Hatton National Bank PLC A/C No.05 (Trading Portfolio)
1,687,000 0.09% - -
As at 30 June 2016 31 March 2016
Ordinary shares 1,954,915,000 1,954,915,000

16
NOTES TO THE FINANCIAL STATEMENTS
3.5. Earnings per share
Earnings per share have been calculated for all periods based on the number of shares in issue as at the end of each period.
3.6. Market price per share
For the three months ended 30 June Highest 7.70 9.00Lowest 6.50 8.10Last Traded 6.50 8.10
4. Contingencies, capital and other commitments
There has been no signi�cant change in the nature of the contingencies, capital and other commitments, which were disclosed in the Annual Report for the year ended 31 March 2016.
5. Events after the reporting period
Expolanka Holdings PLC has disposed its entire 50% shareholding in Norfolk Foods (Pvt.) Ltd for a purchase consideration of USD 2,500,000.00 (USD Two Million Five Hundred Thousand only) to CPF Investment Ltd. The transaction took place on 14th July 2016.
6. Cluster
To support Expolanka Holdings PLC’s strategic objectives after divesting from many non-core businesses and to re�ect the way the company evaluates operational performance and allocates resources, the company has revised its �nancial reporting segments. As of the �rst quarter FY 2016/17, Expolanka Group will have three reportable segments: The (1) Logistics, (2) Leisure and the (3) Ventures reportable segment within the Group.
2016 RS
2015RS

17
CORPORATE INFORMATION
Name of Company
Expolanka Holdings PLC
Legal Form
The Company is a Public Limited Liability Company. Incorporated in Sri Lanka on 05th March 2003 as a Private
Limited Liability Company under the Companies Act No. 17 of 1982 and re-registered on 11th November 2008 as a
Public Limited Liability Company under the Companies Act No 07 of 2007. Currently ordinary shares have been listed
on the Colombo Stock Exchange.
Company Registration Number
P B 744
Board of Directors
Nobuaki Kondo – Chairman
Hanif Yusoof – Chief Executive Of�cer
Osman Kassim
Harsha Amarasekera
Sanjay Kulatunga
Naosuke Kawasaki
Motonori Matzusono
Yoshifumi Matsubara
Toji Shiho
Registered o�ce of the Company
10, Milepost Avenue,
Colombo 03
Sri Lanka
Audit Committee
Sanjay Kulatunga – Chairman
Harsha Amarasekera
Toji Shiho
Remuneration Committee
Harsha Amarasekera – Chairman
Sanjay Kulatunga

18
CORPORATE INFORMATION
Contact Details
P. O. Box 1162
10, Milepost Avenue
Colombo 03
Sri Lanka
Telephone : +94 11 4659500
Facsimile : +94 11 4659565
Internet : www.expolanka.com
Contact for Media
Marketing, Corporate Communications & CSR
Expolanka Holdings PLC
15 A, Clifford Avenue
Colombo 03
Sri Lanka
Telephone : +94 11 4659500
Facsimile : +94 11 4659565
Web : www.expolanka.com
Investor Relations
Expolanka Holdings PLC
15 A, Clifford Avenue
Colombo 03
Sri Lanka
Telephone : +94 11 4659500
Facsimile : +94 11 4659565
Web : www.expolanka.com
E mail : [email protected]

19
CORPORATE INFORMATION
Bankers
Amana Bank
Bank of Ceylon
Commercial Bank
Deutsche Bank
Habib Bank
Hatton National Bank
Hong Kong and Shanghai Banking Corporation
ICICI Bank Limited
Muslim Commercial Bank
National Development Bank
Nations Trust Bank
Pan Asia Bank Corporation
Peoples Bank
People’s Leasing Finance PLC
Sampath Bank
Seylan Bank
Standard Chartered Bank
Union Bank (Pakistan) Ltd
Company Secretaries
SSP Corporate Services (Private) Limited
P V 931
101, Inner Flower Road
Colombo 03
Sri Lanka
Telephone : +94 11 2573894, +94 11 2576871
Facsimile : +94 11 2573609
Company Auditors
Ernst and Young
Chartered Accountants
201, De Seram Place
P. O. Box 101
Colombo 10
Sri Lanka

www.expolanka.com