interim report january-march 2015 saab - … · interim report january-march 2015. magnus Örnberg,...
TRANSCRIPT

INTERIM REPORTJANUARY-MARCH 2015
Magnus Örnberg, EVP and CFO
7 January 2016
SAAB - OVERVIEW

AN OVERVIEW OF OUR COMPANY
14,700EMPLOYEES
SALES
23,527MSEK (2014)
Geographic sales distribution
CUSTOMERS IN
100COUNTRIES
45
22
14
108
Air
Land
Naval
Security
Commercialaeronautics
%
2

HISTORICAL PERSPECTIVESALES AND EBIT MARGIN1998-2014
0%
2%
4%
6%
8%
10%
12%
14%
0
5 000
10 000
15 000
20 000
25 000
30 000
1998 1999 2000 2001 2002 2003 2004 2005 2006 2007 2008 2009 2010 2011 2012 2013 2014
MSE
K
Sales, Sweden Sales, outside Sweden EBIT margin
Acquisition ofCelsius in 2000
Acquisition ofGrintek in 2005
Acquisition ofEMW
in 2006
Divestment ofSaab Space in
2008
Aquisition ofKockums in 2014
Divestment of share inC3-technologies in
2011
Aquisition of Sensis in2011
3
4
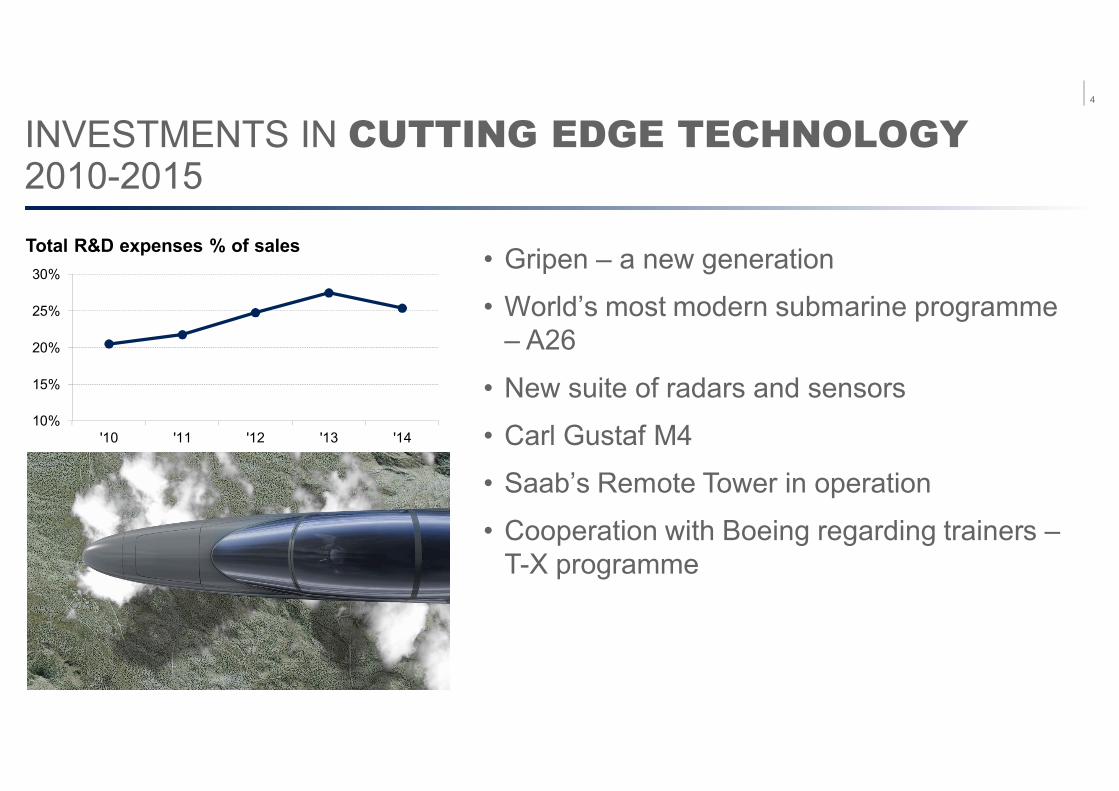
• Gripen – a new generation
• World’s most modern submarine programme– A26
• New suite of radars and sensors
• Carl Gustaf M4
• Saab’s Remote Tower in operation
• Cooperation with Boeing regarding trainers –T-X programme
10%
15%
20%
25%
30%
'10 '11 '12 '13 '14
INVESTMENTS IN CUTTING EDGE TECHNOLOGY2010-2015
Total R&D expenses % of sales
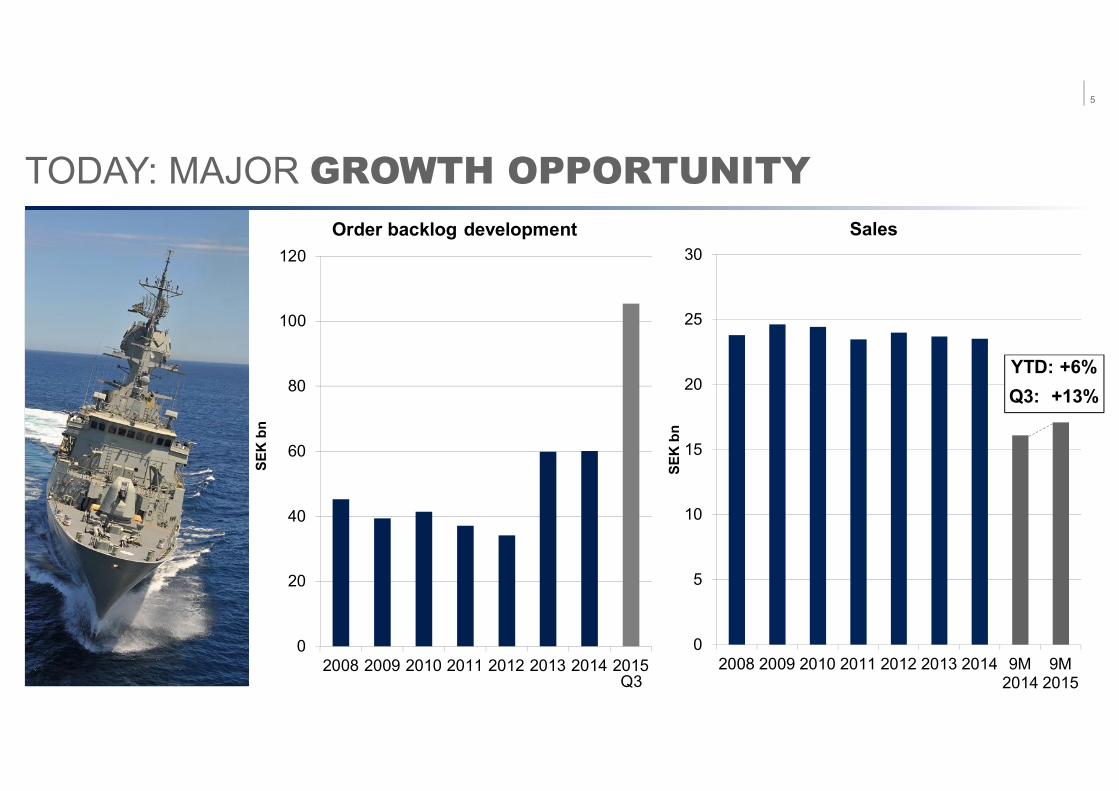
TODAY: MAJOR GROWTH OPPORTUNITY
0
20
40
60
80
100
120
2008 2009 2010 2011 2012 2013 2014 2015
SEK
bn
Order backlog development
0
5
10
15
20
25
30
2008 2009 2010 2011 2012 2013 2014 9M2014
9M2015
SEK
bn
Sales
5
Q3
YTD: +6%Q3: +13%

Brasilia,Brazil
Washington DC,USA
Stockholm,Sweden
London,United Kingdom
Bangkok,Thailand
ORGANISATION
Aeronautics
Security and Defence Solutions
Dynamics
Support and Services
Electronic Defence Systems
Industrial Products and Services
BUSINESS AREASBUSINESS AREAS
CEOCEO
GROUP FUNCTIONSGROUP FUNCTIONSMARKET AREASMARKET AREAS
Asia Pacific
North America
Europe, Middle East & Africa
Latin America
Nordic & Baltic
BOARDBOARD
Our headquarters…
6

SAAB’S BROAD OFFERING
7

GRIPENA GLOBAL SUCCESS STORY
• High performance andoutstanding availability
• Extremely agile andmanoeuvrable, full multirolecapabilities
• Small logistic footprint - cost-effective operations andupgrades
• Superior information sharing
• Very high weapon flexibility
Operated by airforces in fivecountries and theEmpire Test Pilots’School in the UK.
Also purchased byOPERATIONAL AND
MAINTENANCE COST
OPERATIONAL
EFFECT
COST
PRODUCTION ANDDEVELOPMENT COST
Target: 300-450 aircraft sold overthe next 20 years
This represents 10 per cent of theaccessible market
Gripen has won 50 per cent ofcompeted business opportunities
1950 2015
8
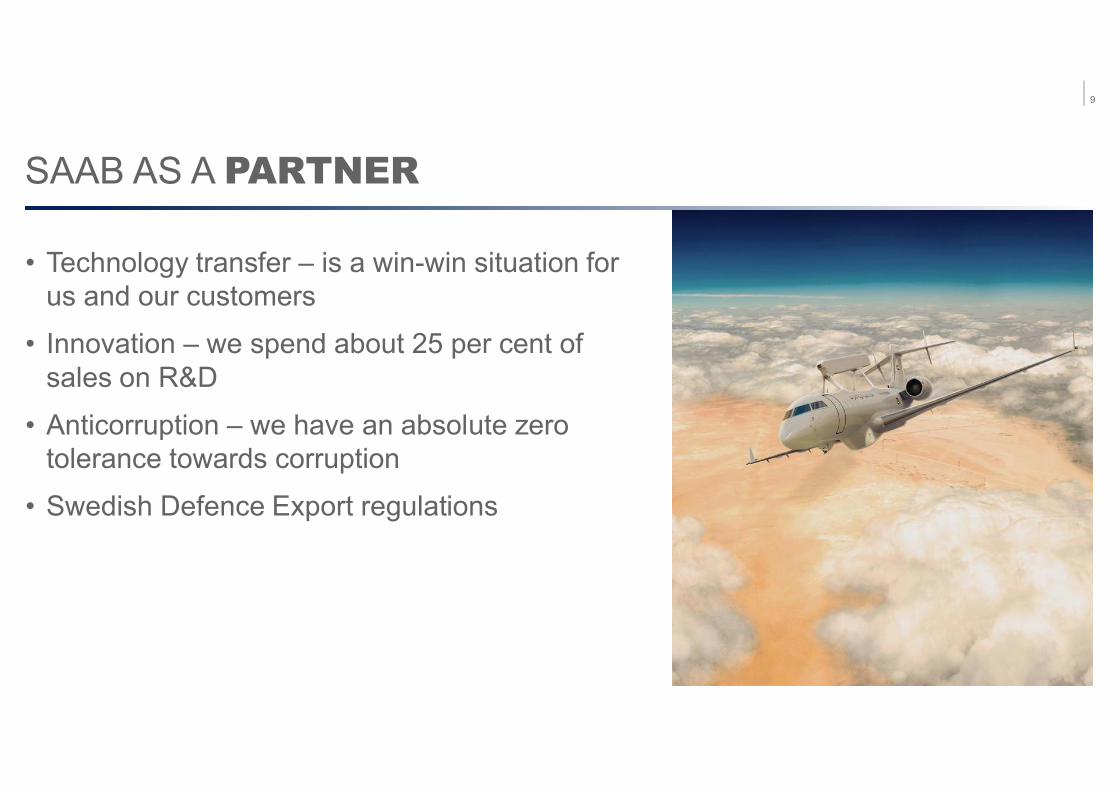
SAAB AS A PARTNER
• Technology transfer – is a win-win situation forus and our customers
• Innovation – we spend about 25 per cent ofsales on R&D
• Anticorruption – we have an absolute zerotolerance towards corruption
• Swedish Defence Export regulations
9

HIGHLIGHTS 2015
• Gripen NG contract with Brazil effective; order intake SEK 39.3 bn• Contract with Sweden for the construction of two Type A26 submarines
• UAE ordered New Advanced Airborne Surveillance Systems, USD 1.27 bn
• Margins in the period impacted by loss in Dynamics and continuedinvestments in the T-X* programme
• Positive operating cash flow in Q3 due to milestone payments related toGripen and submarine programmes
• Organisational change as of 1 January: business area Security DefenceSolutions dissolved
• Increased focus on performance management
PROFITABLEGROWTH
PERFOR-MANCE
PORTFOLIO& PEOPLE
*Saab cooperates with Boeing in order to participate in the U.S. Air Force’s upcoming procurement regarding trainer aircraft
STRENGTHENED MARKET POSITION
10
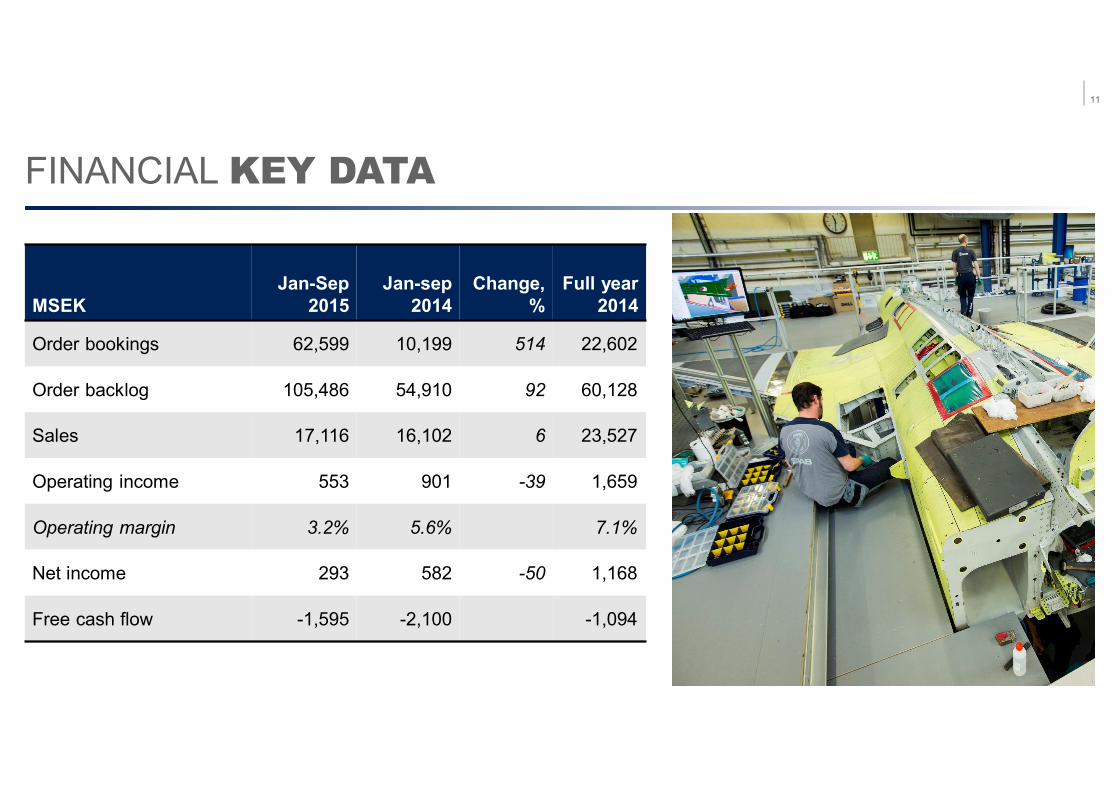
FINANCIAL KEY DATA
MSEKJan-Sep
2015Jan-sep
2014Change,
%Full year
2014
Order bookings 62,599 10,199 514 22,602
Order backlog 105,486 54,910 92 60,128
Sales 17,116 16,102 6 23,527
Operating income 553 901 -39 1,659
Operating margin 3.2% 5.6% 7.1%
Net income 293 582 -50 1,168
Free cash flow -1,595 -2,100 -1,094
11

ORDER BACKLOG
Order backlog duration, SEK bn
30 Sept 2015 31 Dec 2014 30 Sept 20142015: 7.7 2015: 17.8 2014: 6.92016: 18.2 2016: 10.2 2015: 14.42017: 14.0 2017: 5.7 2016: 8.42018: 10.9 2018: 5.6 2017: 5.0After 2018: 54.7 After 2018: 20.8 After 2017: 20.2Total: 105.5 Total: 60.1 Total: 54.9
0
20 000
40 000
60 000
80 000
100 000
120 000
'05 '06 '07 '08 '09 '10 '11 '12 '13 '14 Q3'15
MSE
K
Order backlog development
40%
60%
Order backlog distribution
SwedenRoW
12COMPANY UNCLASSIFIED | NOT EXPORT CONTROLLED
© Saab
ORDER BACKLOG STRENGTHENEDIN ALL BUSINESS AREAS Q3 VS. DEC ’14
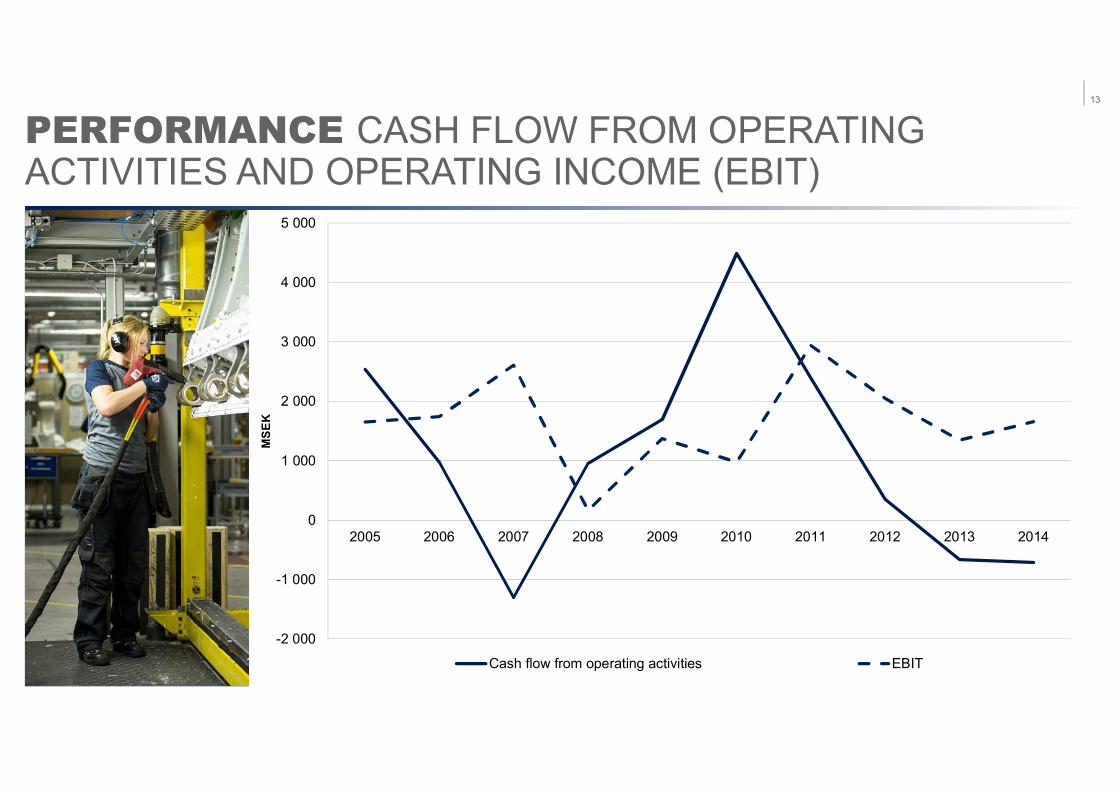
PERFORMANCE CASH FLOW FROM OPERATINGACTIVITIES AND OPERATING INCOME (EBIT)
-2 000
-1 000
0
1 000
2 000
3 000
4 000
5 000
2005 2006 2007 2008 2009 2010 2011 2012 2013 2014
MSE
K
Cash flow from operating activities EBIT
13

FINANCIAL POSITIONDevelopmentQ3 2015, MSEK
Net liquidity (+) / Net debt (-), 31 December 2014 -2,113Cash flow from operating activities -799
Change in net pension obligation 383
Net investments -796
Financial lease -444
Dividend -501
Currency impact and unrealised results from financialinvestments
-57
Net liquidity (+) / Net debt (-), 30 September 2015 -4,327
Net pension obligation, 30 September 2015 2,145
Total interest-bearing assets, 30 September 2015 -292
Liquidity -2,474
Equity/assets ratio, 30 September 2015 35.1
14
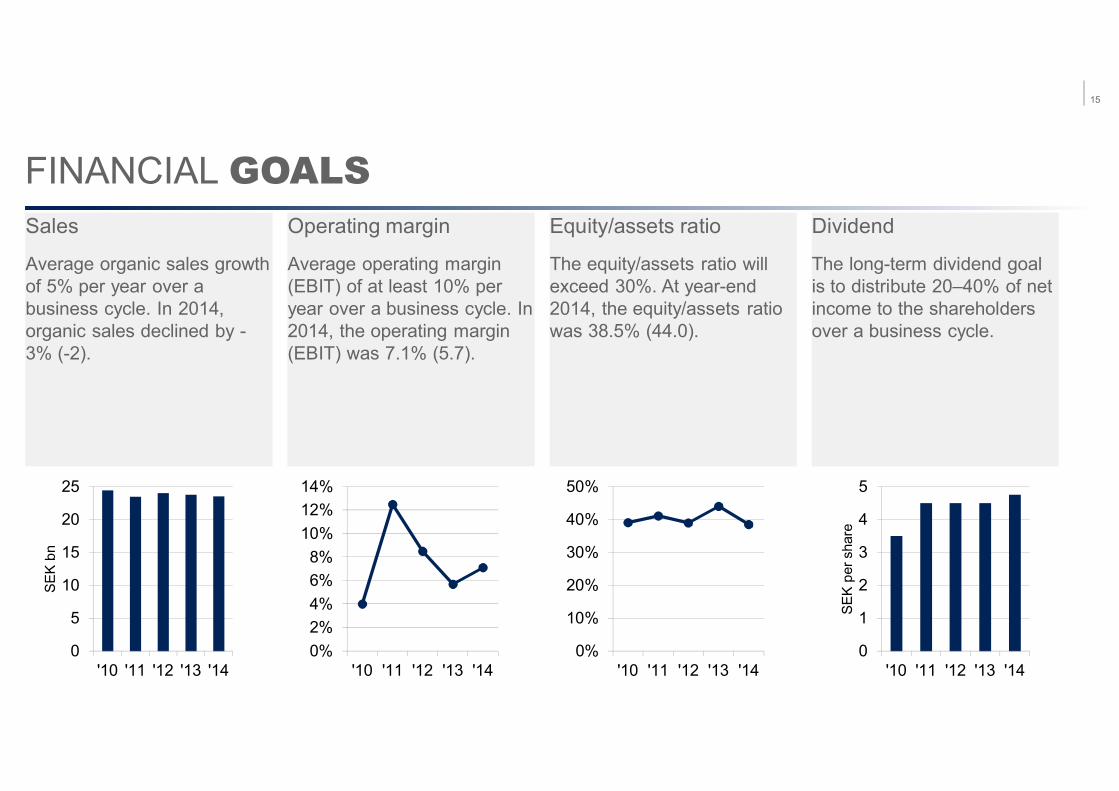
FINANCIAL GOALSSales
Average organic sales growthof 5% per year over abusiness cycle. In 2014,organic sales declined by -3% (-2).
Operating margin
Average operating margin(EBIT) of at least 10% peryear over a business cycle. In2014, the operating margin(EBIT) was 7.1% (5.7).
Equity/assets ratio
The equity/assets ratio willexceed 30%. At year-end2014, the equity/assets ratiowas 38.5% (44.0).
Dividend
The long-term dividend goalis to distribute 20–40% of netincome to the shareholdersover a business cycle.
0
5
10
15
20
25
'10 '11 '12 '13 '14
SEK
bn
0%
10%
20%
30%
40%
50%
'10 '11 '12 '13 '140%2%4%6%8%
10%12%14%
'10 '11 '12 '13 '140
1
2
3
4
5
'10 '11 '12 '13 '14
SEK
pers
hare
15
OUTLOOK STATEMENT 2015
• In 2015, we estimate sales to increase more than Saab’s long-term goal: annual organic sales growth of 5 per cent.
• The operating margin 2015 excluding material non-recurringitems is expected to be in line with the operating margin in 2014.In 2015, increased internally funded research and developmentefforts within Aeronautics will have a negative impact on theoperating margin.
16

UNIQUE MARKET POSITION
• Record high order backlog – strong platform forgrowth
• Portfolio with cutting edge products andsolutions
• Increasing local presence with establishedpartnerships
• Proven functionality and cost-efficient solutions
Focus going forward:Utilize market momentumIncrease efficiencyStreamline portfolio
17

APPENDIX