interim report january–june 2015 - … interim report billerudkorsnÄs aktiebolag (publ)...
TRANSCRIPT

Strong result impacted by extra
costs from upgrade
INTERIM REPORT January–June 2015
KEY HIGHLIGHTS Net sales for the quarter was SEK 5 489 million (5 128). Earnings per share for the quarter was SEK 1.92 (1.39). Operating profit increased with 20% compared to Q2 2014 to
SEK 542 million (450). The fluting machine in Gruvön (PM6) was successfully upgraded
during the planned maintenance shutdown and the quality improvements are above expectations.
Start-up of PM6 was delayed and caused extra costs of approximately SEK 50 million.
Net sales Jan-Jun 2015 increased 6% and operating profit increased 25% compared to the same period last year mainly due to a favourable currency situation.
Outlook Demand and orders situation for the third quarter is expected to
be stable with normal seasonal variances for all business areas. Average prices in local currency in the third quarter are
anticipated to be stable as effects from previously announced price increases for fluting are starting to show.
No changes to wood prices are anticipated for the third quarter. There are planned maintenance shutdowns in Gävle and
Karlsborg in the third quarter of 2015. The divestiture of Latgran will improve net debt/equity with 0.10
and operating profit with approximately SEK 400 million in the third quarter.
KEY FIGURES
For further information, please contact Per Lindberg, CEO or Susanne Lithander, CFO, +46 (0)8 553 335 00
The information in this report is such that BillerudKorsnäs AB (publ) is obliged to disclose under the Swedish Securities Market Act and was submitted for publication at 10.00 CET on 20 July 2015.
Q2 Q2 Jan-Jun Jan-Jun
SEKm 2015 2014 Change 2015 2014 Change
Net sales 5 489 5 128 7% 11 123 10 538 6%
EBITDA 897 793 13% 1 948 1 678 16%
EBITDA, % 16% 15% 18% 16%
Operating profit 542 450 20% 1 240 991 25%
Operating margin, % 10% 9% 11% 9%
Net profit/loss for the period 403 292 38% 907 661 37%
Earnings per share, SEK 1.92 1.39 38% 4.30 3.14 37%
Operating cash flow 323 433 -25% 1 056 818 29%
ROCE, % N/A N/A 12% 8%
Working Capital, % of net sales 11% 13% 11% 13%
Net debt/equity ratio 0.62 0.79 0.17 0.62 0.79 0.17

2
INTERIM REPORT BILLERUDKORSNÄS AKTIEBOLAG (PUBL) JANUARY–JUNE 2015
Comments by CEO
Strong result impacted by extra costs from upgrade “We deliver a result for the quarter that is strong, but burdened with extra costs for the upgrade of our fluting machine in Gruvön. Technically, the upgrade is a success and the quality improvements are above expectations, but it took a bit longer to implement than estimated.”
THE RESULT The second quarter’s operating margin of 10% was negatively impacted by the planned maintenance shutdown and the extra costs for implementation of the upgrade of the fluting machine in Gruvön, all in all approximately SEK 170 million. I am however content with the underlying result we produce. Overall the weak SEK continues to be positive for us. Our growth 2015 is largely driven by favourable currency developments, and our volumes have suffered partly due to investments and rebuilds. We have given priority to longer-term capacity enhancements rather than short term volume maximizations. Still our volume growth in business area Consumer Board for the first half of the year was 6% and above the plan. Our net debt/equity ratio increased to 0.62 due to our dividend pay-out. Return on capital employed improved to 12% and we continue to close in on our targeted 13%, so overall we are performing well in line with our targets.
MARKET OUTLOOK The overall market has been stable during the quarter. We expect the market to continue to be stable with good demand and little changes in local prices.
We see no reason to change our outlook for business area Packaging Paper. Increased competition pressures local prices within the MF segment and we did not utilise our full capacity during the quarter. This situation was anticipated and is likely to continue. Meanwhile the market situation for sack paper and the MG segments are solid which makes the outlook for the business area quite stable and balanced.
Consumer Board market continues to be stable.
Within Containerboard, the fluting segment is currently very strong, with strong order books and with previously announced local price increases starting to show. We are also expecting the improved product quality from the machine upgrade to support additional value growth in the business area in the longer-term. In the liner segment, competition continues to increase with increased capacity on the market. But local prices have been kept stable during the quarter, helped by low stocks, announced price increases for waste based papers, and a strong USD that favours European kraftliner.
STRATEGY One of our strategic stepping stones is to expand our position both in the value chain as well as geographically. We want to expand our offering and our networks to include stakeholders beyond converters, for instance brand owners.
In our efforts to achieve our ambitions in this area it is worth mentioning that our JV, FibreForm Packaging, has taken its first order where a complete system solution has been sold containing a FreeFormPack machine with deliveries of FibreForm material to one of Europe’s largest co-packer, Vetipack.
When it comes to geographical expansion our goal is that more than 50% of our future growth will come from outside of Europe. Here we have finalised establishment of companies in India and USA and they are fully operational. We are also finalising the set-up of a company and a complete customer service center in Singapore.
Per Lindberg, President and CEO
SEK 5 489 m NET SALES
SEK 542 m OPERATING PROFIT
10% OPERATING MARGIN

INTERIM REPORT BILLERUDKORSNÄS AKTIEBOLAG (PUBL) JANUARY–JUNE 2015 3
Sales and results
Q2 2015 COMPARED TO Q1 2015
Sales for the second quarter were 3% lower than the seasonally strong first quarter. Besides seasonality, the quarter was also impacted by the planned maintenance shutdown in Gruvön. The lost volumes mainly impacted business area Containerboard, but also had a negative effect on sales of Packaging Paper. Lower sales combined with the increased costs both related to the maintenance shutdown led to a 22% decrease in operating profit compared to the previous quarter. Excluding the maintenance shutdown effect, operating profit was slightly above previous quarter. Operating margin was lower than the previous quarter but the group still reached the 10% target.
Q2 2015 COMPARED TO Q2 2014
Sales growth for the Group was 7%, driven by a favourable currency development related to the strengthened EUR and USD. Volumes for Consumer Board grew at a rate above target, due to the positive development for liquid packaging board. Volumes were reduced within business area Containerboard, due to the delayed start-up after the maintenance shutdown in Gruvön compared to last year. For business area Packaging Paper volumes were reduced due to lower demand and order intake for the MF segment. The sales development was to some extent offset by the currency development on externally purchased raw material as well as by increased costs for the maintenance shutdown in Gruvön.
CHANGE IN OPERATING PROFIT Q2 2015 COMPARED TO Q2 2014, SEKm
* Effects of exchange rate fluctuations totalling SEK 179 million comprise the following components: change in
spot rates SEK 239 million, currency hedging SEK 48 million and currency effects from revaluation of trade
receivables and payments from customers SEK -108 million.
542
450
Q2 2015Q2 2014
-23
-5
-63
16
-12
179
Sales and production volumes, incl. product mix
Selling prices (in respective sales currency)
Change in variable costs
Change in fixed costs
Change in depreciat ion
Effects of exchange rate f luctuations, incl. hedging*
Lower sales as compared to the seasonally strong first quarter combined with negative impact from the maintenance shutdown in Gruvön leads to lower profit than in the first quarter.
Favourable exchange rates drives net sales growth and profit improvement compared to previous year.
OPERATING MARGIN TARGET LEVEL >10%
6%
9%
12%
10%
0
0 .0 2
0 .0 4
0 .0 6
0 .0 8
0 .1
0 .1 2
0 .1 4
2013 2014 Q1-15 Q2-15

4
INTERIM REPORT BILLERUDKORSNÄS AKTIEBOLAG (PUBL) JANUARY–JUNE 2015
JAN-JUN 2015 COMPARED TO JAN-JUN 2014
The favourable currency development had a positive impact on the Group and sales increased with 6%. The liquid packaging board segment continued to grow and business area Consumer Board showed a 6% volume increase whereas business area Containerboard was impacted negatively mainly by the delayed start-up in Gruvön after the maintenance shutdown but also by the competitive liner market. Business area Packaging Paper had lower volumes due to additional capacity on the MF kraft paper market. Operating profit for the Group increased with 25% due to a favourable currency situation, which was offset by the currency impact on externally purchased material. Operating margin also developed positively and reached 11% which is above target.
* Effects of exchange rate fluctuations totalling SEK 431 million comprise the following components: change in
spot rates SEK 536 million, currency hedging SEK -54 million and currency effects from revaluation of trade
receivables and payments from customers SEK -51 million.
1240
991
Jan-Jun2015
Jan-Jun2014
-46
43
-165
7
-21
431
Sales and production volumes, incl. product mix
Selling prices (in respective sales currency)
Change in variable costs
Change in fixed costs
Change in depreciat ion
Effects of exchange rate f luctuations, incl. hedging*
Operating profit grew with 25% due to increased sales related to currency situation which was offset by increased variable costs.

INTERIM REPORT BILLERUDKORSNÄS AKTIEBOLAG (PUBL) JANUARY–JUNE 2015 5
Packaging Paper business area
KRAFT AND SACK PAPER FOR CUSTOMERS WITH TOUGH DEMANDS
The Packaging Paper business area offers kraft and sack paper of premium quality plus smart solutions for customers in the industrial, medical and consumer segments. The business area also sells surplus pulp that BillerudKorsnäs does not use in its own production1. The business areas largest markets are Europe and Asia.
KEY FIGURES
Q2 2015 COMPARED TO Q2 2014 Due to a favourable development of the exchange rates and product mix, net sales increased with 8% compared to Q2 2014, despite a sales volume decrease of 2%. The volume loss is due to more capacity and increased competition on the MF kraft paper market. The price level in local currency was slightly below last year’s level.
The increased net sales combined with a cost level in line with last year led to an operating profit improvement of 45%. BillerudKorsnäs’ integrated paper mills and the profitability of their products were good, whereas BillerudKorsnäs’ non-integrated mills suffered from higher raw material costs due to unfavourable exchange rates. During Q2 2015 the paper machines in Finland were not running at full capacity, and the production unit Gruvön carried out an annual maintenance shutdown.
JAN-JUN 2015 COMPARED TO JAN-JUN 2014 Due to a favourable currency situation and product mix, net sales increased with 7% compared to first half of 2014, despite a sales volume decrease of 3%.
The increased net sales combined with a cost level in line with last year led to an improvement of operating profit with 56%.
MARKET DEVELOPMENT The market situation remained stable during the second quarter. Prices in local currency were slightly below previous quarters.
The market for NBSK pulp weakened somewhat during the quarter, this compared with the previous quarter. Prices decreased to approximately USD 850 per tonne at the end of the quarter, compared with approximately USD 880 at the end of the first quarter.
OUTLOOK During next quarter the overall Packaging Paper sales are expected to be slower due to the annual maintenance shutdown in Karlsborg. MF kraft paper market remains slow and the brown sack paper market is expected to stay stable. Prices in local currency are expected to be stable, pending effects from announced price increases.
1 The Packaging Paper business area buys and sells pulp at market price. The business area’s net exposure in market pulp is estimated to average approximately 150 ktonnes annually.
Full year
SEKm Q2 -15 Q2 -14 2015 2014 2014
Net sales 2 176 2 016 4 358 4 084 8 101Net operating expenses, other -1 813 -1 728 -3 560 -3 491 -6 928EBITDA 363 288 798 593 1 173EBITDA, % 17% 14% 18% 15% 14%Operating profit/loss 245 169 562 360 701Operating margin, % 11% 8% 13% 9% 9%
Sales volumes, ktonnes 288 294 588 604 1 167whereof packaging paper 180 200 378 407 776
Quarter Jan-Jun
SHARE OF GROUP’S NET SALES Q2 2015
OPERATING PROFIT
40%
169 158183
317
245
8 89
15
11
0
2
4
6
8
1 0
1 2
1 4
1 6
1 8
2 0
0
5 0
1 00
1 50
2 00
2 50
3 00
3 50
Q2 -14 Q3 -14 Q4 -14 Q1 -15 Q2 -15

6
INTERIM REPORT BILLERUDKORSNÄS AKTIEBOLAG (PUBL) JANUARY–JUNE 2015
Consumer Board business area LIQUID PACKAGING BOARD AND CARTONBOARD WITH UNIQUE PROPERTIES
The Consumer Board business area delivers packaging solutions made from high-quality cartonboard for beverages, foods and other consumer goods. Smart solutions in function, design and material selection add further value for the customer. Europe is the largest market.
KEY FIGURES
Q2 2015 COMPARED TO Q2 2014 Due to higher sales volumes and a more favourable currency exchange rate, net sales increased with approximately 12% compared to Q2 2014. Sales volume increased with 10% which is above targeted growth rate. The increased net sales led to improved operating profit with 23%, to some extent offset by higher variable costs. The increase in variable costs was mainly due to the weaker SEK.
JAN-JUN 2015 COMPARED TO JAN-JUN 2014 Due to higher sales volume and a favourable development of the currency exchange rate, net sales increased with 8% compared to first half of 2014. Sales volume increased with 6% which is above targeted growth rate.
The increased net sales led to improved operating profit with 23%, to some extent offset by higher variable costs. The increase in variable costs was mainly due to the weaker SEK.
MARKET DEVELOPMENT The order situation for liquid packaging board and cartonboard in the second quarter was stable and satisfactory with normal seasonal variances. Prices in local currency were stable compared to the previous quarter.
OUTLOOK Order situation and deliveries for liquid packaging board and cartonboard are expected to continue to be stable and satisfactory with normal seasonal variances.
Full year
SEKm Q2 -15 Q2 -14 2015 2014 2014
Net sales 2 044 1 822 4 067 3 771 7 436Net operating expenses, other -1 558 -1 403 -3 115 -2 950 -5 852EBITDA 486 419 952 821 1 584EBITDA, % 24% 23% 23% 22% 21%Operating profit/loss 310 253 600 486 915Operating margin, % 15% 14% 15% 13% 12%
Sales volumes, ktonnes 274 249 546 517 1 004
Quarter Jan-Jun
SHARE OF GROUP’S NET SALES Q2 2015
OPERATING PROFIT
37%
253 243186
290 310
14 1311
14 15
0
2
4
6
8
1 0
1 2
1 4
1 6
1 8
2 0
0
5 0
1 00
1 50
2 00
2 50
3 00
3 50
Q2 -14 Q3 -14 Q4 -14 Q1 -15 Q2 -15
INTERIM REPORT BILLERUDKORSNÄS AKTIEBOLAG (PUBL) JANUARY–JUNE 2015 7
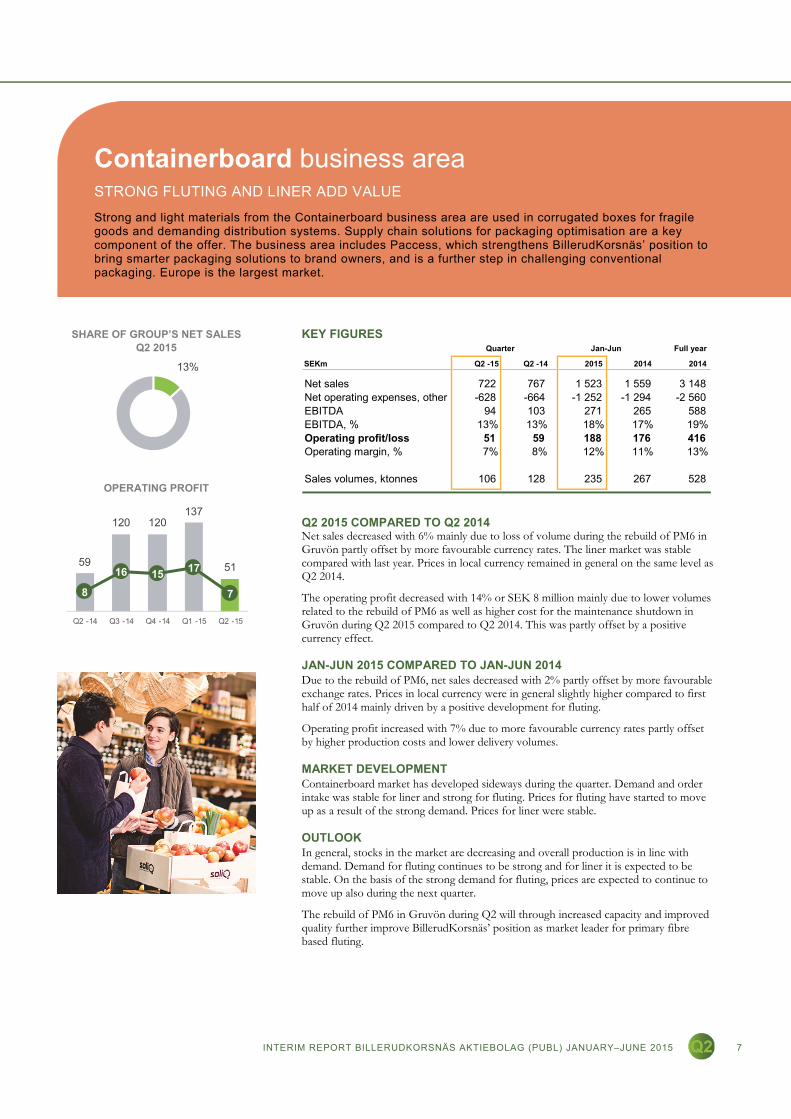
Containerboard business area STRONG FLUTING AND LINER ADD VALUE
Strong and light materials from the Containerboard business area are used in corrugated boxes for fragile goods and demanding distribution systems. Supply chain solutions for packaging optimisation are a key component of the offer. The business area includes Paccess, which strengthens BillerudKorsnäs’ position to bring smarter packaging solutions to brand owners, and is a further step in challenging conventional packaging. Europe is the largest market.
KEY FIGURES
Q2 2015 COMPARED TO Q2 2014 Net sales decreased with 6% mainly due to loss of volume during the rebuild of PM6 in Gruvön partly offset by more favourable currency rates. The liner market was stable compared with last year. Prices in local currency remained in general on the same level as Q2 2014.
The operating profit decreased with 14% or SEK 8 million mainly due to lower volumes related to the rebuild of PM6 as well as higher cost for the maintenance shutdown in Gruvön during Q2 2015 compared to Q2 2014. This was partly offset by a positive currency effect.
JAN-JUN 2015 COMPARED TO JAN-JUN 2014 Due to the rebuild of PM6, net sales decreased with 2% partly offset by more favourable exchange rates. Prices in local currency were in general slightly higher compared to first half of 2014 mainly driven by a positive development for fluting.
Operating profit increased with 7% due to more favourable currency rates partly offset by higher production costs and lower delivery volumes.
MARKET DEVELOPMENT Containerboard market has developed sideways during the quarter. Demand and order intake was stable for liner and strong for fluting. Prices for fluting have started to move up as a result of the strong demand. Prices for liner were stable.
OUTLOOK In general, stocks in the market are decreasing and overall production is in line with demand. Demand for fluting continues to be strong and for liner it is expected to be stable. On the basis of the strong demand for fluting, prices are expected to continue to move up also during the next quarter.
The rebuild of PM6 in Gruvön during Q2 will through increased capacity and improved quality further improve BillerudKorsnäs’ position as market leader for primary fibre based fluting.
Full year
SEKm Q2 -15 Q2 -14 2015 2014 2014
Net sales 722 767 1 523 1 559 3 148Net operating expenses, other -628 -664 -1 252 -1 294 -2 560EBITDA 94 103 271 265 588EBITDA, % 13% 13% 18% 17% 19%Operating profit/loss 51 59 188 176 416Operating margin, % 7% 8% 12% 11% 13%
Sales volumes, ktonnes 106 128 235 267 528
Quarter Jan-Jun
SHARE OF GROUP’S NET SALES Q2 2015
OPERATING PROFIT
13%
59
120 120137
51
8
16 1517
70
5
1 0
1 5
2 0
2 5
3 0
3 5
4 0
0
2 0
4 0
6 0
8 0
1 00
1 20
1 40
1 60
Q2 -14 Q3 -14 Q4 -14 Q1 -15 Q2 -15

8
INTERIM REPORT BILLERUDKORSNÄS AKTIEBOLAG (PUBL) JANUARY–JUNE 2015
Currency hedging
During the second quarter 2015, net flows were hedged at EUR/SEK 9.29 (8.74), USD/SEK 7.15 (6.63) and GBP/SEK 11.45 (10.35). Currency hedging had an overall earnings impact of SEK -11 million (-59) for the second quarter and SEK -117 million (-62) for the first half of 2015 (compared to no hedging).
The outstanding forward exchange contracts at 30 June 2015 had a market value of SEK 58 million, whereof SEK -7 million is the part of the contracts matched by trade receivables that has affected earnings in the second quarter. Accordingly, other contracts had a market value of SEK 65 million.
HEDGED PORTION OF THE FORECASTED CURRENCY FLOWS FOR EUR, USD AND GBP AND EXCHANGE RATES AGAINST SEK (30 JUNE 2015)
*On 30 June 2015
The table above excludes transactions related to the sale of SIA Latgran.
The currency hedging policy is to hedge 0-80% of forecasted net flows over the coming 15 months. Any deviation from the policy must be approved by the Board of Directors.
Investments and capital employed
Gross investments amounted to SEK 498 million (303) for the second quarter and SEK 744 million (583) for the first half of 2015. In line with the Group’s strategy for growth, investments for 2015 will amount to approximately SEK 1 700 million.
Capital employed at 30 June 2015 amounted to SEK 17 774 million (18 115). Return on capital employed, calculated over the past 12-month period, amounted to 12% (8%). Return on equity was 15% (10%).
Currency Q3 -15 Q4 -15 Q1 -16 Q2 -16 Q3-16
Total 15 months
EUR Share of net flow 90% 91% 63% 37% 68%Rate 9.40 9.49 9.54 9.54 9.48
USD Share of net flow 74% 69% 62% 10% 42%Rate 7.94 8.30 8.48 8.73 8.25
GBP Share of net flow 29% 10% 8%Rate 11.63 11.67 11.64
-5 22 27 14 - 58Market value of currency contracts*
SEK -11 million earnings impact for the quarter.
RETURN ON CAPITAL EMPLOYED TARGET LEVEL >13%
6.3%
10.5%11.5%
12.0%
0
0 .0 2
0 .0 4
0 .0 6
0 .0 8
0 .1
0 .1 2
0 .1 4
2013 2014 Q1-15 Q2-15

INTERIM REPORT BILLERUDKORSNÄS AKTIEBOLAG (PUBL) JANUARY–JUNE 2015 9
Cash flow and financial position
SUMMARY CASH FLOW STATEMENT
Operating cash flow during the first half of 2015 amounted to SEK 1 056 million (818). The increase was mainly due to improved operating profit and repayment of preliminary tax payments of approximately SEK 300 million. Working capital in relation to sales was 11%, which is the same level as previous quarter, and the company continues to implement activities to reach the 10% target.
Net interest-bearing debt on 30 June 2015 was SEK 6 798 million (8 022). The Group’s net debt/equity ratio at the end of the period was 0.62 (0.79). This is an increase from the first quarter with 0.05 due to the dividend pay-out during the second quarter. BillerudKorsnäs’ financial target for net debt/equity ratio is to be less than 0.90.
Financing
Interest-bearing loans amounted to SEK 6 191 million, an increase of SEK 23 million since last quarter. Commercial papers decreased by SEK 605 million while other short term interest-bearing liabilities increased by SEK 773 million. Latgran’s external debt was pre-paid as well as the outstanding amount of the Group’s revolving credit facility.
The syndicated revolving credit facility of SEK 5 500 million matures 2019.
SEKm Q2 -15 Q2 -14 2015 2014
Operating surplus, etc. 897 761 1 918 1 614Change in working capital, etc. 28 128 -186 102Net financial items, taxes, etc. -104 -153 66 -315Cash flow from operating activities 821 736 1 798 1 401
Current net investments -498 -303 -742 -583Operating cash flow 323 433 1 056 818
Jan-JunQuarter
Total
Loan Limit, SEKm 0-1 1-2 2- utilized
Syndicated credit facilities 5 500 0Term loans 800 600 400 1 800Bond loans within MTN program 5 000 400 1 800 2 200Other bond loans 150 150Commercial paper 3 000 687 687Term loan, Bomhus Energi AB 34 37 509 580Other interest-bearing liabilities 774 774Group total 2 445 1 037 2 709 6 191
Maturity, years
NET DEBT/EQUITY RATIO TARGET LEVEL <0.9
DIVIDEND POLICY TARGET LEVEL >50%
0.85
0.670.57 0.62
0 .0 0
0 .1 0
0 .2 0
0 .3 0
0 .4 0
0 .5 0
0 .6 0
0 .7 0
0 .8 0
0 .9 0
1 .0 0
2013 2014 Q1-15 Q2-15
2.82 2.822.00 2.25
3.15
51 5361
69
51
0
0 .1
0 .2
0 .3
0 .4
0 .5
0 .6
0 .7
0 .8
0
1
2
3
4
5
6
7
2011 2012 2013 2014 2015
Dividend payout ratio, %

10
INTERIM REPORT BILLERUDKORSNÄS AKTIEBOLAG (PUBL) JANUARY–JUNE 2015
Seasonal effects
BillerudKorsnäs’ business is to a relatively limited extent subject to seasonal fluctuations. The greatest impact is from periodic maintenance shutdowns, during which the unit concerned is idle for approximately a week. The loss of production results in somewhat lower deliveries over an extended period before, during and after the shutdown.
PLANNED MAINTENANCE SHUTDOWNS In addition to on-going maintenance during production, BillerudKorsnäs’ production units normally also require more extensive maintenance at some time during the year. In order to carry out maintenance, production of pulp, paper and board is stopped – known as a maintenance shutdown. The cost of a maintenance shutdown mainly comprises the loss of volume related to the shutdown and fixed costs, mainly in the form of costs of maintenance and overtime work, as well as - to some extent - variable costs such as higher consumption of electricity and wood when production is restarted. The effects of shutdowns on earnings vary depending on the extent of measures carried out, their nature and the actual length of the shutdown. The estimated cost of shutdown is an assessment of the impact on earnings of a normal shutdown, compared to a quarter during which no periodic maintenance shutdown takes place.
Estimated shutdown cost
1 Maintenance shutdowns at Beetham, Rockhammar and Tervasaari have an insignificant effect on
BillerudKorsnäs’ total earnings.
During the second quarter 2015 a planned maintenance shutdown took place at the production unit in Gruvön. The impact on the quarterly earnings was approximately SEK 170 million, which was approximately SEK 50 million higher than estimated. The extra costs were due to start-up delays following extensive upgrade of PM6.
Production units
Estimated shutdown cost ¹
Planned dates of maintenance shutdown
SEKm Packaging Consumer Container- 2016 | 2015 | 2014Paper Board board
Gävle ~ 130 ~ 5% ~ 80% ~ 15% Q3 | Q3 | Q4Gruvön ~ 120 ~ 40% ~ 5% ~ 55% Q2 | Q2 | Q2Frövi ~ 70 0% 100% 0% Q4 | Q4 | Q3Skärblacka ~ 75 ~ 85% 0% ~ 15% Q2 | Q4 | Q3Karlsborg ~ 55 100% 0% 0% Q3 | Q3 | Q3Pietarsaari ~ 15 100% 0% 0% - | Q4 | Q2
Estimated breakdown of shutdown cost by business area

INTERIM REPORT BILLERUDKORSNÄS AKTIEBOLAG (PUBL) JANUARY–JUNE 2015 11
Parent company
Per 31 December 2014 BillerudKorsnäs AB has sold its assets and liabilities in the Gruvön production unit to the subsidiary BillerudKorsnäs Sweden AB and a capital loss of SEK -1 584 million arised. This capital loss is eliminated on Group level and has no impact on the Group’s income statement or balance sheet.
The parent company BillerudKorsnäs AB includes from 2015 the sales organisation for the Nordic market and markets outside Europe, and the head office functions.
Operating profit for the first half of 2015 amounted to SEK -263 million compared with SEK -170 million for the first half of 2014 excluding operating profit from the Gruvön production unit. The decrease is mainly due to negative impact from hedging contracts and revaluations of accounts receivable.
The parent company hedges both its’ own and the Group’s net currency flows. The parent company’s earnings include the results of these hedging measures. This result amounted to SEK -117 million (-62).
The parent company has received dividend from subsidiaries amounted to SEK 1 512 million (16).
The average number of employees was 92 (88). Cash and bank balances and short-term investments amounted to SEK 7 million (18).
Largest shareholders
BILLERUDKORSNÄS’ TEN LARGEST SHAREHOLDERS (30 JUNE 2015)
Distribution of shares
DISTRIBUTION OF SHARES (30 JUNE 2015)
Number of Number of
Shareholder shares votes, %
FRAPAG Beteiligungsholding AG 31 300 000 15.1AMF Insurance & Funds 16 641 125 8.0Swedbank Robur Funds 9 448 810 4.6Fourth Swedish National Pension Fund 6 697 299 3.2Lannebo Funds 6 030 150 2.9Norges Bank Investment Management 4 718 698 2.3Nordea Funds 4 546 018 2.2SHB Funds 4 354 907 2.1DFA Funds (USA) 4 263 193 2.1Alecta 3 500 000 1.7Total 10 largest shareholders 91 500 200 44.2Total number of shares in the market 206 951 152 100.0
Registered number of shares 208 219 834Bought back shares -1 268 682Total number of shares in the market 206 951 152

12
INTERIM REPORT BILLERUDKORSNÄS AKTIEBOLAG (PUBL) JANUARY–JUNE 2015
Long-term incentive program 2015
At the 2015 AGM, it was resolved that a long-term incentive programme (LTIP 2015) should be introduced at BillerudKorsnäs, combined with a transfer of individual holdings of own shares. BillerudKorsnäs has already two existing long-term incentive programmes (LTIP 2013 and LTIP 2014).
The objective of LTIP 2015 is to underpin BillerudKorsnäs’ ability to retain its best talents for critical leadership positions, as well as to spur those participating into increased efforts by linking their interests and viewpoints with those of the shareholders. The programme extends to a maximum of 75 executive officers, other key employees and talents in the BillerudKorsnäs Group. LTIP 2015 runs for three years starting in 2015. LTIP 2015 has the same structure as earlier long-term incentive programs (2010-2014). Its outcome will be determined by the extent to which various financial performance requirements are achieved. The maximum number of BillerudKorsnäs shares encompassed by LTIP 2015 is 328 432, corresponding to approximately 0.2% of the total number of BillerudKorsnäs shares outstanding and the number of votes to be cast. The maximum estimated cost of LTIP 2015 is estimated at approximately SEK 72 million, including social security costs of SEK 41 million.
More information on LTIP 2015 is available in the documents for the 2015 AGM, which are available on BillerudKorsnäs’ website.
Significant risks and uncertainties
BillerudKorsnäs’ products are generally dependent on the business cycle, in terms of both price development and potential sales volumes. The Group is exposed to currency fluctuations, since most revenues are invoiced in foreign currency, while a large part of operating expenses are in SEK. A more in-depth description of risks and a sensitivity analysis is provided on pages 21-26 of the 2014 Annual Report.
INTERIM REPORT BILLERUDKORSNÄS AKTIEBOLAG (PUBL) JANUARY–JUNE 2015 13
Related party transactions
No transactions have taken place between BillerudKorsnäs and related parties that significantly affect the company’s position and earnings.
Events after the end of the quarter
On July 1st the divestiture of SIA Latgran to Graanul Invest AS closed. BillerudKorsnäs ownership in SIA Latgran was 75%. The total consideration for 100 percent of the Company amounted to EUR 104 million on a cash and debt free basis. The capital gain on the sale will be approximately SEK 400 million whereof approximately SEK 125 million is attributable to non-controlling interests. The divestiture will also have an effect on net debt / equity ratio which will decrease from 0.62 to approximately 0.52.
Accounting principles
The interim report for the Group is prepared in accordance with IAS 34 Interim Financial Reporting and the Swedish Annual Accounts Act. The accounting principles applied in this interim report are the same as those used in the most recent annual report for 2014, see pages 28-35 and page 70 for definitions of key indicators. The interim report for the parent company is prepared in accordance with the Swedish Annual Accounts Act. Key figure definitions are provided on page 21 of this report.

14
INTERIM REPORT BILLERUDKORSNÄS AKTIEBOLAG (PUBL) JANUARY–JUNE 2015
FINANCIAL CALENDAR
Q3 – 21 October 2015
Capital Markets Day – 12 November 2015
Year-end report 2015 – 10 February 2016
Q1 – 21 April 2016
Q2 – 20 July 2016
Q3 – 21 October 2016
2016 Annual General Meeting –10 May 2016

INTERIM REPORT BILLERUDKORSNÄS AKTIEBOLAG (PUBL) JANUARY–JUNE 2015 15
The undersigned hereby confirm that this mid-year report provides a true and fair view of the parent company’s and Group’s operations, position and performance, and describes material risks and uncertainties faced by the parent company and Group companies.
Solna, 20 July 2015
BillerudKorsnäs AB (publ)
Lennart Holm, Michael M.F. Kaufmann, Chairman Member
Andrea Gisle Joosen, Bengt Hammar, Member Member
Mikael Hellberg, Jan Homan, Member Member
Gunilla Jönson, Kristina Schauman, Member Member
Helén Gustafsson Kjell Olsson, Member Member
Per Lindberg, President and CEO
The information in this interim report is such that BillerudKorsnäs AB (publ) is obliged to disclose under the Swedish Securities Market Act. This report has been prepared in both a Swedish and an English version. The report has not been reviewed by the company’s auditors.

16
INTERIM REPORT BILLERUDKORSNÄS AKTIEBOLAG (PUBL) JANUARY–JUNE 2015

INTERIM REPORT BILLERUDKORSNÄS AKTIEBOLAG (PUBL) JANUARY–JUNE 2015 17
BillerudKorsnäs Group Income statement
Statement of comprehensive income
Full year
SEKm Q2 -15 Q1 -15 Q2 -14 2015 2014 2014
Net sales 5 489 5 634 5 128 11 123 10 538 20 853Other income 38 48 27 86 47 118Operating income 5 527 5 682 5 155 11 209 10 585 20 971
Change in inventories -5 -41 79 -46 -27 63Raw materials and consumables -2 756 -2 804 -2 629 -5 560 -5 313 -10 490Other external costs -1 033 -1 023 -1 027 -2 056 -2 043 -4 245Employee benefits expense -836 -763 -786 -1 599 -1 525 -3 020Depreciation and impairment of non-current assets -355 -353 -343 -708 -687 -1 378Profit/Loss from participations in associated companies - - 1 - 1 -Operating expenses -4 985 -4 984 -4 705 -9 969 -9 594 -19 070
Operating profit/loss 542 698 450 1 240 991 1 901
Financial income and expenses -26 -53 -70 -79 -142 -248Profit/Loss before tax 516 645 380 1 161 849 1 653Taxes -113 -141 -88 -254 -188 -352Net profit/loss for the period 403 504 292 907 661 1 301
Profit/Loss attributable to:Owners of the parent company 397 492 288 889 649 1 277Non-controlling interests 6 12 4 18 12 24Net profit/loss for the period 403 504 292 907 661 1 301
Earnings per share, SEK 1.92 2.38 1.39 4.30 3.14 6.18Diluted earnings per share, SEK 1.92 2.37 1.38 4.29 3.13 6.16
Quarter Jan-Jun
Full year
SEKm Q2 -15 Q1 -15 Q2 -14 2015 2014 2014
Net profit/loss for the period 403 504 292 907 661 1 301
Other comprehensive income
Items that will not be reclassified to profit or loss Actuarial gains or losses on defined benefit pension plans -63 - - -63 - -67Tax attributable to items not to be reclassified to profit or loss 14 - - 14 - 15Total items never reclassified to profit or loss -49 - - -49 - -52
Items that have been or may be reclassified subsequently to Differences arising from the translation of foreign operations' accounts -12 -39 55 -51 57 136Change in fair value of shareholding in Bergvik Skog -5 2 6 -3 10 22Change in fair value of cash flow hedges 97 53 -106 150 -115 -204Tax attributable to items that have been or may be reclassified subsequently to profit or loss -22 -11 23 -33 25 45Total items that have been or may be reclassified subsequently to profit or loss
58 5 -22 63 -23 -1
Total comprehensive income for the period 412 509 270 921 638 1 248
Attributable to: Owners of the parent company 406 499 264 905 624 1 220Non-controlling interests 6 10 6 16 14 28Total comprehensive income for the period 412 509 270 921 638 1 248
Quarter Jan-Jun
18
INTERIM REPORT BILLERUDKORSNÄS AKTIEBOLAG (PUBL) JANUARY–JUNE 2015
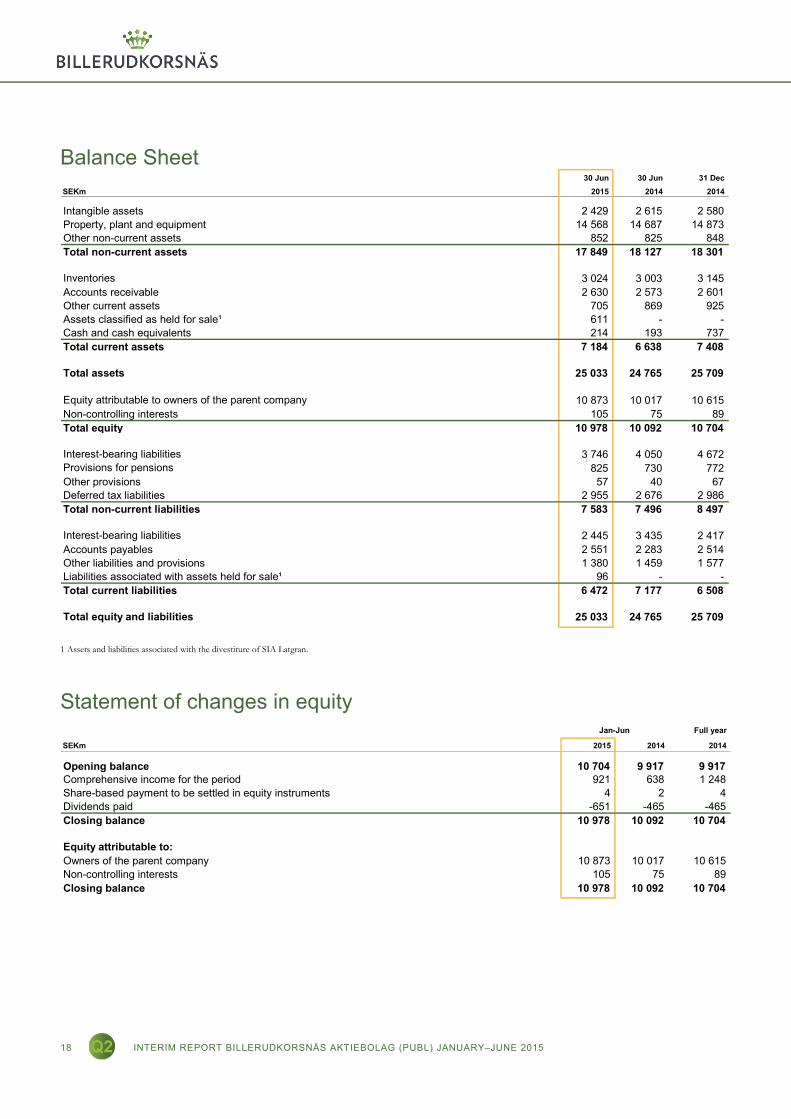
Balance Sheet
1 Assets and liabilities associated with the divestiture of SIA Latgran.
Statement of changes in equity
30 Jun 30 Jun 31 Dec
SEKm 2015 2014 2014
Intangible assets 2 429 2 615 2 580Property, plant and equipment 14 568 14 687 14 873Other non-current assets 852 825 848Total non-current assets 17 849 18 127 18 301
Inventories 3 024 3 003 3 145Accounts receivable 2 630 2 573 2 601Other current assets 705 869 925Assets classified as held for sale¹ 611 - -Cash and cash equivalents 214 193 737Total current assets 7 184 6 638 7 408
Total assets 25 033 24 765 25 709
Equity attributable to owners of the parent company 10 873 10 017 10 615Non-controlling interests 105 75 89Total equity 10 978 10 092 10 704
Interest-bearing liabilities 3 746 4 050 4 672Provisions for pensions 825 730 772Other provisions 57 40 67Deferred tax liabilities 2 955 2 676 2 986Total non-current liabilities 7 583 7 496 8 497
Interest-bearing liabilities 2 445 3 435 2 417Accounts payables 2 551 2 283 2 514Other liabilities and provisions 1 380 1 459 1 577Liabilities associated with assets held for sale¹ 96 - -Total current liabilities 6 472 7 177 6 508
Total equity and liabilities 25 033 24 765 25 709
Full year
SEKm 2015 2014 2014
Opening balance 10 704 9 917 9 917Comprehensive income for the period 921 638 1 248Share-based payment to be settled in equity instruments 4 2 4Dividends paid -651 -465 -465Closing balance 10 978 10 092 10 704
Equity attributable to: Owners of the parent company 10 873 10 017 10 615Non-controlling interests 105 75 89Closing balance 10 978 10 092 10 704
Jan-Jun

INTERIM REPORT BILLERUDKORSNÄS AKTIEBOLAG (PUBL) JANUARY–JUNE 2015 19
Statement of cash flow
*The amount for the period January-June 2015 takes into account operating profit of SEK 1 240 million, reversed depreciation SEK 708 million, decrease in pension liabilities SEK -7 million,
other provisions SEK -11 million, net of produced and sold electricity certificates and sold emission rights SEK -16 million and incentive programmes SEK 4 million. The amount for the period
January-June 2014 takes into account operating profit of SEK 991 million, reversed depreciation SEK 687 million, decrease in pension liabilities SEK -20 million, other provisions SEK -20
million, result from associated companies SEK -1 million, net of produced and sold electricity certificates and sold emission rights SEK -25 million and incentive programme SEK 2 million.
Full year
SEKm Q2 -15 Q1 -15 Q2 -14 2015 2014 2014
Operating surplus, etc.* 897 1 021 761 1 918 1 614 3 248Change in working capital, etc. 28 -214 128 -186 102 236Net financial items, taxes, etc. -104 170 -153 66 -315 -369Cash flow from operating activities 821 977 736 1 798 1 401 3 115
Investments in property, plant and equipment -496 -246 -301 -742 -581 -1 382Acquisition of financial assets -2 - -2 -2 -2 -2Disposal of property, plant and equipment - 2 - 2 - 8Cash flow from investing activities -498 -244 -303 -742 -583 -1 376
Change in interest-bearing receivables -5 -1 - -6 - -3Change in interest-bearing liabilities 23 -917 -83 -894 -677 -1 082Dividend -651 - -465 -651 -465 -465Cash flow from financing activities -633 -918 -548 -1 551 -1 142 -1 550
Total cash flow (=change in cash and cash equivalents) -310 -185 -115 -495 -324 189
Cash and cash equivalents at start of period 545 737 288 737 497 497Translation differences in cash and cash equivalents -21 -7 20 -28 20 51Cash and cash equivalents at the end of the period 214 545 193 214 193 737
Quarter Jan-Jun

20
INTERIM REPORT BILLERUDKORSNÄS AKTIEBOLAG (PUBL) JANUARY–JUNE 2015
Note financial assets and liabilities
1 Short-term investments are classified as “Cash and cash equivalents” when they mature less than three months after the acquisition date and are exposed to only a minor risk of fluctuation in value.
Group 30 June 2015
Derivatives in hedge
accounting Accounts and
loan receivables Available for-sale
financial assets Financial liabilities measured at
amortised costs Total carrying
amount Fair value
Other shares and participations - - 803 - 803 803Long-term receivables - 9 - - 9 9Accounts receivable - 2 630 - - 2 630 2 630Other receivables 89 388 - - 477 477Cash and cash equivalents¹ - 214 - - 214 214Total 89 3 241 803 - 4 133 4 133
Non-current interest-bearing liabilities - - - 3 746 3 746 3 796Current interest-bearing liabilities - - - 2 445 2 445 2 445Accounts payables - - - 2 551 2 551 2 551Other liabilities 158 - - 175 333 333Total 158 - - 8 917 9 075 9 125
Group 31 December 2014
Derivatives in hedge
accounting Accounts and
loan receivables Available for-sale
financial assets Financial liabilities measured at
amortised costs Total carrying
amount Fair value
Other shares and participations - - 806 - 806 806
Long-term receivables - 9 - - 9 9Accounts receivable - 2 601 - - 2 601 2 601Other receivables - 407 - - 407 407Cash and cash equivalents¹ - 737 - - 737 737Total - 3 754 806 - 4 560 4 560
Non-current interest-bearing liabilities - - - 4 672 4 672 4 735Current interest-bearing liabilities - - - 2 417 2 417 2 417Accounts payables - - - 2 514 2 514 2 514Other liabilities 218 - - 242 460 460Total 218 - - 9 845 10 063 10 126

INTERIM REPORT BILLERUDKORSNÄS AKTIEBOLAG (PUBL) JANUARY–JUNE 2015 21
Key figures
Definitions
Adjusted operating profit Operating profit adjusted for non-recurring items.
Capital employed Total assets less non-interest bearing liabilities, non-interest bearing provisions and interest-bearing assets.
Earnings per share Profit for the period, attributable to owners of the parent, divided by the average number of shares in the market.
Equity Shareholders’ equity at the end of the period.
EBITDA, % Operating profit before depreciation (EBITDA = Earnings before Interest, Taxes, Depreciation and Amortisation) as a percentage of net sales.
Interest-bearing net debt Interest-bearing provisions and liabilities less interest-bearing assets.
Interest-bearing net debt/ EBITDA Interest bearing net debt at the end of the period divided by operating profit before depreciation for the last twelve months.
MF kraft paper Machine Finished kraft paper
MG kraft paper Machine Glazed kraft paper
NBSK Northern Bleached Softwood Kraft
Net debt/equity ratio Interest-bearing net debt divided by shareholders’ equity.
NRI Non-recurring items. One-time costs not affecting the company’s run rate cost level.
Operating margin Operating profit as a percentage of net sales.
Return on capital employed Operating profit calculated over 12 months as a percentage of average capital employed.
Return on equity Profit for the period, attributable to owners of the parent, as a percentage of average shareholders’ equity, attributable to owners of the parent.
Working capital Inventories, accounts receivables and other operating receivables less accounts payables and other operating liabilities.
Working capital as percentage of net sales Average working capital for the quarter, divided by annualised net sales (net sales for the quarter multiplied by four).
Full year
2015 2014 2014
MarginsEBITDA, % 18 16 16Operating margin, % 11 9 9
Return (rolling 12 months)Return on capital employed, % 12 8 11Return on equity, % 15 10 13
Capital structure at end of periodCapital employed, SEKm 17 774 18 115 17 828Working capital, SEKm 2 636 2 589 2 286Equity, SEKm 10 978 10 092 10 704Interest-bearing net debt, SEKm 6 798 8 022 7 124Net debt/equity ratio 0.62 0.79 0.67Interest-bearing net debt / EBITDA, multiple 1.92 2.77 2.17
Key figures per shareEarnings per share, SEK 4.30 3.14 6.18Dividend per share, SEK 3.15 2.25 2.25
Other key figuresWorking capital as percentage of net sales, % 11 13 12Gross investments, SEKm 744 583 1 384Average number of employees 4 255 4 197 4 194
Jan-Jun

22
INTERIM REPORT BILLERUDKORSNÄS AKTIEBOLAG (PUBL) JANUARY–JUNE 2015
Parent Company Summarised income statement
Summarised balance sheet
Full Year
SEKm Q2 -15 Q2 -14 2015 2014 2014
Operating income -44 878 -60 1 855 3 806Operating expenses -115 -921 -203 -1 836 -5 152Operating profit/loss -159 -43 -263 19 -1 346Financial income and expenses 1 473 -37 1 421 -82 -163Profit/Loss after financial income and expenses 1 314 -80 1 158 -63 -1 509Appropriations - - - - 950Profit/loss before tax 1 314 -80 1 158 -63 -559Taxes 44 18 78 14 133Net profit/loss for the period 1 358 -62 1 236 -49 -426
Quarter Jan-Jun
30 Jun 30 Jun 31 Dec
SEKm 2015 2014 2014
Non-current assets 10 734 13 200 10 767Current assets 6 069 4 448 5 020Total assets 16 803 17 648 15 787
Shareholders' equity 6 714 6 506 6 129Untaxed reserves 355 2 135 355Provisions 336 483 338Interest-bearing liabilities 8 781 7 420 7 206Other liabilities 617 1 104 1 759Total equity and liabilities 16 803 17 648 15 787

INTERIM REPORT BILLERUDKORSNÄS AKTIEBOLAG (PUBL) JANUARY–JUNE 2015 23
Quarterly data The Group’s business is controlled and reported according to BillerudKorsnäs’ three business areas. Other units include wood supply, sales organisations, Nine AB, the Latgran Group, Bomhus Energi AB, and dormant companies. Currency hedging etc. includes results from hedging of the Group’s net currency flows, revaluation of accounts receivable and payments from customers. The part of currency exposure relating to changes in invoicing rates is included in the business area’s profit or loss. Group staff and eliminations comprise Group-wide functions and Group eliminations. Group eliminations also include shares in profits/losses from participations in associated companies.
Net Sales quarterly per business area and for the group
Operating profit quarterly per business area and for the group
Operating profit1 quarterly per business area and for the group
Operating margin1 quarterly per business area and for the group
Sales volumes quarterly per business area and for the group
1 Operating profit and margin are adjusted for the effects of periodical maintenance shutdowns and for non-recurring items.
SEKm Q2 -15 Q1 -15 Q4 -14 Q3 -14 Q2 -14 Q1 -14 Q4 -13 Q3 -13Jan-Jun
2015 Jan-Jun
2014
Packaging Paper 2 176 2 182 1 959 2 058 2 016 2 068 1 758 1 820 4 358 4 084Consumer Board 2 044 2 023 1 768 1 897 1 822 1 949 1 659 1 716 4 067 3 771Containerboard 722 801 816 773 767 792 763 755 1 523 1 559Other units 596 661 609 487 512 589 549 470 1 257 1 101Currency hedging, etc. -49 -33 -28 -24 11 12 26 -13 -82 23Group staff and eliminations - - - - - - - - - -Total Group 5 489 5 634 5 124 5 191 5 128 5 410 4 755 4 748 11 123 10 538
SEKm Q2 -15 Q1 -15 Q4 -14 Q3 -14 Q2 -14 Q1 -14 Q4 -13 Q3 -13Jan-Jun
2015 Jan-Jun
2014
Packaging Paper 245 317 183 158 169 191 91 -1 562 360Consumer Board 310 290 186 243 253 233 29 244 600 486Containerboard 51 137 120 120 59 117 98 89 188 176Other units 71 56 28 45 35 58 21 36 127 93Currency hedging, etc. -49 -33 -28 -24 11 12 26 -13 -82 23Group staff and eliminations -86 -69 -29 -92 -77 -70 -62 -46 -155 -147Total Group 542 698 460 450 450 541 203 309 1 240 991
SEKm Q2 -15 Q1 -15 Q4 -14 Q3 -14 Q2 -14 Q1 -14 Q4 -13 Q3 -13Jan-Jun
2015 Jan-Jun
2014
Packaging Paper 304 317 188 305 244 191 168 187 621 435Consumer Board 324 290 303 354 265 233 148 244 614 498Containerboard 148 137 133 140 115 117 151 110 285 232Other units 71 56 28 45 35 58 21 36 127 93Currency hedging, etc. -49 -33 -28 -24 11 12 26 -13 -82 23Group staff and eliminations -86 -69 -29 -75 -60 -56 -33 -18 -155 -116Total Group 712 698 595 745 610 555 481 546 1 410 1 165Costs for maintenance shutdowns -170 - -135 -227 -143 - -249 -209 -170 -143Non-recurring items - - - -68 -17 -14 -29 -28 - -31Operating profit 542 698 460 450 450 541 203 309 1 240 991
% Q2 -15 Q1 -15 Q4 -14 Q3 -14 Q2 -14 Q1 -14 Q4 -13 Q3 -13Jan-Jun
2015 Jan-Jun
2014
Packaging Paper 14 15 10 15 12 9 10 10 14 11Consumer Board 16 14 17 19 15 12 9 14 15 13Containerboard 20 17 16 18 15 15 20 15 19 15Group 13 12 12 14 12 10 10 11 13 11
ktonne Q2 -15 Q1 -15 Q4 -14 Q3 -14 Q2 -14 Q1 -14 Q4 -13 Q3 -13Jan-Jun
2015 Jan-Jun
2014
Packaging Paper 288 300 275 288 294 310 263 269 588 604Consumer Board 274 272 235 252 249 268 231 236 546 517Containerboard 106 129 134 127 128 139 126 134 235 267Total 668 701 644 667 671 717 620 639 1 369 1 388

We challenge conventional
packaging for a sustainable future
This is BillerudKorsnäs
BillerudKorsnäs is one of the world’s leading suppliers of high-quality, packaging materials based on renewable raw material. Our wood raw material comes from sustainable managed forests and manufacturing takes place at resource-efficient, integrated production units.
Our customers are packaging manufacturers, brand owners and large retail and supermarket chains. Through close collaboration with customers and partners all over the world, we are able to offer a customised and broad product portfolio that features a high degree of innovation. Demand is driven by global megatrends, particularly rising urbanisation, a greater focus on sustainability and changing consumption patterns. Consumer segments, primarily food and beverages, account for 75% of sales. While Europe is the core market. BillerudKorsnäs is gradually strengthening its presence in the leading growth markets of Asia. Smart packaging solutions using paper or board from BillerudKorsnäs reduce the impact on the climate, cut the use of resources along the whole value chain and contribute to a sustainable future. BUSINESS MODEL Our business model is based on high-performance materials from forests in the north, advice, service and the collective knowledge held by a global network of machine suppliers, packaging manufacturers, researchers and design agencies. Innovative packaging solutions are developed in close collaboration with customers all over the world that demand the highest standards of quality, performance and sustainability.
STRATEGIC FOCUS BillerudKorsnäs’ overall objective is sustainable and profitable growth. The target is to grow organically by 15–20% up until 2018, which equates to a figure of around SEK 24 billion in sales. Our strategy is based on five areas that all interact: Position, Innovation, Sustainability, Efficiency and Employees. Read more at billerudkorsnas.com
VALUE DRIVERS High-performance material based on renewable raw material from responsibly managed forests. Smarter solutions that optimise our customers’ business. Leading positions in the growing global packaging market. A holistic approach to the entire packaging value chain from raw material all the way to the end-customer and recycling.
BillerudKorsnäs Aktiebolag (publ) • Postal address: Box 703, SE-169 27 Solna, Sweden • Visitors’ address: Frösundaleden 2b Reg. no. 556025-5001 • Tel +46 8 553 335 00 • [email protected]
www.billerudkorsnas.com