interim report january–september 2007 - … 2,444 1,177 1,112 96 ... per cent and 4.5 per cent...
TRANSCRIPT

INTERIM REPORT JANUARY–SEPTEMBER 2007
• IncometotalledSEK902million(589)
• NetprofitfortheperiodincreasedtoSEK934million(427)
• EarningspershareincreasedtoSEK5.61(3.55)
• Netprofitfortheperiodincludesrealisedchangesinvalue
regardingpropertiesatSEK126million(24)andunrealised
changesinvalueregardingpropertiesatSEK735million(179).

2
Strongdevelopmentofprofit“We can present a strong result for the first nine months of the year, not least for the third quarter.
The occupancy ratio has increased by one percentage point for the fourth consecutive quarter to
87 per cent. This reflects the good performance of our organisation and shows that it is going well
for our customers”, says Klövern’s CEO Gustaf Hermelin.
The increase in value of the property portfolio results from new letting and rising property prices.
Property values are increasing, particularly in Kista, due to the improvement in the state of the
market and decreasing vacancies.
The acquisition of 43 properties in Karlstad and Västerås strengthens the organisation and the market
position at these places and, after sale of nine properties, with transfer of possession in the fourth quarter,
99 per cent of the property portfolio will be concentrated to Klövern’s ten priority markets.
”We have now even greater ability to meet customers need for premises and services at these
locations, close to the customer and with commitment”, says Klövern’s CEO Gustaf Hermelin.
StatementbytheCEO
Cover page photos:Kardborren13,Täby, CarolineandPontusatKlövern’sheadofficeinNyköping.
Helgafjäll5,Kista
3
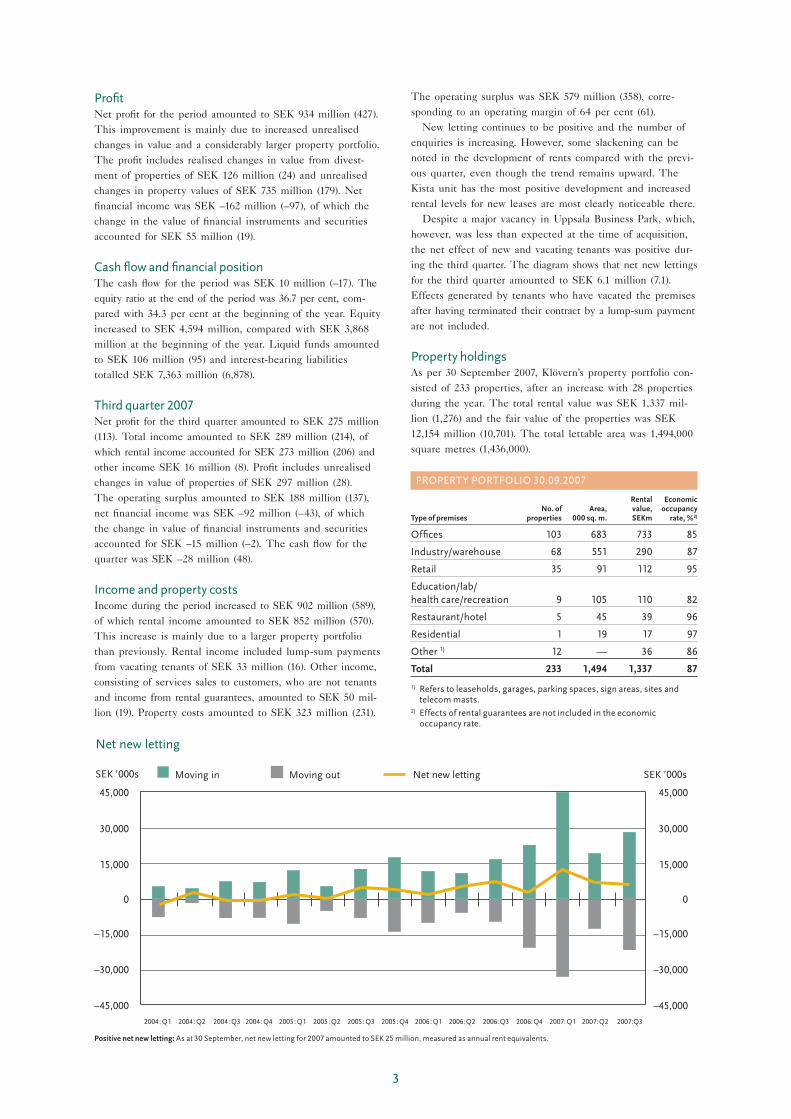
Positive net new letting:Asat30September,netnewlettingfor2007amountedtoSEK25million,measuredasannualrentequivalents.
ProfitNet profit for the period amounted to SEK 934 million (427). This improvement is mainly due to increased unrealised changes in value and a considerably larger property portfolio. The profit includes realised changes in value from divest-ment of properties of SEK 126 million (24) and unrealised changes in property values of SEK 735 million (179). Net financial income was SEK –162 million (–97), of which the change in the value of financial instruments and securities accounted for SEK 55 million (19).
CashflowandfinancialpositionThe cash flow for the period was SEK 10 million (–17). The equity ratio at the end of the period was 36.7 per cent, com-pared with 34.3 per cent at the beginning of the year. Equity increased to SEK 4,594 million, compared with SEK 3,868 million at the beginning of the year. Liquid funds amounted to SEK 106 million (95) and interest-bearing liabilities totalled SEK 7,363 million (6,878).
Thirdquarter2007Net profit for the third quarter amounted to SEK 275 million (113). Total income amounted to SEK 289 million (214), of which rental income accounted for SEK 273 million (206) and other income SEK 16 million (8). Profit includes unrealised changes in value of properties of SEK 297 million (28). The operating surplus amounted to SEK 188 million (137), net financial income was SEK –92 million (–43), of which the change in value of financial instruments and securities accounted for SEK –15 million (–2). The cash flow for the quarter was SEK –28 million (48).
IncomeandpropertycostsIncome during the period increased to SEK 902 million (589), of which rental income amounted to SEK 852 million (570). This increase is mainly due to a larger property portfolio than previously. Rental income included lump-sum payments from vacating tenants of SEK 33 million (16). Other income, consisting of services sales to customers, who are not tenants and income from rental guarantees, amounted to SEK 50 mil-lion (19). Property costs amounted to SEK 323 million (231).
The operating surplus was SEK 579 million (358), corre-sponding to an operating margin of 64 per cent (61). New letting continues to be positive and the number of enquiries is increasing. However, some slackening can be noted in the development of rents compared with the previ-ous quarter, even though the trend remains upward. The Kista unit has the most positive development and increased rental levels for new leases are most clearly noticeable there. Despite a major vacancy in Uppsala Business Park, which, however, was less than expected at the time of acquisition, the net effect of new and vacating tenants was positive dur-ing the third quarter. The diagram shows that net new lettings for the third quarter amounted to SEK 6.1 million (7.1). Effects generated by tenants who have vacated the premises after having terminated their contract by a lump-sum payment are not included.
PropertyholdingsAs per 30 September 2007, Klövern’s property portfolio con-sisted of 233 properties, after an increase with 28 properties during the year. The total rental value was SEK 1,337 mil-lion (1,276) and the fair value of the properties was SEK 12,154 million (10,701). The total lettable area was 1,494,000 square metres (1,436,000).
PROPERTYPORTFOLIO30.09.2007
Rental Economic No. of Area, value, occupancyType of premises properties 000 sq. m. SEKm rate, %2)
Offices 103 683 733 85
Industry/warehouse 68 551 290 87
Retail 35 91 112 95
Education/lab/ healthcare/recreation 9 105 110 82
Restaurant/hotel 5 45 39 96
Residential 1 19 17 97
Other1) 12 — 36 86
Total 233 1,494 1,337 87
1)Referstoleaseholds,garages,parkingspaces,signareas,sitesandtelecommasts.
2)Effectsofrentalguaranteesarenotincludedintheeconomicoccupancyrate.
2004:Q1 2004:Q2 2004:Q3 2004:Q4 2005:Q1 2005:Q2 2005:Q3 2005:Q4 2006:Q1 2006:Q2 2006:Q3 2006:Q4 2007:Q1 2007:Q2 2007:Q3
45,000
30,000
15,000
0
–15,000
–30,000
–45,000
Net new letting
Moving in Moving out Net new letting
45,000
30,000
15,000
0
–15,000
–30,000
–45,000
SEK ’000s SEK ’000s
-20000
-10000
0
10000
20000

4
INTERESTRATEANDLOANMATURITYSTRUCTURE30.09.2007
Interest rate maturity structure Loan maturity structure Interest Average Credit maturity, interest agreements, Utilised,Year SEKm rate, % SEKm SEKm
Variable1) 5,388 4.4 — —
2007 48 3.0 240 90
2008 533 5.1 183 183
2009 54 5.2 132 132
2010 32 3.8 2,627 2,420
2011 308 6.5 2,129 1,829
2012– 1,000 4.5 3,077 2,709
Total 7,363 4.6 8,388 7,363
1)Variableloansareloanswithafixedinteresttermof90daysorless.Oftheseloanamounts,interestcapshavebeenprovidedforSEK3,329million.
CONTRACTSTRUCTURE30.09.2007
Contract Share of No. of Area, value, contractMaturity year 1) contracts 000 sq. m. SEKm value, %
Commercial premises
2007 327 93 83 7
2008 908 276 256 22
2009 648 283 269 23
2010 335 228 197 17
2011 110 97 86 8
2012– 116 200 221 19
Total 2,444 1,177 1,112 96
Residential 240 18 16 1
Total 2,684 1,195 1,128 97
Garages/parkingspaces 1,593 — 29 3
Total 4,277 1,195 1,157 100
1)Theaveragecontracttimeasper30September2007was2.8years.
AcquisitionsandinvestmentsDuring the period, Klövern acquired 43 properties (15), 38 of which were in Karlstad, three in Västerås and one each in Köping and Kumla. The properties consisted of around 150,000 sq.m. (101,000) and the total acquisition price, including transaction costs, amounted to SEK 908 million (574). Investment in refurbishment in the period totalled SEK 402 million (106) for properties mainly in Kista, Linköping, Nyköping and Örebro.
PropertysalesDuring the period, 16 properties (11) have been sold at a total sales price of SEK 732 million (256), leading to a realised change in value of SEK 126 million (24). Of the properties sold, totalling approximately 92,000 sq.m. (39,000), eleven are situated in Kalmar, four in Eskilstuna and one in Norrköping.
ValuationofpropertiesEvery quarter Klövern values 100 per cent of the property portfolio. 25 per cent of the valuations are carried out by an external valuation company and the remaining valuations are made internally. Accordingly, every property in the portfolio is valued externally during a rolling 12-month period. The external valuations have been carried out by DTZ Sweden. See Klövern’s annual report for 2006 for a detailed descrip-tion of valuation principles.
UnrealisedchangesinvalueofpropertiesAs per 30 September 2007, the fair value of Klövern’s proper-ties was SEK 12,154 million. The unrealised change in value during the period was SEK 735 million (179).
FinancingAt the end of the period, interest-bearing liabilities amounted to SEK 7,363 million, compared with SEK 6,878 million at the beginning of the year. The average interest
rate was 4.6 per cent (4.1) and the average fixed interest term was 1.5 years (1.8). The loans, including variable loans, that mature during 2007, had at the end of the period an average fixed interest term of 4 days (10). The average period of tied-up capital was 3.8 years (4.3). A total of SEK 3,329 million of the variable loans has been interest capped at 4.0 per cent and 4.5 per cent related to Stibor 30 and 90 days. Of the interest caps, SEK 730 million mature in 2009, SEK 1,099 million in 2010, SEK 1,000 million in 2011 and SEK 500 million in 2012. During the period, changes in value of Klövern’s financial instruments and securities, which are reported under net financial income, amounted to SEK 55 million (19). Klövern’s interest cap limits significantly the effect of a potential rise in interest rates on Klövern’s average borrowing rate. If interest rates had been increased by 0.25 percentage points as per 30 September 2007, Klövern’s average interest rate would have risen by 0.14 percentage points to 4.72 per cent. An increase of 1 percentage point would have limited the increase to only 0.35 percentage points and Klövern’s average borrowing rate would have been 4.93 per cent.
0 0.25 0.5 0.75 1
0.40
0.35
0.30
0.25
0.20
0.15
0.10
0.05
0.00
Effect of an interest rate rise on Klövern’s borrowing costsIncrease in borrowingcosts, %-points
0.00
0.14
0.21
0.28
0.35
Increase in short-term interest rates, % points

5
in the parent company amounted to SEK –8 million (–17). As per 30 September, liquid funds in the parent company amounted to SEK 9 million compared with SEK 13 million, including amounts in blocked accounts, at the beginning of the year. Net investments in shares, participation rights and equipment amounted to SEK 1 million (1).
TaxsituationAt the end of the 2006 financial year, the scope, which serves as booking for deferred tax asset, had been entirely used up. The scope consisted of Klövern’s established tax loss carry forwards and additional depre ciation basis for tax purposes in addition to book basis, on equipment and good-will. The scope for tax depreciation on properties and for utilising existing tax loss carry forwards means that current tax is expected to be low. During the period, the deferred tax payment amounted to SEK 297 million. The reported tax payment deviates from the nominal 28 per cent as divestments of properties have taken place free of tax in company form and profits of approximately SEK 126 million will not attract tax. In con-nection with the divestments, previously deferred tax has been recovered. This amounted to SEK 12 million.
SubstantialrisksanduncertainyfactorsKlövern’s substantial risks and uncertainty factors were described on pages 42–45 of the annual report for 2006. No substantial changes have taken place since then.
TransactionwithrelatedpartiesDuring the period, Klövern has sold properties for SEK 707 million to Dagon. One of the members of Klövern’s board, Lars Rosvall, is also a member of the board of Dagon AB. Lars Rosvall did not participate in Klövern’s decision to sell properties to Dagon. In the acquisition of properties in Västerås during 2004 from Arvid Svensson AB, rental agreements were included where Arvid Svensson AB was the tenant. The CEO of Arvid Svensson AB is Fredrik Svensson who is also a member of the
TheshareandshareholdersThe Klövern share is listed on OMX Nordic Exchange in Stockholm, medium-sized companies. The closing price as at 28 September 2007 – the last trading day of the quarter – was SEK 25.30 kronor per share, which corresponds to a market capitalisation of SEK 4.2 billion. As per 28 September 2007, the total number of shares in Klövern was 166,544,326 distributed among approximately 31,700 shareholders.
MAJORSHAREHOLDERS28.09.2007
No. of shares, Holding and, million voting rights, %
ABSkakel 17.5 10.5
ArvidSvenssonInvest 17.0 10.2
LantbrukarnasRiksförbund 16.7 10.0
InvestmentABÖresund 11.3 6.8
LänsförsäkringarFonder 9.2 5.5
SkandiaLiv 7.2 4.3
BrinovaInterAB 6.2 3.7
HQFonder 5.7 3.4
FortisBanqueLuxembourgSA 5.0 3.0
LänsförsäkringarSödermanland 3.7 2.2
Total major shareholders 99.5 59.6
Othershareholders 67.0 40.4
Total all shareholders 166.5 100.0
CentraladministrationThe costs of central administration during the period amounted to SEK 45 million (35). Of this amount, SEK 9 million con-sisted of an arbitration settlement to Kommanditaktieselskapet Pakhus D+E resulting from a dispute about a guarantee for a subsidiary in former Adcore undertaking in 2000.
ParentcompanyThe operation of the parent company involves functions for the group as a whole as well as ownership issues, operation and management of the group’s subsidiaries. The net profit
The Klövern share
KlövernOMX Stockholm_PI Carnegie Real Estate Index
Share turnover ’000s(incl. subsequent notification)
(c) OMX AB
2003 2004 2005 2006 2007
20,000
16,000
12,000
8,000
4,000
40
35
30
25
20
15
10
3000
6000
9000
12000
15000
18000
10
15
20
25
30
35
40
03 04 05 06 07
Klövern
Aktien
OMX Stockholm_PI
Carnegie Real Estate Index Omsatt antal aktier1000-tal(inkl.efteranm.)
(c) FINDATA

6
Outlookfor2007The full-year forecast that Klövern’s profit for 2007, excluding tax and changes in value, will exceed SEK 375 million is maintained.
Calendar2007–2008Year-end Report 2007 Tuesday 5 February 2008Annual Report 2007 March 2008Annual General Meeting 2008 Thursday 3 April 2008
Reports are available on Klövern’s website www.klovern.se, where it is also possible to subscribe to annual reports, interim reports and press releases.
Nyköping, 23 October 2007Klövern AB
Board of Directors
ReviewreportWe have reviewed the financial interim report information in summary (interim report) for Klövern AB for the period 1 January to 30 September 2007. The Board of Directors and the CEO are responsible for preparing and presenting this interim report in accordance with IAS 34 and the Annual Accounts Act. Our responsibility is to express an opinion on this interim report based on our review. We have performed this review in accordance with the standard for review SÖG 2410 Review of financial interim report information performed by the auditor appointed by the company published by FAR. A review consists of making enquiries, in the first place to persons who are responsible for financial issues and accounting matters, performing an analytical review and undertaking other general review measures. A review has a different focus and a considerably reduced scope compared with the focus and scope of an audit in accordance with Auditing Standards in Sweden RS [in Swedish] and generally accepted accounting standards otherwise. The review measures undertaken in general review have not made it possible for us to acquire such certainty as to be aware of all important circumstances that could have been identified in the performance of an audit. The conclu-sion stated is based on a general review and does not there-fore have the same degree of certainty as a statement based on an audit. On the basis of our general review, no circumstances have emerged which would lead us to consider that the interim report is not, in all substantials, prepared in accordance with IAS 34 and the Annual Accounts Act and, in the case of the parent company, with the Annual Accounting Act.
Stockholm, 23 October 2007
Mikael IkonenAuthorized public accountant
Ernst & Young
board of Klövern. During the period, Arvid Svensson AB has made lump-sum payments to Klövern totalling SEK 19 million in the course of redemption of a rental agreement. The board is of the opinion that the transaction took place on prevailing market terms.
AccountingprinciplesThis interim report has been prepared for the Group in accordance with the Annual Accounts Act and IAS 34 Interim Financial Reporting and, for the parent company, in accordance with the Annual Accounts Act. The accounting principles applied in the Group and the parent company are the same as those applied in the most recent annual report.
NominationsCommitteeIn accordance with the decision at Klövern’s annual general meeting of shareholders on 28 March 2007, a nominations committee is to be appointed each year, consisting of the chairman of the board, one representative of each owner with a shareholding in the company of more than five per cent of the shares and votes as per 31 August and a repre-sentative of the other shareholders. The nominations com-mittee consists of the following representatives: Peter Lindh – AB Skakel, Rickard Svensson – Arvid Svensson Invest, Göran Almberg – the Swedish Federation of Farmers (LRF), Eva Gottfridsdottir-Nilsson – Länsförsäkringar Fonder, Erik Törnberg – Investment AB Öresund, Klas Andersson, repre-senting other shareholders and Stefan Dahlbo, chairman of the board of Klövern. The representatives can be contacted by e-mail at [email protected] or by telephone via Klövern +46 155-44 33 02.
EventsaftertheendofthereportingperiodProperty acquisitions and property salesKlövern has sold nine properties for SEK 490 million. This sale consisted mainly of industrial properties, with a total area of approximately 110,000 sq.m. located in Fagersta, Katrineholm, Kumla (2), Norberg, Norrköping (2), Sigtuna and Trosa. The sale entails a realised change in value of around SEK 100 million, which will be reported during the fourth quarter of 2007. The proper-ties will be vacated as per 1 November 2007. Klövern has acquired an office property in Nyköping, consisting of around 3,600 sq.m. for a purchase price of SEK 36 million. The property has been taken possession of as per 1 October 2007.
Changes in Klövern’s executive managementAs of this date, Caesar Åfors is taking up an appointment as chief financial officer and vice-CEO, and property manager Thomas Nilsson is also being appointed as vice-CEO. Besides these two and the CEO, Gustaf Hermelin, Klövern’s execu-tive management group consists of finance and information manager Britt-Marie Einar, transaction and analysis manager Mattias Rickardsson and unit manager in Kista Per-Gunnar Sabel.

7
ConsolidatedIncomeStatements 2007 2006 2007 2006 2006 Rolling 3 months 3 months 9 months 9 months 12 months 12 monthsSEK m July–Sept July–Sept Jan–Sept Jan–Sept Jan–Dec Oct–Sept
Rentalincome 272.8 205.9 852.3 569.6 807.6 1,090.3
Otherincome1) 15.9 8.4 50.2 19.5 35.4 66.1
Total income 288.7 214.3 902.5 589.1 843.0 1,156.4
Propertycosts –100.5 –76.9 –323.4 –231.2 –338.8 –431.0
Operating surplus 188.2 137.4 579.1 357.9 504.2 725.4
Changesinvalueproperties,realised2) 0.0 1.3 126.1 24.4 45.0 146.7
Changesinvalueproperties,unrealised 296.8 27.5 735.0 179.3 217.0 772.7
Depreciationequipments –0.8 –0.7 –2.3 –2.0 –2.7 –3.0
Centraladministration –10.7 –10.0 –44.7 –34.9 –49.3 –59.1
Operating profit 473.5 155.5 1,393.2 524.7 714.2 1,582.7
Financialincome 0.8 0.4 2.4 1.2 2.3 3.5
Financialcosts –77.7 –40.9 –219.9 –117.1 –173.2 –276.0
Changesinvalueoffinancialitems,unrealised –15.0 –8.8 55.1 2.2 27.6 80.5
Changesinvalueofsecurities,realised 0.0 0.0 0.0 0.0 5.2 5.2
Changesinvaluesecurities,unrealised 0.0 6.4 0.0 16.4 16.4 0.0
Profit after financial items 381.6 112.6 1,230.8 427.4 592.5 1,395.9
Profit before tax 381.6 112.6 1,230.8 427.4 592.5 1,395.9
Currenttax3) 0.0 0.0 0.0 0.0 –15.8 –15.8
Deferredtax –106.8 0.0 –296.9 0.0 54.0 –242.9
Net profit for the period 274.8 112.6 933.9 427.4 630.7 1,137.2
Earningspershare,SEK 1.65 0.94 5.61 3.55 5.04 7.11
No.ofsharesattheendoftheperiod,million 166.5 120.4 166.5 120.4 166.5 166.5
Averagenumberofshares,million 166.5 120.4 166.5 120.4 125.2 159.9
Therearenooutstandingwarrantsorconvertibles.
1)Otherincomeconsistsofincomefromcustomerswhoarenottenantsandincomefromrentalguarantees.2)Theamountfor,Jan–Sep2007,isaftercommitmentsofSEK15millioninconnectionwithdivestmentofproperties.3)CurrenttaxofSEK–15.8millionreferstotaxinsubsidiaries,whichwasprohibitedtoequalisebygroupcontributionsduring2006.

8
ConsolidatedStatementofchangesinEquitySEK m Total equity
Shareholder’s equity 01.01.2006 2,264.4
Dividend –120.4
Newissue 1,093.5
Netprofitfortheyear 630.7
Shareholder’s equity 31.12.2006 3,868.2
Dividend –208.2
Netprofitfortheperiod 933.9
Shareholder’s equity 30.09.2007 4,593.9
ConsolidatedBalanceSheetsSEK m 30.09.2007 30.09. 2006 31.12.2006
Assets
Investmentproperties 12,154.2 6,595.9 10,700.9
Othertangiblefixedassets 13.0 13.6 14.0
Deferredtaxclaim 36.1 279.0 333.0
Short-termreceivablesetc 190.1 156.1 140.7
Blockedaccounts1) 4.0 3.8 3.9
Liquidfunds 105.9 124.6 95.4
Total assets 12,503.3 7,173.0 11,287.9
Equity and liabilities
Shareholder’sequity 4,593.9 2,571.4 3,868.2
Provisions 4.3 7.0 6.8
Interest-bearingliabilities 7,363.2 4,338.8 6,877.8
Accountspayable 77.8 50.7 113.1
Otherliabilities 185.3 7.5 186.9
Accruedexpensesandprepaidincome 278.8 197.6 235.1
Total equity and liabilities 12,503.3 7,173.0 11,287.9
1)Consistsofamountsinblockedaccountsascollateralforrepaymentofloansortobeusedforfinancingofinvestmentsinproperties.

9
ConsolidatedStatementsofCashFlow 2007 2006 2007 2006 2006 Rolling 3 months 3 months 9 months 9 months 12 months 12 monthsSEK m July–Sept July–Sept Jan–Sept Jan–Sept Jan–Dec Oct–Sept
Current operations
Profitafterfinancialitemsexcluding depreciationandchangesinvalue 100.6 86.9 316.9 207.1 284.0 393.8
Realisedchangesinvalue,properties 0.0 1.3 126.1 24.4 45.0 146.7
Incometaxpaid 0.0 0.0 –0.2 0.0 –0.3 –0.5
Cash flow from current operations before change in working capital 100.6 88.2 442.8 231.5 328.7 540.0
Change in working capital
Changeinoperatingreceeivables 18.5 –6.4 5.7 –40.3 0.6 46.6
Changeinoperatingliabilities –64.5 –8.3 7.1 7.2 111.8 111.7
Total change in working capital –46.0 –14.7 12.8 –33.1 112.4 158.3
Cash flow from current operations 54.6 73.5 455.6 198.4 441.1 698.3
Investment operations
Saleofproperties 1.5 7.7 592.0 231.5 302.6 663.1
Acquisitionofandinvestmentsinproperties1) –1,017.5 –24.1 –1,310.3 –680.2 –3,725.2 –4,355.3
Acquisitionoftangiblefixedassets –0.2 –1.6 –1.3 –10.7 –11.8 –2.4
Changeinamountsinblockedaccounts –0.1 0.1 –0.2 12.6 12.5 –0.3
Cash flow from investment operations –1,016.3 –17.9 –719.8 –446.8 –3,421.9 –3,694.9
Financing operations
Changeinlong-termliabilities 934.0 –7.6 482.9 352.1 3,050.1 3,180.9
Realisedchangesinvalueofsecurities 0.0 0.0 0.0 0.0 5.2 5.2
Dividend 0.0 0.0 –208.2 –120.4 –120.4 –208.2
Cash flow from financing operations 934.0 –7.6 274.7 231.7 2,934.9 2,977.9
Cashflowfortheperiod –27.7 48.0 10.5 –16.7 –45.9 –18.7
Liquidfundsatthebeginningoftheperiod 133.6 76.6 95.4 141.3 141.3 124.6
Liquid funds at the end of the period 105.9 124.6 105.9 124.6 95.4 105.9
1)Thepropertyacquisitionsduringthefourthquarterof2006werepartlyfinancedbynon-cashissuesonSEK1,094million.Theamountisnotincludedinthecash-flow.
Keyfinancialindicators 2007 2006 2007 2006 2006 Rolling 3 months 3 months 9 months 9 months 12 months 12 months July–Sept July–Sept Jan–Sept Jan–Sept Jan–Dec Oct–Sept
Returnonequity,% 6.2 4.5 22.1 17.7 20.6 31.7
Returnontotalcapital,% 4.0 2.2 11.7 7.7 8.0 16.1
Equityratio,% 36.7 35.8 36.7 35.8 34.3 36.7
Interestcoverageratio,times 5.9 3.8 6.6 4.6 4.4 6.1
Equitypershare,SEK 27.6 21.4 27.6 21.4 23.2 27.6
Debt-equityratio,times 1.6 1.7 1.6 1.7 1.8 1.6
Financialoccupancyrate,% 87 83 87 83 84 87
Operatingmargin,% 65 64 64 61 60 63

10
Statementofincome,parentcompany 2007 2006 2006 9 months 9 months 12 monthsSEK m Jan–Sept Jan–Sept Jan–Dec
Netsales 81.7 52.5 79.1
Costofservicessold –52.7 –34.3 –50.0
Gross profit 29.0 18.2 29.1
Depreciation,machineryandequipment –1.0 –0.7 –0.9
Centraladministration –44.7 –34.8 –49.3
Operating profit –16.7 –17.3 –21.1
Resultfromsalesofparticipationrightsingroupcompanies 305.3 0.0 21.6
Interestincome 1.2 0.5 4.1
Interestexpense –0.6 –0.4 –0.5
Profit after financial items 289.2 –17.2 4.1
Profit before tax 289.2 –17.2 4.1
Currenttax 0.0 0.0 0.0
Deferredtax –296.9 0.0 54.0
Net profit –7.7 –17.2 58.1
Balancesheet,parentcompanySEK m 30.09.2007 30.09. 2006 31.12.2006
Assets
Equipment 3.8 2.6 3.6
Participationsingroupcompanies 319.9 183.4 212.3
Receivablesongroupcompanies 3,295.9 1,608.4 3,180.5
Deferredtaxasset 36.1 279.0 333.0
Short-termreceivablesetc. 3.4 49.1 8.9
Liquidfunds1) 8.9 12.3 12.8
Total assets 3,668.0 2,134.8 3,751.1
Equity and liabilities
Equity 2,869.4 1,744.1 3,085.3
Provisions 4.3 7.7 6.8
Liabilitiestogroupcompanies 754.6 353.3 623.1
Accountspayable 4.7 2.7 9.2
Otherliabilities 10.4 8.9 7.0
Accruedexpensesandprepaidincome 24.6 18.1 19.7
Total equity and liabilities 3,668.0 2,134.8 3,751.1
1)For2006SEK3.8millionisincludedinblockedaccounts.

KlövernAB(publ),Box1024,61129Nyköping,Sweden•Tel+46155-443300•Fax+46155-443322Companyregistrationno.556482-5833•Registeredoffice:Nyköping,Sweden•Website:www.klovern.se
Forfurtherinformation,pleasecontact:
GustafHermelin,CEO tel+46155-443310,+4670-5600000 [email protected]
CaesarÅfors, ChiefFinancialOfficerandVice-CEO, tel+46155-443302,+4670-6624848 [email protected]
Britt-MarieEinar, FinanceandInformationManager, tel+46155-443312,+4670-2242935 [email protected]
DefinitionsKeyratiosbasedontheaveragenumberofshareshavebeencalculatedonthebasisofweightedaverages.
Debt to equity ratioInterest-bearingliabilitiesinrelationtoequityattheendoftheperiod.
Earnings per shareProfitfortheperiodinrelationtotheaveragenumberofshares.
Equity per shareReportedequityinrelationtothenumberofsharesattheend oftheperiod.
Equity ratioReportedequityinrelationtoreportedtotalassetsattheend oftheperiod.
Interest coverage ratioProfitafternetfinancialitemsplusfinancialcostsinrelationtofinancialcosts.
Occupancy ratio – economicRentalincomeinrelationtorentalvalueattheendoftheperiod.
Operating marginOperatingsurplusasapercentageoftotalincome.
Operating surplusRentalincomeplusotherincomeminusrentlosses,operatingandmaintenanceexpenses,siteleaseholdchargesandpropertytax.
Realised change in value of propertiesPropertysalesduringtheperiodafterdeductionforthefairvalueoftheproperties.
Rental valueRentalincomeplusassessedmarketvalueforunletareas.
Return on equityNetprofitinrelationtoaverageequity.
Return on total capitalOperatingprofitinrelationtoaveragetotalbalancesheet.
Unrealised change in value, propertiesChangeinfairvalueforthepropertyholdingattheendofeachquarter.