interim report on operations - parmalat report on operations... · the results of the activities...
TRANSCRIPT

Interim Report on Operations
at March 31, 2015


Missione
Contents
Board of Directors and Board of Statutory Auditors ......................................................................................... 4
Financial Highlights ............................................................................................................................................ 5
Operating Performance ..................................................................................................................................... 6
Financial Performance ..................................................................................................................................... 22
Acquisitions ..................................................................................................................................................... 24
Human Resources ............................................................................................................................................ 26
Capital Investments ......................................................................................................................................... 27
Review of Operating and Financial Performance ............................................................................................ 28
Key Events in the First Quarter of 2015 .......................................................................................................... 34
Events Occurring After March 31, 2015 .......................................................................................................... 35
Principles for the Preparation of the Interim Report on Operations at March 31, 2015 ................................ 36
Business Outlook ............................................................................................................................................. 39

Board of Directors and Board of Statutory Auditors Board of Directors
Chairperson Gabriella Chersiclaa Chief Executive Officer and General Manager Yvon Guérin Directors Patrice Gassenbach
Laura Gualtieri(i) (2) (3)
Paolo Francesco Lazzati(i) (1) (2) Umberto Mosetti(i) (1) (2) (3) Riccardo Perotta(i) (1)
Antonio Sala(3)
(i) Independent Director (1) Member of the Internal Control, Risk Management and Corporate Governance Committee (2) Member of the Nominating and Compensation Committee (3) Member of the Litigation Committee
Board of Statutory Auditors Chairman Michele Rutigliano Statutory Auditors Giorgio Loli
Alessandra Stabilini
Parmalat S.p.A. – A company subject to guidance and coordination by B.S.A. S.A.
a Gabriella Chersicla is a senior officer of the Company, pursuant to implementation criterion 3.C.2 of the Corporate Governance Code of Borsa Italiana. Chairperson Gabriella Chersicla is an independent Director pursuant to Article 3 of the Corporate Governance Code.
4 Interim Report on Operations at March 31, 2015
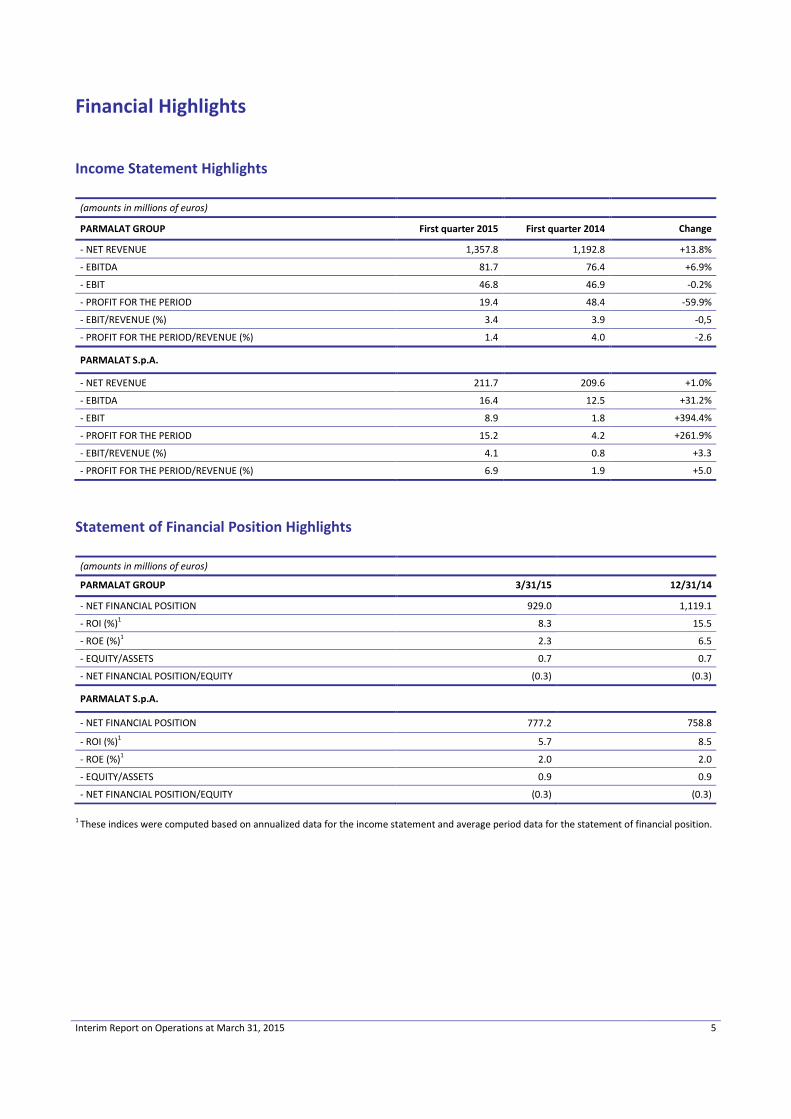
Financial Highlights Income Statement Highlights (amounts in millions of euros)
PARMALAT GROUP First quarter 2015 First quarter 2014 Change
- NET REVENUE 1,357.8 1,192.8 +13.8%
- EBITDA 81.7 76.4 +6.9%
- EBIT 46.8 46.9 -0.2%
- PROFIT FOR THE PERIOD 19.4 48.4 -59.9%
- EBIT/REVENUE (%) 3.4 3.9 -0,5
- PROFIT FOR THE PERIOD/REVENUE (%) 1.4 4.0 -2.6
PARMALAT S.p.A.
- NET REVENUE 211.7 209.6 +1.0%
- EBITDA 16.4 12.5 +31.2%
- EBIT 8.9 1.8 +394.4%
- PROFIT FOR THE PERIOD 15.2 4.2 +261.9%
- EBIT/REVENUE (%) 4.1 0.8 +3.3
- PROFIT FOR THE PERIOD/REVENUE (%) 6.9 1.9 +5.0
Statement of Financial Position Highlights (amounts in millions of euros)
PARMALAT GROUP 3/31/15 12/31/14
- NET FINANCIAL POSITION 929.0 1,119.1
- ROI (%)1 8.3 15.5
- ROE (%)1 2.3 6.5
- EQUITY/ASSETS 0.7 0.7
- NET FINANCIAL POSITION/EQUITY (0.3) (0.3)
PARMALAT S.p.A.
- NET FINANCIAL POSITION 777.2 758.8
- ROI (%)1 5.7 8.5
- ROE (%)1 2.0 2.0
- EQUITY/ASSETS 0.9 0.9
- NET FINANCIAL POSITION/EQUITY (0.3) (0.3)
1 These indices were computed based on annualized data for the income statement and average period data for the statement of financial position.
Interim Report on Operations at March 31, 2015 5

Operating Performance NOTE: The data are stated in millions of euros and local currency. As a result, the amount of changes and percentages could reflect apparent disparities caused exclusively by the rounding of figures.
Revenue and Profitability In the first quarter of 2015, the global economy posted moderate growth, which continues to be driven by the advanced economies, primarily the United States. The first three months of the year, characterized by a decline in the price of oil and high volatility in the foreign exchange markets, saw a rebalancing of the drivers of economic growth, shifting from the petroleum exporting countries to the main importers, favored by the drop in oil prices. Net revenue totaled 1,357.8 million euros in the first quarter of 2015 (+13.8%) and EBITDA amounted to 81.7 million euros (+6.9%) thanks to positive results in the Latin America, Africa and Europe sales regions. During the first three months of the year, the raw milk market was highly dynamic in all of the main sale regions in which the Group operates, with average purchasing prices that increased compared with the previous year in Africa and Latin America and decreased in Europe and North America. The Group’s result were affected only to a limited extent by the currency translation effect, as the negative impact resulting from the devaluation of the Venezuelan bolivar was offset by the appreciation of the other main currencies with which the Group operates. Parmalat Group The table below shows the highlights of the Group’s results in 2015 and a comparison with the first quarter of the previous year:
Net revenue totaled 1,357.8, for a gain of 13.8% compared with the previous year, and EBITDA amounted to 81.7 million euros, or 5.2 million euros more (+6.9%) than the 76.4 million euros reported in 2014. The table below shows the results of the Parmalat Group at comparable scope of consolidation and constant exchange rates and excluding the effects of hyperinflation in Venezuela. A comparable scope of consolidation is obtained by excluding the contribution provided by the Harvey Fresh Group, acquired in Australia in the second quarter of 2014, and the results of the activities acquired in the first quarter of 2015, including Lácteos Brasil S.A. – Em Recuperação Judical (LBR) in Brazil, Latterie Friulane in Italy and Longwarry in Australia.
(amounts in millions of euros) 2015 2014 Variance Varian.%
Net Revenue 1,357.8 1,192.8 165.1 +13.8%
EBITDA 81.7 76.4 5.2 +6.9%
EBITDA % 6.0 6.4 -0.4 ppt
First Quarter
Constant exchange rates
(amounts in millions of euros) 2015 2014 Variance Varian.%
Net Revenue 1,277.5 1,190.1 87.4 +7.3%
EBITDA 97.7 80.4 17.3 +21.5%
EBITDA % 7.6 6.8 0.9 ppt
Constant scope of consolidation, exchange rates and excluding hyperinflation impact
First Quarter
6 Interim Report on Operations at March 31, 2015
Net revenue grew by 7.3%, with the operations in the Latin America, Africa and Australia sales regions providing a particularly strong contribution; at the same time, revenue declined in the Europe and North America sales regions, mainly due to a reduction in average sales prices caused by a decrease in the price of raw milk compared with the first quarter of last year. EBITDA, with data on a comparable basis, show an increase of 21.5%, reflecting the impact of a strong performance in the Latin America, Africa and Europe sales regions which offset the slight growth in Australia and North America. With data on a comparable basis, the Group shows an increase in its profit margins in the first three months of 2015, thanks to a steady improvement in operating efficiency and an optimized use of sales promotions in those markets where the purchase price of raw milk decreased.
Interim Report on Operations at March 31, 2015 7

Like-for-Like Net Revenue and EBITDA The diagram below presents the main variables that determined the evolution of net revenue and EBITDA in 2015, compared with the previous year.
Net Revenue First Quarter 2015 vs 2014 (€ m)
1,192.8 -2.6 1,190.1
90.4
-46.3
44.7
-1.4 1,277.5
3.2 11.3 65.8
1,357.8
Net Revenue 2014 Hyperinfl.Venezuela
2014
Net Revenue2014excl.
hyperinflation
Price Discounts Volume/Mix Other Net Revenue2015 at
constant scopeof consol. and
exchangerates
Currencytranslation
Hyperinfl.Venezuela
2015
New activities(Lat. Friulane-HF-LBR-Longwarry)
Net Revenue 2015
+7.3%+13.8%
EBITDA First Quarter 2015 vs 2014 (€ m)
76.4
4.0
80.4
44.1
-27.3
7.1
-2.2 -4.4 97.7 -3.8 -9.0 -3.2 81.7
EBITDA 2014 Hyperinfl.Venezuela
2014
EBITDA2014excl.
hyperinflation
Price/Discounts
Productioncosts
Volume/Mix
Venezuelageneral costs
Mkt investmentsand fixed
general costs
EBITDA2015 at
constant scopeof consol. and
exchangerates
Currencytranslation
Hyperinfl.Venezuela
2015
New activities(Lat. Friulane-HF-LBR-Longwarry)
EBITDA 2015
+21.5%+6.9%
8 Interim Report on Operations at March 31, 2015

Data by Geographic Region
In order to improve comparability with the 2014 data, the table below presents the Group’s results at constant exchange rates and comparable scope of consolidation and excluding the effects of hyperinflation in Venezuela:
15 17 3 5
(amounts in millions of euros)
Region Net revenue EBITDA EBITDA % Net revenue EBITDA EBITDA % Net revenue EBITDA
Europe 267.6 25.2 9.4 274.9 22.3 8.1 -2.7% +13.2%
North America 529.3 42.2 8.0 506.9 39.5 7.8 +4.4% +7.0%
America Latina 213.3 2.6 1.2 140.8 7.7 5.5 +51.5% -66.7%
Africa 111.6 8.5 7.6 86.5 5.6 6.5 +29.0% +52.5%
Australia 240.0 7.1 2.9 184.5 6.4 3.4 +30.1% +10.9%
Other 1 -3.9 -4.0 n.s. -0.9 -5.0 n.s. n.s. +21.1%
Group 1,357.8 81.7 6.0 1,192.8 76.4 6.4 +13.8% +6.9%
Regions represent the consolidated countries1. Includes other non-core companies, eliminations between regions and Group's Parent Company costs
First Quarter 2015 First Quarter 2014 Delta %
Net Revenue by Geographic Region
Europe20%
North America39%
Latin America16%
Africa8%
Australia17%
7 24 15 32
(amounts in millions of euros)
Region Net revenue EBITDA EBITDA % Net revenue EBITDA EBITDA % Net revenue EBITDA
Europe 271.8 25.6 9.4 274.9 22.3 8.1 -1.1% +14.7%
North America 468.2 37.1 7.9 506.9 39.5 7.8 -7.6% -5.9%
Latin America 247.3 25.8 10.5 138.2 11.7 8.5 +79.0% +120.4%
Africa 100.2 7.7 7.7 86.5 5.6 6.5 +15.8% +37.4%
Australia 193.2 5.4 2.8 184.5 6.4 3.4 +4.7% -15.1%
Other 1 -3.3 -4.0 n.s. -0.9 -5.0 n.s. n.s. +21.0%
Group (constant scope of consolid./exchange rates) 2
1,277.5 97.7 7.6 1,190.1 80.4 6.8 +7.3% +21.5%
Regions represent the consolidated countries
1. Includes other non-core companies, eliminations between regions and Group's Parent Company costs
2. Excluding hyperinflation impact and activities acquired in the second quarter 2014 (Harvey Fresh) and in the first quarter 2015 (LBR, Latterie Friulane and Longwarry)
First Quarter 2015 First Quarter 2014 Delta %
Interim Report on Operations at March 31, 2015 9

Data by Product Division
Net Revenue by Product Division
In order to improve comparability with the 2014 data, the table below presents the Group’s results at constant exchange rates and comparable scope of consolidation and excluding the effects of hyperinflation in Venezuela:
The Fruit Beverage Division reported a strong improvement in profitability due to the positive results it achieved, particularly in the Latin America sales region.
(amounts in millions of euros)
Division Net revenue EBITDA EBITDA % Net revenue EBITDA EBITDA % Net revenue EBITDA
Milk 1 694.2 25.5 3.7 609.7 21.4 3.5 +13.9% +18.9%
Frui t base drinks 2 88.3 13.7 15.5 69.8 8.1 11.6 +26.4% +68.8%
Cheese and other fresh products 3 517.6 47.6 9.2 461.1 42.7 9.3 +12.2% +11.5%
Other 4 57.8 (5.1) (8.8) 52.2 4.2 8.1 +10.8% n.s.
Group 1,357.8 81.7 6.0 1,192.8 76.4 6.4 +13.8% +6.9%
1 Includes milk, cream and béchamel2 Includes fruit base drinks and tea3 Includes yogurt, dessert, cheese4 Includes other products, whey, impact of hyperinflation in Venezuela and Group's Parent Company costs
First Quarter 2015 First Quarter 2014 Delta %
First Quarter 2015 First Quarter 2014
1 Includes milk, cream and béchamel2 Includes fruit base drinks and tea3 Includes yogurt, dessert, cheese4 Includes other products, whey, impact of hyperinflation in Venezuela
Milk1
51,1%
Fruit base drinks
25,9%
Cheese and other fresh products
338,7%
Other4
4,4%
Milk1
51,1%
Fruit base drinks
26,5%
Cheese and other
fresh products
338,1%
Other4
4,3%
(amounts in millions of euros) First Quarter 2015 First Quarter 2014 Delta %
Division Net revenue EBITDA EBITDA % Net revenue EBITDA EBITDA % Net revenue EBITDA
Milk 1 658.9 29.4 4.5 609.7 21.4 3.5 +8.1% +37.2%
Frui t base drinks 2 112.3 19.3 17.2 69.8 8.1 11.6 +60.8% +137.3%
Cheese and other fresh products 3 464.8 46.3 10.0 461.1 42.7 9.3 +0.8% +8.6%
Other 4 41.4 2.6 6.3 49.6 8.2 16.5 -16.4% n.s.
Group (constant scope of consolid.& exchange rates) 5
1,277.5 97.7 7.6 1,190.1 80.4 6.8 +7.3% +21.5%
1 Includes milk, cream and béchamel2 Includes fruit base drinks and tea3 Includes yogurt, dessert, cheese4 Includes other products, whey and Group's Parent Company costs5. Excluding hyperinflation impact and activities acquired in the second quarter 2014 (Harvey Fresh) and in the first quarter 2015 (LBR, Latterie Friulane and Longwarry)
10 Interim Report on Operations at March 31, 2015
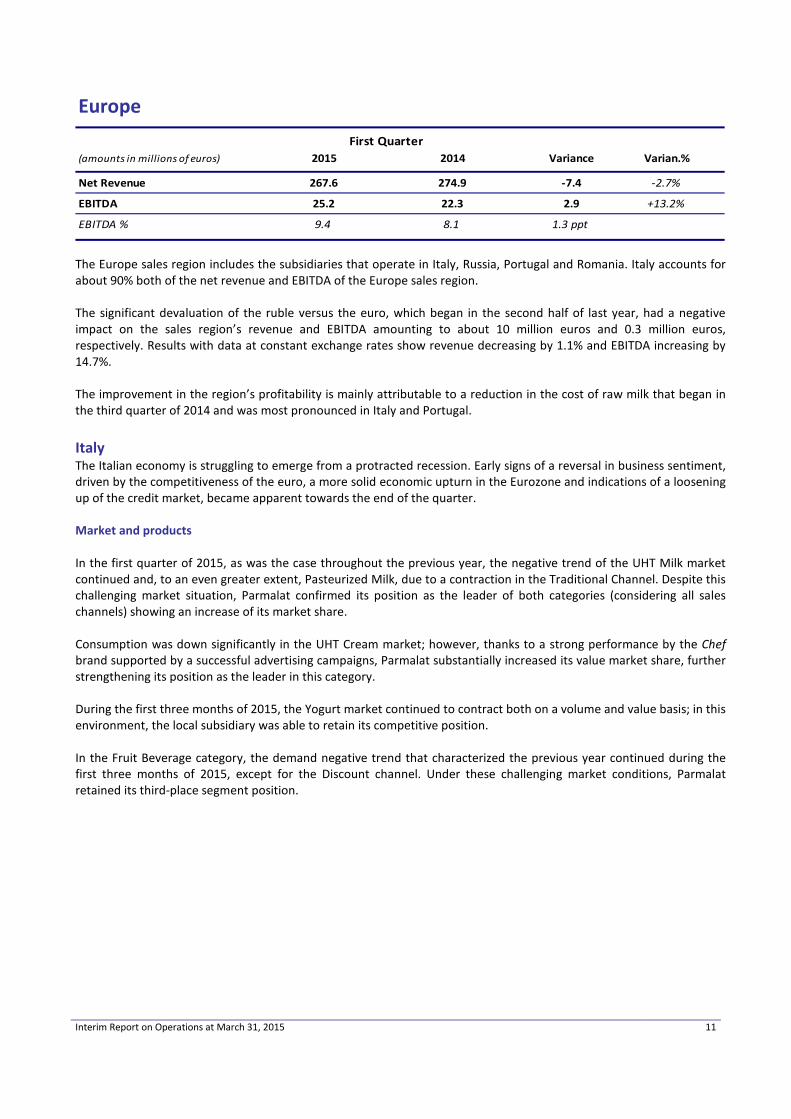
Europe
The Europe sales region includes the subsidiaries that operate in Italy, Russia, Portugal and Romania. Italy accounts for about 90% both of the net revenue and EBITDA of the Europe sales region. The significant devaluation of the ruble versus the euro, which began in the second half of last year, had a negative impact on the sales region’s revenue and EBITDA amounting to about 10 million euros and 0.3 million euros, respectively. Results with data at constant exchange rates show revenue decreasing by 1.1% and EBITDA increasing by 14.7%. The improvement in the region’s profitability is mainly attributable to a reduction in the cost of raw milk that began in the third quarter of 2014 and was most pronounced in Italy and Portugal. Italy The Italian economy is struggling to emerge from a protracted recession. Early signs of a reversal in business sentiment, driven by the competitiveness of the euro, a more solid economic upturn in the Eurozone and indications of a loosening up of the credit market, became apparent towards the end of the quarter. Market and products In the first quarter of 2015, as was the case throughout the previous year, the negative trend of the UHT Milk market continued and, to an even greater extent, Pasteurized Milk, due to a contraction in the Traditional Channel. Despite this challenging market situation, Parmalat confirmed its position as the leader of both categories (considering all sales channels) showing an increase of its market share. Consumption was down significantly in the UHT Cream market; however, thanks to a strong performance by the Chef brand supported by a successful advertising campaigns, Parmalat substantially increased its value market share, further strengthening its position as the leader in this category. During the first three months of 2015, the Yogurt market continued to contract both on a volume and value basis; in this environment, the local subsidiary was able to retain its competitive position. In the Fruit Beverage category, the demand negative trend that characterized the previous year continued during the first three months of 2015, except for the Discount channel. Under these challenging market conditions, Parmalat retained its third-place segment position.
(amounts in millions of euros) 2015 2014 Variance Varian.%
Net Revenue 267.6 274.9 -7.4 -2.7%
EBITDA 25.2 22.3 2.9 +13.2%
EBITDA % 9.4 8.1 1.3 ppt
First Quarter
Interim Report on Operations at March 31, 2015 11

The table below shows the market share held by Parmalat in the main market segments in which it operates:
Products 2015 value market share 2014 value market share UHT milk1 30.9% 29.7%
Pasteurized milk2 22.7% 21.6%
UHT cream1 26.4% 24.9%
Yogurt3 4.1% 4.4%
Fruit beverages3 10.3% 10.8% 1Source: Nielsen – Total Italy from 1/1/15 to 3/29/15 2Source: Nielsen Modern Channel from 1/1/15 to 3/29/15
3Source: IRI – Total Italy from 1/1/15 to 3/29/15
Total sales volumes increased compared with the previous year, due to a positive performance with UHT Milk, achieved despite a negative market trend; on the other hand, sales of Fruit Beverages and Pasteurized Milk decreased, as a result of the market trend. Despite the growth in unit sales, the revenue reported by the Business Unit showed little change compared with the previous year, due to an increased use of sales promotions, particularly in the UHT Milk category. EBITDA for the period grew compared with the first quarter of 2014, primarily due to an increase in sales volumes and lower costs paid for raw materials, mainly milk, plastics used for bottles and sugar. During the first three month of the year, investments in advertising programs to support the main brands were substantially higher than in the previous year, but the local subsidiary benefited from the optimization of operating expenses. Russia Internal consumption was adversely affected by international sanctions and a slowing of the Russian economy caused by the slide in oil prices and a contraction in real wages. A fair rebound by the ruble during the quarter helped keep the level of inflation under control. All of the main markets in which the local subsidiary operates, with the exception of the Cream segment where the trend held steady, felt the impact of these crisis conditions. However, the local subsidiary was able to hold its competitive position unchanged in each of the segments in which it operates. With data stated in the local currency, the results of the local subsidiary show a net revenue gain of 11.2% compared with the previous year, following the price list increases implemented for all of the main categories in which it operates. EBITDA decreased compared with the previous year due to the higher costs incurred to purchase raw milk and the effects of the devaluation of the local currency on the cost of imported raw materials and packaging materials. Portugal The Portuguese economy started a recovery trend following the restructuring of public finances. However, the high rate of unemployment and the deleveraging process affecting households continue to constrain internal demand by consumers. Among the markets in which the local subsidiary operates, those for Flavored Milk and Fruit Beverages were the most affected by the crisis; on the other hand, the trend for the UHT Cream market was up on a volume basis. In such an environment, in which private labels are playing a steadily growing role, Parmalat held steady its market positions. Net revenue decreased compared with the previous year, reflecting the impact of lower sales volumes, particularly in the UHT Milk category, and an increased use of sales promotions; in spite of this, profitability improved in the first quarter thanks to a reduction in the purchasing costs of raw milk compared with the previous year.
12 Interim Report on Operations at March 31, 2015

Romania The Fruit Beverage segment, which is practically the only segment in which the local subsidiary operates, grew during the first quarter of 2015, with the best gains recorded in the Still Drinks segment. Parmalat, with its Santàl brand, held steady its competitive position. The operating results of the company for the first quarter of the year show an overall improvement compared with the previous year, made possible by the significant increase in sales volumes and its ability to contain overheads.
Interim Report on Operations at March 31, 2015 13

North America
The North America sales region includes the subsidiaries that operate in the United States and Canada, with the latter accounting for about 60% of the revenue and EBITDA. The significant increase in the value of the U.S. and Canadian dollar versus the euro had a positive impact on revenue and EBITDA amounting to about 61 million euros and 5.1 million euros, respectively. With data at constant exchange rates, the net revenue of the North America sales region decreased of 7.6% and EBITDA showed a contraction of 5.9% compared with the previous year.
Canada In the first quarter of the year, the Canadian economy, severely affected by the trend in oil prices, saw a reduction in consumer spending. However, the budgets of households and businesses benefitted from a decline in energy costs during a period of particularly inclement winter weather. The weaker Canadian dollar boosted exports, but also imported inflation from the United States, Canada’s main trading partner. Market and Products The ongoing contraction in Milk consumption continued during the first three months of 2015, in line with last year’s trend, with a reduction particularly in the Premium segment. Despite this challenging market situation, Parmalat succeeded in increasing its value market share, strengthening its third-place competitive position. Consumption was up modestly in the Yogurt market thanks to a positive performance in the Drinkable Yogurt segment and despite a slight contraction in the Spoonable Yogurt segment. Within the latter segment, demand was up in the Greek Yogurt category, in which the local subsidiary recently launched a new product under the brand Astro Athentikos. Parmalat held unchanged its market position, despite fierce competitive pressure.
During the first three months of 2015, consumption was up slightly in the Cheese market, thanks to significant growth in the Natural and Snack segments. In this environment, the local subsidiary held its value market share virtually unchanged, confirming its second-place market position. The table below shows the market share in the main market segments:
Products 2015 value market share 2014 value market share Milk 20.1% 16.9%
Spoonable yogurt 11.7% 11.9%
Drinkable yogurt 4.7% 6.0%
“Snack” cheese 39.5% 39.6%
“Natural” cheese 13.1% 13.1% Source: ACNielsen, MarketTrack, National Grocery Banner+Drug+Mass Merch, from 1/1/15 to 3/7/15
With data stated in the local currency, the company shows a decrease both in sales volumes and net revenue, mainly attributable to a negative performance in the Pasteurized Milk category that was consistent with the contraction in the market in general.
(amounts in millions of euros) 2015 2014 Variance Varian.%
Net Revenue 529.3 506.9 22.4 +4.4%
EBITDA 42.2 39.5 2.8 +7.0%
EBITDA % 8.0 7.8 0.2 ppt
First Quarter
14 Interim Report on Operations at March 31, 2015

Despite a decrease in the average purchase price of production materials compared with the previous year, EBITDA contracted, chiefly as a result of the sales trend in markets characterized by strong competitive pressure.
United States of America The U.S. economy continues to drive the recovery in the advanced countries. Consumer spending, the true engine of the American economy, while adversely affected by a very cold winter continued to benefit from positive indicators regarding industrial activity, disposable income an the labor and real estate markets. Market and Products In the Cheese category, based on a market perimeter limited to the categories in which the Group operates, the trend was positive in the first quarter of 2015, with a significant increase in consumption, particularly in the Snack Cheese and Fresh Mozzarella segments. In this context, despite a reduction of it value market share, Parmalat retained its leadership position in both categories. In the first quarter of 2015, consumption was down significantly in the Feta Cheese and Gourmet Cheddar categories; however, despite these market conditions, Parmalat increased its value market share in the Feta Cheesed segment. The market for Gourmet Spreadable Cheese held steady both on a volume and value basis, but Parmalat suffered a significant reduction in market share. The table below shows Parmalat’s market share in the main segments in which it operates:
Products 2015 value market share 2014 value market share Total cheese 1 11.6% 12.7%
Gourmet spreadable 29.5% 32.3%
Feta cheese 15.4% 14.4%
Fresh mozzarella 19.3% 22.0%
Soft ripened cheese 37.6% 41.8%
Chunk mozzarella 17.9% 17.2%
Ricotta 25.9% 26.0%
Snack cheese 5.0% 5.9%
Gourmet cheddar cheese 1.3% 1.7% Source: SymphonyIRI Group Market Advantage, Total US Multioutlet from 1/1/15 to 3/29/15
1 The perimeter of the market in question includes the following categories: Snack Cheese, Chunk Mozzarella , Feta Cheese, Ricotta, Fresh Mozzarella, Soft Ripened Cheese, Gourmet Spreadable Cheese and Gourmet Cheddar Cheese.
Overall, the sales volumes reported by U.S. subsidiary were in line with the previous year, thanks to a positive performance in the Cheese category, which accounts for more than 70% of total sales, that offset the effects of a reduction in sales of ingredients.
Interim Report on Operations at March 31, 2015 15
As for net revenue, the data stated in the local currency show a decrease of 12.4% due to a reduction in average sales prices driven by sales promotion pressure in a context of lower purchasing costs for milk. The profitability of the U.S. subsidiary improved, due mainly to a decrease in the purchasing prices paid for raw milk, compared with the record prices paid last year, from which benefited mostly the retail division.
16 Interim Report on Operations at March 31, 2015

Latin America
The Latin America sales region includes the subsidiaries that operate in Venezuela, Colombia, Ecuador, Paraguay, Mexico and Brazil. In addition, the Group strengthened its presence in Brazil with the acquisition of LBR in January 2015, after taking over its management on November 1, 2014; in addition, it operates commercial companies in Uruguay, Peru and Bolivia. The data presented above include the effect of hyperinflation in Venezuela and a negative translation effect, which reduced revenue and EBITDA by about 72 million euros and 9.8 million euros, respectively, due mainly to the devaluation of the Venezuelan bolivar versus the euro. The income statement data of the Venezuelan subsidiary for the first quarter of 2015 were translated by applying the SICAD exchange rate (rate in effect at March 31, 2015 equal to 12 VEF/USD). With data at constant exchange rates and comparable scope of consolidation (excluding LBR) and without the effects of hyperinflation, the results for this sales region show gains of 79% for revenue and 120% for EBITDA.
Venezuela Economic and political uncertainty, combined with consumer price inflation, are the main elements of a picture that remains volatile and which, for domestic and foreign businesses, has been made more complicated by the reform of the foreign exchange system implemented in February by the Venezuelan government. The total volumes sold by the local subsidiary increased compared with the previous year; more specifically, an analysis by categories shows significant gains for sales of Pasteurized Milk and Yogurt and steady volumes for Fruit Beverages. Net revenue stated in the local currency grew by 126.4% compared with the previous year, reflecting the adjustments made to price lists to reflect the country’s high level of inflation and the abovementioned increase in sales volumes. EBITDA increased compared with the previous year, thanks to an improved sales mix and price list adjustments, particularly in the Fruit Juice category.
(amounts in millions of euros) 2015 2014 Variance Varian.%
Net Revenue 213.3 140.8 72.5 +51.5%
EBITDA 2.6 7.7 -5.2 -66.7%
EBITDA % 1.2 5.5 -4.3 ppt
First Quarter
Interim Report on Operations at March 31, 2015 17

Colombia Despite the anticipated slowing of its growth rate caused by the slump in oil prices, the Colombian economy is proving to be one of the best equipped in Latin America to deal with international turbulence, thanks to the reserves built up in previous years and its status within numerous international trade agreements. The results reported by the local subsidiary show a net revenue decrease of 6.1%, caused by a contraction in sales volumes, particularly for Liquid Milk and Yogurt, and an increase in promotional pressure in the main markets where the local subsidiary operates. EBITDA decreased due to the combined impact of lower sales and higher energy costs, the price of which is tied to the exchange rate for the U.S. dollar.
Other Countries in Latin America The net revenue generated by the other countries in this sales region (Ecuador, Paraguay, Brazil and Mexico) increased compared with the previous year, owing in part to the acquisition of some production units of LBR in Brazil. In Ecuador, net revenue grew by 12.4%, with data in the local currency, due mainly to increases both in volumes and sales prices The sharp drop in net revenue experienced in Paraguay compared with the previous year is chiefly the result of a contraction in Milk sales. Mexico and Brazil present attractive growth opportunities; upon completion on January 8, 2014 of certain procedures subject of some conditions precedent, the Group strengthened its presence in Brazil tanks to the acquisition of some production units, complete with the respective trademarks, personnel and administrative offices, of Lácteos Brasil S.A. – Em Recuperação Judicial (LBR), a company in composition with creditors proceedings under Brazilian law. This transaction, the subject of which is a portfolio of business operations in the UHT Milk and local Cheese segments, also enabled Parmalat to regain full ownership of the exclusive license to use the Parmalat brand throughout Brazil. In Brazil, the quarter was characterized by a low level of confidence in short-term projections by the private sector. The situation was made worse by the scandal involving the national oil company, which had repercussions on the infrastructure sector and the economy in general. In the first three months of the year, the results of the new activities acquired in Brazil were adversely affected by the negative conditions described above, in addition to the challenge of restarting production after a temporary stoppage during the composition with creditors proceedings, therefore they reported slightly negative EBITDA (-4.4 million euros) for the first quarter of 2015. Management is addressing these issues, which are expected to continue in the coming months, with appropriate programs to restore these activities to their full operating capacity; profitability is expected to improve during the second half of the year. In Mexico, the Group currently is present with a commercial company and will strengthen its position during the course of the year thanks to the acquisition of a group of companies specialized in the production and distribution of cheese.
18 Interim Report on Operations at March 31, 2015

Africa
The Africa sales region includes the subsidiaries that operate in South Africa, Zambia, Botswana, Swaziland and Mozambique. South Africa accounts for more than 80% of the net revenue and70% of the EBITDA of the entire sales region. The data presented above, stated in euros, reflect a positive translation effect, which increased revenue and EBITDA by about 11.4 million euros and 0.8 million euros, respectively, due mainly to the increase in the value of the South African rand versus the euro. With data stated at constant exchange rates, the region’s results show increases of 15.8% for revenue and 37.4% for EBITDA. The positive performance achieved in the Africa sales region is the result of an increase in sales volumes, made possible in part by a greater availability of raw milk. South Africa Consumer spending grew strongly in the first quarter compared with the previous year. A positive performance by the mining sector, combined with the low cost of crude oil, boosted the level of disposable income. Another positive factor was the absence of labor strikes that instead conditioned the performance of the economy in the recent past. Market and Products In the first three months of 2015, Milk market consumption was down slightly, due to the high level of the average prices. In a particularly challenging context, in which private labels account for about half of the total value, the company increased its market share and strengthened its second-place competitive position. The Flavored Milk segment performed well during the first three months of the year, with positive results on a volume basis and even better results on a value basis. Thanks to its Steri Stumpie brand, the company continues to hold a firm grip on the market leadership position. The Cheese market grew at an attractive rate on a value basis, thanks mainly to positive performances in the Hard Cheese, Processed Cheese and Feta Cheese segments. Parmalat strengthened its position as the segment’s leader and significantly increased its value market share, thanks in part to the investments in advertising. The difficulties that began to develop in the Yogurt market in 2014 continued in the first three months of 2015, due to falling consumption, particularly in the Eating Yogurt segment. In this difficult market context, Parmalat was nevertheless able to maintain its second-place competitive position.
D(amounts in millions of euros) 2015 2014 Variance Varian.%
Net Revenue 111.6 86.5 25.1 +29.0%
EBITDA 8.5 5.6 2.9 +52.5%
EBITDA % 7.6 6.5 1.2 ppt
First Quarter
Interim Report on Operations at March 31, 2015 19
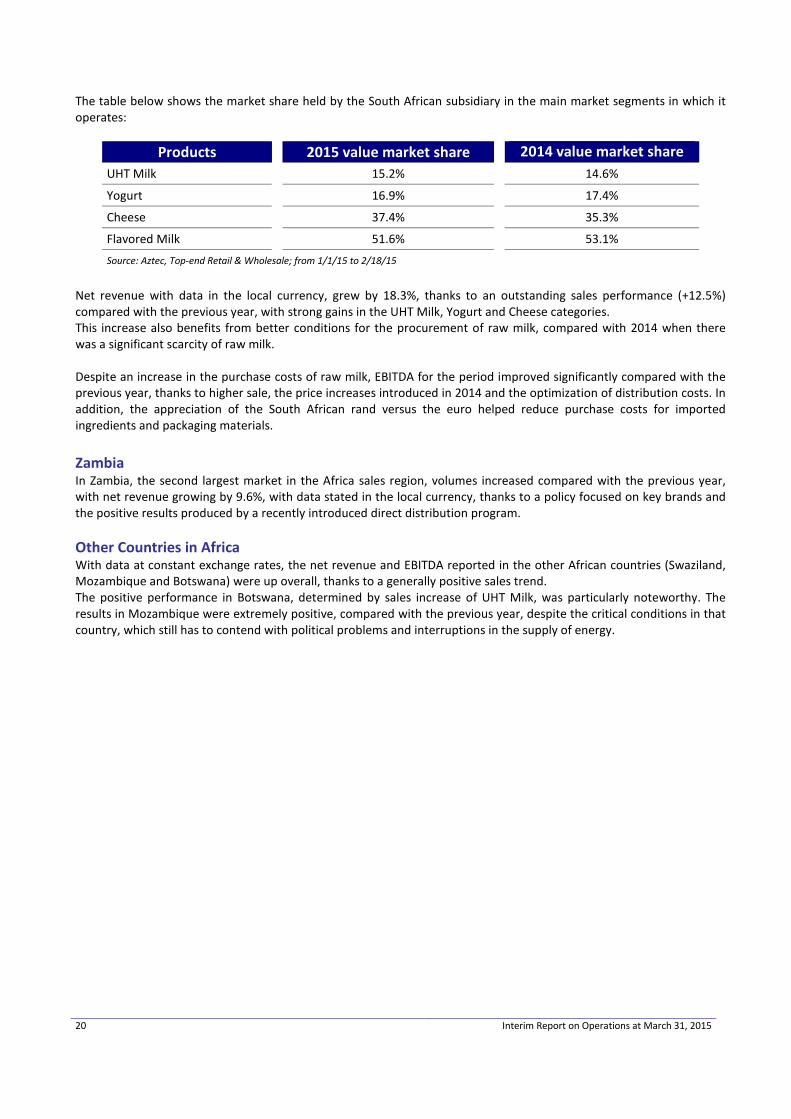
The table below shows the market share held by the South African subsidiary in the main market segments in which it operates:
Products 2015 value market share 2014 value market share UHT Milk 15.2% 14.6%
Yogurt 16.9% 17.4%
Cheese 37.4% 35.3%
Flavored Milk 51.6% 53.1% Source: Aztec, Top-end Retail & Wholesale; from 1/1/15 to 2/18/15
Net revenue with data in the local currency, grew by 18.3%, thanks to an outstanding sales performance (+12.5%) compared with the previous year, with strong gains in the UHT Milk, Yogurt and Cheese categories. This increase also benefits from better conditions for the procurement of raw milk, compared with 2014 when there was a significant scarcity of raw milk. Despite an increase in the purchase costs of raw milk, EBITDA for the period improved significantly compared with the previous year, thanks to higher sale, the price increases introduced in 2014 and the optimization of distribution costs. In addition, the appreciation of the South African rand versus the euro helped reduce purchase costs for imported ingredients and packaging materials. Zambia In Zambia, the second largest market in the Africa sales region, volumes increased compared with the previous year, with net revenue growing by 9.6%, with data stated in the local currency, thanks to a policy focused on key brands and the positive results produced by a recently introduced direct distribution program. Other Countries in Africa With data at constant exchange rates, the net revenue and EBITDA reported in the other African countries (Swaziland, Mozambique and Botswana) were up overall, thanks to a generally positive sales trend. The positive performance in Botswana, determined by sales increase of UHT Milk, was particularly noteworthy. The results in Mozambique were extremely positive, compared with the previous year, despite the critical conditions in that country, which still has to contend with political problems and interruptions in the supply of energy.
20 Interim Report on Operations at March 31, 2015

Australia The rebalancing the Australian economy with a greater focus on internal demand, consumer spending in particular, is continuing concurrently with a gradual reduction of investments in infrastructure to support the mining sector and a slowing of exports of mineral resources to China. Market and Products The trend in the Pasteurized Milk market was positive in the first quarter of 2015, with modest gains both on a volume and value basis. In a competitive context dominated by private labels, Parmalat retained the segment’s leadership position. The Flavored Milk segment was one of the most dynamic categories, growing booth in volume and value terms in the first three months of the year. Thanks to a strong performance by its Oak brand, Parmalat retained its second-place position in the category, with a constant market share, in spite of a highly competitive market. Overall consumption was down sharply in the Yogurt market in the first three months of 2015, even though the Greek Yogurt segment continued to enjoy the positive growth trends experienced the previous year. Parmalat held steady its third-place market position, but suffered a significant loss of value market share. A highly negative trend continued in the Dessert market during the first three months of 2015, particularly on a volume basis. Despite these challenging market conditions, the local subsidiary significantly increased its value market share, achieving the leadership position in this category. The table below shows the market share held by Parmalat in the main market segments in which it operates:
Products 2015 value market share 2014 value market share Pasteurized milk 19.8% 20.3%
Flavored milk 35.0% 35.3%
Yogurt 11.8% 14.5%
Desserts 32.1% 28.3% Source: Aztec Australia – from 1/1/15 to 3/22/15
The table below shows the results for 2015 compared with the previous year; the data include the contribution of the new activities acquired in the second quarter of 2014 (Harvey Fresh) and the first quarter of 2015 (Longwarry):
The appreciation of the local currency compared with the exchange rate applied in the same period last year generated a positive effect on revenue and EBITDA of about 13 million euros and 0.4 million euros, respectively. With data at constant exchange rates and comparable scope of consolidation, i.e., excluding the new Harvey Fresh and Longwarry operations, net revenue and EBITDA show increases of 4.7% and 8.3%, respectively, thanks mainly to a positive performance in the Flavored Milk category. However, the profitability of the company was lower than in the first quarter of 2014, due mainly to an increase in advertising investments, the full benefits of which will be felt in the coming months. The local subsidiary is continuing to implement a program to increase manufacturing efficiency and contain distribution costs.
D(amounts in millions of euros) 2015 2014 Variance Varian.%
Net Revenue 240.0 184.5 55.5 +30.1%
EBITDA 7.1 6.4 0.7 +10.9%
EBITDA % 2.9 3.4 -0.5 ppt
First Quarter
Interim Report on Operations at March 31, 2015 21

Financial Performance
Financial Results
Structure of the Net Financial Position of the Group and Its Main Companies
The Group’s liquid assets, before deducting financial liabilities, totaled 1,104.7 million euros, including 764.7 million euros held by Parmalat S.p.A. At March 31, 2015, the entire amount of this liquidity was invested in sight and short-term bank deposits and similar products. The remaining liquid assets are held by individual Group companies, which invest them in the same instruments as the Parent Company. At the Group level, bank interest income totaled 2.5 million euros, including 1.5 million euros attributable to Parmalat S.p.A. A reduction in interest rates is the reason for the decrease compared with the previous period. Parmalat S.p.A. never used the cash pooling system in the first quarter of 2015.
The Group’s financial resources are available to support the development of its businesses, which may also take place through acquisitions, as described in the “Acquisitions” section of this Report.
Change in Net Financial Position
The Group’s net financial position decreased from 1,119.1 million euros at December 31, 2014 to 929.0 million euros at March 31, 2015, after a positive translation effect of 17.8 million euros.
The operating activities absorbed cash totaling 100.0 million euros in the first quarter, due mainly the seasonality of the Group’s businesses, which generated a positive cash flow of 178.5 million euros in the last quarter of 2014.
The cash absorbed by non-recurring activities, which amounted to 129.3 million euros, is mainly attributable to the acquisitions of Lácteos Brasil in Brazil, Longwarry in Australia and Latterie Friulane in Italy. All of these transactions are described in detail in the “Acquisitions” section of this Report.
The net cash flow from litigations was negative by 0.1 million euros.
The cash flow from financing activities amounted to 21.5 million euros, including 1.6 million euros generated by the exercise of warrants.
22 Interim Report on Operations at March 31, 2015

Interim Report on Operations at March 31, 2015 23

Acquisitions Italy: Latterie Friulane On December 30, 2014, with effect as of January 1, 2015, Parmalat purchased from Consorzio Cooperativo Latterie Friulane S.C.A. (Latterie Friulane) business operations encompassing the activities engaged in the production, marketing and distribution of milk and dairy products. This transaction was completed with the transfer of a net capital of 5.75 million euros and the assumption of bank debt of equal amount. Brazil: LBR’s Assets On January 8, 2015, upon completion of the procedures required to fulfill certain contractually stipulated conditions precedent, title to some production units, complete with the respective trademarks, personnel and administrative offices, of Lácteos Brasil S.A. – Em Recuperação Judicial (LBR) was transferred to Lactalis do Brasil against payment of a price of 250 million reals. On the same date, the existing contract licensing the Parmalat trademark to LBR was cancelled. Please note that the Group had taken over management of these activities on November 1, 2014. Australia: Longwarry On January 30, 2015, having received the approval of FIRB (Foreign Investment Review Board), the Group closed the acquisition of Longwarry Food Park Pty Ltd upon payment of a purchase price of 70 million Australian dollars. This acquisition was funded entirely with internal resources. With this transaction, the Group further strengthened its position in the Australian market expanding its local production capacity, entered the powdered milk market and consolidated its supply base. In addition, it bolstered the export potential of Parmalat Australia. Mexico: Acquisition of a Group of Companies On April 30, 2015, the Group virtually finalized the acquisition of a group of companies that operate mainly in Mexico, originally announced on January 28, 2015, against payment of a purchase price of 105 million U.S. dollars, a portion of which was deposited in an escrow account. With this transaction, the Parmalat Group acquired businesses engaged in the production and distribution of cheese that occupy leadership positions in the Mexican market in the categories in which they operate. Brazil: BRF On April 22, 2015, the Brazilian antitrust authority (CADE) approved this transaction, which is expected to close by the month of June, after BRF conveys the assets related to its dairy business to the Newco subject of the acquisition. As of March 31, 2015, this transaction entailed a financial commitment of about 650 million euros for the Parmalat Group.
24 Interim Report on Operations at March 31, 2015

Economic Effect of the Acquisitions on the Consolidated Financial Statements at March 31, 2015 In order to allow a better understanding of the consolidated financial statements at March 31, 2015, the schedule that follows shows the income statement at March 31, 2015 of the Parmalat Group and of the acquired entities, i.e., Harvey Fresh (acquired in April 24 2014), the business operations of Latterie Friulane (acquired in January 2015), the production units of LBR (acquired in January 2015, after taking over their management in November 2014) and Longwarry (acquired at the end of January 2015): (in millions of euros) Parmalat
Group cumulative at 3/31/15
Amount generated by Harvey Fresh
(January-March 2015)
Amount generated by the business
operations of Latterie Friulane
(January-March 2015)
Amount generated by
LBR’s production
units (January-
March 2015)
Amount generated by
Longwarry (February
2015)1
Revenue 1,365.6 31.3 5.5 26.5 2.6
Net revenue 1,357.8 31.2 5.5 26.5 2.5
Other revenue 7.8 0.1 0.0 0.0 0.1
OPERATING EXPENSES (1,282.0) (29.8) (5.6) (30.9) (2.8)
Raw material purchases, outside services and miscellaneous costs (1,091.7) (25.8) (4.2) (28.6) (2.7)
Personnel expense (190.3) (4.0) (1.4) (2.3) (0.1)
Subtotal 83.6 1.5 (0.1) (4.4) (0.2)
Impairment losses on receivables and other accruals (1.9) 0.0 0.0 0.0 0.0
EBITDA 81.7 1.5 (0.1) (5.4) (0.2)
Depreciation, amortization and impairment losses on non-current assets (34.7) (1.1) (0.3) (1.0) (0.2)
Miscellaneous income and expenses (0.2) 0.0 0.0 0.0 0.0
EBIT 46.8 0.4 (0.4) (5.4) (0.4)
Financial income/(expense), net (3.2) (0.5) 0.0 0.0 0.0
Other income from (expense for) equity investments (0.4) 0.0 0.0 0.0 0.0
Profit before taxes 43.2 (0.1) (0.4) (5.4) (0.4)
Income taxes (23.8) (0.1) 0.1 0.0 0.0
Profit for the period 19.4 (0.2) (0.3) (5.4) (0.4)
(Profit)/Loss attributable to non-controlling interests (0.4) - - - -
Profit/(Loss) attributable to owners of the parent 19.0 (0.2) (0.3) (5.4) (0.4) 1 The accounting data for Longwarry used in the preparation of this Interim Report on Operations at March 31, 2015 have February 28, 2015 as their closing date.
Interim Report on Operations at March 31, 2015 25

Human Resources
Group Staffing The table below provides a breakdown by geographic region of the Group’s staff at March 31, 2015 and a comparison with the data at December 31, 2014.
Total number of employees by geographic region
Geographic region March 31, 2015 December 31, 2014
Europe 3,355 3,262
North America 4,585 4,596
Latin America 4,849 3,799
Africa 2,690 2,665
Australia 2,160 2,150
Total 17,639 16,472
At March 31, 2015, the Group’s staff had increased by 1,167 employees compared with the end of the previous year. Most of this increase is attributable mainly to the Europe region, with the acquisitions of Latterie Friulane (Italy, 144 employees), the Latin America region, with the acquisitions of LBR (Brazil, 1,031 employees) and the Australia region, with the acquisitions of Longwarry Food Park (48 employees). With data based on a comparable scope of consolidation, the Group’s staff contracted slightly, decreasing by 56 employees.
26 Interim Report on Operations at March 31, 2015

Capital Investments Overview of the capital investments of the Parmalat Group at March 31, 2015
(in millions of euros) First quarter 2015 First quarter 2014 % change Geographic region Amount % of the total Amount % of the total
Europe 4.6 19.0% 3.5 15.0% 30.6%
North America 10.1 42.2% 9.4 40.3% 7.6%
Latin America 1.1 4.7% 3.4 14.6% -66.7% Africa 3.5 14.7% 3.7 15.9% -4.9%
Australia 4.7 19.4% 3.3 14.2% 40.9%
Total for the Group 24.0 100.0% 23.3 100.0% 2.9%
Total for the Group (at constant scope of consolidation and exchange rates)1 22.4 23.3 -3.9%
1 Excluding Harvey Fresh In the first three months of 2015, the Group’s capital investments totaled 24.0 million euros, for an increase of 2.9% compared with the previous year. With data at comparable scope of consolidation and constant exchange rates, capital investments show a decrease of 3.9% compared with the previous year. Investments focused on a number of programs aimed at the improvement of production processes, efficiency enhancement, quality issues, occupational safety and compliance with new regulatory requirements. The main investment projects included the following
• installation of a new cogeneration facility in Collecchio and a new bottle blower at Zevio (Italy); • optimization of cheesed production equipment in Bonnievale (South Africa); • expansion and optimization of mozzarella production facilities in Victoriaville (Canada); • optimization of the process for the production in Shred cheese at the plant in Nampa (USA).
Capital investments do not include the cost of licensing and implementing information systems, which amounted to 0.9 million euros in 2015, mainly for projects in Italy and Canada.
Interim Report on Operations at March 31, 2015 27

Review of Operating and Financial Performance Parmalat Group
Net revenue increased to 1,357.8 million euros, up 165.1 million euros (+13.8%) compared with 1,192.8 million euros in the first three months of 2014. With data at constant exchange rates and scope of consolidation and excluding the effects of hyperinflation in Venezuela, net revenue show a gain of 87.4 million euros (+7.3%). Price list increases and sales of more profitable products account for most of this improvement.
EBITDA totaled 81.7 million euros, or 5.2 million euros more (+6.9%) than the 76.4 million euros earned in the first three months of 2014. With data at constant exchange rates and scope of consolidation and excluding the effects of hyperinflation in Venezuela, the EBITDA increase amounts to 17.3 million euros (+21.5%). This gain reflects the combined effect of price list increase, a better sales mix and a reduction in the cost of raw milk, particularly in Europe and North America.
EBIT amounted to 46.8 million euros, in line with the 46.9 million euros reported at March 31, 2014. Data at constant exchange rates and scope of consolidation show EBIT increasing by 3.7 million euros. Improved results by the industrial operations account for most this increase Depreciation and amortization expense and impairment losses on non-current assets increased to 34.7 million euros (29.2 million euros in the first three months of 2014), due mainly to the consolidation of the newly acquired activities.
The profit attributable to owners of the parent totaled 19.0 million euros, down 28.7 million euros compared with 47.7 million euros in the first three months of 2014. With data at constant exchange rates and scope of consolidation, this item shows a decrease of 26.2 million euros. Lower net financial income, resulting from a higher hyperinflation charge and a reduction of yields on invested liquidity, coupled with higher taxes for the period, due mainly to an improved industrial result in Venezuela and non-recurring income statement components, such as deferred taxes and taxes on bankruptcy distributions, are the main reasons for this decrease.
Operating working capital amounted to 545.9 million euros, for an increase of 167.2 million euros compared with 378.7 million euros at December 31, 2014. This gains is chiefly the result of: the higher inventory of finished goods held by the Canadian subsidiary, due to seasonal factors that characterize its business, involving an increase in cheese production earlier in the year, in anticipation of higher sales in the later months; larger inventories of powdered milk and fruit concentrates held by the Venezuelan subsidiary to meet an increase in demand; positive currency translation differences due to the appreciation of the euro versus the currencies of the main countries where the Group operates.
Net invested capital totaled 2,490.7 million euros, up 367.7 million euros compared with 2,123.0 million euros at December 31, 2014. This gain primarily reflect the combined effect of the increase in operating working capital, the acquisitions of some production units of Lácteos Brasil S.A., of Longwarry Food Park Pty Ltd in Australia and of the business operations of Consorzio Cooperativo Latterie Friulane S.C.A., as well as the positive currency translation differences due to the appreciation of the euro versus the currencies of the main countries where the Group operates.
The net financial position decreased to 929.0 million euros, down 190.1 million euros, compared with 1,119.1 million euros at December 31, 2014. The main reasons for this decrease include: the cash absorbed by operating activities, for 100.0 million euros, and by non-recurring transactions, for 129.3 million euros, mainly concerning the acquisitions of some production units of Lácteos Brasil S.A., of Longwarry Food Park Pty Ltd in Australia and of the business operations of Consorzio Cooperativo Latterie Friulane S.C.A. This decrease was offset in part by the cash generated by financing activities, amounting to 21.5 million euros and a positive foreign exchange effect of 17.8 million euros.
The equity attributable to owners of the parent increased to 3,396.6 million euros, or 176.8 million euros more than the 3,219.8 million euros reported at December 31, 2014, due mainly to the effect of translating into euros the financial statements of companies operating outside the Eurozone, for 104.9 million euros, the change in fair value of derivatives executed by the Group to hedge the foreign exchange risk exposure resulting from the signing of a binding agreement to buy the dairy division of BRF S.A, for 53.2 million euros, and the profit for the period attributable to owners of the parent, for 19.0 million euros.
28 Interim Report on Operations at March 31, 2015

Parmalat Group
RECLASSIFIED CONSOLIDATED INCOME STATEMENT (in millions of euros) First quarter 2015 First quarter 2014
REVENUE 1,365.6 1,201.0 Net sales revenue 1,357.8 1,192.8 Other revenue 7.8 8.2 OPERATING EXPENSES (1,282.0) (1,121.9) Purchases, services and miscellaneous costs (1,091.7) (956.9) Personnel expense (190.3) (165.0) Subtotal 83.6 79.1 Impairment losses on receivables and other provisions (1.9) (2.7) EBITDA 81.7 76.4 Depreciation, amortization and impairment losses on non-current assets (34.7) (29.2) Other income and expense: - Litigation-related legal expenses (0.5) (0.9) - Miscellaneous income and expenses 0.3 0.6 EBIT 46.8 46.9 Net financial income/(expense) (3.2) 13.7 Other income from (Charges for) equity investments (0.4) 0.0 PROFIT BEFORE TAXES 43.2 60.6 Income taxes (23.8) (12.2) PROFIT FOR THE PERIOD 19.4 48.4 Attributable to: Non-controlling interests (0.4) (0.7) Owners of the parent 19.0 47.7 Continuing operations: Basic earnings per share 0.0104 0.0261
Diluted earnings per share 0.0103 0.0259
Interim Report on Operations at March 31, 2015 29

Parmalat Group
RECLASSIFIED CONSOLIDATED STATEMENT OF FINANCIAL POSITION (in millions of euros) 3/31/15 12/31/14
NON-CURRENT ASSETS 2,467.9 2,234.0
Intangible assets 1,199.6 1,104.7
Property, plant and equipment 1,135.2 996.5
Non-current financial assets 60.2 59.9
Deferred tax assets 72.9 72.9
ASSETS HELD FOR SALE, NET OF CORRESPONDING LIABILITIES 13.1 12.5
NET WORKING CAPITAL 500.6 336.3
Inventories 636.1 534.2
Trade receivables 524.1 487.0
Trade payables (-) (614.3) (642.5)
Operating working capital 545.9 378.7
Other assets 170.9 135.6
Other liabilities (-) (216.2) (178.0)
INVESTED CAPITAL NET OF OPERATING LIABILITIES 2,981.6 2,582.8
EMPLOYEE BENEFITS (-) (118.3) (110.4)
PROVISIONS FOR RISKS AND CHARGES (-) (362.1) (338.9)
PROVISION FOR LIABILITIES FOR CONTESTED PREFERENTIAL AND PREDEDUCTION CLAIMS (10.5) (10.5)
NET INVESTED CAPITAL 2,490.7 2,123.0
Covered by:
EQUITY 3,419.7 3,242.1
Share capital 1,833.1 1,831.1
Reserve for creditor challenges and claims of late-filing creditors convertible into share capital 52.9 53.2
Other reserves and retained earnings 1,491.6 1,132.4
Profit for the period 19.0 203.1
Non-controlling interests 23.1 22.3
NET FINANCIAL POSITION (929.0) (1,119.1)
Loans payable to banks and other lenders 175.5 132.4
Loan liabilities with investee companies 0.2 0.2
Other financial assets (-) (93.3) (94.4)
Cash and cash equivalents(-) (1,011.4) (1,157.3)
TOTAL COVERAGE SOURCES 2,490.7 2,123.0
30 Interim Report on Operations at March 31, 2015

Parmalat S.p.A. On December 30, 2014, Parmalat S.p.A. acquired from Consorzio Cooperativo Latterie Friulane, effective as of January 1, 2015, some business operations engaged in the production, marketing and distribution of milk and dairy products (pasteurized and UHT milk, yogurt, Montasio cheese, mozzarella and ricotta, together with the corresponding trademarks, facilities and staff). The income statement for the first quarter of 2015 reflects effects of this acquisition. Net revenue totaled 211.7 million euros, for an improvement of 1.0% compared with 209.6 million euros in the first three months of 2014. The revenue generated by the “Latterie Friulane” business operations amounted to 5.5 million euros. Sales volumes increased, despite the persisting crisis in some of the main markets in which Company operates (particularly those for fruit juices and pasteurized milk, with the latter contracting by more than 5%) and the growing pressure of sales promotions in the UHT milk segment, negative factors that are also responsible for the revenue decline shown with data at constant scope of consolidation (-1.6%). Positive results were achieved with the Chef UHT cream and béchamel, with sales gains driven by advertising programs that produced an increase in market share. EBITDA amounted to 16.4 million euros, compared with 12.5 million euros in the same period last year. The gain of 3.9 million euros (-0.1 million euros for the “Latterie Friulane” business operations) is chiefly the result of a decrease in the cost of the main raw materials, namely milk and plastic. The optimization of operating expenses also had a positive impact. EBIT totaled 8.9 million euros (-0.4 million euros for the “Latterie Friulane” business operations), for an increase of 7.1 million euros compared with 1.8 million euros at March 31, 2014. This result reflects primarily the improvement in EBITDA and higher net non-recurring income than in the previous year. The profit for the period increased to 15.2 million euros (-0.3 million euros for the “Latterie Friulane” business operations), or 11.0 million euros more than the 4.2 million euros reported at March 31, 2014. The gain in EBIT and an increase in dividends and proceeds received from investee companies (7.5 million euros, compared with 0.6 million euros in the first three months of 2014), which helped lower the tax rate, are the main reasons for this improvement. Net invested capital amounted to 2,236.1 million euros, little changed from 2,237.9 million euros at December 31, 2014. The net financial position increased from 758.8 million euros at December 31, 201 to 777.2 million euros at March 31, 2015, for a gain of 18.4 million euros. This positive change for the period is the net result of the following items: the collection of dividends, a reduction of net working capital and the proceeds from the exercise of warrants (1.6 million euros), in addition to the assumption of 4.7 million euros in financial debt of Latterie Friulane (subsequently repaid in full). Cash and cash equivalents are invested in short-term instruments with Italian credit institutions. The Company's equity increased to 3,013.3 million euros, compared with 2,996.7 million euros at December 31, 2014. This increase of 16.6 million euros is the result of the profit for the period and exercise of warrants during the quarter.
Interim Report on Operations at March 31, 2015 31
Parmalat S.p.A.
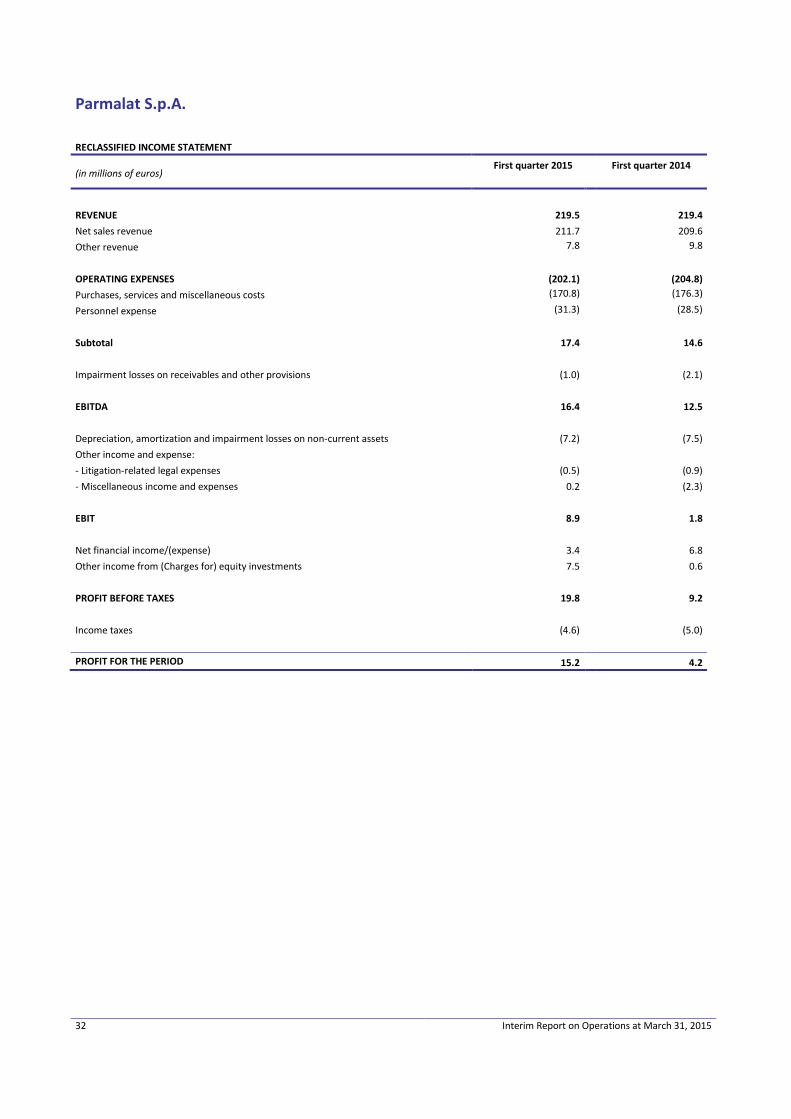
RECLASSIFIED INCOME STATEMENT
(in millions of euros) First quarter 2015 First quarter 2014
REVENUE 219.5 219.4 Net sales revenue 211.7 209.6 Other revenue 7.8 9.8
OPERATING EXPENSES (202.1) (204.8) Purchases, services and miscellaneous costs (170.8) (176.3)
Personnel expense (31.3) (28.5)
Subtotal 17.4 14.6 Impairment losses on receivables and other provisions (1.0) (2.1) EBITDA 16.4 12.5 Depreciation, amortization and impairment losses on non-current assets (7.2) (7.5) Other income and expense: - Litigation-related legal expenses (0.5) (0.9) - Miscellaneous income and expenses 0.2 (2.3) EBIT 8.9 1.8 Net financial income/(expense) 3.4 6.8 Other income from (Charges for) equity investments 7.5 0.6 PROFIT BEFORE TAXES 19.8 9.2 Income taxes (4.6) (5.0) PROFIT FOR THE PERIOD 15.2 4.2
32 Interim Report on Operations at March 31, 2015
Parmalat S.p.A.
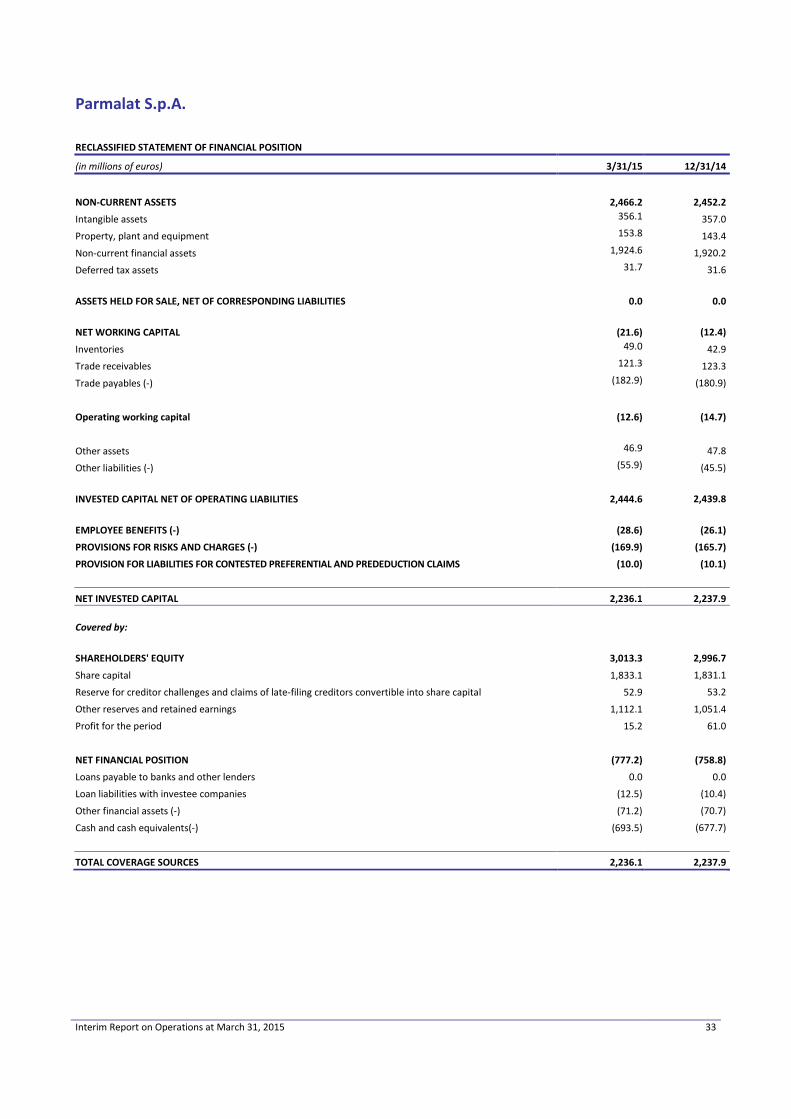
RECLASSIFIED STATEMENT OF FINANCIAL POSITION
(in millions of euros) 3/31/15 12/31/14
NON-CURRENT ASSETS 2,466.2 2,452.2
Intangible assets 356.1 357.0
Property, plant and equipment 153.8 143.4
Non-current financial assets 1,924.6 1,920.2
Deferred tax assets 31.7 31.6
ASSETS HELD FOR SALE, NET OF CORRESPONDING LIABILITIES 0.0 0.0
NET WORKING CAPITAL (21.6) (12.4)
Inventories 49.0 42.9
Trade receivables 121.3 123.3
Trade payables (-) (182.9) (180.9)
Operating working capital (12.6) (14.7)
Other assets 46.9 47.8
Other liabilities (-) (55.9) (45.5)
INVESTED CAPITAL NET OF OPERATING LIABILITIES 2,444.6 2,439.8
EMPLOYEE BENEFITS (-) (28.6) (26.1)
PROVISIONS FOR RISKS AND CHARGES (-) (169.9) (165.7)
PROVISION FOR LIABILITIES FOR CONTESTED PREFERENTIAL AND PREDEDUCTION CLAIMS (10.0) (10.1)
NET INVESTED CAPITAL 2,236.1 2,237.9 Covered by:
SHAREHOLDERS' EQUITY 3,013.3 2,996.7
Share capital 1,833.1 1,831.1
Reserve for creditor challenges and claims of late-filing creditors convertible into share capital 52.9 53.2
Other reserves and retained earnings 1,112.1 1,051.4
Profit for the period 15.2 61.0
NET FINANCIAL POSITION (777.2) (758.8)
Loans payable to banks and other lenders 0.0 0.0
Loan liabilities with investee companies (12.5) (10.4)
Other financial assets (-) (71.2) (70.7)
Cash and cash equivalents(-) (693.5) (677.7)
TOTAL COVERAGE SOURCES 2,236.1 2,237.9
Interim Report on Operations at March 31, 2015 33

Key Events in the First Quarter of 2015 Transfer of LBR’s Assets and Payment of the Corresponding Price On January 8, 2015, the conditions precedent set forth in the contractual stipulations having been fulfilled, title to the assets subject of the acquisition was transferred to Lactalis do Brazil against payment of a price of 250 million reals. On the same date, the licensing agreement for the Parmalat trademark existing with LBR was cancelled. Agreement with the Labor Unions for the Acquisition of the Business Operations of the Former Consorzio Cooperativo Latterie Friulane S.C.A. On January 15, 2015, following its acquisition of the business operations of the former Consorzio Cooperativo Latterie Friulane S.C.A., Parmalat and the labor unions, meeting at the office of the Ministry of Labor, signed an agreement to implement the Reorganization Plan originally submitted to Consorzio Latterie Friulane, specifically concerning the modalities, timing and criteria for accessing the Special Supplemental Income Fund and the Long-term Unemployment Benefits Fund. On January 27, 2015, Parmalat and the labor Unions, meeting at the offices of the Udine Manufacturers’ Association, signed an agreement providing long-term unemployment benefits to 89 employees within the framework of the Reorganization Plan of the former Latterie Friulane. The agreement provides, first of all, for the separation of employees who are living voluntarily and of those who already qualify for retirement or will do so while they receive long-term unemployment benefits and provides to employees who are receiving those benefits economic support in terms of voluntary separation incentives. The Company also agreed to consider the possibility rehiring redundant employees at other Group facilities and the option of offering vertical part-time employment. Longwarry Closing On January 30, 2015, further to the approval by the Foreign Investment Review Board (FIRB), the acquisition of Longwarry Food Park Pty Ltd was completed with payment of a price of 70 million Australian dollars. This acquisition was funded exclusively with internal resources. Extraordinary Shareholders’ Meeting An Extraordinary Shareholders’ Meeting was held on February 27, 2015. On that occasion it adopted resolutions to (i) extend the subscription deadline for the share capital increase reserved for challenging and late-filing creditors, which is the subject of Article 5, Letter b) of the Company Bylaws; (ii) to delegate to the Board of Directors the necessary power to implement this resolution; and (iii) empower the Board of Directors to regulate the allocation of warrants subsequent to January 1, 2016, all of the above action being taken to comply with the requirements of the Parmalat Composition with Creditors regarding the allotment of shares and warrants. Citibank Proceedings In the criminal proceedings for fraudulent bankruptcy pending before the Court of Parma against officers and employees of Citigroup, which Parmalat S.p.A. in A.S. joined as a plaintiffs seeking damages, with certain companies of the Citibank Group standing as parties civilly liable for the actions of their employees, at a hearing held on March 5, 2015, the Court, further to a motion for plea bargaining filed by all defendants, handed down its decision accepting the agreement proposed by the parties. Under the plea bargaining arrangement, the Judge cannot address the compensation claims put forth by the plaintiffs seeking damages and, consequently, the Court’s decision does not set forth any ruling regarding damage compensation. The Company will pursue its damage compensation claims in civil court.
34 Interim Report on Operations at March 31, 2015
Events Occurring After March 31, 2015 Ordinary Shareholders’ Meeting An Ordinary Shareholders’ Meeting of Parmalat S.p.A., convened on a single calling, was held on April 16, 2015. The Shareholders’ Meeting approved the financial statements for the 2014 financial year, which ended with a profit of 61.0 million euros (at the consolidated level, the profit attributable to the owners of the parent was 203.1 million euros) and agreed to distribute a dividend of 0.016 euros on each eligible common share. The dividend will payable as of May 20, 2015, with May 18, 2015 as the coupon presentation date (to the shares registered in the books of accounts on May 19, 2015 – record date). The Shareholders’ Meeting approved a resolution to increase the number of Directors from 7 to 8 and elect a new Director, in the person of Yvon Guérin, currently the Company’s General Manager, as recommended by the Board of Directors in its Explanatory Report to the Shareholders’ Meeting. The purpose of this election is to enable the Board of Directors to appoint Mr. Guérin to the post of Chief Executive Officer, with the corresponding powers. Mr. Guérin’s term of office will end concurrently with the expiration of the mandate of the Board of Directors, i.e., with the Shareholders’ Meeting convened to approve the financial statements at December 31, 2016. Information about Mr. Guérin’s personal and professional background is available on the Company website: http://www.parmalat.com/it/il_gruppo/management/. The Board of Directors appoints a Chief Executive Officer On April 16, 2014, the Board of Directors appointed Yvon Guérin, who already served as General Manager and was a member of the Board of Directors as of the date of the meeting, to the additional post of Chief Executive Officer of the Company, providing him with the powers necessary to exercise the functions of his office. Based on statements submitted by Mr. Guérin, he does not own any Company shares. Lastly, the Board of Directors approved the Procedure governing influenced decisions within the framework of guidance and coordination activities and, consistent with the recommendations of the relevant Committee, updated the materiality thresholds for excluding from the ordinary course of business related-party transactions, as set forth in Article 8, Letter c) of the Procedure governing related-party transactions. Signing of a Loan Agreement with a Pool of Banks On April 28, 2015, Parmalat S.p.A. signed a loan agreement for a 500-million-euro medium/long-term facility with a pool of banks that includes UniCredit S.p.A., Banca Nazionale del Lavoro S.p.A., Cariparma Crédit Agricole and Crédit Agricole Corporate and Investment Bank Milan branch in the capacity as Mandated Lead Arrangers. The UniCredit Group was named Agent Bank of the pool. This credit line, which will be disbursed in response to one or multiple drawdown requests to be submitted within nine months from today’s date, is unsecured. The interest rate is indexed to the Euribor plus a spread in line the best market conditions currently available. The credit line will expire in April 2020. This credit line, combined with the available internal resources, provides the Group with the financial support necessary to continue on its growth track. Acquisition of a Group of Companies Operating in Mexico On April 30, 2015, the Group virtually finalized the acquisition of a group of companies that operate mainly in Mexico, originally announced on January 28, 2015, against payment of a purchase price of 105 million U.S. dollars, a portion of which was deposited in an escrow account.
Interim Report on Operations at March 31, 2015 35

Principles for the Preparation of the Interim Report on Operations at March 31, 2015 The Interim Report on Operations at March 31, 2015 was prepared in accordance with the provisions of Article 154-ter “Financial Reporting” of the Uniform Financial Code, as set forth in Legislative Decree No. 195 of November 6, 2007, by which the Italian Legislature implemented Directive 2004/109/CE (so-called Transparency Directive) on periodic financial reporting. The Interim Report on Operations at March 31, 2015 was prepared in accordance with the same consolidation principles valuation criteria as those applied to prepare the Annual Report at December 31, 2014, which is cited here by reference, and the new IFRS pronouncements in effect as of January 1, 2015 listed below. The following recently published accounting principles, amendments and interpretations went into effect on January 1, 2015, as adopted by the European Commission: Amendments to IAS 19 – Defined Benefit Plans: Employee Contributions (applicable to accounting periods beginning on or after July 1, 2014). These amendments simplify the accounting treatment of contributions to defined-benefit plans by employees or third parties in specific cases. These amendments are effective retroactively for annual periods beginning on or after July 1, 2014. As of the date of this Interim Report on Operations, the adoption of these amendments had no impact on the Group. Amendments to IFRSs – Annual Improvements to IFRSs 2010-2012 Cycle and IFRSs 2011-2013 Cycle (applicable to accounting periods beginning on or after July 1, 2014). The main issues addressed by these amendments include: the definition of vesting conditions in IFRS 2 – Share Based Payments, the disclosure about the estimates and judgment decisions used to aggregate operating segments in IFRS 8 – Operating Segments, the identification and disclosure of the related-party transaction that arises when a service company provides the service of managing executives with strategic responsibilities to the company that prepares the financial statements in IAS 24 – Related-Party Disclosures, the exclusion from the implementation of IFRS 3 – Business Combinations of all types of joint arrangements, and some clarifications regarding exceptions to the adoption of IFRS 13 – Fair Value Measurement. As of the date of this Interim Report on Operations, the adoption of these amendments had no impact on the Group. As part of the process of preparing the Interim Report on Operations, Directors are required to adopt accounting principles and methods that, in some instances, entail the use of complex and subjective valuations and estimates based on historical data and assumptions that, in each case, are deemed to be reasonable and realistic under the circumstances existing at that time. The adoption of these estimates and assumptions has an impact on the amounts reported in the financial statements and affects the disclosures provided therein. The amounts actually realized for the financial statement items for which the abovementioned estimates and assumptions are used may differ from the amounts shown in the financial statements, due to the uncertainty that is inherent in all assumptions and the conditions upon which the estimates were based. Estimates and assumptions are reviewed periodically and any resulting change is recognized in the accounting records for the period in which the estimates are revised, if the revision affects only the current period, or for subsequent periods if the revisions affects both the current period and future periods. The financial statement items that require more than others subjective input by the Directors in the development of estimates and with regard to which a change in the conditions underlying the assumptions could have a material impact on the Interim Report on Operations are: goodwill, trademarks with an indefinite useful life, depreciation and amortization, current and deferred taxes, the allowance for doubtful accounts, the provisions for risks and charges (particularly with regard to outstanding disputes), employee benefit provisions and the reserves for creditor challenges and claims of late-filing creditors and business combinations. For information about the main assumptions adopted and the sources used to develop estimates, see the disclosure provided in the consolidated financial statements at December 31, 2014.
A complete determination as to whether the value of non-current assets has been impaired is carried out only in connection with the preparation of the annual financial statements, when all necessary information is available,
36 Interim Report on Operations at March 31, 2015

except in cases when impairment indicators that require an immediate assessment of any impairment losses are detected.
The income tax liability is recognized based on the best estimate of the average tax rate for the entire year.
Sales of some of the Group’s products are more seasonal than those of the rest of the product line, due to different buying habits and consumption patterns. However, the geographic diversification of the Group’s sales significantly reduces this seasonal impact.
The Interim Report on Operations at March 31, 2015 was not audited.
The Board of Directors authorized the publication of this Interim Report on Operations on May 13, 2015.
Scope of Consolidation The main changes to the scope of consolidation that occurred in the first quarter of 2015 compared with December 31, 2014 are the result of the following acquisitions: - Acquisition of business operations engaged in the production, marketing and distribution of dairy products from Consorzio Cooperativo Latterie Friulane S.C.A. These business operation were consolidated as of January 1, 2015, which is the date when the Group effectively obtained control of them. - Acquisition of some production units, including trademarks, staff and administrative offices, of Lácteos Brasil S.A. – Em Recuperação Judicial, a Brazilian company in composition with creditors proceedings pursuant to Brazilian law. In order to assist in the resumption of business activities, the Group took over management of these production units from November 1, 2014 until January 8, 2015, which is the date when the acquisition closed, upon completion of certain procedures subject of contractually stipulated conditions precedent. - Acquisition form a third party of Longwarry Food Park Pty Ltd (“Longwarry”), an Australian company based in the State of Victoria specialized in the production of milk (powdered, fresh and UHT) and spreadable cheese. This company was consolidated as of January 30, 2015, which is the date when the Group effectively obtained control of this company. With regard to these acquisitions, the Group will proceed with the determination of the fair value of the acquired assets and the assumed liabilities and contingent liabilities within the deadline required by IFRS 3. The difference between the price paid and the fair value of the net acquired assets was recognized on a preliminary basis as goodwill. Venezuela
The income statement and statement of financial position data of the Venezuelan subsidiaries, when stated in the local currency, are affected by a rate of inflation that, over the past three years, exceeded the cumulative threshold of 100%, which triggered the adoption of the adjustments required by IAS 29 – Financial Reporting in Hyperinflationary Economies. According to this principle, the financial statements of an entity that reports in the currency of a hyperinflationary economy should be stated in terms of the measuring unit current on the date of the financial statements. All statement of financial position amounts that are not stated in terms of the measuring unit current on the date of the financial statements must be restated by applying a general price index. All income statement components must be stated in terms of the measuring unit current on the date of the financial statements, applying the change in the general price index that occurred since the date when revenue and expense were originally recognized in the financial statements. The restatement of the financial statement amounts was carried out using
Interim Report on Operations at March 31, 2015 37

Venezuela’s consumer price index (INPC). As of the reference date of this Interim Report on Operations, the index was 1,022.2 (548.3 in March 2014) and the year-over-year change in the index was 86.4%. On February 10, 2015, the Venezuelan authorities announced the following changes to the foreign exchange system: - the official exchange rate of 6.30 VEF/USD is maintained and will continue to be available for basic necessities, including dairy products; - the two existing SICAD and SICAD II auction systems were combined into a single SICAD system still based on auctions held by the central bank. As of the date of this Interim Report on Operations, a new SICAD auction had not yet been held and, consequently, the benchmark exchange rate was 12.00 VEF/USD, which is the rate set at the last published auction, i.e., Auction No. 26 held at the end of September 2014. - the Sistema Marginal de Divisas (also called SIMADI) is being introduced, in which individuals and companies can exchange foreign currency through about 3,800 locations that act as intermediaries between buyers and seller of foreign currency. SIMADI became operational on February 12, 2015, with an exchange rate of 170 VEF/USD. At March 31, 2015, this exchange rate was 193 VEF/USD. As of the date of this Interim Report on Operations, 99.0% of the foreign currency transactions were being executed through the two “managed systems,” with the remaining 1% executed through SIMADI Based on the available supporting documents, it was deemed appropriate to translate the statement of financial position and income statement balances of the Venezuelan subsidiaries at the SICAD rate, which was thought to be representative of operating conditions during the reporting period. At March 31, 2015, this rate was the exchange rate applicable to future dividend payments and repatriation of capital. A change in the exchange rate from the SICAD (12.00 VEF/USD) to SIMADI (193 VEF/USD) would have caused, at March 31, the contribution of the Venezuelan subsidiaries to the consolidated shareholders’ equity at March 31, 2015 to decrease by 182 million euros, while the negative impact on net revenue and EBITDA would have amounted to 131 million euros and 7.5 million euros, respectively. It is possible that significant changes in exchange rates and in the exchange rate system, and other related developments affecting Venezuela, could have an additional impact on the future activities of the subsidiaries, with an impact also on Parmalat’s consolidated financial statements.
38 Interim Report on Operations at March 31, 2015

Business Outlook
In the first quarter of 2015, the global economic scenario provided confirmation of moderate growth, driven by the advance economies led by the United States.
There continues to be a margin of uncertainty regarding the cost of raw materials and the ability to hold sales price unchanged, given the presence of significant market pressure. These situations of instability and the performance of the economy in some areas where the Group operates concentrate growth expectations in the second half of the year.
Among the recently acquired businesses, LBR and Longwarry are being affected by some challenging situations that developed in the respective target markets.
In this context the Group confirms its growth targets for revenues and EBITDA.
2015 Guidance
For 2015, at constant exchange rates and scope of consolidation and excluding the effect of hyperinflation, Parmalat expects net revenue and EBITDA to grow at a rate of about 3-5%.
A further gain of about 8-10% in revenues and about 3-5% in EBITDA is also expected, thanks to the acquisitions completed in the first quarter of 2015 (namely, Latterie Friulane in Italy, Longwarry in Australia and LBR in Brazil), the acquisition carried out in April (Esmeralda in Mexico) and the one planned for later in the year (BRF - dairy division in Brazil).
Disclaimer This document contains forward looking statements, particularly in the section entitled “Business Outlook.” Projections for 2015 are based, inter alia, on the Group’s performance in the first quarter of 2015 and subsequent trends. The Group’s performance is affected by exogenous variables that could have unforeseen consequences in terms of its results: these variables, which reflect the peculiarities of the different countries where the Group operates, are related to weather conditions and to economic, socio-political and regulatory factors.
Interim Report on Operations at March 31, 2015 39

Certification Pursuant to Article 154 bis, Section 2, of Legislative Decree No. 58/98, as Amended As required by Article 154 bis, Section 2, of the Uniform Financial Code (Legislative Decree No. 58/1998), the Corporate Accounting Documents Officer, Pierluigi Bonavita, hereby declares that the accounting disclosures provided in this Report are consistent with the data in the supporting documents and in the Company’s books of accounts and other accounting records. Signed: Pierluigi Bonavita Corporate Accounting Documents Officer
40 Interim Report on Operations at March 31, 2015

Parmalat S.p.A.
A company subject to guidance and coordination by B.S.A. S.A. Via delle Nazioni Unite 4
43044 Collecchio (Parma) - Italy Tel. +39.0521.808.1 www.parmalat.com
Share capital: 1,833,062,336 euros fully paid-in R.E.A. Parma No. 228069
Parma Company Register No. 04030970968 Tax I.D. and VAT No. 04030970968
