interim report stockholm, may 27, 2016 group results ... · 1 interim report stockholm, may 27,...
TRANSCRIPT

1
Interim Report Stockholm, May 27, 2016
Group Results: First Quarter 2016
Results for the first quarter of 2016 continue to show strong underlying growth, whilst growing capacity and capability in new markets. Revenues for Q1 2016 grew € 701k (up 21%) to € 3 981k on Q1 2015 (€ 3 280k*). Whilst EBITDA was lower by € 347k against the same period, this was mainly due to additional costs to grow capacity. Financial highlights for the group during Q1 2016 included:
Revenues amounted to € 3.981 m (Q1 2015 €3.28m*)
EBITDA result of € 345k (Q1 2015 € 691k *)
Operating profit amounted to € 295k (Q1 2015 678k*).
Net profit of € 192k, minority interest € 85k (Q1 2015 €681k*, minority interest € 159k*)
Earnings per share amounted to € 0.0004 (Q1 2015 € 0.0021)
The Group remained debt free
Growing order book
*Financial information presented for Q1 2015 is provided to aid comparison of financial information for Q1 2016 ,
however Q1 2015 has not previously been reported in a separate interim report. During 2015 three separate financial
reports were published; First half year to June 30, Q3 to 30 September and Q4 to 31 December. Financial information
for the first quarter of 2015 presented as comparative financial information in this report should not be relied upon in
the same way that comparative financial information that has previously been reported in a separate interim report.
This interim report is a translation of the original interim report which was submitted in Swedish. In any and all legal
considerations, the interim report in Swedish serves as Cognosec AB (Publ) official report.
FOR ADDITIONAL INFORMATION, PLEASE CONTACT: Magnus Stuart IR Contact, Cognosec AB Telephone: +46 706 211 350 E-post: [email protected] ABOUT COGNOSEC Cognosec AB (Publ) is engaged in cyber security and conducts its operations in Sweden, South Africa, UK, Kenya, Germany, Austria and the United Arab Emirates. The Group delivers services and technology licenses in order to enhance their clients' protection against unwanted intrusion and to prevent various forms of information theft. The parent company is domiciled in Stockholm, Sweden. Cognosec had revenues of € 16.79 m in 2015. For more information, please visit www.cognosec.se.
Jan-Mar Apr-Jun Jul-Sep Oct-Dec Jan-Mar
Q1 2015 Q2 2015 Q3 2015 Q4 2015 Q1 2016
Total Group Income €('000s) 3 280,1 3 090,2 5 882,9 4 573,1 3 981,4
Cash Flow in the Period €('000s) 512,4 420,5 -887,1 2 459,5 -1 161,9
Operating Margin €('000s) 678,4 14,0 1 000,1 730,5 294,9
Operating Margin (percent) 20,7% 0,5% 17,0% 16,0% 7,4%
Profit after Taxes €('000s) 681,2 12,5 1 016,0 674,3 191,8
Profit per share € 0,0021 0,0000 0,0041 0,0027 0,0004
COGNOSEC GROUP: Financial key-ratios

2
Comments by Kobus Paulsen, Chairman of Cognosec AB Group Dear Shareholders, I am extremely pleased to present the first Interim Quarterly report for 2016. Our continued top-line Revenue growth, up 21% quarter on quarter 2015, has shown that we are building a sizable and sustainable business across our markets. But growing this profitably and maintaining our core values: multi-product, multi-jurisdictional specialized advisory and implementation cybersecurity services. I am also delighted to welcome Rob Brown, CEO of the Group to the Board. Rob takes over the role from Patrick Boylan, who moves to a non-executive director role. We thank Patrick for his efforts, and trust in Rob to take the group to its next phase of development. As part of that transition, the CEO will be presenting his Comments at the forefront of future interim reports, and progress of the group, in the usual way. Our recently filed Annual Accounts shows tremendous progress in a very short period of time, and there is little to suggest that this will not continue apace. That growth has meant that we have had to invest heavily in our operations, our technical resources, and our sales and marketing drive. In the short-term, that has meant a lower EBITDA percentage in the quarterly results. However, the challenge is simple- without this investment we are less capable of growing headline revenue, and ultimately scaling quickly. I have no doubt that these trends will even out over the medium to long term, and allow us to be much more flexible and responsive to larger and more international customers. This has already paid off with our sales pipeline for the rest of the year developing well. There are several very large contract orders pending in both
Managed Services and Penetration testing, as well as Intrusion Prevention Services (IPS). We expect to be in a position to disclose final contract signings in the near term. Credence Securities in UAE, we are now seeing strong growth from the region. Our markets remain extremely strong and growing. There is simply no question that technical security requirements are immense: the threats are growing, the world is connecting and embracing new and increasingly complex systems. We also continue to expand our key partner relationships. The latest addition to that is a relationship with Solus, an enterprise biometric security specialist and a number of others in final stages. Regarding our IPO, we are progressing to the final stages of preparation. Despite delays in the process, our business has never been stronger, and this can only reflect well going forward. Also, whilst growing our business organically, we have ambition to develop our products, services and geographic spread through M&A activity. Several are in train, and I expect to announce the first shortly. As we approach the first full year of our operations as a united Group, I am heartened by the quality, dedication and skill of our staff and would like to thank them all for their efforts in building this group. On behalf of the Board, we are confident of a bright future for the business and look forward to updating you on our progress through greater Press coverage, improved and increasing marketing and PR. London May 2016 J A (Kobus) Paulsen, Chairman of the Board

3
Comments by Robert Brown, CEO of Cognosec Group This is the first quarterly report I comment in my role as CEO. I would in this context like to thank my predecessor Patrick Boylan for his efforts as CEO. We have now taken further steps to becoming a truly global group, with operations in three continents, Africa, Asia and now Europe, and pipeline revenues growing commensurately. The first quarter saw an increase in sales by 21%. Less than we have been accustomed in 2015, but meanwhile, growing our capacity and order book very significantly, with large contracts potentially closing in Q2 2016. Taken together, this provides higher sustainable growth over the medium/long term. We are growing faster than the markets we address. In South Africa for example, sales and earnings in local currency doubled, however reporting in Euro has meant a notionally lower growth rate due to the fluctuations between the Euro and the Rand. Despite this there has been no effect on our buying power. The stabilization of the rand will come, and therefore should counter this effect over the longer term. Our offer is unique and competitive, and with the support of our vendors, I look at the year 2016 with great confidence. Finally, I would like to thank our employees, shareholders, customers and other partners and look forward to soon report on the second quarter results of 2016. BUSINESS OVERVIEW
MARKETS Cybersecurity is now not only a technological issue, but impacts all aspects of our social, economic and business worlds. Security breaches grow at alarming rates, and the impact on businesses and their customers can result in total business collapse. Every day, those threats grow in size and complexity, so moving from breach “clean-up” to proactive threat detection, implementation and monitoring is a major market development. Financial Institutions are being targeted on a daily basis along with large retail organizations that hold massive amounts of credit card information.
PROJECTS AND DELIVERIES Sales teams now operate directly in Sweden, UK, Austria, Germany, South Africa, UAE and Kenya: a sizable increase in our territorial reach on 2015, and allowing us to deliver similar services across all these regions leveraging the skills within the group. Integrated operational workflows across finance and HR management have been implemented to ensure efficient billing and reporting.

4
SUBSIDIARY SALES PERFORMANCE Allocation between the Group’s various subsidiaries are listed in the table below.
Of the Group's total revenue two-thirds originates from income from sale of technology licenses and one third of income from sale of advisory services. This distribution differs between various Group subsidiaries. Credence Security in South Africa and the United Arab Emirate has a higher proportion of revenue from sale of technology licenses.
CUSTOMERS Our Customers range from government departments, large-scale industrials to financial institutions as well as smaller SME sector businesses. Long-term exclusive relationships are the norm, and many wish that their names remain confidential especially when it comes to the technology that they are using, however they are willing to discuss with potential new clients about the service and success that we have achieved in their accounts.
TECHNOLOGY PARTNERS In conjunction with our existing key vendors, Digital Guardian, Fidelis, AccessData, eSentire, Everbridge, Intel Security, Netclean, Redseal & Agiliance, we are growing our pipeline and strengthening ties as well as endeavouring to shorten sales cycles through skills and knowledge of the technologies.
We continue to source and add new vendors. We are pleased to announce such a partnership with Solus, a specialist in enterprise biometric security and access control software. We expect to announce several others in later reports.
CONSOLIDATED ORDER BOOK Although we are not presenting any detailed information under this heading for the operations during the first fifteen months, we are growing both the size of the Order Book and the individual amounts per order.
COMPARATIVE FINANCIAL ANALYSIS
QUARTERLY AND HALF YEARLY SALES PERFORMANCE Comparison between the Q1 2016 and Q1 2015 financial results shows higher revenue but lower profits in Q1 2016 compared to Q1 2015. The increased revenue is due to higher underlying business volumes, yet this increase is less significant in € terms than the actual growth in sales volumes due to a significant unfavorable exchange rate variance of 23% or €1.14m compared to same quarter in 2015. The Group’s presentational currency is EURO, so this FX movement is largely notional, and will not affect true profitability in the underlying subsidiaries. (Figure on subsequent page)
€ '000s jan-mar Andel Oct-Dec Share Jul-Sep Share Apr-Jun Share Jan-Mar Share
Overview Sales Q1 2016 % Q4 2015 % Q3 2015 % Q2 2015 % Q1 2015 %
Dynamic Recovery Services (South Africa) 3 029 76% 2 617 57% 4 204 71% 2 023 67% 2 160 66%
Credence Securi ty (South Africa) 129 3% 155 3% 268 5% 532 17% 260 8%
Credence Securi ty (UAE) 609 15% 1 600 35% 1 093 19% 278 9% 754 23%
Profess ional Technologies (Kenya) 215 5% 201 4% 318 5% 207 7% 85 3%
Cognosec (UK) - 0% - 0% - 0% - 0% - 0%
Cognosec (Sweden) - 0% - 0% - 0% - 0% - 0%
Total 3 981 100% 4 573 100% 5 883 100% 3 041 100% 3 259 100%

5
-
1 000
2 000
3 000
4 000
5 000
6 000
7 000
Q1 Q2 Q3 Q4
Quarterly Group Revenue € ('000)
Quarterly revenue 2015 Quarterly revenue 2016
FOREIGN EXCHANGE RATE IMPACT
Changes in foreign exchange rates can significantly impact the group´s revenue and costs in its presentational currency, which is Euro. However, this is presentational and does not affect the underlying buying power each business unit. Actual group revenues Q1 2016 compared to group revenues 2016 at constant exchange rates (2015 Q1 average rates) are 23 % lower or € 1.14 m than if the Q1 2015 average rates had been in place during q1 2016. The most significant negative Foreign exchange effect is due to the reduction in the value of South African Rand against the Euro, from an average rate of 13.1 Rand/€ in Q1 2015 to 17.1 Rand/€ in q1 2016.
PROFITABILITY
The profitability in Q1 2016 compared to Q1 2015 is lower due to several factors;
European expansion which impacts profit with negative €95k
Unfavorable sales timing in Credence Dubai resulting in gross profits not covering fixed costs yielding a loss of €106k
While South African sales volumes was over 100% higher in local currency terms in Q1 2016 than Q1 2015, this was achieved at a lower gross margin, the impact on gross profit resulted in a local currency gross profit increase of only 41%.
CASHFLOW
Q1 operational cash flow after changes in working capital was negative €664k. The variance is due to changes in working capital from the sales and associated cost of sales between November 2015 and 31 March 2016. The nature of the Groups business involves some volatility in quarterly cash flow after changes in working capital. The main reason for this volatility is due to the large size of some sales orders, as well as a high but variable gross margin on sales. Cash and cash equivalents at 31 March 2016 was €1.7m which will increase significantly during Q2 2016, mainly from the receipt of the share proceeds receivable of €3.7m (after brokering fees) as well as higher operational cash flow. There is an obvious correlation between cash flow and monthly revenues, based on timing differences in our business, but underlying trading cash is strong and shows there is high consistency in our management of cash positively.
-40 000 000 ZAR
-20 000 000 ZAR
- ZAR
20 000 000 ZAR
40 000 000 ZAR
60 000 000 ZAR
Aug Sep Oct Nov Dec Jan Feb Mar
DRS monthly Sales in local curreny (Zar) and Change in DRS Cash balance (lagged two months)
August 2015 and March 2016
Monthly Sales Monthly change in cash balance

6
FINANCIAL INFORMATION
INTERIM REPORT COMPARATIVE FIGURES The comparative financial information presented in relation to the primary financial statements includes comparative financial information for 31 December 2015 which is audited financial information presented in the Group’s annual report for 2015. For the Income statement, the Balance sheet, the Cash flow analysis and the Statement of changes in equity, comparative financial information for Q1 2015 is presented, however this financial information has not previously been reported in an interim report. Therefore, this comparative financial information should not be used or relied on in the same way that comparative financial information that has been reported separately in an interim report.
Please note that Cognosec reported its first and second quarters for 2015 in its first interim report as a combined half-year result (six months). The third quarter was published as a separate interim report.
PROFIT FOR THE PERIOD THE GROUP Net sales for the First Quarter amounted to € 3.98m (Q1 2015 €3.28m). Profit after tax for the First Quarter amounted to € 192k (Q1 2015 €681k). Profit attributable to the minority interest amounts to €85k (Q1 2015 € 159k).
Depreciation and amortisation for the period amounted to €50k (Q1 2015 €16k). Cash flow for the period amounted to negative €1.16m (Q1 2015 € 512k).
PARENT The Parent Company's loss for the period amounted to €34k (Q1 2015 € 0).
FINANCIAL POSITION THE GROUP The Group had at 31 March 2016, cash and cash equivalents of € 1.7m (Q4 2015 € 2.95m). The equity ratio was 53 % (Q4 2015 47%)
The Group’s equity amounted to € 5.94 m (Q4 2015 €7.53m), which represents 0.024 €/share (Q4 2015 0.03 €/share). The changes in equity is further explained in the section for related party transactions on page 7 and in the consolidated Statement of changes in equity on page 13.
During the twelve months of 2015 or the first three months of 2016 the Group has not paid any dividends on shares to shareholders. Cognosec Group had per 31 March 2016 no liabilities to banks or credit institutions.
PARENT The issue of 10 m new shares in Cognosec AB (Publ) has in all material respects been executed according to plan. The capital raised through this issue amounted to €4.79m. Total brokering fees amounted to €0.2m resulting in net proceeds received from the issue of €4.59m. During Q2 2016 9 579 000 shares will be registered. The Directors are confident that the remaining subscribed not yet paid up shares will be issued during 2016. These shares will be registered separately.
As of 31 March 2016 the amount for subscribed not yet paid shares was €3.91m brokering fees amounted to €0.2m resulting in a net receivable of 3.7m.
CONTINGENT CONSIDERATION A payment $0,4m for additional consideration to the sellers of the companies acquired in 2015, based on contractual obligations based audited financials for 2015 was paid in May 2016. An additional payment of $0,1m will be made during Q2, this additional consideration was reflected in the annual accounts for 2015 but had not been paid at that time.
INVESTMENTS THE GROUP No investments were made during the First Quarter of 2016. (Q1 2015 € 1.37m).
Reported goodwill in connection with the interim financial statements is subject to depreciation of 10% per annum.
Investments made during the 12 months to 31 December consists of € 1.82 m for purchase of shares in subsidiaries and € 73k for the acquisition of intellectual property.
The Group seeks to expand by way of profitable M&A activity.
INCOME TAXES No taxes have been paid in Q1 2016 (Q1 2015 € nil) The parent company is liable for income tax on profits earned by its subsidiary in Dubai due to Swedish controlled foreign company (CFC) legislation. Tax liability is recognised for profits in this subsidiary regardless if they have been distributed or not. A corresponding deferred tax asset is also recognised that is reversed upon distribution of profits for this entity to the parent company. Per Q1 2016 a current tax liability and a corresponding deferred tax asset of €198k was recognised for CFC profits (Q4 2015 €222k).

7
EMPLOYEES OF COGNOSEC THE GROUP The Group's employees are employed by the subsidiaries: 1. Dynamic Recovery Services Ltd (South Africa) 2. Credence Security Ltd Pty (South Africa) 3. Professional Technologies Ltd (Kenya) 4. Credence Security Ltd (UAE) 5. Cognosec Ltd (UK) Average number of staff for the first quarter of 2016 was 92. At 31 March 2016, the head count was as follows: South Africa 58 Kenya 18 United Arab Emirates 11 United Kingdom 3 Sweden 3 Total 95 Sweden’s headcount includes the Group’s CEO and a IR-officer who acts for the group as a consultant.
LIQUIDITY GUARANTEE Cognosec AB (Publ) has in preparation for the planned listing and trading of shares made an agreement with Mangold Fondkommission AB to act as liquidity provider.
CERTIFIED ADVISER Cognosec AB (Publ) has in preparation for the planned listing and trading of shares appointed with Eminova Fondkommission AB to serve as a Certified Adviser.
TRANSACTIONS WITH RELATED PARTIES UC Group Ltd which is controlled by Cognosec’s principal owner, JA Paulsen, currently provides services to Cognosec. These services are under the Board's opinion provided on fair market conditions and the cost amounts up to and including 31 March 2016 to €0. The Group has an established commercial partnership with Cognosec GmbH, a subsidiary of UC Group Ltd. Commercial transactions are made on market terms. A receivable related to a dividend payment made under 2014 to the previous owners of the subsidiaries was removed via the consolidated statement of changes in equity during Q1 when the 2014 dividend payment was approved. A dividend payment to the minority owner in DRS for 2014 will be made during Q2 2016 of €49k. This dividend payment to the minority will be shown in the Q2 Report.
SHARE DATA Cognosec AB (Publ) is a public company whose share register is subject to record date. The Company's share register is maintained by Euroclear Sweden AB. Total amount of registered shares at 31 March 2016 were 247 600 000. The shares for the ongoing share issue are expected to be registered in the second quarter of 2016.
FINANCIAL CALENDAR Second quarter 2016 August 26, 2016 Third quarter 2016 October 18, 2016 Fourth quarter 2016 February 25, 2017 First quarter 2017 April 28, 2017
ACCOUNTING PRINCIPLES The interim report for the Group has been prepared in accordance with the Annual Accounts Act and the Swedish Accounting Standards Board BFNAR 2012: 1 on Annual report, and consolidated financial statements (K3) as well as the Swedish Securities Market Act. The K3 financial reporting framework is similar to IFRS for Small and Medium enterprises. The parent company has in preparation of this interim report applied the same accounting and valuation principles as the Group. The Group will move to IFRS reporting shortly. For further details of the Group and the parents accounting principles refer to detailed accounting principles described in the annual accounts for 2015.
RISKS AND UNCERTAINTIES Inherent risks and uncertainties for Cognosec AB covering business risks concerning the delivery of contracted projects and payment of these financial risks (such as risks related to currency, interest rates, counter-parties, future capital), market risks (e.g. competition, changes in demand) and risks related to the local conditions in the countries in which the Group conducts its business infrastructure and the risk of delays due to various disturbances in the delivery of contracted projects. Liquidity risk is managed through liquidity forecasting which ensures sufficient funds are in place to meet the group’s obligations and the overall strategy for the group. A more detailed description of risks and risk management refer to the risk and risk management section of the annual report for 2015.
INTERIM REPORT Comparative financial information presented in this report includes Q1 2015 both as a comparative in the financial statements and in the financial analysis. However, this comparative information should not be relied upon in the same way as if it had been presented in a separate interim report.

8
AUDITORS PWC (Sweden) represented by Martin Johansson serves as Group Auditors.
SIGNIFICANT EVENTS AFTER THE END OF REPORTING PERIOD After the end of the reporting period Cognosec Nordic AB (Sweden) was incorporated and Cognosec GmbH (Germany) were incorporated to act as trading companies. Cognosec Limited (UK) began operational activities as a trading company in the UK.
ELECTION COMMITTEE AND ANNUAL GENERAL MEETING Cognosec AB (Publ) has not made any decisions on an election Committee. The Company will hold its Annual General Meeting for the calendar year 2016 in Stockholm at its offices on 31
st May 2016.
CERTIFICATION AND SIGNATURES The Board of Directors and the CEO certifies that the summarized interim report gives a true and fair view of the financial information in this report. This report has not been reviewed by the Company's auditor. The Board of Cognosec AB (Publ), corporate identity number 556135-4811 Stockholm, May 27
th, 2016
Jacobus Paulsen Robert Brown Chairman CEO Lord David Blunkett Patrick Boylan Daniel Holden Neira Jones Ordinary board member Ordinary board member Ordinary board member Ordinary board member Magnus Stuart Anna Petre Björn Elowsson Ordinary board member Ordinary board member Ordinary board member Dusyant Patel Alternative Director
9
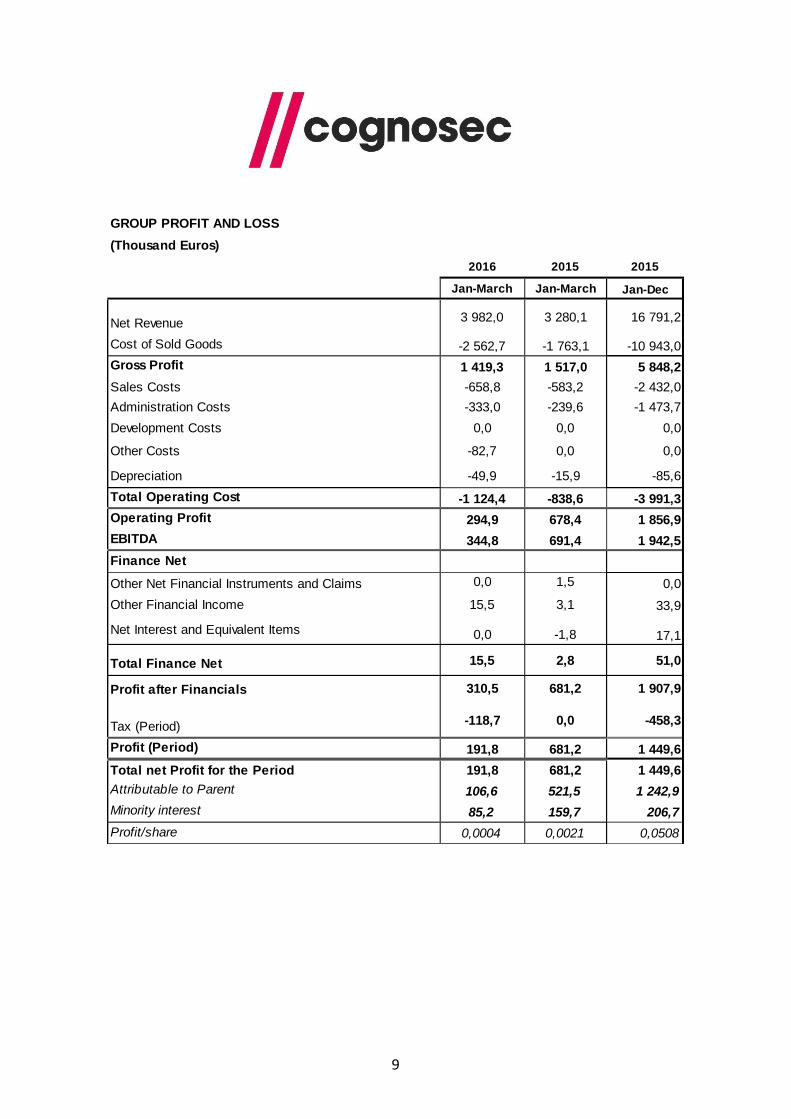
GROUP PROFIT AND LOSS
(Thousand Euros)
2016 2015 2015
Jan-March Jan-March Jan-Dec
Net Revenue 3 982,0 3 280,1 16 791,2
Cost of Sold Goods -2 562,7 -1 763,1 -10 943,0
Gross Profit 1 419,3 1 517,0 5 848,2
Sales Costs -658,8 -583,2 -2 432,0
Administration Costs -333,0 -239,6 -1 473,7
Development Costs 0,0 0,0 0,0
Other Costs -82,7 0,0 0,0
Depreciation -49,9 -15,9 -85,6
Total Operating Cost -1 124,4 -838,6 -3 991,3
Operating Profit 294,9 678,4 1 856,9
EBITDA 344,8 691,4 1 942,5
Finance Net
Other Net Financial Instruments and Claims 0,0 1,5 0,0
Other Financial Income 15,5 3,1 33,9
Net Interest and Equivalent Items 0,0 -1,8 17,1
Total Finance Net 15,5 2,8 51,0
Profit after Financials 310,5 681,2 1 907,9
Tax (Period) -118,7 0,0 -458,3
Profit (Period) 191,8 681,2 1 449,6
Total net Profit for the Period 191,8 681,2 1 449,6
Attributable to Parent 106,6 521,5 1 242,9
Minority interest 85,2 159,7 206,7
Profit/share 0,0004 0,0021 0,0508

10
PARENT COMPANY PROFIT AND LOSS
(Thousand Euros)
2016 2015 2015
Jan-March Jan-March Jan-Dec
Net Revenue - - -
Cost of Sales - 8,2 - - 53,1
Operating Profit - 8,2 - - 53,1
Depreciation - 18,2 - -
Administration costs - 8,2 - -
Net Finance - - -
Profit after Financial Items - 34,5 - - 55,0
Tax
Total net Profit for the Period - 34,5 - - 55,0

11
CASH FLOW ANALYSIS
(Thousand Euro)
Jan-Mar Jan-Mar Jan-Dec Jan-Mar Jan-Mar Jan-Dec
Q1 2016 Q1 2015 2015 Q1 2016 Q1 2015 2015
Operating Profit 310,5 681,2 2 474,0 -34,5 0,0 -55,0
Adjustments non C/F items 49,9 16,6 14,3 18,2 0,0 51,9
Operating Cash Flow 360,4 697,8 2 488,4 -16,3 0,0 -3,1
Paid Taxes 0,0 -0,5 -90,8 0,0 0,0 0,0
Changes in Working Capital -1 024,1 0,0 -527,1 -90,9 0,0 58,7
Cash Flow from Operating Activities -663,7 697,3 1 870,5 -107,2 0,0 55,6
Acqusition of Fixed Assets 0,0 -22,9 -71,9 0,0 0,0 -39,1
Investments in Current Assets 0,0 0,0 -1 439,2 0,0 0,0 0,0
Loan provisioning -318,8 0,0 0,0 0,0 0,0 0,0
Sale of Fixed Assets 0,0 0,0 0,0 0,0 0,0 0,0
Cash Flow from Investment Activities -318,8 -22,9 -1 511,1 0,0 0,0 -39,1
New share issues 0,8 0,0 1 439,2 0,8 0,0 0,0
Proceeds from ongoing share issue -180,2 0,0 870,0 -180,2 0,0 870,0
Amortization of Debt 0,0 -162,0 -162,0 0,0 0,0 0,0
Interest Payment 0,0 0,0 0,0 0,0 0,0 0,0
Cash Flow from Financing Activities -179,4 -162,0 2 144,9 -179,4 0,0 870,0
Cash Flow from the Period -1 161,9 512,4 2 504,3 -286,6 0,0 886,5
Opening Cash 2 946,4 368,0 368,0 915,7 19,9 20,3
FX-diff Period -82,9 -10,0 74,2 2,2 0,3 8,9
Closing Cash Position 1 701,6 870,4 2 946,4 631,2 20,3 915,7
GROUP PARENT

12
BALANCE SHEET
(Thousand Euros)
Q1 2016 Q1 2015 FY 2015 Q1 2016 Q1 2015 FY 2015
31 March 31 March 31 Dec 31 March 31 March 31 Dec
Fixed Assets
Material Assets 99,2 112,3 103,7 0,0 0,0 0,0
Intangible Assets 54,7 0,0 72,9 54,7 0,0 72,9
Financial Assets
Investment 0,0 0,0 0,0 1 816,7 1 088,9 1 816,7
Goodwill 912,1 359,0 935,5 0,0 0,0 0,0
Other Long Term Claims 0,0 311,2 0,0 0,0 363,1 0,0
Total Fixed Assets 1 066,0 782,5 1 112,1 1 871,4 1 452,0 1 889,6
Current Assets
Inventory (PIP) 258,0 294,9 463,6 0,0 0,0 0,0
Other receivables 304,8 15,8 3 908,0 316,2 39,2 0,0
Deferred Tax 198,0 13,8 222,0 198,4 0,0 222,0
Trade receivable 4 090,1 3 739,8 7 205,5 0,0 0,0 123,9
Receivable from ongoing share issue 3 702,0 0,0 0,0 3 702,0 0,0 0,0
Other Claims 0,0 125,8 79,2 0,0 1,4 3 908,4
Cash & Bank 1 701,6 1 321,4 2 946,4 631,2 20,3 915,7
Total Current Assets 10 254,5 5 511,5 14 824,7 4 847,7 60,9 5 170,0
TOTAL ASSETS 11 320,5 6 294,0 15 936,8 6 719,1 1 512,9 7 059,6
Equity Capital
Share Capital 67,0 90,6 66,2 67,0 66,2 66,2
Share premium 1 439,1 1 375,6 1 439,1 1 400,0 1 400,0 1 439,1
Ongoing share issue 4 584,0 0,0 4 584,0 4 584,0 0,0 4 584,0
Translation reserve 191,8 681,2 1 449,6 -34,5 0,0 -55,0
Other reserves -341,0 137,7 -12,6 -145,1 -11,3 -138,2
Total Equity 5 940,9 2 285,1 7 526,3 5 871,4 1 454,9 5 896,1
Longterm Debt 0,0 0,0 0,0 0,0 0,0 0,0
Short term debt
Interim Debt 0,0 0,0 604,5 0,0 0,0 321,5
Intragroup Debt 0,0 0,0 0,0 0,0 52,0 0,0
Suppliers 4 831,0 3 838,1 7 529,5 672,8 6,0 620,0
Tax Debt 404,7 69,8 276,5 174,9 0,0 222,0
Provisions 143,9 101,0 0,0 0,0 0,0 0,0
Total Short Term Debt 5 379,6 4 008,9 8 410,5 847,7 58,0 1 163,5
TOTAL DEBT AND EQUITY 11 320,5 6 294,0 15 936,8 6 719,1 1 512,9 7 059,6
GROUP PARENT
13
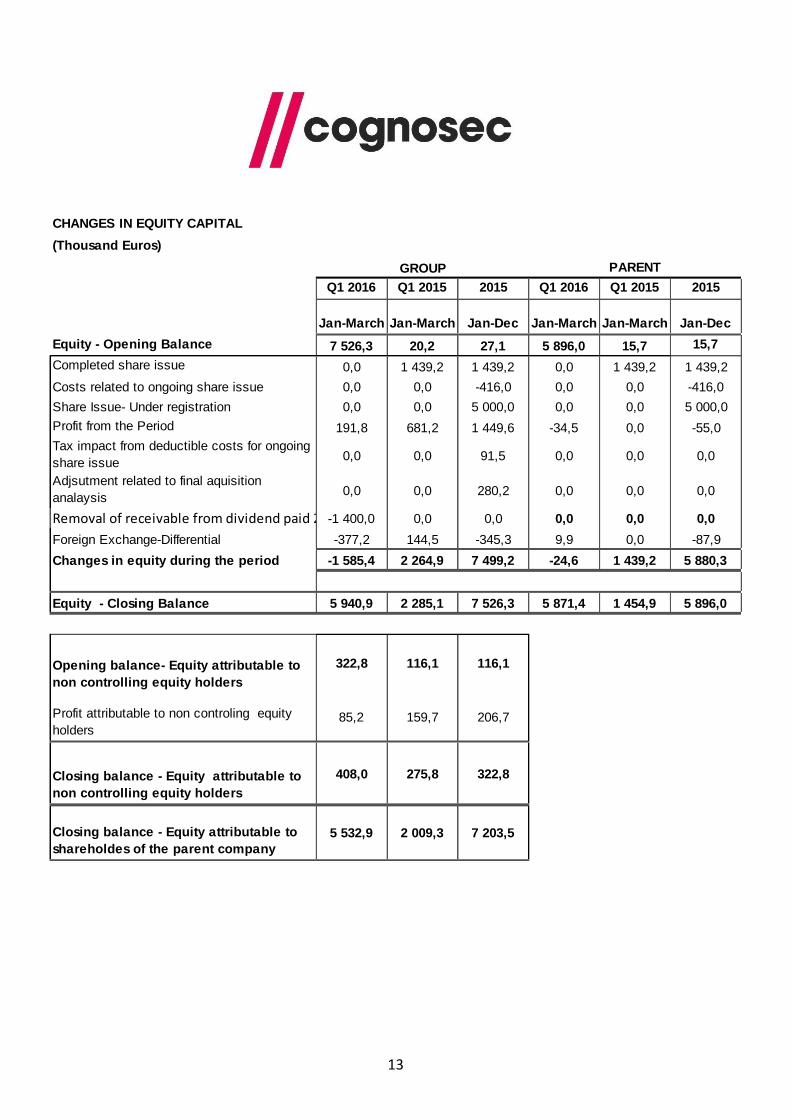
CHANGES IN EQUITY CAPITAL
(Thousand Euros)
Q1 2016 Q1 2015 2015 Q1 2016 Q1 2015 2015
Jan-March Jan-March Jan-Dec Jan-March Jan-March Jan-Dec
Equity - Opening Balance 7 526,3 20,2 27,1 5 896,0 15,7 15,7
Completed share issue 0,0 1 439,2 1 439,2 0,0 1 439,2 1 439,2
Costs related to ongoing share issue 0,0 0,0 -416,0 0,0 0,0 -416,0
Share Issue- Under registration 0,0 0,0 5 000,0 0,0 0,0 5 000,0
Profit from the Period 191,8 681,2 1 449,6 -34,5 0,0 -55,0
Tax impact from deductible costs for ongoing
share issue0,0 0,0 91,5 0,0 0,0 0,0
Adjsutment related to final aquisition
analaysis0,0 0,0 280,2 0,0 0,0 0,0
Removal of receivable from dividend paid 2014 but approved 2016-1 400,0 0,0 0,0 0,0 0,0 0,0
Foreign Exchange-Differential -377,2 144,5 -345,3 9,9 0,0 -87,9
Changes in equity during the period -1 585,4 2 264,9 7 499,2 -24,6 1 439,2 5 880,3
Equity - Closing Balance 5 940,9 2 285,1 7 526,3 5 871,4 1 454,9 5 896,0
Opening balance- Equity attributable to
non controlling equity holders
322,8 116,1 116,1
Profit attributable to non controling equity
holders85,2 159,7 206,7
Closing balance - Equity attributable to
non controlling equity holders
408,0 275,8 322,8
Closing balance - Equity attributable to
shareholdes of the parent company
5 532,9 2 009,3 7 203,5
GROUP PARENT