interim report to shareholders for the third quarter ended
TRANSCRIPT

Interim Report to Shareholders For the Third Quarter EndedSeptember 30, 2021

1 Financial Overview 12 Response to COVID-19 13 Operating Review 24 Restructuring and Other Related Costs 45 Income Taxes 46 Acquisitions and Divestitures 47 Capital Resources 58 Capital Expenditures 69 Normal Course Issuer Bid 610 Cash Flows 611 Financial Instruments 712 Transactions with Related Parties 813 Share Capital 814 Other Matters 815 Maple Leaf Centre for Action on Food Security 816 Summary of Quarterly Results 917 Significant Accounting Policies 1018 Internal Controls Over Financial Reporting 1119 Outlook and Long-term Targets 1120 Non-IFRS Financial Measures 1221 Forward-Looking Statements 1622 About Maple Leaf Foods Inc. 18
MANAGEMENT'S DISCUSSION AND ANALYSIS | Q3 2021 | MAPLE LEAF FOODS INC.
Management’s Discussion and Analysis

All dollar amounts are presented in Canadian dollars unless otherwise noted.
November 3, 2021
1. FINANCIAL OVERVIEW
As at or for the
($ millions except earnings per share)(Unaudited)
Three months ended September 30, nine months ended September 30,
2021 2020 % Change 2021 2020 % ChangeSales $ 1,188.6 $ 1,057.2 12.4 % $ 3,400.6 $ 3,174.5 7.1 %Net Earnings $ 44.5 $ 66.0 (32.6) % $ 100.9 $ 87.9 14.8 %Basic Earnings per Share $ 0.36 $ 0.54 (33.3) % $ 0.82 $ 0.72 13.9 %Adjusted Operating Earnings(i) $ 68.0 $ 36.9 84.3 % $ 174.7 $ 148.7 17.5 %Adjusted Earnings per Share(i) $ 0.36 $ 0.17 111.8 % $ 0.90 $ 0.73 23.3 %Adjusted EBITDA - Meat Protein Group(i) $ 149.3 $ 122.6 21.8 % $ 402.3 $ 371.9 8.2 %Sales - Plant Protein Group $ 48.0 $ 51.4 (6.6) % $ 138.6 $ 158.3 (12.4) %Free Cash Flow(i) $ (5.5) $ 57.8 (109.5) % $ (336.6) $ (21.8) (1,444.0) %Construction Capital(i) $ 844.1 $ 303.0 178.6 %Net Debt(i) $ (1,089.5) $ (534.9) 103.7 %
(i) Refer to section 20. Non-IFRS Financial Measures of this document for the definition of these non-IFRS measures.
Sales for the third quarter of 2021 were $1,188.6 million compared to $1,057.2 million last year, an increase of 12.4%, driven by higher sales in the Meat Protein Group, partially offset by lower sales in the Plant Protein Group. For more details on sales performance by operating segment, please refer to section 3. Operating Review.
Year-to-date sales for 2021 were $3,400.6 million compared to $3,174.5 million last year, an increase of 7.1%, due to similar factors as noted above.
Net earnings for the third quarter of 2021 were $44.5 million ($0.36 per basic share) compared to $66.0 million ($0.54 per basic share) last year. Strong commercial performance and effective commodity hedges were more than offset by a reduction in net gains from non-cash fair value changes in biological assets and derivative contracts (2021: net loss of $0.1 million; 2020: net gain of $64.0 million), both of which are excluded in the calculation of Adjusted Operating Earnings.
Year-to-date net earnings for 2021 were $100.9 million ($0.82 per basic share) compared to $87.9 million ($0.72 per basic share) last year. Strong commercial performance and effective commodity hedges were more than offset by an increase in non-cash fair value changes in biological assets and derivative contracts (2021: net gain of $5.0 million; 2020: net loss of $10.2 million), both of which are excluded in the calculation of Adjusted Operating Earnings.
Adjusted Operating Earnings for the third quarter of 2021 were $68.0 million compared to $36.9 million last year, and Adjusted Earnings per Share for the third quarter of 2021 were $0.36 compared to $0.17 last year due to similar factors as noted above.
Year-to-date Adjusted Operating Earnings for 2021 were $174.7 million compared to $148.7 million last year, and Adjusted Earnings per Share for 2021 were $0.90 compared to $0.73 last year due to similar factors as noted above.
For further discussion on key metrics and a discussion of results by operating segment, refer to section 3. Operating Review below.
2. RESPONSE TO COVID-19As an essential service, Maple Leaf Foods Inc. ("Maple Leaf Foods" or the "Company") is focused on protecting the health and well-being of its people, maintaining business continuity, and broadening its social outreach. To manage through this unprecedented environment, the Company has taken a number of measures in its business and operating practices that include heightened safety policies and procedures, and close communication and collaboration with public health authorities including on-site vaccination clinics. The measures enacted to protect the health and safety of employees have increased the Company’s cost structure due to higher labour, personal protective equipment, sanitation and other expenses associated with the pandemic. Continuing COVID-19 structural costs have been incorporated in the Company's 2021 operating plan.
Overall, the Company believes its proactive and comprehensive efforts have, and should continue to mitigate adverse operational impacts. As the COVID-19 situation evolves, Maple Leaf Foods will continue to adapt and adopt best practices that prioritize the health and safety of its employees and the stability of the food supply. As part of Maple Leaf Foods’ broader social responsibility since the
MANAGEMENT'S DISCUSSION AND ANALYSIS | Q3 2021 | MAPLE LEAF FOODS INC.
Management’s Discussion and Analysis
1
pandemic began, the Company has provided extensive support to front-line staff, emergency food relief efforts and health care providers.
COVID-19 continues to have an impact on the global economy, leading to increased inflation, labour shortages and disruptions in the global supply chain. To date, the Company's leading brands, revenue management capabilities and robust supply chain have enabled it to manage these impacts. Maple Leaf Foods continues to monitor the ongoing environment and believes it is well positioned to face these headwinds.
3. OPERATING REVIEW Maple Leaf Foods has two reportable segments. These segments offer different products, with separate organizational structures, brands, financial, and marketing strategies. The Company's chief operating decision makers regularly review internal reports for these businesses: performance of the Meat Protein Group is based on revenue growth, Adjusted Operating Earnings and Adjusted Earnings Before Interest, Taxes, Depreciation and Amortization ("EBITDA"), while the performance of the Plant Protein Group is based predominantly on revenue growth rates, gross margin optimization and controlling selling, general and administrative ("SG&A") investment levels, which generate high revenue growth rates.
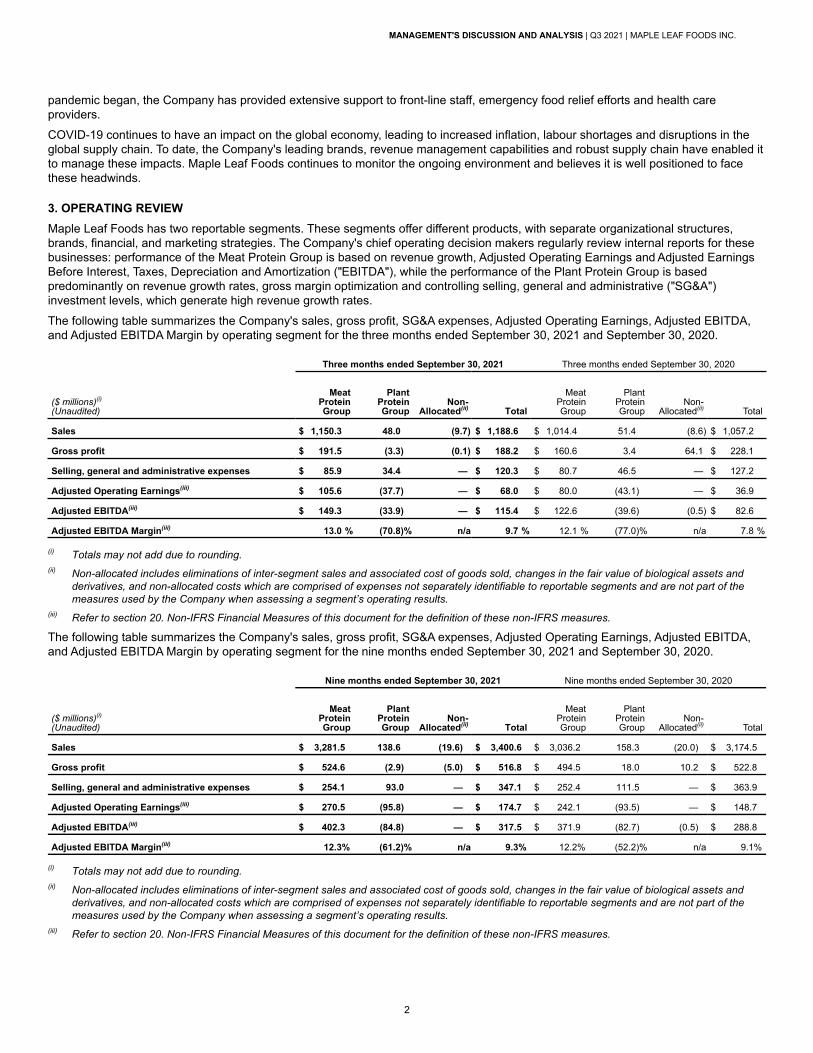
The following table summarizes the Company's sales, gross profit, SG&A expenses, Adjusted Operating Earnings, Adjusted EBITDA, and Adjusted EBITDA Margin by operating segment for the three months ended September 30, 2021 and September 30, 2020.
Three months ended September 30, 2021 Three months ended September 30, 2020
($ millions)(i)
(Unaudited)
Meat Protein Group
Plant Protein Group
Non-Allocated(ii) Total
Meat Protein Group
Plant Protein Group
Non-Allocated(ii) Total
Sales $ 1,150.3 48.0 (9.7) $ 1,188.6 $ 1,014.4 51.4 (8.6) $ 1,057.2
Gross profit $ 191.5 (3.3) (0.1) $ 188.2 $ 160.6 3.4 64.1 $ 228.1
Selling, general and administrative expenses $ 85.9 34.4 — $ 120.3 $ 80.7 46.5 — $ 127.2
Adjusted Operating Earnings(iii) $ 105.6 (37.7) — $ 68.0 $ 80.0 (43.1) — $ 36.9
Adjusted EBITDA(iii) $ 149.3 (33.9) — $ 115.4 $ 122.6 (39.6) (0.5) $ 82.6
Adjusted EBITDA Margin(iii) 13.0 % (70.8) % n/a 9.7 % 12.1 % (77.0) % n/a 7.8 %
(i) Totals may not add due to rounding. (ii) Non-allocated includes eliminations of inter-segment sales and associated cost of goods sold, changes in the fair value of biological assets and
derivatives, and non-allocated costs which are comprised of expenses not separately identifiable to reportable segments and are not part of the measures used by the Company when assessing a segment’s operating results.
(iii) Refer to section 20. Non-IFRS Financial Measures of this document for the definition of these non-IFRS measures.
The following table summarizes the Company's sales, gross profit, SG&A expenses, Adjusted Operating Earnings, Adjusted EBITDA, and Adjusted EBITDA Margin by operating segment for the nine months ended September 30, 2021 and September 30, 2020.
Nine months ended September 30, 2021 Nine months ended September 30, 2020
($ millions)(i)
(Unaudited)
Meat Protein Group
Plant Protein Group
Non-Allocated(ii) Total
Meat Protein Group
Plant Protein Group
Non-Allocated(ii) Total
Sales $ 3,281.5 138.6 (19.6) $ 3,400.6 $ 3,036.2 158.3 (20.0) $ 3,174.5
Gross profit $ 524.6 (2.9) (5.0) $ 516.8 $ 494.5 18.0 10.2 $ 522.8
Selling, general and administrative expenses $ 254.1 93.0 — $ 347.1 $ 252.4 111.5 — $ 363.9
Adjusted Operating Earnings(iii) $ 270.5 (95.8) — $ 174.7 $ 242.1 (93.5) — $ 148.7
Adjusted EBITDA(iii) $ 402.3 (84.8) — $ 317.5 $ 371.9 (82.7) (0.5) $ 288.8
Adjusted EBITDA Margin(iii) 12.3% (61.2) % n/a 9.3% 12.2% (52.2) % n/a 9.1%
(i) Totals may not add due to rounding. (ii) Non-allocated includes eliminations of inter-segment sales and associated cost of goods sold, changes in the fair value of biological assets and
derivatives, and non-allocated costs which are comprised of expenses not separately identifiable to reportable segments and are not part of the measures used by the Company when assessing a segment’s operating results.
(iii) Refer to section 20. Non-IFRS Financial Measures of this document for the definition of these non-IFRS measures.
MANAGEMENT'S DISCUSSION AND ANALYSIS | Q3 2021 | MAPLE LEAF FOODS INC.
2

Meat Protein Group The Meat Protein Group is comprised of prepared meats, ready-to-cook and ready-to-serve meals, value-added fresh pork and poultry products that are sold to retail, foodservice and industrial channels, and agricultural operations in pork and poultry. The Meat Protein Group includes leading brands such as Maple Leaf®, Maple Leaf Prime®, Schneiders®, Mina®, Greenfield Natural Meat Co.® and many leading regional brands.
Sales for the third quarter of 2021 increased 13.4% to $1,150.3 million compared to $1,014.4 million last year. Growth in sales is driven by pricing action implemented in the third quarter of 2021 to mitigate meat inflation, growth in fresh volumes from an increase in hogs and birds processed, and a favourable mix-shift towards sustainable meats and branded products. These factors more than offset an unfavourable impact from lower prepared meats volumes, foreign exchange, and lower sales to China.
Year-to-date sales for 2021 increased 8.1% to $3,281.5 million compared to $3,036.2 million last year. Sales growth was driven by pricing actions taken in the fourth quarter of 2020 and the third quarter of 2021 to mitigate inflation and structural cost increases, favourable mix-shift towards sustainable meats and branded products, and growth in fresh volumes from an increase in hogs and birds processed. These factors more than offset an unfavourable impact from foreign exchange, lower prepared meats volumes, and lower sales to China.
Gross profit for the third quarter of 2021 was $191.5 million (gross margin of 16.6%) compared to $160.6 million (gross margin of 15.8%) last year. Gross profit benefited from strong commercial performance and effective commodity hedges including a favourable product and channel mix attributed to expansion of sustainable meats and other branded products, more than offsetting cost pressure in the supply chain primarily due to labour challenges and $2.0 million in start-up costs associated with Construction Capital projects. The third quarter of 2020 was also impacted by heightened operating costs in response to COVID-19 to safeguard the Company's employees.
Year-to-date gross profit for 2021 was $524.6 million (gross margin of 16.0%) compared to $494.5 million (gross margin of 16.3%) last year. This increase is attributable to strong performance in branded products and value added sustainable meats, and effective hedges more than offsetting lower profits in China, higher structural costs and $4.1 million in start-up costs associated with Construction Capital projects. Gross profit in the first three quarters of 2020 was also impacted by significant operational and one-off costs in response to COVID-19.
SG&A expenses for the third quarter of 2021 were $85.9 million compared to $80.7 million last year. The increase in SG&A expenses was driven by the timing of advertising and promotional expenses and a gradual normalization of discretionary spending as COVID-19 restrictions relaxed.
Year-to-date SG&A expenses for 2021 were $254.1 million compared to $252.4 million last year. The increase in SG&A was driven by timing of advertising and promotional spend, partially offset by the lapping of donations made in March 2020 to support front-line health care workers at the outset of the COVID-19 pandemic.
Adjusted Operating Earnings for the third quarter of 2021 were $105.6 million compared to $80.0 million last year, consistent with factors noted above.
Year-to-date Adjusted Operating Earnings for 2021 were $270.5 million compared to $242.1 million last year, consistent with factors noted above.
Adjusted EBITDA for the third quarter of 2021 were $149.3 million compared to $122.6 million last year, driven by factors consistent with those noted above. Adjusted EBITDA Margin for the third quarter was 13.0% compared to 12.1% last year, also driven by factors consistent with those noted above.
Year-to-date Adjusted EBITDA for 2021 were $402.3 million compared to $371.9 million last year, driven by factors consistent with those noted above. Year-to-date Adjusted EBITDA Margin for 2021 was 12.3% compared to 12.2% last year, also driven by factors consistent with those noted above.
Plant Protein GroupThe Plant Protein Group is comprised of refrigerated plant protein products, premium grain-based protein, and vegan cheese products sold to retail, foodservice and industrial channels. The Plant Protein Group includes the leading brands Lightlife® and Field Roast™.
Sales for the third quarter of 2021 decreased 6.6% to $48.0 million compared to $51.4 million last year. Excluding the impact of foreign exchange, sales decreased 1.2%, driven by lower volumes in fresh and core retail products. This more than offset growth in foodservice volumes and pricing action implemented at the end of the third quarter of 2020 to mitigate inflation and structural cost increases.
Year-to-date sales for 2021 decreased 12.4% to $138.6 million compared to $158.3 million last year. Excluding the impact of foreign exchange, sales decreased 5.0%, driven by lower volumes in retail products. This more than offset growth in foodservice volumes and pricing action implemented at the end of the third quarter of 2020 to mitigate inflation and structural cost increases.
MANAGEMENT'S DISCUSSION AND ANALYSIS | Q3 2021 | MAPLE LEAF FOODS INC.
3

Gross profit for the third quarter of 2021 was a loss of $3.3 million (gross margin loss of 6.8%) compared to income of $3.4 million (gross margin of 6.6%) last year. The decrease in gross profit was attributed to lower sales volumes and strategic investments in capacity to build for anticipated demand which has resulted in increased overhead and transitory costs, as well as inflationary pressure on labour and other input costs. The third quarter of 2020 was also impacted by heightened operating costs in response to COVID-19 to safeguard the Company's employees.
Year-to-date gross profit for 2021 was a loss of $2.9 million (gross margin loss of 2.1%) compared to income of $18.0 million (gross margin of 11.4%) last year. The decrease in gross profit was primarily attributed to lower sales volumes and strategic investments in capacity to build for anticipated demand which has resulted in increased overhead and transitory costs, as well as inflationary pressure on labour and other input costs. Gross profit in the first three quarters of 2020 was also impacted by significant operational and one-off costs in response to COVID-19.
SG&A expenses for the third quarter of 2021 were $34.4 million (71.7% of sales) compared to $46.5 million (90.5% of sales) last year. The decrease in SG&A expenses was primarily driven by the timing of advertising and promotional expenses.
Year-to-date SG&A expenses for 2021 were $93.0 million (67.0% of sales) compared to $111.5 million (70.4% of sales) last year. The decrease in SG&A was driven by the timing of advertising and promotional expenses.
Adjusted Operating Earnings for the third quarter of 2021 were a loss of $37.7 million compared to a loss of $43.1 million last year. The increase in Adjusted Operating Earnings is consistent with the factors noted above.
Year-to-date Adjusted Operating Earnings for 2021 were a loss of $95.8 million compared to a loss of $93.5 million last year. The decrease in Adjusted Operating Earnings is consistent with the factors noted above.
4. RESTRUCTURING AND OTHER RELATED COSTS During the three months ended September 30, 2021, the Company recorded restructuring and other related costs of $0.8 million (2020: $1.7 million). This amount related to accelerated depreciation as a result of the previously announced future closures of the Brampton, Toronto and St. Mary's poultry plants. During the three months ended September 30, 2020, the amount consisted of accelerated depreciation of $1.0 million, and severance and other employee costs of $0.6 million as a result of the same announced closures. The remaining amount of $0.1 million in 2020 was related to employee related costs for other organizational restructuring initiatives.
During the nine months ended September 30, 2021, the Company recorded restructuring and other related costs of $3.7 million (2020: $3.1 million). Of this amount, $2.6 million (2020: $3.3 million) related to accelerated depreciation and $0.7 million (2020: reversals of $0.3 million) related to severance and other employee costs as a result of the previously announced future closures of the Brampton, Toronto and St. Mary's poultry plants. The remaining $0.4 million (2020: $0.1 million) related to employee related costs for other organizational restructuring initiatives.
5. INCOME TAXES The Company’s income tax expense for the third quarter resulted in an effective tax rate of 28.6% (2020: 27.0%). The higher effective rate of tax expense in the third quarter of 2021 primarily resulted from the geographic mix of earnings and the non-taxable portion of a gain realized in 2020. The effective tax rate in the third quarter of 2021 used in determining Adjusted Earnings per Share is 28.2% (2020: 29.5%). For the third quarter of 2021, the effective tax recovery rate on restructuring charges used in the computation of Adjusted Earnings per Share is 25.6% (2020: 25.6%).
The Company’s income tax expense for the nine months ended September 30, 2021 resulted in an effective tax rate of 29.1% (2020: 29.4%). The effective tax rate for the nine months ended September 30, 2021 used in determining Adjusted Earnings per Share is 28.2% (2020: 28.2%). For the nine months ended September 30, 2021, the effective tax recovery rate on restructuring charges used in the computation of Adjusted Earnings per Share is 25.6% (2020: 25.6%).
6. ACQUISITIONS AND DIVESTITURES On June 25, 2021, the Company completed the acquisition of a poultry processing facility and associated supply from Certm Inc. (formerly Cericola Farms Inc.), a privately held Canadian company for total consideration of $60.2 million (cash due at closing: $40.0 million; 2018 deposit $20.2 million) prior to any working capital adjustments. This acquisition concludes the purchase and sale agreement dated June 27, 2018 pursuant to which the Company previously acquired two poultry plants and associated supply, with a put/call option to purchase a third processing facility. The Company has financed the transaction using a combination of cash on hand and drawings on existing credit facilities. The acquisition has been accounted for as a business combination.
No goodwill is expected to be recorded on the transaction.
The Company has not yet finalized the amounts recorded for the acquisition.
During the three and nine months ended September 30, 2021, the Company recorded transaction costs pertaining to acquisitions of $0.1 million that have been excluded from the consideration paid and have been recognized as an expense in other (income) expense.
MANAGEMENT'S DISCUSSION AND ANALYSIS | Q3 2021 | MAPLE LEAF FOODS INC.
4

For full details on the acquisition, refer to Note 15 of the unaudited condensed consolidated interim financial statements ("Consolidated Interim Financial Statements").
7. CAPITAL RESOURCES The consumer foods industry in which the Company operates is generally characterized by high sales volume and high turnover of inventories and accounts receivable. In general, accounts receivable and inventories are readily convertible into cash. Investment in working capital is affected by fluctuations in the price of raw materials, seasonal and other market-related fluctuations. The Company has consistently generated a strong base level of operating cash flow, even in periods of higher commodity prices and during restructuring of its operations. These operating cash flows provide a base of underlying liquidity that the Company supplements with credit facilities and cash on hand to provide longer-term funding and to finance fluctuations in working capital levels.
The Company's cash balance as at September 30, 2021 was $73.5 million (September 30, 2020: $178.2 million; December 31, 2020: $100.8 million). Cash is held in demand and short-term investment deposits with Canadian financial institutions having long-term debt ratings of A or higher.
The composition of long-term debt is shown below:
($ thousands) As at September 30, As at September 30, As at December 31,(Unaudited) 2021 2020 2020Revolving line of credit $ 470,000 $ — $ 50,000 U.S. term credit 335,318 354,623 337,544 Canadian term credit 350,000 350,000 350,000 Government loans 7,697 8,461 8,404 Total long-term debt $ 1,163,015 $ 713,084 $ 745,948 Current $ 5,279 $ 937 $ 900 Non-current 1,157,736 712,147 745,048 Total long-term debt $ 1,163,015 $ 713,084 $ 745,948 Construction Capital(i) included in total long-term debt $ 821,110 $ 296,980 $ 440,590
(i) Refer to section 20. Non-IFRS Financial Measures of this document for the definition of this non-IFRS measure.
The Company has a syndicated credit facility (the "Credit Facility") consisting of a $1,300.0 million unsecured committed revolving line of credit maturing April 30, 2024 and two unsecured committed term credit facilities for US$265.0 million and $350.0 million maturing April 30, 2024 and April 30, 2023, respectively. The Credit Facility can be drawn in Canadian or U.S. dollars and bears interest payable monthly, based on Banker's Acceptance and Prime rates for Canadian dollar loans and the London Inter-bank Offered Rate ("Libor") for U.S. dollar loans. The Credit Facility is intended to meet the Company's funding requirements for capital investments in addition to providing appropriate levels of liquidity for general corporate purposes. On December 11, 2019, the Company amended the Credit Facility to reduce interest paid upon achievement of certain sustainability targets. Subsequent to the issuance of the Company's 2020 Sustainability Report, the Company successfully achieved these sustainability targets. This reduction will take effect in the fourth quarter of 2021. There is no penalty for not achieving the targets. In addition to term credit, as at September 30, 2021 the Company had drawn letters of credit of $8.1 million on the Credit Facility (September 30, 2020: $6.7 million; December 31, 2020: $6.4 million).
The Credit Facility requires the maintenance of certain covenants. As at September 30, 2021, the Company was in compliance with all of these covenants.
The Company has additional uncommitted credit facilities for issuing letters of credit up to a maximum of $125.0 million (September 30, 2020: $125.0 million; December 31, 2020: $125.0 million). As at September 30, 2021, $66.8 million in letters of credit had been issued thereon (September 30, 2020: $78.5 million; December 31, 2020: $67.0 million).
The Company has various government loans on specific projects, with contractual interest rates ranging from non-interest bearing to 2.9% per annum (September 30, 2020: 0.0% to 2.9%; December 31, 2020: 0.0% to 2.9%). These specific facilities are repayable over various terms and are maturing from 2022 to 2032. As at September 30, 2021, $7.7 million (September 30, 2020: $8.5 million; December 31, 2020: $8.4 million) was outstanding. All of these facilities are committed.
The Company has a three-year accounts receivable securitization facility (the "Securitization Facility") maturing July 19, 2022. The maximum cash advance available to the Company under the Securitization Facility is $120.0 million (September 30, 2020: $120.0 million; December 31, 2020: $120.0 million). The Securitization Facility provides cash funding with a proportion of the Company's receivables being sold, and provides the Company with competitively priced financing and further diversifies its funding sources. Under the Securitization Facility, the Company has sold certain of its trade accounts receivable, with very limited recourse, to an unconsolidated third-party trust financed by an international financial institution with a long-term AA- debt rating, for cash and short-term
MANAGEMENT'S DISCUSSION AND ANALYSIS | Q3 2021 | MAPLE LEAF FOODS INC.
5

notes back to the Company. The receivables are sold at a discount to face value based on prevailing money market rates. The Company retains servicing responsibilities for these receivables.
As at September 30, 2021, the Company had $168.7 million (September 30, 2020: $150.5 million; December 31, 2020: $134.8 million) of trade accounts receivable serviced under the Securitization Facility. In return for the sale of its trade receivables, the Company will receive cash of $120.0 million (September 30, 2020: $118.4 million; December 31, 2020: $103.2 million) and notes receivable in the amount of $48.7 million (September 30, 2020: $32.1 million; December 31, 2020: $31.6 million). The notes receivable are non-interest bearing and are settled on the settlement dates of the securitized accounts receivable. Due to the timing of receipts and disbursements, the Company may, from time to time, also record a receivable or payable related to the Securitization Facility. As at September 30, 2021, the Company recorded a net receivable in the amount of $20.8 million (September 30, 2020: $24.1 million net payable; December 31, 2020: $16.8 million net payable) in notes receivables (September 30, 2020 and December 31, 2020: accounts payable and accruals). The facility is accounted for as an off-balance sheet transaction in accordance with International Financial Reporting Standards ("IFRS").
The Securitization Facility is subject to certain restrictions, including the maintenance of covenants. The Company was in compliance with all of the requirements of this facility as at September 30, 2021. If the Securitization Facility were to be terminated, the Company would recognize the related amounts on the unaudited condensed consolidated interim balance sheets ("Consolidated Interim Balance Sheets") and consider alternative financing if required.
8. CAPITAL EXPENDITURES Capital expenditures for the third quarter of 2021 were $152.9 million compared to $103.0 million last year and year-to-date capital expenditures for 2021 were $504.4 million compared to $304.2 million last year. The increase in capital expenditures was primarily attributable to the construction of the London, Ontario poultry facility, the build-out of the Indianapolis, Indiana plant protein facility and the expansion of the Bacon Centre of Excellence in Winnipeg, Manitoba.
The Company's capital expenditure estimate for the full year of 2021 remains unchanged and at the high end of the range of $550 million to $650 million, with approximately 75% to be comprised of Construction Capital. A significant portion of the Construction Capital is related to the London, Ontario poultry facility, the plant protein facility in Indianapolis, Indiana and the expansion of the Bacon Centre of Excellence in Winnipeg, Manitoba.
The Company recently completed an assessment on the cost and timing of completion of its London, Ontario poultry facility. The revised cost estimate is now expected to be approximately $772 million. The increased cost is attributed to inflationary pressures on both goods and services coupled with productivity challenges attributable to COVID-19, including the impact of supply chain and on-site protocols. The expected project completion and start-up timing remain largely unchanged.
9. NORMAL COURSE ISSUER BID On May 20, 2021 the Toronto Stock Exchange ("TSX") accepted the Company's notice of intention to commence a Normal Course Issuer Bid ("NCIB"), allowing the Company to repurchase, at its discretion, up to 7.5 million common shares in the open market or as otherwise permitted by the TSX, subject to the normal terms and limitations of such bids. Common shares purchased by the Company are cancelled. The program commenced on May 25, 2021 and will terminate on May 24, 2022, or on such earlier date as the Company completes its purchases pursuant to the notice of intention. Under this bid, during the three and nine months ended September 30, 2021, no shares were repurchased for cancellation.
On May 21, 2020 the TSX accepted the Company's notice of intention to commence an NCIB, allowing the Company to repurchase, at its discretion, up to 7.5 million common shares in the open market or as otherwise permitted by the TSX, subject to the normal terms and limitations of such bids. Common shares purchased by the Company are cancelled. The program commenced on May 25, 2020 and was terminated on May 24, 2021. Under this bid, during the nine months ended September 30, 2021, no shares were purchased for cancellation. During the three and nine months ended September 30, 2020, no shares were purchased for cancellation.
On May 17, 2019, the TSX accepted the Company's notice of intention to commence an NCIB, allowing the Company to repurchase, at its discretion, up to 7.5 million common shares in the open market or as otherwise permitted by the TSX, subject to the normal terms and limitations of such bids. Common shares purchased by the Company were cancelled. The program commenced on May 24, 2019 and was terminated on May 23, 2020. Under this bid, during the three and nine months ended September 30, 2020, no shares were purchased for cancellation.
10. CASH FLOWS Cash and cash equivalents were $73.5 million at the end of the third quarter of 2021, compared to $178.2 million at the end of the third quarter of 2020, and $100.8 million as at December 31, 2020. The decrease in cash and cash equivalents for the nine months ended September 30, 2021 was primarily due to investment in long-term assets, investment in working capital, dividend payments, income tax payments and an acquisition of business, partially offset by earnings and loans drawn on the Credit Facility.
MANAGEMENT'S DISCUSSION AND ANALYSIS | Q3 2021 | MAPLE LEAF FOODS INC.
6

Cash Flow from Operating Activities Cash provided by operating activities for the third quarter of 2021 was $136.8 million compared to $135.2 million in 2020. The increase was mainly due to higher earnings, partially offset by lower investment in working capital and a smaller reduction in derivative margins.
Cash from operating activities for the first nine months of 2021 was $136.5 million compared to $236.5 million in 2020. The decrease was mainly due to larger investment in working capital and higher income tax payments, partially offset by higher earnings.
Cash Flow from Investing Activities Cash used in investing activities for the third quarter of 2021 was $126.4 million compared to $40.7 million in 2020. The increase was mainly due to higher investment in long-term assets and fewer proceeds from sale of long-term assets.
For the first nine months of 2021, cash used in investing activities was $496.6 million compared to $235.5 million in 2020. The increase was mainly due to higher increased additions to in long-term assets, the acquisition of a business in the second quarter of 2021 and fewer proceeds from sale of long-term assets, partially offset by proceeds from a legal settlement in the third quarter of 2021.
Cash Flow from Financing ActivitiesCash from financing activities for the third quarter of 2021 was an inflow of $4.2 million compared to an outflow of $27.6 million in 2020. The increase was primarily due to larger drawings on the Credit Facility and additional proceeds from the exercise of stock options, partially offset by higher dividend payments.
For the first nine months of 2021, cash provided by financing activities was $332.8 million compared to $79.9 million in 2020. The increase was primarily due to larger drawings on the Credit Facility and additional proceeds from the exercise of stock options.
11. FINANCIAL INSTRUMENTSThe Company applies hedge accounting as appropriate and uses derivatives and other non-derivative financial instruments to manage its exposures to fluctuations in foreign exchange rates, interest rates, and commodity prices.
During the three months ended September 30, 2021, the Company recorded a pre-tax gain of $0.3 million (2020: gain of $11.2 million) on non-designated financial instruments held for trading.
During the nine months ended September 30, 2021, the Company recorded a pre-tax loss of $9.2 million (2020: loss of $29.1 million) on non-designated financial instruments held for trading.
During the three months ended September 30, 2021, the pre-tax amount of hedge ineffectiveness recognized in cost of goods sold was a gain of $0.1 million (2020: gain of $0.0 million).
During the nine months ended September 30, 2021, the pre-tax amount of hedge ineffectiveness recognized in cost of goods sold was a gain of $0.1 million (2020: gain of $0.1 million).
The table below sets out fair value measurements of derivative financial instruments as at September 30, 2021 using the fair value hierarchy:
($ thousands)(Unaudited) Level 1 Level 2 Level 3 TotalAssets:
Foreign exchange contracts $ — 2,204 — $ 2,204 Commodity contracts(i) — 1,167 — 1,167
$ — 3,371 — $ 3,371 Liabilities:
Foreign exchange contracts $ — 2,039 — $ 2,039 Commodity contracts(i) 2,552 — — 2,552 Interest rate swaps — 11,023 — 11,023
$ 2,552 13,062 — $ 15,614 (i) Level 1 commodity contracts are net settled and recorded as a net asset or liability on the Consolidated Interim Balance Sheets.
There were no transfers between levels for the three and nine months ended September 30, 2021 and September 30, 2020.
Determination of fair value and the resulting hierarchy requires the use of observable market data whenever available and is consistent with the methodology used in the Company’s 2020 annual audited Consolidated Financial Statements. The classification of a financial instrument in the hierarchy is based upon the lowest level of input that is significant to the measurement of fair value. For financial instruments that are recognized at fair value on a recurring basis, the Company determines whether transfers have occurred between levels in the hierarchy by re-assessing categorization at the end of each reporting period.
MANAGEMENT'S DISCUSSION AND ANALYSIS | Q3 2021 | MAPLE LEAF FOODS INC.
7

Accumulated other comprehensive income (loss) During the three months ended September 30, 2021, a gain of $1.8 million, net of tax of $0.6 million, was released to earnings from accumulated other comprehensive income (loss) and included in the net change for the year (2020: loss of $1.2 million, net of tax of $0.4 million).
During the nine months ended September 30, 2021, a gain of $0.6 million, net of tax of $0.2 million, was released to earnings from accumulated other comprehensive income (loss) and included in the net change for the year (2020: loss of $2.3 million, net of tax of $0.8 million).
During the three months ended September 30, 2021, the loss on the net investment hedge recorded in other comprehensive income (loss) was $5.5 million, net of tax of $1.1 million (2020: gain of $4.4 million, net of tax of $0.8 million).
During the nine months ended September 30, 2021, the gain on the net investment hedge recorded in other comprehensive income (loss) was $1.8 million, net of tax of $0.4 million (2020: loss of $6.9 million, net of tax of $1.2 million).
12. TRANSACTIONS WITH RELATED PARTIES The Company sponsors a number of defined benefit, defined contribution and post-retirement benefit plans. During the three and nine months ended September 30, 2021, the Company contributed $7.6 million and $28.6 million (2020: $7.5 million and $22.3 million) to these plans.
The Company’s largest shareholder is McCain Capital Inc. (“MCI”). The Company has been informed that Mr. Michael H. McCain, Chief Executive Officer and President of the Company, is the controlling shareholder of MCI. For the three and nine months ended September 30, 2021, the Company received services from MCI in the amount of $0.0 million and $0.0 million (2020: $0.0 million and $0.1 million), which represented the market value of the transactions with MCI. As at September 30, 2021, September 30, 2020, and December 31, 2020, a nominal amount was owed to MCI relating to these transactions.
McCain Financial Advisory Services ("MFAS"), is an entity jointly controlled by individuals including Mr. Michael H. McCain. For the three and nine months ended September 30, 2021 and 2020, the Company provided services to and received from, MFAS for a nominal amount which represented the market value of the transactions.
13. SHARE CAPITAL As at October 28, 2021, there were 124,358,576 common shares issued and outstanding.
14. OTHER MATTERS On November 3, 2021, the Board of Directors approved a quarterly dividend of $0.18 per share, $0.72 per share on an annual basis, payable December 31, 2021 to shareholders of record at the close of business December 8, 2021. Unless indicated otherwise by the Company at or before the time the dividend is paid, the dividend will be considered an eligible dividend for the purposes of the “Enhanced Dividend Tax Credit System”.
15. MAPLE LEAF CENTRE FOR ACTION ON FOOD SECURITY The Maple Leaf Centre for Action on Food Security (the “Centre”) is the primary expression of the Company's sustainability strategy pillar of better communities. The Centre is a registered charity working to reduce food insecurity through collaboration with other organizations and individuals, through advocating for critical policies and investing in programs required to make sustainable improvements in food security. Additional information regarding the Centre is available on its website at: https://www.feedopportunity.com.
MANAGEMENT'S DISCUSSION AND ANALYSIS | Q3 2021 | MAPLE LEAF FOODS INC.
8

16. SUMMARY OF QUARTERLY RESULTS The following is a summary of unaudited quarterly financial information for each quarter in the last two fiscal years:
Third Quarter Second Quarter First Quarter Fourth Quarter
($ millions)(i) 2021 2020 2021 2020 2021 2020 2020 2019Sales
Meat Protein Group $ 1,150.3 $ 1,014.4 $ 1,117.5 $ 1,040.4 $ 1,013.7 $ 981.4 $ 1,080.3 $ 970.3 Plant Protein Group 48.0 51.4 48.1 60.6 42.6 46.3 52.5 49.7 Non-allocated(ii) (9.7) (8.6) (6.7) (6.4) (3.2) (5.0) (3.6) (4.0)
Total Sales $ 1,188.6 $ 1,057.2 $ 1,158.9 $ 1,094.6 $ 1,053.1 $ 1,022.8 $ 1,129.2 $ 1,016.0 Gross profit
Meat Protein Group $ 191.5 $ 160.6 $ 167.0 $ 176.6 $ 166.1 $ 157.3 $ 185.7 $ 150.5 Plant Protein Group (3.3) 3.4 0.3 7.9 0.1 6.8 0.3 7.2 Non-allocated(ii) (0.1) 64.1 (31.7) (17.2) 26.7 (36.7) (5.7) 3.0
Total Gross profit $ 188.2 $ 228.1 $ 135.7 $ 167.3 $ 193.0 $ 127.4 $ 180.3 $ 160.8 SG&A
Meat Protein Group $ 85.9 $ 80.7 $ 81.2 $ 83.7 $ 87.1 $ 88.0 $ 94.2 $ 84.0 Plant Protein Group 34.4 46.5 29.8 34.1 28.8 30.9 32.5 45.3
Total SG&A $ 120.3 $ 127.2 $ 110.9 $ 117.8 $ 115.9 $ 118.9 $ 126.8 $ 129.3 Net Earnings (loss) $ 44.5 $ 66.0 $ 8.8 $ 25.7 $ 47.7 $ (3.7) $ 25.4 $ 17.5 Earnings (Loss) Per Share(iii)
Basic $ 0.36 $ 0.54 $ 0.07 $ 0.21 $ 0.39 $ (0.03) $ 0.20 $ 0.14 Diluted $ 0.35 $ 0.53 $ 0.07 $ 0.21 $ 0.38 $ (0.03) $ 0.20 $ 0.14 Adjusted EPS(iv) $ 0.36 $ 0.17 $ 0.28 $ 0.35 $ 0.26 $ 0.21 $ 0.30 $ 0.12
Adjusted Operating Earnings(iv)
Meat Protein Group $ 105.6 $ 80.0 $ 85.9 $ 92.9 $ 79.0 $ 69.2 $ 91.5 $ 66.5 Plant Protein Group (37.7) (43.1) (29.5) (26.3) (28.7) (24.1) (32.3) (38.1)
Total Adjusted Operating Earnings $ 68.0 $ 36.9 $ 56.4 $ 66.7 $ 50.4 $ 45.1 $ 59.2 $ 28.4 Adjusted EBITDA(iv)
Meat Protein Group $ 149.3 $ 122.6 $ 129.7 $ 138.2 $ 123.3 $ 111.1 $ 136.5 $ 110.2 Plant Protein Group (33.9) (39.6) (25.9) (22.6) (25.0) (20.5) (28.7) (34.9) Non-allocated(ii) — (0.5) — — — — 1.3 —
Total Adjusted EBITDA $ 115.4 $ 82.6 $ 103.8 $ 115.7 $ 98.3 $ 90.5 $ 109.1 $ 75.3 Adjusted EBITDA Margin(iv)
Meat Protein Group 13.0 % 12.1 % 11.6 % 13.3 % 12.2 % 11.3 % 12.6 % 11.4 %Plant Protein Group (70.8) % (77.0) % (53.9) % (37.2) % (58.6) % (44.3) % (54.7) % (70.3) %
Total Adjusted EBITDA Margin 9.7 % 7.8 % 9.0 % 10.6 % 9.3 % 8.9 % 9.7 % 7.4 %
(i) Totals may not add due to rounding.(ii) Non-Allocated includes eliminations of inter-segment sales and associated cost of goods sold, and non-allocated costs which are comprised of
income and expenses not separately identifiable to reportable segments and are not part of the measures used by the Company when assessing a segment’s operating results.
(iii) Per share information is based on amounts attributable to common shareholders.(iv) Refer to section 20. Non-IFRS Financial Measures of this document.
MANAGEMENT'S DISCUSSION AND ANALYSIS | Q3 2021 | MAPLE LEAF FOODS INC.
9

Fluctuations in quarterly sales can be attributed to changes in pricing, volume, sales mix, acquisitions and the impact of foreign exchange translation.
Fluctuations in quarterly net earnings can be attributed to similar factors as noted above, pork and poultry industry processing margins, restructuring and other related costs, operating efficiencies, changes in the fair value of derivative and non-derivative financial instruments and biological assets, acquisitions, transitional costs incurred, provision adjustments, gains/losses on disposal of assets and changes in tax regulations.
For an explanation and analysis of quarterly results, refer to the Company’s Management’s Discussion and Analysis for each of the respective quarterly periods which are filed on SEDAR and also available on the Company’s website at www.mapleleaffoods.com.
17. SIGNIFICANT ACCOUNTING POLICIES Accounting Standards Adopted During the Period Beginning on January 1, 2021, the Company adopted certain IFRS standards and amendments. As required by International Accounting Standard ("IAS") 34 Interim Financial Reporting and IAS 8 Accounting Policies, Changes in Accounting Estimates and Errors, the nature and the effect of these changes are disclosed below:
Interest Rate Benchmark Reform - Phase 2
Beginning January 1, 2021, the Company adopted the amendments to IFRS 9 Financial Instruments ("IFRS 9"), IAS 39 Financial Instruments: Recognition and Measurement ("IAS 39"), IFRS 7 Financial Instruments: Disclosures ("IFRS 7"), IFRS 4 Insurance Contracts ("IFRS 4") and IFRS 16 Leases ("IFRS 16") to address issues that affect financial reporting after the reform of an interest rate benchmark, including its replacement with alternative benchmark rates. The amendments relate to modification of financial assets, financial liabilities and lease liabilities, specific hedge accounting requirements, and disclosure requirements in applying IFRS 7 to accompany the amendments regarding modifications and hedge accounting. The adoption of the amendments to IFRS 9, IAS 39, IFRS 7, IFRS 4 and IFRS 16 did not have a material impact on the Company's Consolidated Financial Statements.
Accounting Pronouncements Issued But Not Yet Effective Onerous Contracts - Cost of Fulfilling a Contract
On May 14, 2020, the International Accounting Standards Board ("IASB") issued an amendment to IAS 37 Provisions, Contingent Liabilities and Contingent Assets. The amendment specifies that the ‘cost of fulfilling’ a contract comprises the ‘costs that relate directly to the contract’. Costs that relate directly to the contract can either be incremental costs of fulfilling that contract or an allocation of other costs that relate directly to fulfilling that contract. The amendment is effective on January 1, 2022 and is to be applied prospectively. The extent of the impact of the adoption of the amendment has not yet been determined.
Annual Improvements to IFRS (2018-2020) Cycle
On May 14, 2020, the IASB issued narrow-scope amendments to three standards as part of its annual improvement process. Amendments were made to clarify which fees an entity includes when it applies the ‘10 per cent’ test in assessing whether to derecognize a financial liability in accordance with IFRS 9. The amendments also remove the requirement in IAS 41 Agriculture for entities to exclude taxation cash flows when measuring the fair value of a biological asset using a present value technique. Lastly, an amendment was made to IFRS 1 First-time Adoption of International Financial Reporting Standards for subsidiaries as a first-time adopter. These amendments are effective on January 1, 2022 and are to be applied prospectively. The extent of the impact of the adoption of these standards has not yet been determined.
Classification of Liabilities as Current or Non-current
On January 23, 2020, an amendment was issued to IAS 1 Presentation of Financial Statements to address inconsistencies with how entities classify current and non-current liabilities. The amendment serves to address whether debt and other liabilities with an uncertain settlement date should be classified as current or non-current in the balance sheets. This amendment is effective on January 1, 2023. The Company intends to adopt this amendment in its Consolidated Financial Statements for the annual period beginning January 1, 2023. The extent of the impact of the adoption of this amendment has not yet been determined.
Definition of Accounting Estimates (Amendments to IAS 8)
On February 12, 2021, the IASB issued Definition of Accounting Estimates (Amendments to IAS 8). The amendments will require the disclosure of material accounting policy information rather than disclosing significant accounting policies and clarifies how to distinguish changes in accounting policies from changes in accounting estimates. The amendments are effective for annual periods beginning on or after January 1, 2023. The Company intends to adopt this amendment in its Consolidated Financial Statements for the annual period beginning January 1, 2023. The extent of the impact of the adoption of this amendment has not yet been determined.
Disclosure Initiative – Accounting Policies (Amendments to IAS 1 and IFRS Practice Statement 2)
On February 12, 2021, the IASB issued Disclosure Initiative – Accounting Policies (Amendments to IAS 1 and IFRS Practice Statement 2 Making Materiality Judgements). The amendments help companies provide useful accounting policy disclosures. The amendments are effective for annual periods beginning on or after January 1, 2023. The Company intends to adopt this amendment in its
MANAGEMENT'S DISCUSSION AND ANALYSIS | Q3 2021 | MAPLE LEAF FOODS INC.
10

Consolidated Financial Statements for the annual period beginning January 1, 2023. The extent of the impact of the adoption of this amendment has not yet been determined.
Deferred Tax related to Assets and Liabilities arising from a Single Transaction (Amendments to IAS 12)
On May 7, 2021 the IASB issued Deferred Tax related to Assets and Liabilities arising from a Single Transaction (Amendments to IAS 12). The amendments narrowed the scope of the recognition exemption in paragraphs 15 and 24 of IAS 12 Income Taxes (recognition exemption) so that it no longer applies to transactions that, on initial recognition, give rise to equal taxable and deductible temporary differences. The amendments are effective for annual reporting periods beginning on or after January 1, 2023. The Company intends to adopt this amendment in its Consolidated Financial Statements for the annual period beginning January 1, 2023. The extent of the impact of the adoption of this amendment has not yet been determined.
All other IFRSs and amendments issued but not yet effective have been assessed by the Company and are not expected to have a material impact on the Consolidated Financial Statements.
18. INTERNAL CONTROLS OVER FINANCIAL REPORTING There has been no change in the Company’s internal control over financial reporting during the period beginning on July 1, 2021 and ended on September 30, 2021, that has materially affected, or is reasonably likely to materially affect, its internal control over financial reporting.
19. OUTLOOK AND LONG-TERM TARGETS Maple Leaf Foods is a leading consumer protein company, supported by an iconic portfolio of brands, a solid balance sheet and capital structure that provide financial flexibility. Over the last several years, the Company has developed a foundation to pursue compelling growth vectors across its business and to create value for all stakeholders.
In Plant Protein, the Company’s strategy has been to invest for growth in this market. In 2019, Maple Leaf Foods articulated its ambitious goal to achieve approximately $3 billion in sales in the Plant Protein Group by 2029, assuming a market size of approximately $25 billion. In that environment the Company would aspire to generate approximately 30% gross margin and SG&A expense (as a % of sales) in the low double-digit range. Long-term, achieving these targets is expected to result in Adjusted EBITDA Margins that exceed those in the Meat Protein Group. This will be driven by capitalizing on the high growth plant protein market, predominantly in the refrigerated space, leveraging Maple Leaf Foods’ established expertise in brand development and effective marketing, delivering on a pipeline of new product innovation to broaden and deepen its product portfolio and executing on a multi-tiered supply capacity strategy focused on capital stewardship. This includes leveraging its existing Plant Protein assets, utilizing footprint in the rest of its network, opportunistic partnerships with co-packing services, and development of new capacity, which includes the planned Indianapolis, Indiana tempeh processing facility.
Recent dynamics indicate that the plant protein category overall may be slowing down, prompting the Company to begin re-assessing its outlook for the category. The Company will be evaluating its investment thesis and strategy in the category and the long-term outlook of its Plant Protein group, based on the outcome of this analysis.
In Meat Protein, the Company’s strategy is to drive profitable growth. In 2017, Maple Leaf Foods articulated its target to reach an Adjusted EBITDA margin of 14% - 16% in 2022, while driving low single-digit organic revenue growth. This will be driven by:
• Growth in sustainable meats, including further establishing the business as a leading provider of Raised Without Antibiotics ("RWA") pork and poultry into Canadian and U.S. markets.
• Continued benefits from brand renovation strategies to accelerate volume growth and product mix-shift in branded prepared meats products.
• Focus on cost control through operational efficiencies.
2021 Outlook Throughout the COVID-19 pandemic, Maple Leaf Foods has remained focused on protecting its employees and ensuring continuity of its supply chain. As a result, the current environment does increase certain operating costs and potential for short-term processing disruptions to protect the health and safety of plant personnel. Continuing COVID-19 structural costs have been incorporated in the Company's 2021 operating plan.
MANAGEMENT'S DISCUSSION AND ANALYSIS | Q3 2021 | MAPLE LEAF FOODS INC.
11

Based on year-to-date performance and the Company's outlook for the balance of the year, Maple Leaf Foods expects to achieve the following in 2021:
Meat Protein Group - Driving Profitable Growth
• Mid-to-high single digit sales growth on a 52-week comparable basis, driven by continued momentum in sustainable meats, leveraging brand renovation, and growth into the U.S. market.
• Adjusted EBITDA margin expansion, progressing towards the 2022 target of 14% - 16%, driven by mix-shift benefits in prepared meats resulting from growth in sustainable meats and brand renovation, as well as operational efficiencies, while assuming pork complex conditions in-line with the 5-year average.
Plant Protein Group - Investing for Growth
• Gross margin is expected to be volatile in the near-term, as benefits from structural improvements in the supply chain may be impacted by investment opportunities to drive sales growth in a rapidly evolving market, as well as ongoing effects of COVID-19.
• SG&A expenses broadly in-line with 2020 levels, excluding any impact from fluctuations in foreign exchange, while declining as a percentage of sales as the Company leverages investments in advertising, promotion and marketing to elevate the Lightlife® and Field Roast™ brand renovations, drive innovation and build scale in the business.
• Driven largely by the lower than expected growth in the plant protein category, the Company does not expect to meet its sales growth target for the second half of 2021 and will not likely have a further view on near term sales growth targets until it has completed its reassessment of the category.
Capital
• The Company's capital expenditure estimate for the full year of 2021 remains unchanged and at the high end of the range of $550 million to $650 million, with approximately 75% to be comprised of Construction Capital. A significant portion of the Construction Capital is related to the London, Ontario poultry facility, the plant protein facility in Indianapolis, Indiana and the expansion of the Bacon Centre of Excellence in Winnipeg, Manitoba.
Factors that could have an impact on the business, which cannot be estimated or controlled due to the COVID-19 pandemic, include:
• Volatility in the pork and poultry commodity and foreign exchange markets.
• Inflationary cost pressures.
• Disruptions in the global supply chain.
• Availability of labour.
• The balance between retail and foodservice demand.
• Potential future production disruptions or shutdowns.
• The duration of government measures, including social distancing.
In addition to financial and operational priorities, Maple Leaf Foods believes that shared value and operating its business for the benefit of all stakeholders is crucial. The Company’s guiding pillars to be the “Most Sustainable Protein Company on Earth” include Better Food, Better Care, Better Communities, Better Planet and are core to how Maple Leaf Foods conducts itself. To that end, the Company’s priorities include:
• Better Food - leading the real food movement and transitioning key brands to 100% “raised without antibiotics”.
• Better Care - further advancement of animal care, including progress towards transitioning all sows under management to open housing systems by 2022.
• Better Communities - investing approximately 1% of pre-tax profit to advance sustainable food security.
• Better Planet - continuing to amplify its commitment to carbon neutrality, while focusing on eliminating waste in any resources it consumes, including food, energy, water, packaging, and time.
20. NON-IFRS FINANCIAL MEASURES The Company uses the following non-IFRS measures: Adjusted Operating Earnings, Adjusted Earnings per Share, Adjusted EBITDA, Adjusted EBITDA Margin, Construction Capital, Net Debt, Free Cash Flow and Return on Net Assets. Management believes that these non-IFRS measures provide useful information to investors in measuring the financial performance of the Company for the reasons outlined below. These measures do not have a standardized meaning prescribed by IFRS and therefore they may not be comparable to similarly titled measures presented by other publicly traded companies and should not be construed as an alternative to other financial measures determined in accordance with IFRS.
MANAGEMENT'S DISCUSSION AND ANALYSIS | Q3 2021 | MAPLE LEAF FOODS INC.
12
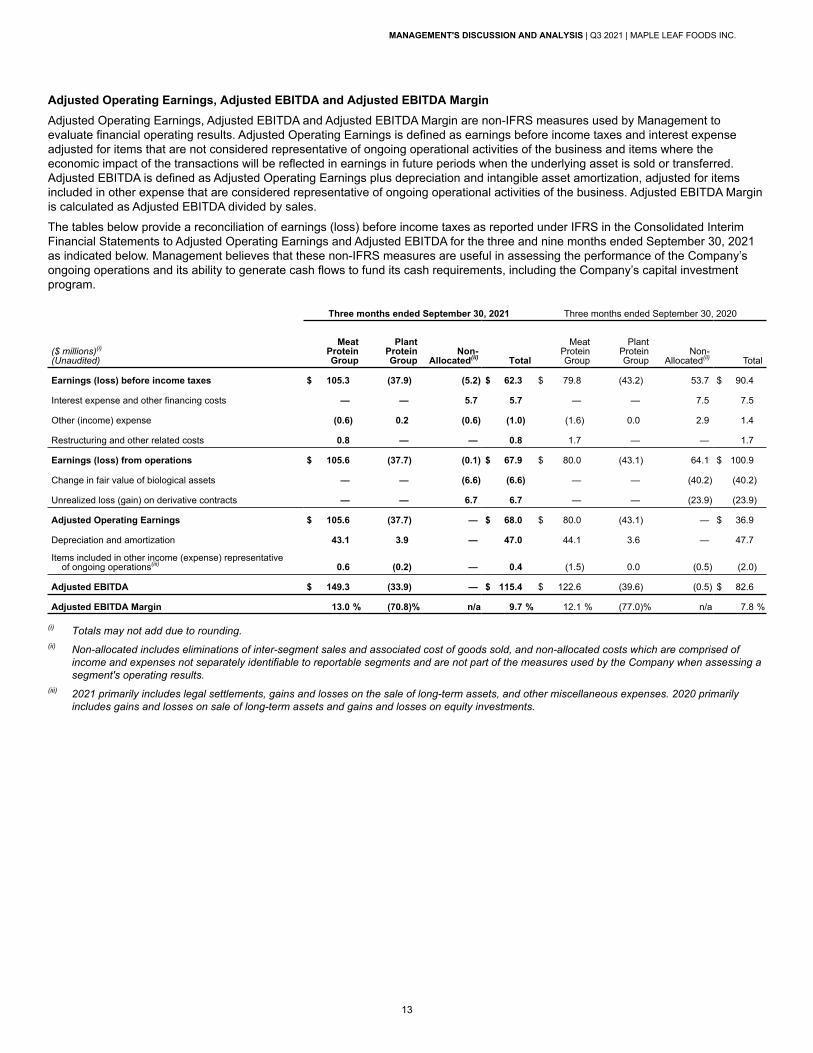
Adjusted Operating Earnings, Adjusted EBITDA and Adjusted EBITDA Margin
Adjusted Operating Earnings, Adjusted EBITDA and Adjusted EBITDA Margin are non-IFRS measures used by Management to evaluate financial operating results. Adjusted Operating Earnings is defined as earnings before income taxes and interest expense adjusted for items that are not considered representative of ongoing operational activities of the business and items where the economic impact of the transactions will be reflected in earnings in future periods when the underlying asset is sold or transferred. Adjusted EBITDA is defined as Adjusted Operating Earnings plus depreciation and intangible asset amortization, adjusted for items included in other expense that are considered representative of ongoing operational activities of the business. Adjusted EBITDA Margin is calculated as Adjusted EBITDA divided by sales.
The tables below provide a reconciliation of earnings (loss) before income taxes as reported under IFRS in the Consolidated Interim Financial Statements to Adjusted Operating Earnings and Adjusted EBITDA for the three and nine months ended September 30, 2021 as indicated below. Management believes that these non-IFRS measures are useful in assessing the performance of the Company’s ongoing operations and its ability to generate cash flows to fund its cash requirements, including the Company’s capital investment program.
Three months ended September 30, 2021 Three months ended September 30, 2020
($ millions)(i)
(Unaudited)
Meat Protein Group
Plant Protein Group
Non-Allocated(ii) Total
Meat Protein Group
Plant Protein Group
Non-Allocated(ii) Total
Earnings (loss) before income taxes $ 105.3 (37.9) (5.2) $ 62.3 $ 79.8 (43.2) 53.7 $ 90.4
Interest expense and other financing costs — — 5.7 5.7 — — 7.5 7.5
Other (income) expense (0.6) 0.2 (0.6) (1.0) (1.6) 0.0 2.9 1.4
Restructuring and other related costs 0.8 — — 0.8 1.7 — — 1.7
Earnings (loss) from operations $ 105.6 (37.7) (0.1) $ 67.9 $ 80.0 (43.1) 64.1 $ 100.9
Change in fair value of biological assets — — (6.6) (6.6) — — (40.2) (40.2)
Unrealized loss (gain) on derivative contracts — — 6.7 6.7 — — (23.9) (23.9)
Adjusted Operating Earnings $ 105.6 (37.7) — $ 68.0 $ 80.0 (43.1) — $ 36.9
Depreciation and amortization 43.1 3.9 — 47.0 44.1 3.6 — 47.7
Items included in other income (expense) representative of ongoing operations(iii) 0.6 (0.2) — 0.4 (1.5) 0.0 (0.5) (2.0)
Adjusted EBITDA $ 149.3 (33.9) — $ 115.4 $ 122.6 (39.6) (0.5) $ 82.6
Adjusted EBITDA Margin 13.0 % (70.8) % n/a 9.7 % 12.1 % (77.0) % n/a 7.8 %
(i) Totals may not add due to rounding. (ii) Non-allocated includes eliminations of inter-segment sales and associated cost of goods sold, and non-allocated costs which are comprised of
income and expenses not separately identifiable to reportable segments and are not part of the measures used by the Company when assessing a segment's operating results.
(iii) 2021 primarily includes legal settlements, gains and losses on the sale of long-term assets, and other miscellaneous expenses. 2020 primarily includes gains and losses on sale of long-term assets and gains and losses on equity investments.
MANAGEMENT'S DISCUSSION AND ANALYSIS | Q3 2021 | MAPLE LEAF FOODS INC.
13

Nine months ended September 30, 2021 Nine months ended September 30, 2020
($ millions)(i)
(Unaudited)
Meat Protein Group
Plant Protein Group
Non-Allocated(ii) Total
Meat Protein Group
Plant Protein Group
Non-Allocated(ii) Total
Earnings (loss) before income taxes $ 268.3 (96.2) (29.6) $ 142.4 $ 240.8 (93.5) (22.8) $ 124.5
Interest expense and other financing costs — — 16.4 16.4 — — 23.4 23.4
Other (income) expense (1.4) 0.4 8.3 7.2 (1.8) 0.1 9.6 7.9
Restructuring and other related costs 3.7 — — 3.7 3.1 — — 3.1
Earnings (loss) from operations $ 270.5 (95.8) (5.0) $ 169.7 $ 242.1 (93.5) 10.2 $ 158.9
Change in fair value of biological assets — — 6.8 6.8 — — 1.2 1.2
Unrealized gain on derivative contracts — — (1.8) (1.8) — — (11.4) (11.4)
Adjusted Operating Earnings $ 270.5 (95.8) — $ 174.7 $ 242.1 (93.5) — $ 148.7
Depreciation and amortization 134.4 11.3 — 145.7 131.1 10.9 — 141.9
Items included in other income (expense) representative of ongoing operations(iii) (2.6) (0.4) — (2.9) (1.3) (0.1) (0.5) (1.8)
Adjusted EBITDA $ 402.3 (84.8) — $ 317.5 $ 371.9 (82.7) (0.5) $ 288.8
Adjusted EBITDA Margin 12.3% (61.2) % n/a 9.3% 12.2% (52.2) % n/a 9.1%
(i) Totals may not add due to rounding. (ii) Non-allocated includes eliminations of inter-segment sales and associated cost of goods sold, and non-allocated costs which are comprised of
income and expenses not separately identifiable to reportable segments and are not part of the measures used by the Company when assessing a segment's operating results.
(iii) 2021 primarily includes legal settlements, gains and losses on the sale of long-term assets, and other miscellaneous expenses. 2020 primarily includes insurance settlements, gains and losses on sale of long-term assets and gains and losses on equity investments.
Adjusted Earnings per Share Adjusted Earnings per Share, a non-IFRS measure, is used by Management to evaluate financial operating results. It is defined as basic earnings per share and is adjusted on the same basis as Adjusted Operating Earnings. The table below provides a reconciliation of basic earnings per share as reported under IFRS in the Consolidated Interim Financial Statements to Adjusted Earnings per Share for the three and nine months ended September 30, as indicated below. Management believes this basis is the most appropriate on which to evaluate financial results as they are representative of the ongoing operations of the Company.
Basic earnings per share $ 0.36 $ 0.54 $ 0.82 $ 0.72 Restructuring and other related costs(i) 0.01 0.01 0.02 0.02 Items included in other expense not considered
representative of ongoing operations(ii) — — 0.03 0.05 Change in fair value of biological assets (0.04) (0.24) 0.04 0.01 Change in unrealized fair value on derivatives 0.04 (0.14) (0.01) (0.07) Adjusted Earnings per Share(iii) $ 0.36 $ 0.17 $ 0.90 $ 0.73
($ per share)(Unaudited)
Three months ended September 30, Nine months ended September 30,2021 2020 2021 2020
(i) Includes per share impact of restructuring and other related costs, net of tax.(ii) Primarily includes legal fees and provisions and transaction related costs, net of tax.(iii) Totals may not add due to rounding.
MANAGEMENT'S DISCUSSION AND ANALYSIS | Q3 2021 | MAPLE LEAF FOODS INC.
14

Construction CapitalConstruction Capital, a non-IFRS measure, is used by Management to evaluate the amount of capital resources invested in specific strategic development projects that are not yet operational. It is defined as investments and related financing charges in projects over $50.0 million that are related to longer-term strategic initiatives, with no returns expected for at least 12 months from commencement of construction and the asset will be re-categorized from Construction Capital once operational. Current strategic initiatives primarily include investments in the London, Ontario poultry production facility, the expansion of the Bacon Centre of Excellence in Winnipeg, Manitoba, investments in plant protein capacity at the Walker Drive facility in Brampton, Ontario, and the plant protein production facilities in Indiana. The following table is a summary of Construction Capital activity and debt financing for the periods indicated below.
($ thousands)(Unaudited) 2021 2020
Total property, plant, and equipment and intangibles at January 1 $ 2,062,683 $ 1,739,195
Other capital and intangible assets at January 1(i) 1,622,094 1,632,365
Construction Capital at January 1 $ 440,589 $ 106,830
Additions(ii) 152,342 57,797
Construction Capital at March 31 $ 592,931 $ 164,627
Additions(ii) 127,822 64,357
Construction Capital at June 30 $ 720,753 $ 228,984
Additions(ii) 123,321 74,036
Construction Capital at September 30(iii) $ 844,074 $ 303,020
Other capital and intangible assets at September 30(i) 1,640,047 1,625,220
Total property, plant, and equipment and Intangibles at September 30 $ 2,484,121 $ 1,928,240
Construction Capital debt financing(iv) $ 821,110 $ 296,980
(i) Other capital and intangible assets consists of property and equipment and intangibles that do not meet the definition of Construction Capital.(ii) Certain comparatives figures have been restated to conform with current year presentation. (iii) As at September 30, 2021, the net book value of construction capital includes $3.2 million related to intangible assets (September 30, 2020: $0.6
million; December 31, 2020: $1.2 million).(iv) Assumed to be fully funded by debt to the extent that the Company has Net Debt outstanding. Construction Capital debt financing excludes interest
paid and capitalized.
Net Debt The following table reconciles Net Debt to amounts reported under IFRS in the Company's Consolidated Interim Financial Statements as at September 30, as indicated below. The Company calculates Net Debt as cash and cash equivalents, less long-term debt and bank indebtedness. Management believes this measure is useful in assessing the amount of financial leverage employed.
2021 2020Cash and cash equivalents $ 73,468 $ 178,190 Current portion of long-term debt $ (5,279) $ (937) Long-term debt (1,157,736) (712,147) Total debt $ (1,163,015) $ (713,084) Net Debt $ (1,089,547) $ (534,894)
($ thousands)(Unaudited)
As at September 30,
MANAGEMENT'S DISCUSSION AND ANALYSIS | Q3 2021 | MAPLE LEAF FOODS INC.
15

Free Cash Flow Free Cash Flow, a non-IFRS measure, is used by Management to evaluate cash flow after investing in the maintenance or expansion of the Company's asset base. It is defined as cash provided by operations, less cash additions to long-term assets and capitalized interest. The following table calculates Free Cash Flow for the periods indicated below:
($ thousands)(Unaudited)
Three months ended September 30, Nine months ended September 30,2021 2020 2021 2020
Cash provided by operating activities $ 136,764 $ 135,202 $ 136,501 $ 236,544 Additions to long-term assets (136,346) (75,167) (458,586) (253,085) Interest paid and capitalized(i) (5,916) (2,235) (14,525) (5,246) Free Cash Flow $ (5,498) $ 57,800 $ (336,610) $ (21,787)
(i) Certain comparatives figures have been restated to conform with current year presentations.
Return on Net Assets Return on Net Assets ("RONA") is calculated by dividing tax effected earnings from operations (adjusted for items which are not considered representative of the underlying operations of the business) by average monthly net assets. Net assets are defined as total assets (excluding cash and deferred tax assets) less non-interest bearing liabilities (excluding deferred tax liabilities). Management believes that RONA is an appropriate basis upon which to evaluate long-term financial performance.
21. FORWARD-LOOKING STATEMENTS This document contains, and the Company’s oral and written public communications often contain, “forward-looking information” within the meaning of applicable securities law. These statements are based on current expectations, estimates, projections, beliefs, judgments and assumptions based on information available at the time the applicable forward-looking statement was made and in light of the Company’s experience combined with its perception of historical trends. Such statements include, but are not limited to, statements with respect to objectives and goals, in addition to statements with respect to beliefs, plans, targets, goals, objectives, expectations, anticipations, estimates, and intentions. Forward-looking statements are typically identified by words such as "anticipate", "continue", "estimate", "expect", "may", "will", "project", "should", "could", "would", "believe", "plan", "intend", "design", "target", "undertake", "view", "indicate", "maintain", "explore", "entail", "schedule", "objective", "strategy", "likely", "potential", "outlook", "aim", "propose", "goal", and similar expressions suggesting future events or future performance. These statements are not guarantees of future performance and involve assumptions, risks and uncertainties that are difficult to predict.
By their nature, forward-looking statements involve known and unknown risks, uncertainties and other factors that may cause actual results or events to differ materially from those anticipated in such forward-looking statements. The Company believes the expectations reflected in the forward-looking statements are reasonable, but no assurance can be given that these expectations will prove to be correct and such forward-looking statements should not be unduly relied upon.
Specific forward-looking information in this document may include, but is not limited to, statements with respect to:
• implications of COVID-19, including implications for supply chain, workforce availability and consumption patterns;
• future performance, including future financial objectives, goals and targets, expected capital spend and expected SG&A expenditures for the Company and each of its operating segments;
• the execution of the Company's business strategy, including the development and expected timing of business initiatives, brand expansion and repositioning, and other growth opportunities, as well as the impact thereof;
• the impact of international trade conditions on the Company's business, including access to markets, implications associated with the spread of foreign animal disease (such as African Swine Fever ("ASF")), and other social, economic and political factors that affect trade;
• competitive conditions and the Company's ability to position itself competitively in the markets in which it competes;
• capital projects, including planning, construction, estimated expenditures, schedules, approvals, expected capacity, in-service dates and anticipated benefits of construction of new facilities and expansions of existing facilities;
• the Company's dividend policy, including future levels and sustainability of cash dividends, the tax treatment thereof and future dividend payment dates;
• the impact of commodity prices on the Company's operations and financial performance, including the use and effectiveness of hedging instruments;
• expected future cash flows and the sufficiency thereof, sources of capital at attractive rates, future contractual obligations, future financing options, renewal of credit facilities, and availability of capital to fund growth plans, operating obligations and dividends;
MANAGEMENT'S DISCUSSION AND ANALYSIS | Q3 2021 | MAPLE LEAF FOODS INC.
16

• operating risks, including the execution, monitoring and continuous improvement of the Company's food safety programs, animal health initiatives and cost reduction initiatives;
• the implementation, cost and impact of environmental sustainability initiatives, as well as the anticipated future cost of remediating environmental liabilities;
• the adoption of new accounting standards and the impact of such adoption on the financial position of the Company;
• expectations regarding pension plan performance, including future pension plan assets, liabilities and contributions; and
• developments and implications of actual or potential legal actions.
Various factors or assumptions are typically applied by the Company in drawing conclusions or making the forecasts, projections, predictions or estimations set out in the forward-looking statements. These factors and assumptions are based on information currently available to the Company, including information obtained by the Company from third-party sources and include but are not limited to the following:
• expectations regarding the impact and future implications of COVID-19 and adaptations in operations, customer and consumer behaviour, economic patterns and international trade;
• the competitive environment, associated market conditions and market share metrics, category growth or contraction, the expected behaviour of competitors and customers and trends in consumer preferences;
• the success of the Company's business strategy, including execution of the strategy in each of the Meat Protein and Plant Protein Groups;
• prevailing commodity prices, interest rates, tax rates and exchange rates;
• the economic condition of and the socio-political dynamics between Canada, the U.S., Japan and China, and the ability of the Company to access markets in these countries;
• the spread of foreign animal disease (including ASF), preparedness strategies to manage such spread, and implications for all protein markets;
• the availability of capital to fund future capital requirements associated with existing operations, assets and projects;
• expectations regarding participation in and funding of the Company's pension plans;
• the availability of insurance coverage to manage certain liability exposures;
• the extent of future liabilities and recoveries related to legal claims;
• prevailing regulatory, tax and environmental laws; and
• future operating costs and performance, including the Company's ability to achieve operating efficiencies and maintain high sales volumes, high turnover of inventories and high turnover of accounts receivable.
Readers are cautioned that these assumptions may prove to be incorrect in whole or in part. The Company's actual results may differ materially from those anticipated in any forward-looking statements.
Factors that could cause actual results or outcomes to differ materially from the results expressed, implied, or projected in the forward-looking statements contained in this document include, among other things, risks associated with the following:
• implications of COVID-19 on the operations and financial performance of the Company, as well the implications for macro socio-economic trends;
• competition, market conditions and the activities of competitors and customers, including the expansion or contraction of key categories (including plant protein);
• the health status of livestock, including the impact of potential pandemics;
• international trade and access to markets, as well as social, political and economic dynamics affecting same;
• availability of and access to capital;
• decision respecting the return of capital to shareholders;
• the execution of capital projects, including cost, schedule and regulatory variables;
• food safety, consumer liability and product recalls;
• cyber security and the maintenance and operation of the Company’s information systems and processes;
• acquisitions and divestitures;
• climate change;
• fluctuations in the debt and equity markets;
MANAGEMENT'S DISCUSSION AND ANALYSIS | Q3 2021 | MAPLE LEAF FOODS INC.
17

• fluctuations in interest rates and currency exchange rates;
• pension assets and liabilities;
• cyclical nature of the cost and supply of hogs and the competitive nature of the pork market generally;
• the effectiveness of commodity and interest rate hedging strategies;
• impact of changes in the market value of the biological assets and hedging instruments;
• the supply management system for poultry in Canada;
• availability of plant protein ingredients;
• intellectual property, including product innovation, product development, brand strategy and trademark protection;
• consolidation of operations and focus on protein;
• the use of contract manufacturers;
• reputation;
• weather;
• compliance with government regulation and adapting to changes in laws;
• actual and threatened legal claims;
• consumer trends and changes in consumer tastes and buying patterns;
• environmental regulation and potential environmental liabilities;
• consolidation in the retail environment;
• employment matters, including complying with employment laws across multiple jurisdictions, the potential for work stoppages due to non-renewal of collective agreements, recruiting and retaining qualified personnel, reliance on key personnel and succession planning;
• pricing of products;
• managing the Company’s supply chain;
• changes in International Financial Reporting Standards and other accounting standards that the Company is required to adhere to for regulatory purposes; and
• other factors as set out under the heading "Risk Factors" in the Company's Management Discussion and Analysis for the year ended December 31, 2020.
The Company cautions readers that the foregoing list of factors is not exhaustive.
Readers are further cautioned that some of the forward-looking information, such as statements concerning future capital expenditures, Adjusted EBITDA Margin growth in the Meat Protein Group, expected sales and growth margin targets in the Plant Protein Group and SG&A spend, may be considered to be financial outlooks for purposes of applicable securities legislation. These financial outlooks are presented to evaluate potential future earnings and anticipated future uses of cash flows and may not be appropriate for other purposes. Readers should not assume these financial outlooks will be achieved.
More information about risk factors can be found under the heading “Risk Factors” in the Company's Annual Management's Discussion and Analysis for the year ended December 31, 2020, that is available on SEDAR at www.sedar.com. The reader should review such section in detail. Additional information concerning the Company, including the Company’s Annual Information Form, is available on SEDAR at www.sedar.com.
All forward-looking statements included herein speak only as of the date hereof. Unless required by law, the Company does not undertake any obligation to publicly update or revise any forward-looking statements, whether as a result of new information, future events or otherwise. All forward-looking statements contained herein are expressly qualified by this cautionary statement.
22. ABOUT MAPLE LEAF FOODS INC.Maple Leaf Foods is a carbon neutral company with a vision to be the most sustainable protein company on earth, responsibly producing food products under leading brands including Maple Leaf®, Maple Leaf Prime®, Maple Leaf Natural Selections®, Schneiders®, Schneiders® Country Naturals®, Mina®, Greenfield Natural Meat Co.®, Lightlife® and Field Roast™. The Company employs approximately 13,500 people and does business primarily in Canada, the U.S. and Asia. The Company is headquartered in Mississauga, Ontario and its shares trade on the Toronto Stock Exchange (MFI).
MANAGEMENT'S DISCUSSION AND ANALYSIS | Q3 2021 | MAPLE LEAF FOODS INC.
18

Consolidated Interim Balance Sheets 20Consolidated Interim Statements of Net Earnings 21Consolidated Interim Statements of Other Comprehensive Income (Loss) 22Consolidated Interim Statements of Changes in Total Equity 23Consolidated Interim Statements of Cash Flows 24Notes to the Consolidated Interim Financial Statements
1 The Company 252 Significant Accounting Policies 253 Accounts Receivable 264 Inventories 275 Biological Assets 276 Provisions 287 Long-Term Debt 298 Share Capital 309 Financial Instruments 3110 Interest Expense and Other Financing Costs 3311 Earnings Per Share 3312 Share-Based Payment 3413 Segmented Financial Information 3614 Related Party Transactions 3815 Business Combinations 38
TABLE OF CONTENTS | Q3 2021 | MAPLE LEAF FOODS INC.
Consolidated Interim Financial Statements
19

ASSETS (Audited)Current assets
Cash and cash equivalents $ 73,468 $ 178,190 $ 100,828 Accounts receivable 3 200,544 136,827 159,750 Notes receivable 3 69,455 32,107 31,550 Inventories 4 432,502 401,339 398,070 Biological assets 5 131,257 121,828 125,648 Income taxes recoverable 1,830 — 1,830 Prepaid expenses and other assets 34,373 50,156 64,517 Assets held for sale — 734 575
$ 943,429 $ 921,181 $ 882,768 Property and equipment 2,110,055 1,576,653 1,721,487 Right-of-use assets 173,879 230,771 222,705 Investments 22,731 16,398 15,910 Other long-term assets 9,304 10,121 9,568 Deferred tax asset 31,822 5,900 14,070 Goodwill 651,295 661,599 652,501 Intangible assets 374,066 351,587 341,196 Total assets $ 4,316,581 $ 3,774,210 $ 3,860,205
LIABILITIES AND EQUITYCurrent liabilities
Accounts payable and accruals $ 531,703 $ 468,113 $ 501,529 Current portion of provisions 6 773 2,710 1,529 Current portion of long-term debt 7 5,279 937 900 Current portion of lease obligations 38,664 41,797 79,601 Income taxes payable 31,592 3,482 27,639 Other current liabilities 56,966 35,572 55,849
$ 664,977 $ 552,611 $ 667,047 Long-term debt 7 1,157,736 712,147 745,048 Lease obligations 149,475 207,072 160,636 Employee benefits 91,063 183,563 188,946 Provisions 6 44,504 43,773 44,230 Other long-term liabilities 4,742 18,303 11,918 Deferred tax liability 137,030 117,622 109,916 Total liabilities $ 2,249,527 $ 1,835,091 $ 1,927,741
Shareholders’ equityShare capital 8 $ 847,013 $ 845,986 $ 838,969 Retained earnings 1,234,975 1,121,233 1,124,973 Contributed surplus 11,694 8,708 5,866 Accumulated other comprehensive loss (7,890) (12,878) (13,414) Treasury stock (18,738) (23,930) (23,930) Total shareholders’ equity $ 2,067,054 $ 1,939,119 $ 1,932,464 Total liabilities and equity $ 4,316,581 $ 3,774,210 $ 3,860,205
(In thousands of Canadian dollars)(Unaudited) Notes
As at September 30,2021
As at September 30,2020
As at December 31,2020
See accompanying Notes to the Consolidated Interim Financial Statements.
CONSOLIDATED INTERIM BALANCE SHEETS | Q3 2021 | MAPLE LEAF FOODS INC.
Consolidated Interim Balance Sheets
20

Sales $ 1,188,643 $ 1,057,169 $ 3,400,587 $ 3,174,510 Cost of goods sold 1,000,485 829,055 2,883,819 2,651,723 Gross profit $ 188,158 $ 228,114 $ 516,768 $ 522,787 Selling, general and administrative expenses 120,263 127,165 347,067 363,899 Earnings before the following: $ 67,895 $ 100,949 $ 169,701 $ 158,888 Restructuring and other related costs 6 840 1,732 3,698 3,070 Other (income) expense (965) 1,378 7,194 7,866 Earnings before interest and income taxes $ 68,020 $ 97,839 $ 158,809 $ 147,952 Interest expense and other financing costs 10 5,683 7,474 16,362 23,434 Earnings before income taxes $ 62,337 $ 90,365 $ 142,447 $ 124,518 Income tax expense 17,858 24,389 41,502 36,595 Net earnings $ 44,479 $ 65,976 $ 100,945 $ 87,923
Earnings per share attributable to common shareholders: 11
Basic earnings per share $ 0.36 $ 0.54 $ 0.82 $ 0.72 Diluted earnings per share $ 0.35 $ 0.53 $ 0.80 $ 0.71
Weighted average number of shares (millions): 11Basic 123.5 123.2 123.4 123.2 Diluted 125.5 124.6 125.7 124.3
(In thousands of Canadian dollars, except share amounts)(Unaudited)
Three months ended September 30, Nine months ended September 30,
Notes 2021 2020 2021 2020
See accompanying Notes to the Consolidated Interim Financial Statements.
CONSOLIDATED INTERIM STATEMENTS OF NET EARNINGS | Q3 2021 | MAPLE LEAF FOODS INC.
Consolidated Interim Statements of Net Earnings
21

Net earnings $ 44,479 $ 65,976 $ 100,945 $ 87,923 Other comprehensive income (loss)
Actuarial gains (losses) that will not be reclassified to profit or loss (Net of tax of $0.9 million and $25.8 million; 2020:
$0.2 million and $15.4 million) $ 2,556 $ (677) $ 75,717 $ (44,963) Items that are or may be reclassified subsequently to profit or loss:
Change in fair value of investments (Net of tax of $1.0 million and $1.0 million; 2020: $0.0 million and $0.0 million) $ 2,945 $ — $ 2,945 $ —
Change in accumulated foreign currency translation adjustment (Net of tax of $0.0 million and $0.0 million;
2020: $0.0 million and $0.0 million) 6,267 (4,885) (3,883) 8,652
Change in foreign exchange on long-term debt designated as a net investment hedge (Net of tax of $1.1 million and
$0.4 million; 2020: $0.8 million and $1.2 million) (5,456) 4,413 1,826 (6,887) Change in cash flow hedges (Net of tax of $0.7 million and
$1.7 million; 2020: $0.5 million and $6.1 million) (2,157) 1,383 4,636 (17,436) Total items that are or may be reclassified subsequently to profit or loss $ 1,599 $ 911 $ 5,524 $ (15,671) Total other comprehensive income (loss) $ 4,155 $ 234 $ 81,241 $ (60,634) Comprehensive income $ 48,634 $ 66,210 $ 182,186 $ 27,289
(In thousands of Canadian dollars)(Unaudited)
Three months ended September 30, Nine months ended September 30,
2021 2020 2021 2020
See accompanying Notes to the Consolidated Interim Financial Statements.
CONSOLIDATED INTERIM STATEMENTS OF OTHER COMPREHENSIVE INCOME (LOSS) | Q3 2021 | MAPLE LEAF FOODS INC.
Consolidated Interim Statements of Other Comprehensive Income (Loss)
22

(In thousands of Canadian dollars)(Unaudited) Notes
Sharecapital
Retained earnings
Contributed surplus
Foreign currency
translation adjustment
Unrealized gains and losses on cash flow
hedges
Unrealized gains on fair
value of investments
Treasury stock
Totalequity
Balance at December 31, 2020 $ 838,969 1,124,973 5,866 3,002 (16,416) — (23,930) $ 1,932,464
Net earnings — 100,945 — — — — — 100,945 Other comprehensive income
(loss)(ii) — 75,717 — (2,057) 4,636 2,945 — 81,241 Dividends declared ($0.54 per share) — (66,660) — — — — — (66,660) Share-based compensation expense 12 — — 17,738 — — — — 17,738 Deferred taxes on share-based compensation — — (450) — — — — (450)
Exercise of stock options 8,711 — — — — — — 8,711 Settlement of share-based compensation — — (9,679) — — — 5,192 (4,487) Change in obligation for repurchase of shares 8 (667) — (1,781) — — — — (2,448)
Balance at September 30, 2021 $ 847,013 1,234,975 11,694 945 (11,780) 2,945 (18,738) $ 2,067,054
Accumulated other comprehensive income (loss)(i)
(In thousands of Canadian dollars)(Unaudited) Notes
Sharecapital
Retained earnings
Contributed surplus
Foreign currency
translation adjustment
Unrealized gains and losses on cash flow
hedges
Unrealized gains on fair
value of investments
Treasury stock
Totalequity
Balance at December 31, 2019 $ 840,005 1,137,450 — 4,274 (1,481) — (30,378) $ 1,949,870
Net earnings — 87,923 — — — — — 87,923 Other comprehensive income
(loss)(ii) — (44,963) — 1,765 (17,436) — — (60,634) Dividends declared ($0.48 per share) — (59,177) — — — — — (59,177) Share-based compensation expense 12 — — 12,161 — — — — 12,161 Deferred taxes on share-based compensation — — 400 — — — — 400
Exercise of stock options 1,012 — — — — — — 1,012 Settlement of share-based compensation — — (9,738) — — — 6,448 (3,290) Change in obligation for repurchase of shares 4,969 — 5,885 — — — — 10,854
Balance at September 30, 2020 $ 845,986 1,121,233 8,708 6,039 (18,917) — (23,930) $ 1,939,119
Accumulated other comprehensive income (loss)(i)
(i) Items that are or may be subsequently reclassified to profit or loss. (ii) Included in other comprehensive income (loss) is the change in actuarial gains and losses that will not be reclassified to profit or loss and has been
reclassified to retained earnings.
See accompanying Notes to the Consolidated Interim Financial Statements.
CONSOLIDATED INTERIM STATEMENTS OF CHANGES IN TOTAL EQUITY | Q3 2021 | MAPLE LEAF FOODS INC.
Consolidated Interim Statements of Changes in Total Equity
23

Notes 2021 2020(i) 2021 2020(i)
CASH PROVIDED BY (USED IN):Operating activities
Net earnings $ 44,479 $ 65,976 $ 100,945 $ 87,923 Add (deduct) items not affecting cash:
Change in fair value of biological assets 5 (6,630) (40,176) 6,779 1,159 Depreciation and amortization 47,800 48,699 148,201 145,242 Share-based compensation 12 8,509 4,320 17,738 12,161 Deferred income taxes (7,824) 19,432 (17,694) 12,535 Income tax current 25,682 4,957 59,196 24,060 Interest expense and other financing costs 10 5,683 7,474 16,362 23,434 Loss (gain) on sale of long-term assets 1,226 (2,724) 1,919 (2,158) Asset impairment — (18) 436 1,554 Change in fair value of non-designated derivatives 6,042 (23,693) (2,375) (11,027)
Change in net pension obligation 3,620 2,059 3,594 6,478 Net income taxes paid (10,545) (12,807) (57,248) (21,151) Interest paid, net of capitalized interest 10 (5,373) (8,536) (16,766) (23,108) Change in provision for restructuring and other related costs 6 (156) (90) (224) (2,776) Change in derivatives margin 4,888 19,194 4,492 7,400 Other (4,631) 3,386 (5,989) 4,905 Change in non-cash operating working capital 23,994 47,749 (122,865) (30,087)
Cash provided by operating activities $ 136,764 $ 135,202 $ 136,501 $ 236,544 Investing activities
Additions to long-term assets $ (136,346) $ (75,167) $ (458,586) $ (253,085) Interest paid and capitalized 10 (5,916) (2,235) (14,525) (5,246) Acquisition of business 15 (1,777) — (41,928) — Proceeds from sale of long-term assets — 36,846 768 36,854 Purchase of investments (3,184) (100) (3,184) (14,053) Proceeds from legal settlement 20,822 — 20,822 —
Cash used in investing activities $ (126,401) $ (40,656) $ (496,633) $ (235,530) Financing activities
Dividends paid $ (22,285) $ (19,871) $ (66,660) $ (59,177) Net increase in long-term debt 7 29,333 1,018 419,055 165,740 Payment of lease obligation (9,125) (8,971) (27,806) (27,085) Exercise of stock options 6,782 239 8,711 1,012 Payment of financing fees (478) — (528) (599)
Cash provided by (used in) financing activities $ 4,227 $ (27,585) $ 332,772 $ 79,891 Increase (decrease) in cash and cash equivalents $ 14,590 $ 66,961 $ (27,360) $ 80,905 Cash and cash equivalents, beginning of period 58,878 111,229 100,828 97,285 Cash and cash equivalents, end of period $ 73,468 $ 178,190 $ 73,468 $ 178,190
(In thousands of Canadian dollars)(Unaudited)
Three months ended September 30, Nine months ended September 30,
(i) Certain comparative figures have been restated to conform with current year presentation.
See accompanying Notes to the Consolidated Interim Financial Statements.
CONSOLIDATED INTERIM STATEMENTS OF CASH FLOWS | Q3 2021 | MAPLE LEAF FOODS INC.
Consolidated Interim Statements of Cash Flows
24

Three and Nine Months Ended September 30, 2021 and 2020
1. THE COMPANY Maple Leaf Foods Inc. (“Maple Leaf Foods” or the "Company") is a company with a vision to be the most sustainable protein company on earth, responsibly producing food products under leading brands including Maple Leaf®, Maple Leaf Prime®, Maple Leaf Natural Selections®, Schneiders®, Schneiders® Country Naturals®, Mina®, Greenfield Natural Meat Co.®, Lightlife® and Field Roast™. The Company's portfolio includes prepared meats, ready-to-cook and ready-to-serve meals, snacks kits, valued-added fresh pork and poultry, and plant protein products. The address of the Company's registered office is 6985 Financial Dr., Mississauga, Ontario, L5N 0A1, Canada. The unaudited condensed consolidated interim financial statements ("Consolidated Interim Financial Statements") of the Company as at and for the three and nine months ended September 30, 2021 include the accounts of the Company and its subsidiaries. The Company's results are organized into two segments: the Meat Protein Group and the Plant Protein Group.
2. SIGNIFICANT ACCOUNTING POLICIES The Consolidated Interim Financial Statements should be read in conjunction with the Company’s 2020 annual audited consolidated financial statements ("2020 Consolidated Financial Statements").
(a) Statement of Compliance The Consolidated Interim Financial Statements have been prepared in accordance with International Accounting Standard (“IAS”) 34 Interim Financial Reporting ("IAS 34") as issued by the International Accounting Standards Board (“IASB”) and using the accounting policies, determination of significant estimates and judgments, and corresponding accounting treatments consistent with the Company’s 2020 Consolidated Financial Statements, except for new standards adopted during the nine months ended September 30, 2021 as described below.
The Consolidated Interim Financial Statements were authorized for issue by the Board of Directors on November 3, 2021.
(b) Accounting Standards Adopted During the Period Beginning on January 1, 2021, the Company adopted certain International Financial Reporting Standards ("IFRS") and amendments. As required by IAS 34 and IAS 8 Accounting Policies, Changes in Accounting Estimates and Errors, the nature and the effect of these changes are disclosed below:
Interest Rate Benchmark Reform - Phase 2
Beginning January 1, 2021, the Company adopted the amendments to IFRS 9 Financial Instruments ("IFRS 9"), IAS 39 Financial Instruments: Recognition and Measurement ("IAS 39"), IFRS 7 Financial Instruments: Disclosures ("IFRS 7"), IFRS 4 Insurance Contracts ("IFRS 4") and IFRS 16 Leases ("IFRS 16") to address issues that affect financial reporting after the reform of an interest rate benchmark, including its replacement with alternative benchmark rates. The amendments relate to modification of financial assets, financial liabilities and lease liabilities, specific hedge accounting requirements, and disclosure requirements in applying IFRS 7 to accompany the amendments regarding modifications and hedge accounting. The adoption of the amendments to IFRS 9, IAS 39, IFRS 7, IFRS 4 and IFRS 16 did not have a material impact on the Company's Consolidated Financial Statements.
(c) Accounting Pronouncements Issued But Not Yet Effective Onerous Contracts - Cost of Fulfilling a Contract
On May 14, 2020, the IASB issued an amendment to IAS 37 Provisions, Contingent Liabilities and Contingent Assets. The amendment specifies that the ‘cost of fulfilling’ a contract comprises the ‘costs that relate directly to the contract’. Costs that relate directly to the contract can either be incremental costs of fulfilling that contract or an allocation of other costs that relate directly to fulfilling that contract. The amendment is effective on January 1, 2022 and is to be applied prospectively. The extent of the impact of the adoption of the amendment has not yet been determined.
Annual Improvements to IFRS (2018-2020) Cycle
On May 14, 2020, the IASB issued narrow-scope amendments to three standards as part of its annual improvement process. Amendments were made to clarify which fees an entity includes when it applies the ‘10 per cent’ test in assessing whether to derecognize a financial liability in accordance with IFRS 9. The amendments also remove the requirement in IAS 41 Agriculture for entities to exclude taxation cash flows when measuring the fair value of a biological asset using a present value technique. Lastly, an amendment was made to IFRS 1 First-time Adoption of International Financial Reporting Standards for subsidiaries as a first-time adopter. These amendments are effective on January 1, 2022 and are to be applied prospectively. The extent of the impact of the adoption of these standards has not yet been determined.
NOTES TO THE CONSOLIDATED INTERIM FINANCIAL STATEMENTS | Q3 2021 | MAPLE LEAF FOODS INC.
Notes to the Consolidated Interim Financial Statements(Tabular amounts in thousands of Canadian dollars unless otherwise indicated)
25

Classification of Liabilities as Current or Non-current
On January 23, 2020, an amendment was issued to IAS 1 Presentation of Financial Statements to address inconsistencies with how entities classify current and non-current liabilities. The amendment serves to address whether debt and other liabilities with an uncertain settlement date should be classified as current or non-current in the consolidated balance sheets. This amendment is effective on January 1, 2023. The Company intends to adopt this amendment in its Consolidated Financial Statements for the annual period beginning January 1, 2023. The extent of the impact of the adoption of this amendment has not yet been determined.
Definition of Accounting Estimates (Amendments to IAS 8)
On February 12, 2021, the IASB issued Definition of Accounting Estimates (Amendments to IAS 8). The amendments will require the disclosure of material accounting policy information rather than disclosing significant accounting policies and clarifies how to distinguish changes in accounting policies from changes in accounting estimates. The amendments are effective for annual periods beginning on or after January 1, 2023. The Company intends to adopt this amendment in its Consolidated Financial Statements for the annual period beginning January 1, 2023. The extent of the impact of the adoption of this amendment has not yet been determined.
Disclosure Initiative – Accounting Policies (Amendments to IAS 1 and IFRS Practice Statement 2)
On February 12, 2021, the IASB issued Disclosure Initiative – Accounting Policies (Amendments to IAS 1 and IFRS Practice Statement 2 Making Materiality Judgements). The amendments help companies provide useful accounting policy disclosures. The amendments are effective for annual periods beginning on or after January 1, 2023. The Company intends to adopt this amendment in its Consolidated Financial Statements for the annual period beginning January 1, 2023. The extent of the impact of the adoption of this amendment has not yet been determined.
Deferred Tax related to Assets and Liabilities arising from a Single Transaction (Amendments to IAS 12)
On May 7, 2021 the IASB issued Deferred Tax related to Assets and Liabilities arising from a Single Transaction (Amendments to IAS 12). The amendments narrowed the scope of the recognition exemption in paragraphs 15 and 24 of IAS 12 Income Taxes (recognition exemption) so that it no longer applies to transactions that, on initial recognition, give rise to equal taxable and deductible temporary differences. The amendments are effective for annual reporting periods beginning on or after January 1, 2023. The Company intends to adopt this amendment in its Consolidated Financial Statements for the annual period beginning January 1, 2023. The extent of the impact of the adoption of this amendment has not yet been determined.
All other IFRSs and amendments issued but not yet effective have been assessed by the Company and are not expected to have a material impact on the Consolidated Financial Statements.
3. ACCOUNTS RECEIVABLE
2021 2020 2020Trade receivables $ 170,697 $ 104,874 $ 116,297 Less: Allowance for doubtful accounts (2,315) (2,293) (2,080) Net trade receivables $ 168,382 $ 102,581 $ 114,217
Other receivables:
Commodity taxes receivable 16,326 13,552 17,590 Government receivable 4,838 9,762 11,424 Other 10,998 10,932 16,519
$ 200,544 $ 136,827 $ 159,750
As at September 30, As at September 30, As at December 31,
The aging of trade receivables is as follows:
2021 2020 2020Current $ 138,366 $ 78,030 $ 90,983 Past due 0-30 days 24,947 18,138 19,658 Past due 31-60 days 2,664 2,058 2,266 Past due > 60 days 4,720 6,648 3,390
$ 170,697 $ 104,874 $ 116,297
As at September 30, As at September 30, As at December 31,
NOTES TO THE CONDENSED CONSOLIDATED INTERIM FINANCIAL STATEMENTS | Q3 2021 | MAPLE LEAF FOODS INC.
26

Trade receivables are impaired when their estimated future cash flows are less than their contractual cash flows. The amount of impairment takes into account the financial condition of the customers, delinquencies in payments, collaterals and credit insurance coverage on the trade receivables.
The Company has a three-year accounts receivable securitization facility (the "Securitization Facility") maturing July 19, 2022. The maximum cash advance available to the Company under the Securitization Facility is $120.0 million (September 30, 2020: $120.0 million; December 31, 2020: $120.0 million). The Securitization Facility provides cash funding with a proportion of the Company's receivables being sold, and provides the Company with competitively priced financing and further diversifies its funding sources. Under the Securitization Facility, the Company has sold certain of its trade accounts receivable, with very limited recourse, to an unconsolidated third-party trust financed by an international financial institution with a long-term AA- debt rating, for cash and short-term notes back to the Company. The receivables are sold at a discount to face value based on prevailing money market rates. The Company retains servicing responsibilities for these receivables.
As at September 30, 2021, trade accounts receivable being serviced under this program amounted to $168.7 million (September 30, 2020: $150.5 million; December 31, 2020: $134.8 million). In return for the sale of its trade receivables, the Company will receive cash of $120.0 million (September 30, 2020: $118.4 million; December 31, 2020: $103.2 million) and notes receivable in the amount of $48.7 million (September 30, 2020: $32.1 million; December 31, 2020: $31.6 million). The notes receivable are non-interest bearing and are settled on the settlement dates of the securitized accounts receivable. Due to the timing of receipts and disbursements, the Company may, from time to time, also record a receivable or payable related to the Securitization Facility. As at September 30, 2021, the Company recorded a net receivable in the amount of $20.8 million (September 30, 2020: $24.1 million net payable; December 31, 2020: $16.8 million net payable) in notes receivables (September 30, 2020 and December 31, 2020: accounts payable and accruals).
The sale of trade receivables under the Securitization Facility are treated as a sale from an accounting perspective and as a result, trade receivables sold under this facility are derecognized from the unaudited condensed consolidated interim balance sheets ("Consolidated Interim Balance Sheets") as at September 30, 2021 and 2020 and the 2020 annual audited consolidated balance sheets as at December 31, 2020.
4. INVENTORIES
2021 2020 2020Raw materials $ 69,818 $ 66,021 $ 69,594 Work in process 39,978 37,745 33,149 Finished goods 239,575 217,161 217,041 Packaging 21,816 24,246 21,212 Spare parts 61,315 56,166 57,074
$ 432,502 $ 401,339 $ 398,070
As at September 30, As at September 30, As at December 31,
For the three months ended September 30, 2021, inventory in the amount of $948.7 million (2020: $781.2 million) was expensed through cost of goods sold.
For the nine months ended September 30, 2021, inventory in the amount of $2,669.1 million (2020: $2,363.7 million) was expensed through cost of goods sold.
As at September 30, 2021, inventories have been reduced by $9.1 million (September 30, 2020: $8.8 million; December 31, 2020: $10.2 million) as a result of write-downs to net realizable value. The write-downs are included in the amount expensed through cost of goods sold.
5. BIOLOGICAL ASSETS The change in fair value of commercial hog stock for the three months ended September 30, 2021 was a gain of $6.6 million (2020: gain of $40.2 million) and was recorded in cost of goods sold.
The change in fair value of commercial hog stock for the nine months ended September 30, 2021 was a loss of $6.8 million (2020: loss of $1.2 million) and was recorded in cost of goods sold.
The fair value measures of commercial hog stock have been categorized as a Level 3 fair value based on inputs to the valuation techniques used. There were no transfers between levels for the three and nine months ended September 30, 2021 and September 30, 2020.
NOTES TO THE CONDENSED CONSOLIDATED INTERIM FINANCIAL STATEMENTS | Q3 2021 | MAPLE LEAF FOODS INC.
27

6. PROVISIONS
Restructuring and related provisions
LegalEnviron-
mental
Severance and other employee
related costs
Site closing and other
cash costs TotalBalance at December 31, 2020(i) $ 739 2,621 42,338 61 $ 45,759
Charges — — 1,009 — 1,009 Reversals — (140) (313) — (453) Cash payments — (8) (607) (49) (664)
Balance at March 31, 2021 $ 739 2,473 42,427 12 $ 45,651 Charges — — 717 37 754 Reversals (89) — (340) — (429) Cash payments — (13) (522) — (535)
Balance at June 30, 2021 $ 650 2,460 42,282 49 $ 45,441 Charges — — 562 — 562 Reversals — — (543) — (543) Cash payments — (8) (175) — (183)
Balance at September 30, 2021 $ 650 2,452 42,126 49 $ 45,277 Current $ 773 Non-current 44,504 Total at September 30, 2021 $ 45,277
(i) Balance as at December 31, 2020, includes current portion of $1.5 million and non-current portion of $44.3 million.
NOTES TO THE CONDENSED CONSOLIDATED INTERIM FINANCIAL STATEMENTS | Q3 2021 | MAPLE LEAF FOODS INC.
28

Restructuring and related provisions
LegalEnviron-
mental
Severance and other employee
related costs
Site closing and other
cash costs TotalBalance at December 31, 2019 $ 289 2,705 45,799 109 $ 48,902
Charges 850 — 504 — 1,354 Reversals — — (2,197) — (2,197) Cash payments — (11) (961) — (972)
Balance at March 31, 2020 $ 1,139 2,694 43,145 109 $ 47,087 Charges — — 1,276 — 1,276 Reversals — — (657) (33) (690) Cash payments (400) (61) (763) — (1,224)
Balance at June 30, 2020 $ 739 2,633 43,001 76 $ 46,449 Charges — — 793 84 877 Reversals — — (104) — (104) Cash payments — (1) (654) (84) (739)
Balance at September 30, 2020 $ 739 2,632 43,036 76 $ 46,483 Current $ 2,710 Non-current 43,773 Total at September 30, 2020 $ 46,483
Restructuring and Other Related Costs During the three months ended September 30, 2021, the Company recorded restructuring and other related costs of $0.8 million (2020: $1.7 million). This amount related to accelerated depreciation as a result of the previously announced future closures of the Brampton, Toronto and St. Mary's poultry plants. During the three months ended September 30, 2020, the amount consisted of accelerated depreciation of $1.0 million, and severance and other employee costs of $0.6 million as a result of the same announced closures. The remaining amount of $0.1 million in 2020 was related to employee related costs for other organizational restructuring initiatives.
During the nine months ended September 30, 2021, the Company recorded restructuring and other related costs of $3.7 million (2020: $3.1 million). Of this amount, $2.6 million (2020: $3.3 million) related to accelerated depreciation and $0.7 million (2020: reversals of $0.3 million) related to severance and other employee costs as a result of the previously announced future closures of the Brampton, Toronto and St. Mary's poultry plants. The remaining $0.4 million (2020: $0.1 million) related to employee related costs for other organizational restructuring initiatives.
7. LONG-TERM DEBT
As at September 30, As at September 30, As at December 31,2021 2020 2020
Revolving line of credit $ 470,000 $ — $ 50,000 U.S. term credit 335,318 354,623 337,544 Canadian term credit 350,000 350,000 350,000 Government loans 7,697 8,461 8,404 Total long-term debt $ 1,163,015 $ 713,084 $ 745,948 Current $ 5,279 $ 937 $ 900 Non-current 1,157,736 712,147 745,048 Total long-term debt $ 1,163,015 $ 713,084 $ 745,948
The Company has a syndicated credit facility (the "Credit Facility") consisting of a $1,300.0 million unsecured committed revolving line of credit maturing April 30, 2024 and two unsecured committed term credit facilities for US$265.0 million and $350.0 million maturing April 30, 2024 and April 30, 2023, respectively. The Credit Facility can be drawn in Canadian or U.S. dollars and bears interest payable
NOTES TO THE CONDENSED CONSOLIDATED INTERIM FINANCIAL STATEMENTS | Q3 2021 | MAPLE LEAF FOODS INC.
29

monthly, based on Banker's Acceptance and Prime rates for Canadian dollar loans and the London Inter-bank Offered Rate ("Libor") for U.S. dollar loans. The Credit Facility is intended to meet the Company's funding requirements for capital investments in addition to providing appropriate levels of liquidity for general corporate purposes. On December 11, 2019, the Company amended the Credit Facility to reduce interest paid upon achievement of certain sustainability targets. Subsequent to the issuance of the Company's 2020 Sustainability Report, the Company successfully achieved these sustainability targets. This reduction will take effect in the fourth quarter of 2021. There is no penalty for not achieving the targets. In addition to term credit, as at September 30, 2021 the Company had drawn letters of credit of $8.1 million on the Credit Facility (September 30, 2020: $6.7 million; December 31, 2020: $6.4 million).
The Credit Facility requires the maintenance of certain covenants. As at September 30, 2021, the Company was in compliance with all of these covenants.
The Company has additional uncommitted credit facilities for issuing letters of credit up to a maximum of $125.0 million (September 30, 2020: $125.0 million; December 31, 2020: $125.0 million). As at September 30, 2021, $66.8 million in letters of credit had been issued thereon (September 30, 2020: $78.5 million; December 31, 2020: $67.0 million).
The Company has various government loans on specific projects, with contractual interest rates ranging from non-interest bearing to 2.9% per annum (September 30, 2020: 0.0% to 2.9%; December 31, 2020: 0.0% to 2.9%). These specific facilities are repayable over various terms and are maturing from 2022 to 2032. As at September 30, 2021, $7.7 million (September 30, 2020: $8.5 million; December 31, 2020: $8.4 million) was outstanding. All of these facilities are committed.
The following table reconciles the changes in cash flows from financing activities for long-term debt for the period in the respective years:
Three months ended September 30, Nine months ended September 30,2021 2020 2021 2020
Total long-term debt, beginning of period $ 1,127,100 $ 717,910 $ 745,948 $ 539,328
Revolving and term credit facilities - net drawings $ 30,000 $ — $ 420,000 $ 165,000
Government loans - new issuance — 1,684 — 1,684
Government loans - repayments (667) (666) (945) (944) Total cash flow from long-term debt financing activities $ 29,333 $ 1,018 $ 419,055 $ 165,740
Foreign exchange revaluation $ 6,506 $ (5,539) $ (2,226) $ 8,162
Other non-cash changes 76 (305) 238 (146)
Total non-cash changes $ 6,582 $ (5,844) $ (1,988) $ 8,016
Total long-term debt, end of period $ 1,163,015 $ 713,084 $ 1,163,015 $ 713,084
8. SHARE CAPITAL Share RepurchaseOn May 20, 2021 the Toronto Stock Exchange ("TSX") accepted the Company's notice of intention to commence a Normal Course Issuer Bid ("NCIB"), allowing the Company to repurchase, at its discretion, up to 7.5 million common shares in the open market or as otherwise permitted by the TSX, subject to the normal terms and limitations of such bids. Common shares purchased by the Company are cancelled. The program commenced on May 25, 2021 and will terminate on May 24, 2022, or on such earlier date as the Company completes its purchases pursuant to the notice of intention. Under this bid, during the three and nine months ended September 30, 2021, no shares were repurchased for cancellation.
On May 21, 2020 the TSX accepted the Company's notice of intention to commence an NCIB, allowing the Company to repurchase, at its discretion, up to 7.5 million common shares in the open market or as otherwise permitted by the TSX, subject to the normal terms and limitations of such bids. Common shares purchased by the Company are cancelled. The program commenced on May 25, 2020 and was terminated on May 24, 2021. Under this bid, during the nine months ended September 30, 2021, no shares were purchased for cancellation. During the three and nine months ended September 30, 2020, no shares were purchased for cancellation.
On May 17, 2019, the TSX accepted the Company's notice of intention to commence an NCIB, allowing the Company to repurchase, at its discretion, up to 7.5 million common shares in the open market or as otherwise permitted by the TSX, subject to the normal terms and limitations of such bids. Common shares purchased by the Company were cancelled. The program commenced on May 24, 2019 and was terminated on May 23, 2020. Under this bid, during the three and nine months ended September 30, 2020, no shares were purchased for cancellation.
The Company entered into an Automatic Share Purchase Plan ("ASPP") with a broker that allows the purchase of common shares for cancellation under the NCIB at any time during predetermined trading blackout periods. As at September 30, 2021, an obligation for the
NOTES TO THE CONDENSED CONSOLIDATED INTERIM FINANCIAL STATEMENTS | Q3 2021 | MAPLE LEAF FOODS INC.
30

repurchase of shares of $32.3 million (September 30, 2020: $14.5 million, December 31, 2020: $29.8 million) was recognized under the ASPP.
9. FINANCIAL INSTRUMENTS The Company applies hedge accounting as appropriate and uses derivatives and other non-derivative financial instruments to manage its exposures to fluctuations in foreign exchange rates, interest rates, and commodity prices.
The fair values and notional amounts of derivative financial instruments as at September 30 are shown below:
Notionalamount(i)
Fair value Notionalamount(i)
Fair valueAsset(ii) Liability(ii) Asset(ii) Liability(ii)
Cash flow hedgesForeign exchange contracts $ 14,340 $ 8 $ 220 $ — $ — $ — Interest rate swaps $ 470,318 — 11,023 $ 488,020 — 20,948
$ 8 $ 11,243 $ — $ 20,948 Fair value hedges(iii)
Foreign exchange contracts $ 50,326 $ 101 $ 651 $ 44,631 $ 162 $ 191 Commodity contracts $ 45,633 — 3,719 $ 44,654 — 1,086
$ 101 $ 4,370 $ 162 $ 1,277 Derivatives not designated in a formal hedging relationship
Foreign exchange contracts $ 265,038 $ 2,095 $ 1,168 $ 103,745 $ 219 $ 655 Commodity contracts $ 292,278 2,334 — $ 139,330 9,567 1,165
$ 4,429 $ 1,168 $ 9,786 $ 1,820 Total fair value $ 4,538 $ 16,781 $ 9,948 $ 24,045 Current(ii)(iv)(v) $ 4,538 $ 12,039 $ 9,948 $ 9,659 Non-current(ii) — 4,742 — 14,386 Total fair value $ 4,538 $ 16,781 $ 9,948 $ 24,045
2021 2020
(i) Unless otherwise stated, notional amounts are stated at the contractual Canadian dollar equivalent. (ii) The current portion of derivative assets and liabilities are recorded in prepaid expenses and other assets and other current liabilities, respectively, in
the Consolidated Interim Balance Sheets. The non-current portion of derivative assets and liabilities are recorded in other long-term assets and other long-term liabilities, respectively, in the Consolidated Interim Balance Sheets.
(iii) The carrying amount of the hedged items in the Consolidated Interim Balance Sheets are recorded at the inverse of the associated hedging instruments and are equal to the accumulated fair value hedge adjustments less hedge ineffectiveness.
(iv) Short-term derivatives will impact profit or loss at various dates within the next 12 months. (v) As at September 30, 2021, the above fair value of current assets has been increased by $2.2 million (September 30, 2020: decreased by $7.4
million; December 31, 2020: increased by $7.4 million), and the above fair value of current liabilities has been decreased by $3.7 million (September 30, 2020: $1.1 million; December 31, 2020: $1.8 million) on the Consolidated Interim Balance Sheets, representing the difference in the fair market value of exchange traded commodity contracts and the initial margin requirements. The difference in margin requirements and fair market value is net settled in cash each day with the futures exchange and is recorded within cash and cash equivalents.
During the three months ended September 30, 2021, the Company recorded a pre-tax gain of $0.3 million (2020: gain of $11.2 million) on non-designated financial instruments held for trading.
During the nine months ended September 30, 2021, the Company recorded a pre-tax loss of $9.2 million (2020: loss of $29.1 million) on non-designated financial instruments held for trading.
During the three months ended September 30, 2021, the pre-tax amount of hedge ineffectiveness recognized in cost of goods sold was a gain of $0.1 million (2020: gain of $0.0 million).
During the nine months ended September 30, 2021, the pre-tax amount of hedge ineffectiveness recognized in cost of goods sold was a gain of $0.1 million (2020: gain of $0.1 million).
NOTES TO THE CONDENSED CONSOLIDATED INTERIM FINANCIAL STATEMENTS | Q3 2021 | MAPLE LEAF FOODS INC.
31

The table below sets out fair value measurements of derivative financial instruments as at September 30, 2021 using the fair value hierarchy:
Level 1 Level 2 Level 3 TotalAssets:
Foreign exchange contracts $ — 2,204 — $ 2,204 Commodity contracts(i) — 1,167 — 1,167
$ — 3,371 — $ 3,371 Liabilities:
Foreign exchange contracts $ — 2,039 — $ 2,039 Commodity contracts(i) 2,552 — — 2,552 Interest rate swaps — 11,023 — 11,023
$ 2,552 13,062 — $ 15,614 (i) Level 1 commodity contracts are net settled and recorded as a net asset or liability on the Consolidated Interim Balance Sheets.
There were no transfers between levels for the three and nine months ended September 30, 2021 and September 30, 2020.
Determination of fair value and the resulting hierarchy requires the use of observable market data whenever available and is consistent with the methodology used in the 2020 Consolidated Financial Statements. The classification of a financial instrument in the hierarchy is based upon the lowest level of input that is significant to the measurement of fair value. For financial instruments that are recognized at fair value on a recurring basis, the Company determines whether transfers have occurred between levels in the hierarchy by re-assessing categorization at the end of each reporting period.
Accumulated other comprehensive income (loss) The Company estimates that $4.8 million, net of tax of $1.7 million, of the unrealized loss included in accumulated other comprehensive income (loss) will be reclassified into net earnings within the next 12 months. The actual amount of this reclassification will be impacted by future changes in the fair value of financial instruments designated as cash flow hedges. The actual amount reclassified could differ from this estimated amount.
During the three months ended September 30, 2021, a gain of $1.8 million, net of tax of $0.6 million, was released to earnings from accumulated other comprehensive income (loss) and included in the net change for the year (2020: loss of $1.2 million, net of tax of $0.4 million).
During the nine months ended September 30, 2021, a gain of $0.6 million, net of tax of $0.2 million, was released to earnings from accumulated other comprehensive income (loss) and included in the net change for the year (2020: loss of $2.3 million, net of tax of $0.8 million).
As at September 30, 2021, the Company had US$265.0 million (September 30, 2020: US$265.0 million; December 31, 2020: US$265.0 million) drawn on the Credit Facility (see Note 7) that is designated as a net investment hedge of the Company's U.S. operations. Foreign exchange gains and losses on the designated drawings are recorded in shareholders' equity in the foreign currency translation adjustment component of accumulated other comprehensive income and offset translation adjustments on the underlying net assets of the U.S. operations, which are also recorded in accumulated other comprehensive income (loss).
During the three months ended September 30, 2021, the loss on the net investment hedge recorded in other comprehensive income (loss) was $5.5 million, net of tax of $1.1 million (2020: gain of $4.4 million, net of tax of $0.8 million).
During the nine months ended September 30, 2021, the gain on the net investment hedge recorded in other comprehensive income (loss) was $1.8 million, net of tax of $0.4 million (2020: loss of $6.9 million, net of tax of $1.2 million).
NOTES TO THE CONDENSED CONSOLIDATED INTERIM FINANCIAL STATEMENTS | Q3 2021 | MAPLE LEAF FOODS INC.
32

10. INTEREST EXPENSE AND OTHER FINANCING COSTS
2021 2020 2021 2020Interest on borrowings from credit facility $ 8,149 $ 5,064 $ 20,012 $ 14,952 Interest on lease obligations 1,560 2,100 5,433 6,467 Interest on securitized receivables 313 674 809 2,127 Interest on government loans 76 60 237 236 Deferred finance charges 416 459 1,265 1,263 Credit facility standby fees and other interest 1,085 1,352 3,131 3,635
$ 11,599 $ 9,709 $ 30,887 $ 28,680 Interest paid and capitalized (5,916) (2,235) (14,525) (5,246)
$ 5,683 $ 7,474 $ 16,362 $ 23,434
Three months ended September 30, Nine months ended September 30,
Interest paid during the three and nine months ended September 30, 2021 was $11.3 million and $31.3 million (2020: $10.8 million and $28.4 million).
11. EARNINGS PER SHARE Basic earnings per share amounts are calculated by dividing the net earnings of the Company by the weighted average number of shares outstanding during the year.
Diluted earnings per share amounts are calculated by dividing the net earnings of the Company by the weighted average number of shares outstanding during the year, adjusted for the effects of potentially dilutive instruments.
The following table sets forth the calculation of basic and diluted earnings per share (“EPS”):
2021 2020
Three months ended September 30,Net
earnings
Weighted average
number of shares(i) EPS Net earnings
Weighted average
number of shares(i) EPS
Basic $ 44,479 123.5 $ 0.36 $ 65,976 123.2 $ 0.54 Stock options(ii) 2.0 1.4 Diluted $ 44,479 125.5 $ 0.35 $ 65,976 124.6 $ 0.53 Nine months ended September 30,Basic $ 100,945 123.4 $ 0.82 $ 87,923 123.2 $ 0.72 Stock options(ii) 2.3 1.1 Diluted $ 100,945 125.7 $ 0.80 $ 87,923 124.3 $ 0.71
(i) In millions. (ii) Excludes the effect of approximately 3.4 million (2020: 2.4 million) options and performance shares that are anti-dilutive for the three months ended
September 30, 2021 and 3.4 million (2020: 2.4 million) for the nine months ended September 30, 2021 that are anti-dilutive.
NOTES TO THE CONDENSED CONSOLIDATED INTERIM FINANCIAL STATEMENTS | Q3 2021 | MAPLE LEAF FOODS INC.
33

12. SHARE-BASED PAYMENTStock Options A summary of the status of the Company’s outstanding stock options during the nine months ended September 30 are presented below:
Options outstanding
Weighted average exercise
priceOptions
outstanding
Weighted average exercise
priceOutstanding at January 1 5,889,550 $ 25.48 4,558,250 $ 26.26 Granted 1,241,250 $ 25.10 1,408,950 $ 23.08 Exercised (63,900) $ 21.26 — $ — Forfeited — $ — (54,200) $ 31.39 Outstanding at March 31 7,066,900 $ 25.45 5,913,000 $ 25.46 Granted 10,500 $ 25.10 — $ — Exercised (24,050) $ 23.04 (34,300) $ 22.53 Forfeited (11,100) $ 28.38 (150) $ 23.08 Outstanding at June 30 7,042,250 $ 25.46 5,878,550 $ 25.47 Exercised (334,400) $ 20.28 (11,800) $ 20.28 Outstanding at September 30 6,707,850 $ 25.72 5,866,750 $ 25.49 Options currently exercisable 4,142,350 $ 26.26 3,539,875 $ 25.40
2021 2020
All outstanding stock options vest and become exercisable over a period not exceeding five years (time vesting) from the date of grant. The outstanding options have a term of seven years.
At grant date, each option series is measured at fair value based on the Black-Scholes formula. Expected volatility is estimated by considering historic average share price volatility. The inputs used in this model for the options granted during the nine months ended September 30, 2021 and 2020 are shown in the table below(i):
2021 2020Share price at grant date $26.38 $22.80Exercise price $25.10 $23.08Expected volatility 26.4 % 23.3 %Option life (in years)(ii) 4.5 4.5Expected dividend yield 2.7 % 2.8 %Risk-free interest rate(iii) 0.8 % 1.1 %
Nine months ended September 30,
(i) Weighted average based on number of units granted. (ii) Expected weighted average life. (iii) Based on Government of Canada bonds.
There were no stock options granted during the three months ended September 30, 2021 and 2020. Expenses relating to current and prior year options were $1.4 million (2020: $1.1 million).
The fair value of options granted during the nine months ended September 30, 2021 was $5.8 million (2020: $4.4 million). Expenses relating to current and prior year options were $3.9 million (2020: $3.4 million).
NOTES TO THE CONDENSED CONSOLIDATED INTERIM FINANCIAL STATEMENTS | Q3 2021 | MAPLE LEAF FOODS INC.
34

Restricted Share Units and Performance Share Units A summary of the status of the Company’s Restricted Share Units ("RSUs") plans (including Performance Share Units ("PSUs")) as at and for the nine months ended September 30 are presented below:
RSUs outstanding
Weighted average
fair value at grant
RSUs outstanding
Weighted average
fair value at grant
Outstanding at January 1 1,550,135 $ 24.99 1,245,915 $ 28.80 Granted 548,050 $ 24.12 672,360 $ 20.80 Forfeited (4,760) $ 23.45 — $ — Outstanding at March 31 2,093,425 $ 24.76 1,918,275 $ 25.99 Distributed (319,791) $ 30.61 (329,381) $ 30.26 Forfeited (54,933) $ 27.98 (60,922) $ 28.97 Outstanding at June 30 1,718,701 $ 23.57 1,527,972 $ 24.96 Granted 24,760 $ 24.79 14,220 $ 26.73 Forfeited (1,040) $ 24.12 (2,630) $ 23.23 Outstanding September 30 1,742,421 $ 23.59 1,539,562 $ 24.95
2021 2020
The fair value of RSUs and PSUs granted during the three months ended September 30, 2021 was $0.5 million (2020: $0.3 million). Expenses for the three months ended September 30, 2021 relating to current and prior year RSUs and PSUs, were $6.7 million (2020: $2.8 million).
The fair value of RSUs and PSUs granted during the nine months ended September 30, 2021 was $11.9 million (2020: $12.4 million). Expenses for the nine months ended September 30, 2021 relating to current and prior year RSUs and PSUs, were $13.0 million (2020: $7.7 million).
The key assumptions used in the valuation of fair value of RSUs granted during the nine months ended September 30, 2021 and 2020 are shown in the table below(i):
Expected RSU life (in years) 3.1 3.2Forfeiture rate 13.8 % 13.7 %Risk-free interest rate(ii) 0.5 % 1.1 %
2021 2020
(i) Weighted average based on number of units granted. (ii) Based on Government of Canada bonds.
Director Share Units Expenses for the three and nine months ended September 30, 2021 relating to director share units were $0.4 million and $0.8 million (2020: $0.4 million and $1.1 million).
NOTES TO THE CONDENSED CONSOLIDATED INTERIM FINANCIAL STATEMENTS | Q3 2021 | MAPLE LEAF FOODS INC.
35

13. SEGMENTED FINANCIAL INFORMATION The Company has two reportable segments. As described below, these segments offer different products, with separate organizational structures, brands, financial, and marketing strategies. The Company's chief operating decision makers regularly review internal reports for these businesses; performance of the Meat Protein Group is based on revenue growth, Adjusted Operating Earnings and Adjusted EBITDA, while the performance of the Plant Protein Group is based predominantly on revenue growth rates, gross margin optimization and controlling investment levels, which generate high revenue growth rates. Refer to section 20. Non-IFRS Financial Measures, of the Company's Management's Discussion and Analysis for the three and nine months ended September 30, 2021, for the definitions of these non-IFRS financial measures. The operations of each segment are described as follows:
(a) The Meat Protein Group is comprised of prepared meats, ready-to-cook and ready-to-serve meals, value-added fresh pork and poultry products that are sold to retail, foodservice and industrial channels, and agricultural operations in pork and poultry. The Meat Protein Group includes leading brands such as Maple Leaf®, Maple Leaf Prime®, Schneiders®, Mina®, Greenfield Natural Meat Co.® and many leading regional brands.
(b) The Plant Protein Group is comprised of refrigerated plant protein products, premium grain-based protein and vegan cheese products sold to retail, foodservice and industrial channels. The Plant Protein Group includes the brands Lightlife® and Field Roast™.
Three months ended September 30, 2021 Three months ended September 30, 2020
Meat Protein Group
Plant Protein Group
Non-Allocated(i) Total(ii)
Meat Protein Group
Plant Protein Group
Non-Allocated(i) Total(ii)
Sales $ 1,150,338 47,967 (9,662) $ 1,188,643 $ 1,014,423 51,369 (8,624) $ 1,057,169
Gross profit $ 191,483 (3,263) (62) $ 188,158 $ 160,649 3,391 64,073 $ 228,114
Selling, general and administrative expenses $ 85,859 34,404 — $ 120,263 $ 80,655 46,509 — $ 127,165
Earnings (loss) before income taxes $ 105,345 (37,857) (5,151) $ 62,337 $ 79,829 (43,165) 53,701 $ 90,365
Interest expense and other financing costs — — 5,683 5,683 — — 7,474 7,474
Other (income) expense (561) 190 (594) (965) (1,567) 47 2,898 1,378
Restructuring and other related costs 840 — — 840 1,732 — — 1,732
Earnings (loss) from operations $ 105,624 (37,667) (62) $ 67,895 $ 79,994 (43,118) 64,073 $ 100,949
Change in fair value of biological assets — — (6,630) (6,630) — — (40,176) (40,176)
Unrealized loss (gain) on derivative contracts — — 6,692 6,692 — — (23,896) (23,896)
Adjusted Operating Earnings $ 105,624 (37,667) — $ 67,957 $ 79,994 (43,118) — $ 36,876
Depreciation and amortization 43,112 3,915 — 47,027 44,099 3,599 — 47,699
Items included in other income (expense) representative of ongoing operations 562 (191) — 371 (1,490) (47) (469) (2,007)
Adjusted EBITDA $ 149,298 (33,943) — $ 115,355 $ 122,603 (39,565) (469) $ 82,568
(i) Non-Allocated includes eliminations of inter-segment sales and associated cost of goods sold, and non-allocated costs which are comprised of income and expenses not separately identifiable to reportable segments or are not part of the measures used by the Company when assessing a segment’s operating results.
(ii) Totals may not add due to rounding.
NOTES TO THE CONDENSED CONSOLIDATED INTERIM FINANCIAL STATEMENTS | Q3 2021 | MAPLE LEAF FOODS INC.
36

Nine months ended September 30, 2021 Nine months ended September 30, 2020
Meat Protein Group
Plant Protein Group
Non-Allocated(i) Total(ii)
Meat Protein Group
Plant Protein Group
Non-Allocated(i) Total(ii)
Sales $ 3,281,509 138,648 (19,570) $ 3,400,587 $ 3,036,160 158,337 (19,988) $ 3,174,510
Gross profit $ 524,622 (2,854) (5,000) $ 516,768 $ 494,535 18,033 10,218 $ 522,787
Selling, general and administrative expenses $ 254,112 92,955 — $ 347,067 $ 252,407 111,491 — $ 363,899
Earnings (loss) before income taxes $ 268,259 (96,165) (29,647) $ 142,447 $ 240,818 (93,528) (22,772) $ 124,518
Interest expense and other financing costs — — 16,362 16,362 — — 23,434 23,434
Other (income) expense (1,447) 356 8,285 7,194 (1,760) 70 9,556 7,866
Restructuring and other related costs 3,698 — — 3,698 3,070 — — 3,070
Earnings (loss) from operations $ 270,510 (95,809) (5,000) $ 169,701 $ 242,128 (93,458) 10,218 $ 158,888
Change in fair value of biological assets — — 6,779 6,779 — — 1,159 1,159
Unrealized gain on derivative contracts — — (1,779) (1,779) — — (11,377) (11,377)
Adjusted Operating Earnings $ 270,510 (95,809) — $ 174,701 $ 242,128 (93,458) — $ 148,670
Depreciation and amortization 134,359 11,323 — 145,682 131,089 10,853 — 141,942
Items included in other (expense) income representative of ongoing operations (2,568) (356) — (2,924) (1,297) (70) (469) (1,836)
Adjusted EBITDA $ 402,301 (84,842) — $ 317,459 $ 371,920 (82,675) (469) $ 288,776
(i) Non-Allocated includes eliminations of inter-segment sales and associated cost of goods sold, and non-allocated costs which are comprised of income and expenses not separately identifiable to reportable segments or are not part of the measures used by the Company when assessing a segment’s operating results.
(ii) Totals may not add due to rounding.
The following summarizes capital expenditures by segments:
Three months ended September 30, Nine months ended September 30,2021 2020 2021 2020
Meat Protein Group $ 128,277 $ 92,699 $ 420,563 $ 273,030
Plant Protein Group 21,213 5,776 75,072 13,355
Non-allocated capital expenditures 3,455 4,520 8,800 17,799
Total capital expenditures $ 152,945 $ 102,995 $ 504,435 $ 304,184
Information About Geographic Areas The following summarizes sales by country of origin:
Three months ended September 30, Nine months ended September 30,2021 2020 2021 2020
Canada $ 879,827 $ 789,439 $ 2,493,450 $ 2,287,324
U.S. 147,075 113,887 413,047 359,629
Japan 111,585 100,130 316,726 315,186
China 1,401 24,533 9,031 121,537
Other 48,755 29,180 168,333 90,834
Sales $ 1,188,643 $ 1,057,169 $ 3,400,587 $ 3,174,510
NOTES TO THE CONDENSED CONSOLIDATED INTERIM FINANCIAL STATEMENTS | Q3 2021 | MAPLE LEAF FOODS INC.
37

The following summarizes the location of non-current assets by country:
As at September 30, As at September 30, As at December 31,
2021 2020 2020
Canada $ 2,865,924 $ 2,424,814 $ 2,558,886
U.S. 454,616 408,642 391,538
Other 1,048 292 205
Total non-current assets(i) $ 3,321,588 $ 2,833,748 $ 2,950,629
(i) Excludes financial instruments, investments designated as financial instruments, employee benefits, and deferred tax assets.
Information About Major CustomersFor the three months ended September 30, 2021, the Company reported Meat and Plant Protein sales to two customers representing 11.9% and 10.7% (2020: 13.2% and 11.5%) of total sales. No other sales were made to any one customer that represented in excess of 10.0% of total sales.
For the nine months ended September 30, 2021, the Company reported Meat and Plant Protein sales to two customers representing 12.2% and 11.2% (2020: 12.7% and 11.1%) of total sales. No other sales were made to any one customer that represented in excess of 10.0% of total sales.
14. RELATED PARTY TRANSACTIONSThe Company sponsors a number of defined benefit, defined contribution and post-retirement benefit plans. During the three and nine months ended September 30, 2021, the Company contributed $7.6 million and $28.6 million (2020: $7.5 million and $22.3 million) to these plans.
The Company’s largest shareholder is McCain Capital Inc. (“MCI”). The Company has been informed that Mr. Michael H. McCain, Chief Executive Officer and President of the Company, is the controlling shareholder of MCI. For the three and nine months ended September 30, 2021, the Company received services from MCI in the amount of $0.0 million and $0.0 million (2020: $0.0 million and $0.1 million), which represented the market value of the transactions with MCI. As at September 30, 2021, September 30, 2020, and December 31, 2020, a nominal amount was owed to MCI relating to these transactions.
McCain Financial Advisory Services ("MFAS"), is an entity jointly controlled by individuals including Mr. Michael H. McCain. For the three and nine months ended September 30, 2021 and 2020, the Company provided services to and received from, MFAS for a nominal amount which represented the market value of the transactions.
15. BUSINESS COMBINATIONS (a) 2021 AcquisitionOn June 25, 2021, the Company completed the acquisition of a poultry processing facility and associated supply from Certm Inc. (formerly Cericola Farms Inc.), a privately held Canadian company for total consideration of $60.2 million (cash due at closing: $40.0 million; 2018 deposit $20.2 million) prior to any working capital adjustments. This acquisition concludes the purchase and sale agreement dated June 27, 2018 pursuant to which the Company previously acquired two poultry plants and associated supply, with a put/call option to purchase a third processing facility. The Company has financed the transaction using a combination of cash on hand and drawings on existing credit facilities. The acquisition has been accounted for as a business combination.
No goodwill is expected to be recorded on the transaction.
The Company has not yet finalized the amounts recorded for the acquisition.
The preliminary fair value of the consideration transferred for the poultry processing facility and associated poultry supply consists of the following:
Purchase PriceJune 25, 2021
Purchase price paid upon closing of the put option $ 40,000
Cash deposit prepaid in the year ended December 31, 2018 20,185
Working capital and other adjustments 1,928
Total consideration paid in cash $ 62,113
NOTES TO THE CONDENSED CONSOLIDATED INTERIM FINANCIAL STATEMENTS | Q3 2021 | MAPLE LEAF FOODS INC.
38

During the third quarter of 2021 the Company recorded the following adjustments to the preliminary purchase price allocation:
June 25, 2021
Preliminary amounts Adjustments
Valuation as atSeptember 30, 2021
Current assetsAccounts receivable(i) $ 1,339 — $ 1,339
Prepaid and other assets 70 — 70
Non-current assetsProperty and equipment 13,651 — 13,651
Intangible assets 46,155 1,777 47,932
Current liabilitiesAccounts payable and accruals (879) — (879)
Total net assets acquired $ 60,336 1,777 $ 62,113 (i) Pertain to trade receivables for which contractual cash flows not expected to be collected are not significant.
(b) Transaction CostsDuring the three and nine months ended September 30, 2021, the Company recorded transaction costs pertaining to acquisitions of $0.1 million that have been excluded from the consideration paid and have been recognized as an expense in other (income) expense.
NOTES TO THE CONDENSED CONSOLIDATED INTERIM FINANCIAL STATEMENTS | Q3 2021 | MAPLE LEAF FOODS INC.
39