interim results 2001 21 may 2001. 2 results overview financial review current trading and prospects...
TRANSCRIPT

INTERIM RESULTS2001
21 May 2001

2
Results Overview
Financial Review
Current Trading and Prospects
Future Strategy
The Case for Investment
Holidaybreak plcINTERIM RESULTS 2001
3
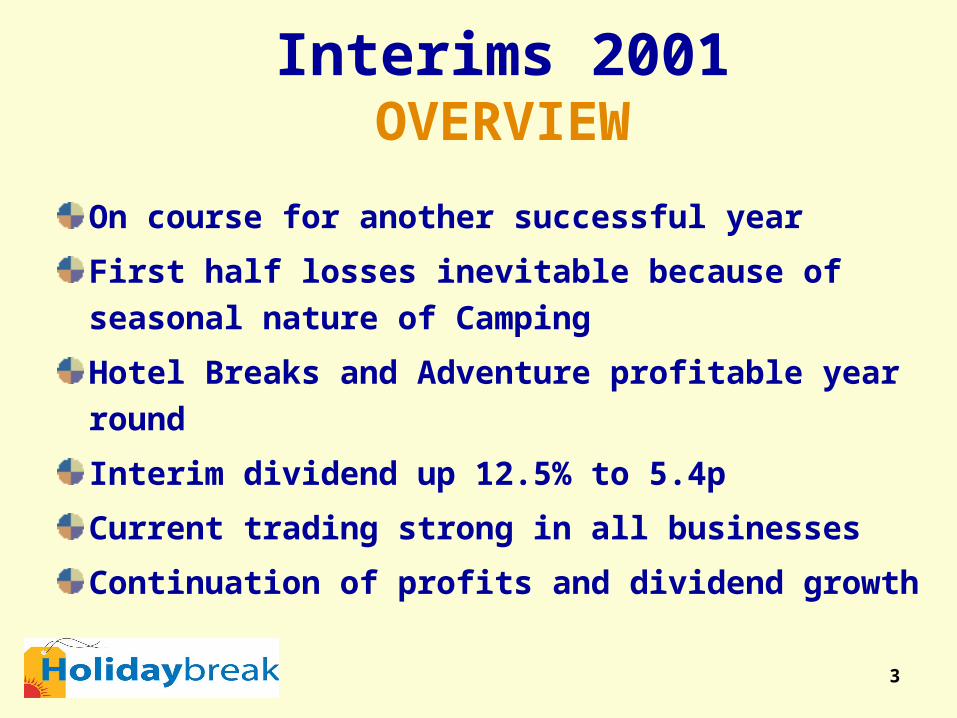
On course for another successful year
First half losses inevitable because of seasonal
nature of Camping
Hotel Breaks and Adventure profitable year round
Interim dividend up 12.5% to 5.4p
Current trading strong in all businesses
Continuation of profits and dividend growth
Interims 2001OVERVIEW

4
Interims 2001PROFIT AND LOSS ACCOUNT
(six months to 31 March 2001)
Unaudited Unaudited Audited6 months to 6 months to 12 months to31 March '01 31 March '00 30 Sept '00
£'000 £'000 £'000Turnover 37,177 20,721 164,518Operating (Loss)/Profit (5,039) (6,282) 23,667(Loss)/Profit Before Tax (6,697) (7,798) 20,709(Loss)/Earnings Per Share (10.5p) (13.1p) 34.0pDividend Per Share 5.4p 4.80p 16.0p
All stated before goodwill amortisation

5
Interims 2001PROFIT & LOSS ACCOUNT - DIVISIONAL ANALYSIS
(six months to 31 March 2001)
Camping Hotel Adventure GroupBreaks
£'000 £'000 £'000 £'000Turnover 2001 - 23,713 13,464 37,177
2000 - 18,571 2,150 20,721Operating (Loss)/Profit 2001 (8,301) 1,965 1,297 (5,039)
2000 (8,137) 1,586 269 (6,282)
All stated before goodwill amortisation

6
Interims 2001BALANCE SHEET
Unaudited Unaudited Audited31 March '01 31 March '00 30 Sept '00
£'000 £'000 £'000Fixed Assets/Investments 61,796 55,262 54,858Goodwill 31,913 28,856 32,753Net Current Liabilities (18,717) (10,698) (29,113)Non Current Liabilities (1,521) (1,051) (1,521)Net Debt (56,237) (61,432) (32,203)Net Assets 17,234 10,937 24,774

7
Interims 2001CASH FLOW
(six months to 31 March 2001)
Unaudited Unaudited Audited31 March '01 31 March '00 30 Sept '00
£'000 £'000 £'000Operating Cash Flow (13,628) (10,713) 39,726Interest (1,658) (1,516) (2,958)Tax (1,716) (1,278) (5,080)Capex (Net) (4,277) (6,388) (4,356)Acquisitions - (24,205) (28,911)Dividends - - (6,569)Loans, Shares & H.P. (17,972) 24,763 30,308Net Cash Flow (39,251) (19,337) 22,160

8
Bookings 5% up on 2000 - all markets performing well
c.93% of anticipated final sales (90% of bookings) now received
Spring Bank and June filling - important for low season occupancy
Little left to sell in peak season
Mobile-homes account for 54% of bookings (50% in 2000)
Interims 2001CAMPING - TRADING AND PROSPECTS

9
Existing market moving away from tents and into more profitable mobile-homes
Aim to broaden appeal by addressing misconceptions about camp-site holidays and mobile-homes
‘Self-catering’ rather than ‘camping’
Low-cost airlines making southern destinations more accessible
TV advertising tested extensively alongside traditional media and direct mail
Internet now an important and cost effective distribution channel
Camping2001 UK MARKETING CAMPAIGN

10
Camping2001 UK MARKETING CAMPAIGN
[]
11
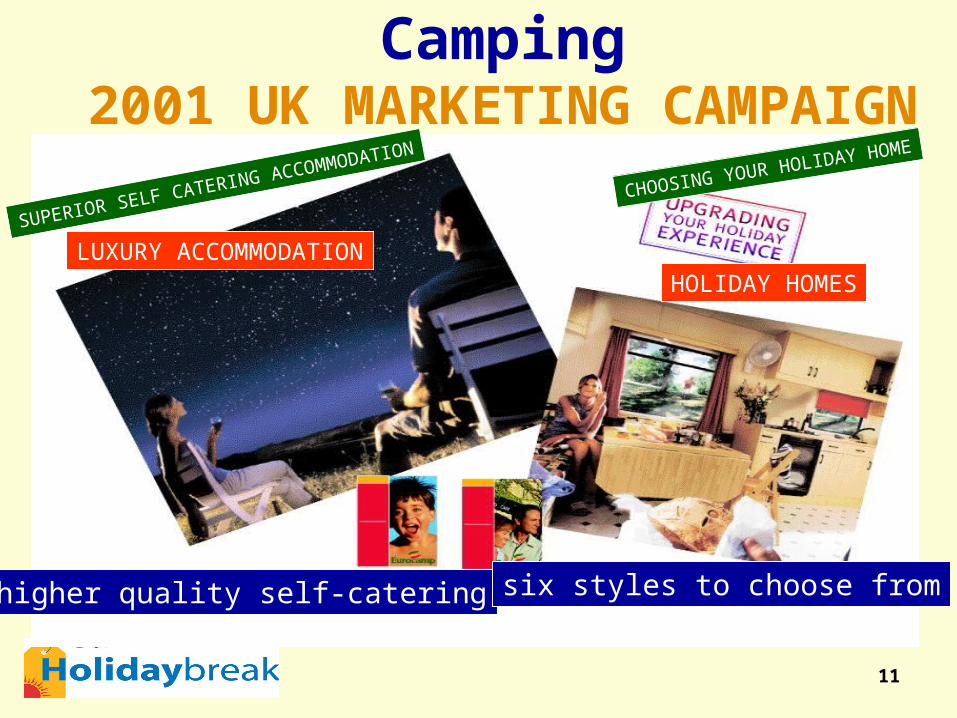
Camping2001 UK MARKETING CAMPAIGN
SUPERIOR SELF CATERING ACCOMMODATION CHOOSING YOUR HOLIDAY HOME
LUXURY ACCOMMODATIONHOLIDAY HOMES
a higher quality self-catering six styles to choose from

12
Sales revenues 24% ahead year on year
c.70% of anticipated final figure received
Successful year despite rail problems, flooding and
foot and mouth
Direct and internet bookings particularly strong
Rainbow acquisition has proved beneficial
Interims 2001HOTEL BREAKS - TRADING AND PROSPECTS

13
Hotel BreaksINTERNET
Distribution channel forSuperbreak product range
Superbreak.com Hotelnet.co.uk
On-line HotelBookings
Specialist internethotel booking portal
45,000 hotelslower commission rates
1,500 hotels at full margin

14
Hotel BreaksINTERNET
Remarkable growth since on-line bookings introduced(Nov ‘99) - now c.10% of core business salesOne third of bookings direct - balance is commissionable (Hotelnet, Leisurehunt, Thos Cook etc)Taking share in overall UK hotel breaks marketHotelnet - worldwide product range with
preferential links to superbreak.com- small deficit in 2001 (c.£300k) due to
investment programme- should move into profit thereafter
Many visitors to both sites from overseas

15
Bookings up 13% year on year
c.85% of anticipated final sales now received - some
overhead pressures
Europe/shorter holidays selling particularly well
for Explore
Non-Red Sea sales growing strongly for Regal
First quarter winter bookings now coming in well
Interims 2001ADVENTURE - TRADING AND PROSPECTS

16
Explore Worldwide acquired February 2000Simon Tobin (ex-Keycamp) appointed MDMarketing Director appointedSo far we have - improved sales effectiveness in call
centre- thoroughly researched customers
and competitors- reviewed office systems- introduced a more strategic view- investigating potential acquisitions
Regal acquired August 2000 - stable and trading well
AdventurePOST ACQUISITION REVIEW

17
Concentrate on strong market leading businesses -avoid volatile, low margin, short-haul packages
Organic growth combined with ‘bolt-on’ acquisitions to existing divisions and acquisition of travel businesses in new sectors
Characteristics of Group businesses provide an excellent platform for growth and a template for future acquisitions
Holidaybreak plcFUTURE STRATEGY

18
Market leading businesses in specialist sectors
Healthy margins
Low fixed cost commitments
Highly cash generative
Growth opportunities
Holidaybreak plcCOMMON CHARACTERISTICS

19
CAMPING Eurocamp and Keycamp combined have a sectorshare of over 60% in all the main markets andare recognised as the leading brands in pre-sitedcamping and mobile-home holidays
HOTEL BREAKS Superbreak and its subsidiary brands currentlyaccount for over 60% of hotel breaks bookedthrough UK travel agents
ADVENTURE Explore Worldwide is the largest adventuretravel operator in Europe with an estimated UKmarket share of 40%.Regal Holidays has an estimated 25% of the UKscuba diving market
Common CharacteristicsMARKET LEADERSHIP

20
1999 2000
CAMPING 15.6% 16.6%
HOTEL BREAKS 9.8% 9.5%
ADVENTURE - 14.1%
GROUP 12.7% 13.4%
Compared to:
AIRTOURS 2.8% 1.8%
FIRST CHOICE 2.4% 3.4%
Common CharacteristicsHEALTHY OPERATING MARGINS

21
CAMPING No commitments to travel costsNo site ownershipFlexible camp-site contracts allow flexing of capacityto match demand and ensure healthy load factors
HOTEL BREAKS No commitments to hotel rooms (sale or returnallocations)Consistent gross margin (30%)No commitments to travel costsTravel agency commissions (av. 14.5%) linked to sales
ADVENTURE Scheduled air seats – no commitments (except Regal)Tours only run if target load factors achievedTours added if demand warrantsOverseas operational costs almost all variable
Common CharacteristicsLOW FIXED COSTS

22
CAMPING Substantial but flexible capex rewardedby rapid payback
HOTEL BREAKS IT and office capex onlyNegative working capitalYear round positive cash flowStrong cash generation
ADVENTURE IT and office capex onlyNegative working capitalYear round positive cash flowStrong cash generation
Common CharacteristicsCASH GENERATION

23
CAMPING Profitable mobile-homes growing andreplacing lower margin tentsOverseas markets, especially Germany,on a healthy growth trend
HOTEL BREAKS Sector growthDirect sales/internetInboundProduct Development/Hotelnet
ADVENTURE Sector growing stronglyProduct developmentConsolidation in fragmented sectorOverseas markets
Common CharacteristicsGROWTH PROSPECTS

24
Excellent growth prospects and good defensive
qualities
Strong record of earnings and dividend growth
Highly cash generative
Modest rating - discount to peer group
High yield
Holidaybreak plcTHE CASE FOR INVESTMENT

25
HistoricPER
(2000)
ProspectivePER
(2001)
DividendYield
(Historic)HOLIDAYBREAK(387.5p)
11.4x 10.2x 4.1%
AIRTOURS(300.25p)
32.9x 15.4x 3.2%
FIRST CHOICE(164.5p)
14.6x 13.7x 2.6%
Holidaybreak plcPEER GROUP COMPARISON
Based on closing share price (shown in brackets) on 14/05/01

26
Holidaybreak plc
APPENDICES

27
E xp lore W o rldw ide R eg al
A d ven tu re*(£27.5m )
S u ns ites K eycam p E u ro cam p E C In d ep end ent E u ro villag es
C am p ing(£102.3m )
S u perbreak G o ld en ra il L u xu ry H o teln et
H o te l B reaks(£46.1m )
H olidaybreak P lc
*As per last twelve month’s statutory accounts
Holidaybreak plcCURRENT BUSINESSES

28
Holidaybreak plcTHE BOARD
B o b B ad d e leyF in an ce D irec tor
J im C rewC am p ing
N ick C u stH o te l B reaks
M ark W rayH o te l B reaks
S im o n To b inA d ventu re
R ich ard Atk insonC h ie f Execu tive
E xecs
C live M cL in to ck P eter F o lkm an
A n gu s C rich ton -M illerC h a irm an
N o n -Execs Ju lie V icke rsC om pany S ecre ta ry
B oard

29
2000 1999Group Group£'000 £'000
Turnover 164,518 142,436 +15.5%Gross Profit 48,308 39,992 +20.8%Operating Profit 23,667 20,050 +18.0%Profit before Tax 20,709 17,271 +19.9%Earnings per Share 34.0p 29.3p +16.0%Dividend per Share 16.0p 14.0p +14.3%
Holidaybreak plc2000 PROFIT & LOSS ACCOUNT (1)
All stated before goodwill amortisation

30
Camping Hotel-Breaks Adventure Group£'000 £'000 £'000 £'000
Turnover 2000 102,357 46,054 16,107 164,5181999 103,739 38,697 - 142,436
Gross Profit 2000 34,703 8,742 4,863 48,3081999 32,470 7,522 - 39,992
PBIT 2000 17,001 4,390 2,276 23,6671999 16,231 3,819 - 20,050
Holidaybreak plc2000 PROFIT & LOSS ACCOUNT (2)
All stated before goodwill amortisation

31
Holidaybreak plc2000 BALANCE SHEET
2000 1999£'000 £'000
Fixed Assets/Investments 54,858 48,666Goodwill 32,753 -Net Current Liabilities (29,113) (16,038)Non-Current Creditors (900) (977)Deferred Tax (621) (74)Net Debt (32,203) (24,896)Net Assets 24,774 6,681

32
Holidaybreak plc2000 CAPITAL EXPENDITURE & DISPOSALS
£'000 Mobile- Camping Other Totalhomes Equipment Assets
Opening NBV 34,997 7,404 6,265 48,666Additions 13,464 4,991 1,159 19,614Acquisitions - - 553 553Disposals (3,738) - (34) (3,772)Depreciation (5,102) (4,972) (1,208) (11,282)Closing NBV 39,621 7,423 6,735 53,779
33
Switzerland, AustriaBelgium, Poland &Denmark
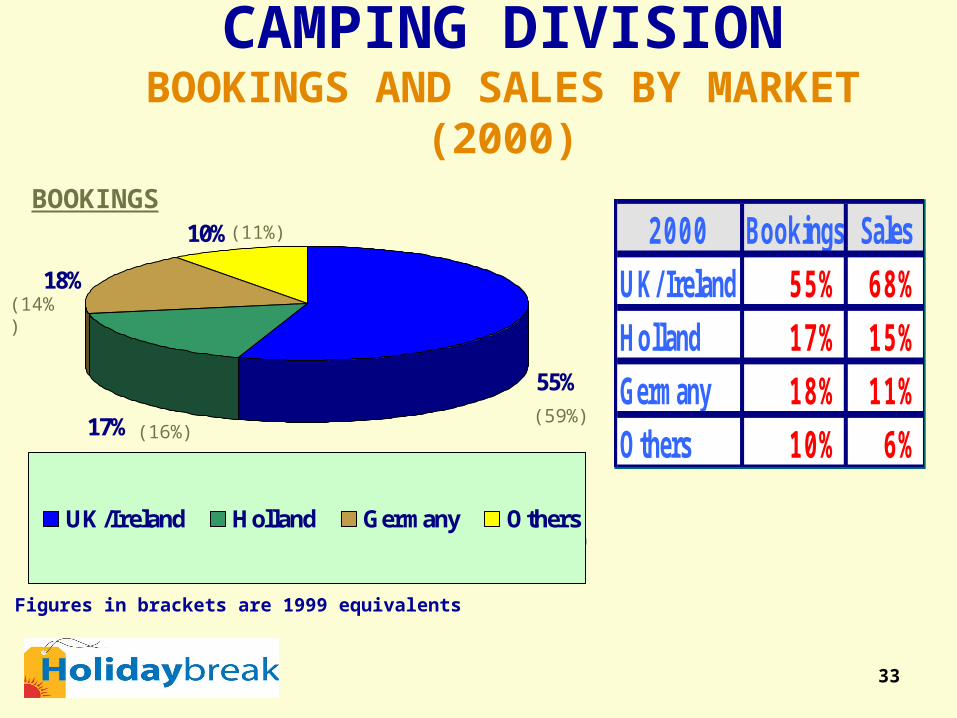
Figures in brackets are 1999 equivalents
(11%)
(14%)
(16%) (59%)
55%
17%
18%
10%
UK/Ireland Holland Germany Others
2000 Bookings SalesUK/Ireland 55% 68%Holland 17% 15%Germany 18% 11%Others 10% 6%
BOOKINGS
CAMPING DIVISIONBOOKINGS AND SALES BY MARKET (2000)

34
CAMPING DIVISIONBOOKINGS AND SALES BY BRAND (2000)
59%32%
2% 4%3%
Eurocamp Keycamp
Sunsites EurovillagesEurocamp Independent
Bookings SalesEurocamp 59% 53%
Keycamp 32% 38%
Sunsites 3% 4%
Independent 4% 3%
Eurovillages 2% 2%
BOOKINGS

35
CAMPING DIVISIONCOMPETITION & MARKET SHARE (2000)
UK Ireland Holland Germany Denmark Tents/m.homes
OwnSites
Holidaybreak(Eurocamp,Keycamp & Sunsites)
61% 70% 64% 71% 49% 45/55
Eurosites (Airtours) 20% 1% 16% 29% 51% 60/40
Haven 10% 12% 8% - - 20/80
Canvas Holidays 9% - 13% - - 75/25
Campotel - 17% - - - 60/40
Figures are for 2000. UK, Holland, Germany and Denmark show only those companies included in the AC Nielson pool. Figures for Ireland are local estimates and include the main local operator. In other markets (Switzerland, Belgium, Poland) no significant direct competition has been identified.

36
CAMPING DIVISIONBRANDS AND OFFICE LOCATIONS
S U T T O N (U K )C O R K (IR E L A N D )
L E ID E N (H O L L A N D )
K E Y C A M P(£ 3 8 .2 m )
H A R T F O R D (U K )A M E R S F O O R T (H O L L A N D )
H A M B U R G (G E R M A N Y )D IE S S E N H O F E N (S W IT Z E R L A N D )
E U R O C A M P(£ 5 4 .9 m )
H A R T F O R D (U K )
S U N S IT E S (£ 3 .6 m )E U R O V IL L A G E S (£ 2 .2 m )
E U R O C A M P IN D E P E N D E N T (£ 3 .5 m )
C A M P IN GD IV IS IO N
2000 sales in brackets

37
HOTEL BREAKSSALES BY BRAND (2000)
55.4%
18.0%
4.0%
12.3%
10.3%
Superbreak
Hotel Breaks
Luxury Hotel Collection
Airport Hotels
Theatre

38
HOTEL BREAKSSALES DISTRIBUTION (2000)
36%
42%
19%3%
Multiple agents
Other agents
Direct
Internet

39
HOTEL BREAKS BRANDS AND PRODUCTS
BRANDS PRODUCT CHARACTERISTICS
Superbreak Core brand – 772 hotels in current programme. Railinclusive, theatre and event packages offered
Hotel Breaks Similar to Superbreak (500 hotels) but with moreemphasis on budget priced hotels
LuxuryCollection
197 top quality hotels – Elegant accommodation, finecuisine and outstanding hospitality
NationalTrust
Special National Trust endorsed brochure for NationalTrust members with 204 hotels
Theatrebreak Theatre and concert inclusive packages
Airport Overnight accommodation in 91 hotels at or close to allmajor UK airports and ferry ports

40
Operator CurrentShare
Estimate
Comment
Superbreak/Goldenrail/Rainbow
65% Multi-brand, multi-productstrategy
Highlife 13% Thistle
Embassy 8% Jarvis
LTS/Bridge 6% Airtours
Crystal 5% Thomson
Others 3% Forte, Best Western etc
HOTEL BREAKS COMPETITION AND MARKET SHARES (RETAIL)

41
ADVENTURE HOLIDAYS SALES (2000)
10%
16% 20%
10%
15%16%
13%
Egypt & Middle EastGreece & TurkeyEuropeAmericas & PacificAsiaIndia & NepalAfrica

42
Overseas holidays account
for 33% of passengers and
58% of expenditure
UK still important but now
primarily a secondary
holiday destination
12-13m inbound visitors to the UK
Travel Industry OverviewUK HOLIDAY MARKET
UK Holiday Market 2000
Domestic 73m pax(£11.0bn)
Overseas 35m pax (£15.2bn)
Source: MintelExcludes VFR

43
Overall sector growing at c.4% per annumDistribution fragmenting - multiple channels - high street agents in declineGrowth Areas include:- Short-breaks - Long-haul- Activity/Special Interest- Grey tourism- Tailor-made
Travel Industry OverviewOVERSEAS HOLIDAY MARKET
Overseas Holidays 2000
Source: MintelExcludes VFR
Scheduled Air Surface Travel
Independent Air Charter
5.5m
3.5m
16.1m
9.9m

44
Holidaybreak plcOUR RECORD (1)
Turnover Profit£m
164.5142.4
113.5106.4
104.7
70.0
90.0
110.0
130.0
150.0
170.0
1996 1997 1998 1999 2000
17.314.0
11.29.26
20.7
7
9
11
13
15
17
19
21
1996 1997 1998 1999 2000
£m

45
Holidaybreak plcOUR RECORD (2)
18.321.6
26.829.3
34.0
10
15
20
25
30
35
1996 1997 1998 1999 2000
14.012.5
11.511.0
16.0
7.00
9.00
11.00
13.00
15.00
17.00
1996 1997 1998 1999 2000
Earnings per Share DividendPence Pence