interim results - amazon web services · – sales at £2.5m (h1 2016: £7.3m), however h1 2016...
TRANSCRIPT

Interim Results 6 months ended 30 September 2016
28/11/2016

First half highlights
H1 2017 results ‘in line’ with market expectations
Increased revenue, increased profitability, investment in sales and marketing, doubling of investment in R&D• R&D investment of £2.2m in H1 2017, expensed to P&L
Improved balance in overall revenue mix• Commercial fastest growing sector representing 28%
(Healthcare, 18%; government, 54%)• SaaS, Licence, Maintenance and related services now
account for 23% of Group revenue
Continue to build an exceptionally talented team• 967 people now working in Kainos, attrition at 6.4%, well
below industry norms
Simplified our segmental reporting to reflect the growth drivers in our business
28/11/2016 2
REVENUE
PROFIT (1)
£40.6m
£7.0m
GROWTH OF 9%
GROWTH OF 3%
(1) Adjusted to remove the effect of share-based payments and exceptional items

Group Summary
Kainos is a high growth, high-margin company providing digital services and digital platforms• Digital Services – building and configuring online
platforms for government and commercial customers• Digital Platforms – specialised platforms in the mobile
healthcare and automated testing arenas
Financial Metrics• Strong, organic revenue growth• Good visibility: £68m contracted backlog• Strong, sustainable adjusted PBT margin: 17%
(H1 2016: 18%)• Cashflow conversion: 72%(1) (H1 2016: 49%)(1)
Earnings• Adjusted diluted EPS(2) : 4.8p per share (H1 2016: 4.8p)• Dividend declared: 1.9p per share (H1 2016: 1.8p)• Payment date: 30/12/2016• Ex Dividend date: 08/12/2016
28/11/2016 3
(1) Cashflow from Operations (CFFO) before exceptional items divided by adjusted EBTIDA(2) Adjusted to remove the effect of share-based payments and exceptional items
REVENUE
EBITDA
£11m £13m £19m£29m
£37m £41m£14m £17m
£22m
£32m
£39m
£0m
£20m
£40m
£60m
£80m
FY12 FY13 FY14 FY15 FY16 H1 17
H2 RevenueH1 Revenue
£3.0m£5.9m £7.1m £7.4m
£1.5m£3.4m
£4.3m
£6.4m
£7.6m
£0m
£4m
£8m
£12m
£16m
FY12 FY13 FY14 FY15 FY16 H1 17
H2 EBITDAH1 EBITDA

£0m
£5m
£10m
£15m
FY12 FY13 FY14 FY15 FY16
Services• Online digital platforms for commercial and government
clients• Workday SaaS HR platform for enterprise customers
Platforms• Evolve EMR: Digitised patient records• Evolve IC: Integrated care platform for NHS and
international clients• Smart: Automated Testing platform for Workday
28/11/2016 4
Group Overview
Highly selective entry-level and experienced recruitment
Global commercial, government and healthcare organisations
people
customers
£0m
£20m
£40m
£60m
FY12 FY13 FY14 FY15 FY16
digital platforms(1)
digital services
(1) Excludes 3rd party revenues (including 3rd party) for the same time periods these are: £3.6m, £4.8m, £6.1m, £10.0m, £21.5m, representing CAGR of 56.7%

People
We continue to build an exceptionally talented and engaged workforce
• Number of people employed increased by 23% to 967
• Increased activity and investment in development and well being
– Engagement remains high, attrition well below industry norms at 6.4% (H1 2016: 10.9%)
• Where they live– Northern Ireland 528 (+94 people)– Great Britain 153 (+5 people)– Poland 248 (+74 people)– Rest of World 38 (+6 people)
• What they work on– Digital Services: 559 (+66 people)– Digital Platforms: 239 (+57 people)
28/11/2016 5
STAFF NUMBERS
967GROWTH OF 23%
APPLICANTS
4,4941,534 INTERVIEWS

Customers
Recurring customer relationships driving revenue growth in government and commercial sectors
• Commercial is now the fastest growing segment, with revenue increasing by 36% to £11.1m (H1 2016: £8.1m)
• 93% of revenue derived from existing customers (H1 2016: 68%), which has also slightly elevated customer concentration with Top 10 customers accounting for 54% revenue (H1 2016: 51%)
• Best-in-class customer service, with 96% of customers rating the overall Kainos performance as good, very good or excellent
New Clients
28/11/2016 6
REVENUE TYPE
FY11 FY12 FY13 FY14 FY15 FY16
New
Repeat
Recurring
H1 SECTORAL REVENUE
Government54%
Commercial28%
Healthcare18%

28/11/2016 7
Digital Services

Digital Services Market Summary
Digital Transformation Workday Implementation
Market UK Central and Regional Govt; Commercial sectors
UK and International; Commercial sectors
Sales Model Direct Primarily Direct
Market Size (est) FY16: £470m, 25% growth pa FY16: £95m, 30% growth pa
Competitors
Commercials Primarily T&M Primarily T&M
28/11/2016 8
On average, the cost per transaction for a digital service across government is less than 20p – compared to over £3 by telephone, and almost £9 for a face to face transaction and over £12 by post.

Digital Services Performance
Strong demand across customer base, improved operating margins and increased backlog
• Commercial sector delivering strong growth, up 26% to £9.2m (H1 2016: £7.3m)
• Government sector showing continued growth, with revenues up 9% to £22.1m (H1 2016: £20.3m)
• Sales up 8% to £28.3m (H1 2016: £26.3m)
• Contracted backlog increased by 14% to £33.7m (H1 2016: £29.6m)
Kainos position in Workday ecosystem in EMEA strengthened following consolidation of two competitors (DayNine, Appirio)
28/11/2016 9
REVENUE
£31.2mGROWTH OF 13%
REVENUE TRENDS
£7m £9m
£20m£22m
£0m
£5m
£10m
£15m
£20m
£25m
£30m
£35m
H1 FY16 H1 FY17
GovernmentCommercial

Workday Case Study: easyJet
28/11/2016 10
778 routes 139 airports 32 countries
EasyJet background:
UK’s fourth largest airline
Vicent Libsig, IT Systems & Services Manager, easyJet“With Kainos we found a partner who delivered a very well designed, simple and efficient solution to a complex business problem. The solution provides us with the flexibility to support the continued growth of the EasyJet business by enabling effective and efficient business change.”
Crew Variable Pay: Outcomes• Migrated the entire HR service to the cloud• Reduced the risk of failure by migrating from
existing unsupported payroll legacy systems• Used Amazon’s auto-scaling function to
scale up and down for peak travel periods
Increased payroll accuracy to
99.5%

28/11/2016 11
Digital Services Case Study: DVSA MOT
£1bn+worth of
transactions
42 millionMOTs per year
22,834garages
80,000users
GDS Review, May 2016“As reviewers, we conclude that this is one of the best agile projects we have seen in flight in government to-date, and can be seen as an exemplar of the benefits of working collaboratively in an agile way.”

28/11/2016 12
Digital Platforms

Digital Platforms Overview
Platform revenues increased by 12% to £7.5m, now 19% of total Group revenue(1) (H1 2016: £6.7m)• Complements Digital Services, providing long-term
revenue visibility, with backlog at £28.1m(2)
• Enhanced visibility of revenue and investment levels• All investment expensed: £2.2m (H1 2016: £1.1m)
Products at varying stages of maturity: different investment profiles, development paths and markets• Evolve Electronic Medical Record (EMR)
The leading EMR platform, selected by 33 NHS Trusts (104 hospitals, 28 million patients, 1 billion images)
• Evolve Integrated Care (IC)SaaS platform for integrating disparate healthcare systems (UK and global clients)
• Smart for WorkdaySaaS platform for automatically verifying Workday configurations (64 global customers)
28/11/2016 13
REVENUE TREND(1)
INVESTMENT TREND
£0.4m £0.6m £0.4m £0.6m
£1.5m £1.5m£0.4m£0.6m
£0.9m £0.7m
£0m
£1m
£2m
£3m
FY12 FY13 FY14 FY15 FY16 H1 17
SmartEvolve
(1) These figures exclude 3rd party revenues, which amount to £1.9m, all attributable to Evolve EMR(2) Excludes 3rd party (inclusive of 3rd party is £34.3m)
£3.2m£4.7m £5.1m
£6.7m
£11.6m
£5.7m
£1.0m
£2.4m
£1.9m
£0m
£4m
£8m
£12m
£16m
FY12 FY13 FY14 FY15 FY16 H1 17
SmartEvolve
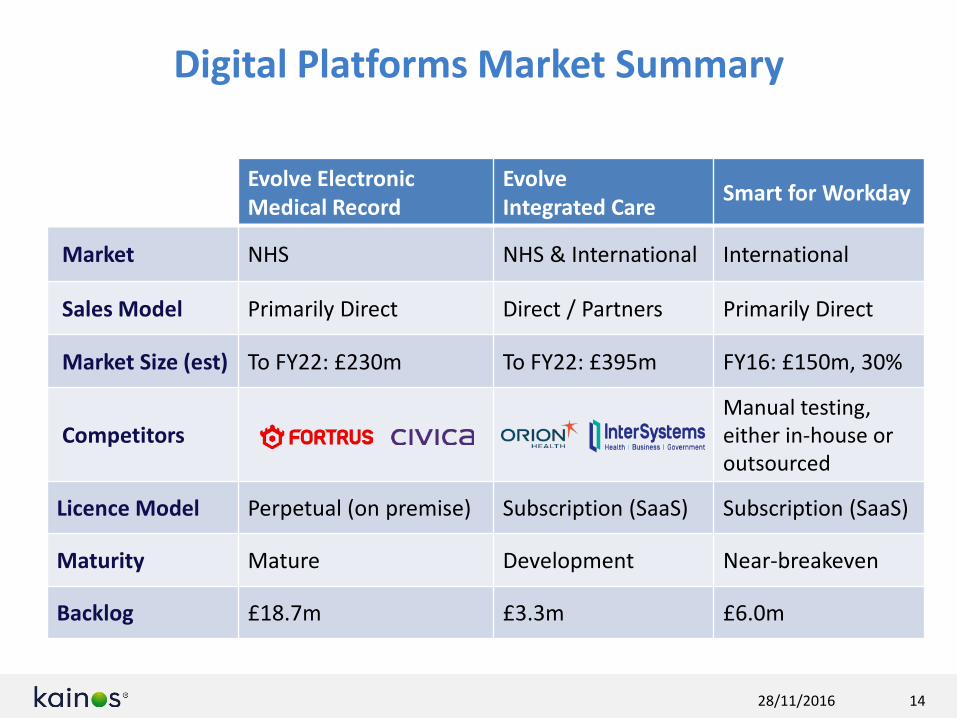
Digital Platforms Market Summary
Evolve Electronic Medical Record
Evolve Integrated Care Smart for Workday
Market NHS NHS & International International
Sales Model Primarily Direct Direct / Partners Primarily Direct
Market Size (est) To FY22: £230m To FY22: £395m FY16: £150m, 30%
CompetitorsManual testing, either in-house or outsourced
Licence Model Perpetual (on premise) Subscription (SaaS) Subscription (SaaS)
Maturity Mature Development Near-breakeven
Backlog £18.7m £3.3m £6.0m
28/11/2016 14

Digital Platforms: Evolve EMR
Stable revenues and margins in constrained NHS market
• Sales performance reflects overall market constraint – Sales at £2.5m (H1 2016: £7.3m), however H1 2016
performance enhanced by a single contract, worth in excess of £6.0m
• Contracted backlog decreased by 25% – Backlog at £18.7m (H1 2016: £24.8m)(2)
• Department of Health has reiterated commitment to paperless NHS by 2020, although new funding unlikely to increase procurement activity in H2 2017
• Kainos is well positioned for return of funding as Evolve EMR maintains leadership position in the NHS (won 79% of all public procurement in the past 3 years, 15 of 19 procurements)
28/11/2016 15
REVENUE (1)
£5.6mREDUCTION OF 5%
REVENUE TRENDS (1)
£1.2m £1.7m
£1.4m£1.7m
£3.2m £2.2m
£0m
£1m
£2m
£3m
£4m
£5m
£6m
H1 FY16 H1 FY17
Licences
Consulting
Maintenance
(1) These figures exclude 3rd party revenuesRevenue inclusive of 3rd party is £7.5m (H1 2016: £8.8m); decrease of 15%
(2) Contracted backlog inclusive of 3rd party is £25.0m (FY 2015: £34.2m); reduction of 27%
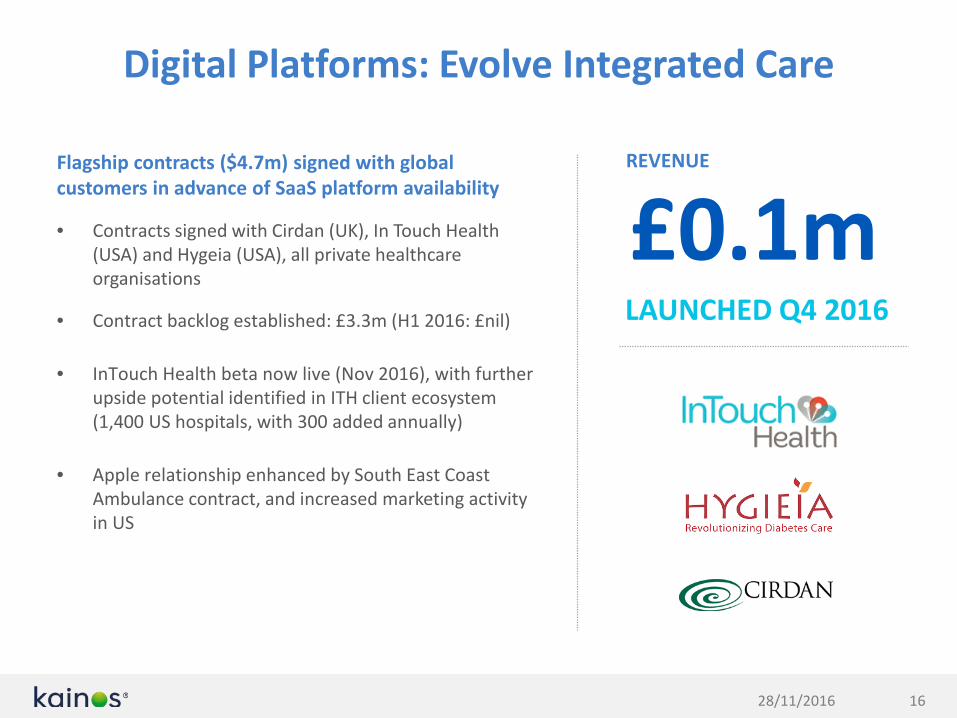
Digital Platforms: Evolve Integrated Care
Flagship contracts ($4.7m) signed with global customers in advance of SaaS platform availability
• Contracts signed with Cirdan (UK), In Touch Health (USA) and Hygeia (USA), all private healthcare organisations
• Contract backlog established: £3.3m (H1 2016: £nil)
• InTouch Health beta now live (Nov 2016), with further upside potential identified in ITH client ecosystem (1,400 US hospitals, with 300 added annually)
• Apple relationship enhanced by South East Coast Ambulance contract, and increased marketing activity in US
28/11/2016 16
REVENUE
£0.1mLAUNCHED Q4 2016

Digital Platforms: Smart for Workday
Expanding roster of blue-chip international clients, increasing deal size, and strong sales pipeline
• Annual Contract Value (ACV) increased to £0.5m (H1 2016: £0.4m)
• Contracted backlog up 85% to £6.0m (H1 2016: £3.3m) from a customer base of 64 corporate clients (H1 2016: 36)
• Average annual subscription increased by 51% to £67k (H1 2016: £44k)
• Strengthening pipeline in H2, driven by marketing campaigns aligned with Workday conference season
28/11/2016 17
REVENUE
£1.9mGROWTH OF 114%
REVENUE TRENDS
£0.6m
£1.4m£0.3m
£0.5m
£0m
£1m
£2m
H1 FY16 H1 FY17
Consulting
SaaS Subscriptions

Smart for Workday Case Study: Magellan Health
28/11/2016 18
Operational and cost savings
7,000 employees
$4.5-billion-dollar companyheadquartered out of
Scottsdale, Arizona
Operating across 49 states
Magellan Health Background:
$397,320cost savings per
year
60%reduction
50%reduction
The number of people involved with testing during a Workday update window reduced from 52 to 21 people
The duration of the test event reduced from 8 weeks to 4 weeks

Evolve EMR Case Study: South East Coast Ambulance Service NHS Foundation Trust
28/11/2016 19
Mark Chivers, Head of IT South East Coast Ambulance Service“What impressed us about Kainos was their detailedunderstanding of our market and the specific needs of the ambulance service. We could clearly see the results of their research in the Evolve platform.”
33 NHS Customer Trusts across the UK including:
• First NHS Ambulance Trust to deploy iPad for patient records• Evolve ensures high quality data is recorded and sent to the hospital
almost instantaneously, providing A&E with accurate records when the patient is handed over
Covers 3,600 square miles along some of England’s busiest motorway stretches
Over 2,500 front line crew working across 110 sites
1 million emergency calls per year
Emergency dispatch centres in Kent, Surrey and Sussex
Trust Background:

28/11/2016 20
Financial Performance

Financials: Income Statement
28/11/2016 21
• Revenue:– Digital Services growth: 13%– Digital Platform growth ex 3rd party: 12%– Top 10 customer concentration: 54% (H1 2016: 51%)
• Gross margin:– Digital Services margin improved by 2%– Digital Services utilisation: 71% (H1 2016: 75%)– Digital Platform margin improved 8% due to revenue
mix
• Operating expenses: – Grew 22%, mainly due to R&D growth– R&D expensed to P&L: £2.2m (H1 2016: £1.1m)– Impact on Adjusted PBT of expensing R&D
approximately £1.0m compared to capitalisation
• Underlying tax rate: 19%
COMMENTARY INCOME STATEMENT
£m FY 2016 H1 2016 H1 2017 CHANGE
Digital Services 55.1 27.6 31.2 13%Digital Platforms 21.5 9.7 9.4 (3%)
Revenue 76.6 37.2 40.6 9%
Digital Services 25.4 12.7 14.9 17%Digital Platforms 11.7 5.6 6.2 11%Gross profit 31.7 18.3 21.1 15%
Operating expenses (22.4) (11.2) (13.7) 22%EBITDA 14.7 7.1 7.4 4%
Depreciation (0.7) (0.3) (0.4)Adjusted Profit before tax 14.1 6.8 7.0 3%
Adjusted PBT margin 18% 18% 17%
Exceptional items & share based payments 0.2 (1.6) (0.6)Profit before tax 14.3 5.2 6.4 23%
Taxation (1.8) (1.2) (1.2)
Profit after tax 12.4 4.0 5.2 30%
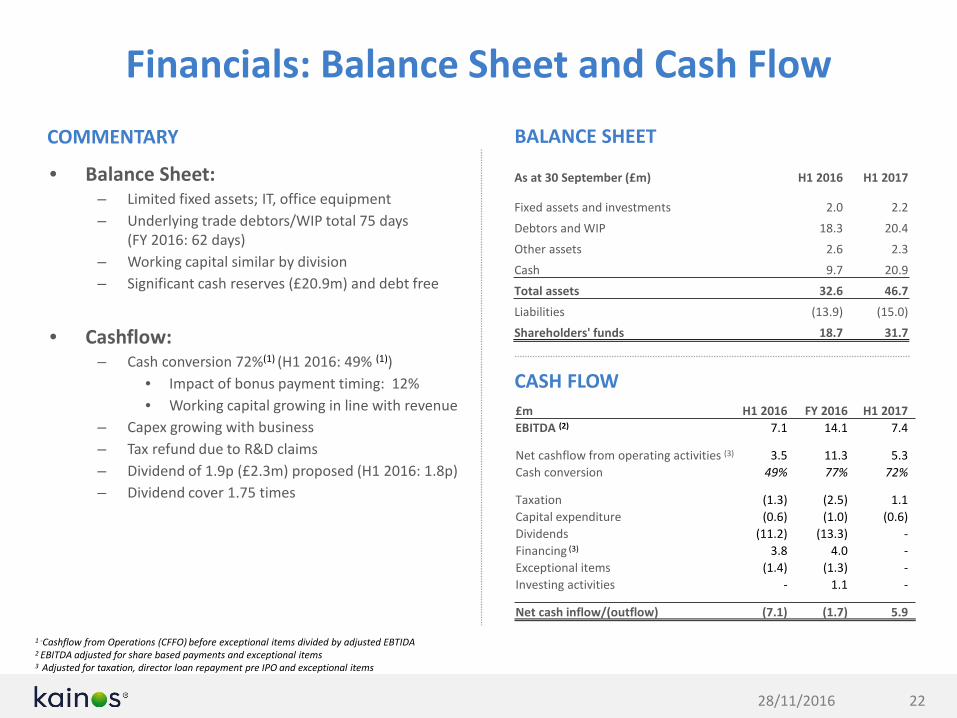
Financials: Balance Sheet and Cash Flow
28/11/2016 22
• Balance Sheet:– Limited fixed assets; IT, office equipment– Underlying trade debtors/WIP total 75 days
(FY 2016: 62 days)– Working capital similar by division– Significant cash reserves (£20.9m) and debt free
• Cashflow:– Cash conversion 72%(1) (H1 2016: 49% (1))
• Impact of bonus payment timing: 12%• Working capital growing in line with revenue
– Capex growing with business– Tax refund due to R&D claims– Dividend of 1.9p (£2.3m) proposed (H1 2016: 1.8p)– Dividend cover 1.75 times
COMMENTARY BALANCE SHEET
CASH FLOW
As at 30 September (£m) H1 2016 H1 2017
Fixed assets and investments 2.0 2.2Debtors and WIP 18.3 20.4Other assets 2.6 2.3Cash 9.7 20.9Total assets 32.6 46.7Liabilities (13.9) (15.0)Shareholders' funds 18.7 31.7
£m H1 2016 FY 2016 H1 2017EBITDA (2) 7.1 14.1 7.4
Net cashflow from operating activities (3) 3.5 11.3 5.3Cash conversion 49% 77% 72%
Taxation (1.3) (2.5) 1.1Capital expenditure (0.6) (1.0) (0.6)Dividends (11.2) (13.3) -Financing (3) 3.8 4.0 -Exceptional items (1.4) (1.3) -Investing activities - 1.1 -
Net cash inflow/(outflow) (7.1) (1.7) 5.9
1 -Cashflow from Operations (CFFO) before exceptional items divided by adjusted EBTIDA 2 EBITDA adjusted for share based payments and exceptional items3 Adjusted for taxation, director loan repayment pre IPO and exceptional items

28/11/2016 23
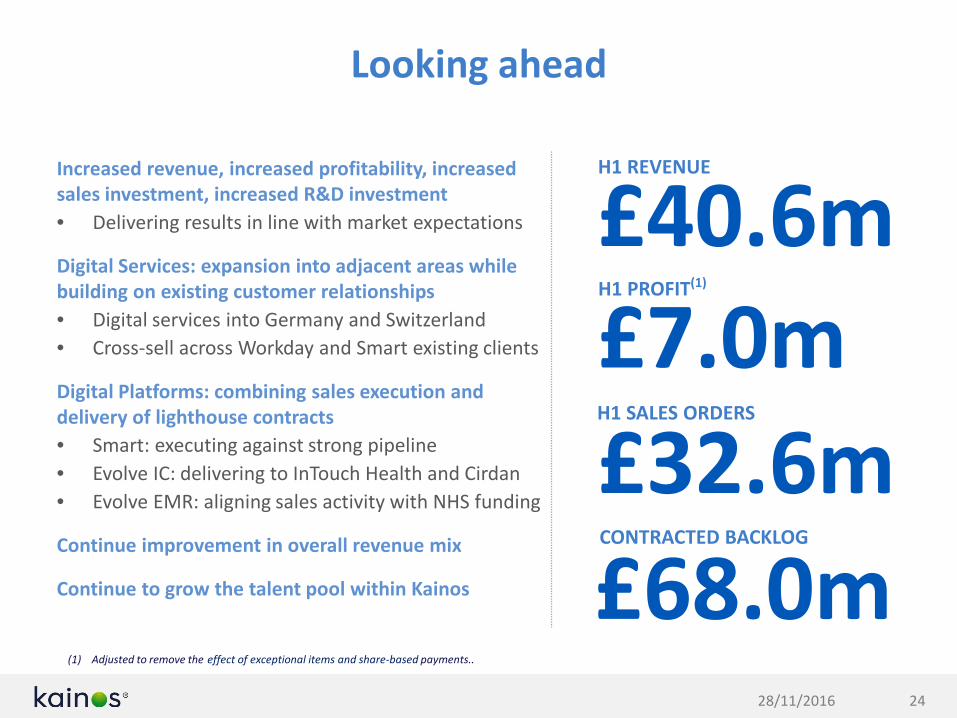
Looking ahead
Looking ahead
28/11/2016 24
Increased revenue, increased profitability, increased sales investment, increased R&D investment• Delivering results in line with market expectations
Digital Services: expansion into adjacent areas while building on existing customer relationships• Digital services into Germany and Switzerland• Cross-sell across Workday and Smart existing clients
Digital Platforms: combining sales execution and delivery of lighthouse contracts• Smart: executing against strong pipeline• Evolve IC: delivering to InTouch Health and Cirdan• Evolve EMR: aligning sales activity with NHS funding
Continue improvement in overall revenue mix
Continue to grow the talent pool within Kainos
H1 REVENUE
£40.6m
(1) Adjusted to remove the effect of exceptional items and share-based payments..
£7.0mH1 PROFIT(1)
£32.6mH1 SALES ORDERS
£68.0mCONTRACTED BACKLOG

28/11/2016 25
AppendixFull reconciliation between the previous and
current segmental reporting

Divisional Reporting Change
28/11/2016 26
Previous Segmental Digital Workday Workday Work- New Segmental Digital Workday Services Workday Platform
6 months to Services Evolve Smart Services Smart Consolidated 6 months to Services Services Total Evolve Smart Total Consolidated
30 September 2016 £’000 £’000 £’000 £’000 £’000 £’000 30 September 2016 £’000 £’000 £’000 £’000 £’000 £’000 £’000
Revenue 26,333 7,477 1,907 4,883 6,790 40,600 Revenue 26,333 4,883 31,216 7,477 1,907 9,384 40,600
Cost of Sales (14,290) (2,746) (455) (2,029) (2,484) (19,520) Cost of Sales (14,290) (2,029) (16,319) (2,746) (455) (3,201) (19,520)
Gross Profit 12,043 4,731 1,452 2,854 4,306 21,080 Gross Profit 14,897 6,183 21,080
Direct expenses (3,184) (5,303) (8,487)
Central expenses (5,620)Operating expenses excludingshare-based payments (14,107)
Operating expenses excludingshare-based payments (14,107)
Share based payment (570) Share based payment (570)Operating profit before exceptional items 6,403
Operating profit before exceptional items 6,403
Digital Workday Workday Work- Digital Workday Services Workday Platform
6 months to Services Evolve Smart Services Smart Consolidated 6 months to Services Services Total Evolve Smart Total Consolidated
30 September 2015 £’000 £’000 £’000 £’000 £’000 £’000 30 September 2015 £’000 £’000 £’000 £’000 £’000 £’000 £’000
Revenue 23,377 8,805 892 3,160 4,052 37,234 Revenue 24,377 3,160 27,537 8,805 892 9,697 37,234
Cost of sales (13,282) (3,697) (358) (1,561) (1,919) (18,898) Cost of Sales (13,282) (1,561) (14,843) (3,697) (358) (4,055) (18,898)
Gross profit 11,095 5,108 534 1,599 2,133 18,336 Gross Profit 12,694 5,642 18,336
Direct expenses (2,960) (3,189) (6,149)
Central expenses (5,407)Operating expensesexcluding share-basedpayments (11,556)
Operating expenses excludingshare-based payments (11,556)
Share based payments (194) Share based payment (194)
Operating profit 6,586 Operating profit 6,586
A full reconciliation between the previous and current segmental reporting is provided below:
Impact of change on interim periods

Divisional Reporting Change (cont.)
28/11/2016 27
Impact of change on financial years
Previous Segmental Digital Workday Workday Work- New Segmental Digital Workday Workday
Services Evolve Smart Services Smart Consolidated Services Services Services Evolve Smart Platform Consolidated
2016 £’000 £’000 £’000 £’000 £’000 £’000 2016 £’000 £’000 £’000 £’000 £’000 £’000 £’000
Revenue 48,504 19,070 2,444 6,576 9,020 76,594 Revenue 48,504 6,576 55,080 19,070 2,444 21,514 76,594
Cost of Sales (26,631) (8,950) (830) (3,074) (3,904) (39,485) Cost of Sales (26,631) (3,074) (29,705) (8,950) (830) (9,780) (39,485)
Gross Profit 21,873 10,120 1,614 3,502 5,116 37,109 Gross Profit 25,375 11,734 37,109
Direct expenses (5,450) (6,839) (12,289)
Central expenses (10,762)Operating expenses excludingshare-based payments (23,574)
Operating expenses excludingshare-based payments (23,050)
Share based payment (524) Share based payment (524)
Operating expenses (23,574) Operating expenses (23,574)Operating profit before exceptional items 13,535
Operating profit before exceptional items 13,535
Digital Workday Workday Work- Digital Workday Workday
Services Evolve Smart Services Smart Consolidated Services Services Services Evolve Smart Platform Consolidated
2015 £’000 £’000 £’000 £’000 £’000 £’000 2015 £’000 £’000 £’000 £’000 £’000 £’000 £’000
Revenue 43,580 9,018 973 7,207 8,180 60,778 Revenue 43,580 7,207 50,787 9,018 973 9,991 60,778
Cost of sales (20,510) (4,314) (347) (3,158) (3,505) (28,329) Cost of Sales (20,510) (3,158) (23,668) (4,314) (347) (4,661) (28,329)
Gross profit 23,070 4,704 626 4,049 4,675 32,449 Gross Profit 27,119 5,330 32,449
Direct expenses (4,529) (4,124) (8,653)
Central expenses (11,993)
Operating expenses (20,646) Operating expenses (20,646)
Operating profit 11,803 Operating profit 11,803

Divisional Reporting Change (cont.)
28/11/2016 28
Impact of change on financial years
Previous Segmental Digital Workday Workday Work- New Segmental Digital Workday Workday
Services Evolve Smart Services Smart Consolidated Services Services Services Evolve Smart Platform Consolidated
2014 £’000 £’000 £’000 £’000 £’000 £’000 2014 £’000 £’000 £’000 £’000 £’000 £’000 £’000
Revenue 31,796 5,948 17 4,154 4,171 41,915 Revenue 31,796 4,154 35,950 5,948 17 5,965 41,915
Cost of Sales (15,507) (2,486) - (2,453) (2,453) (20,446) Cost of Sales (15,507) (2,453) (17,960) (2,486) - (2,486) (20,446)
Gross Profit 16,289 13,426 17 1,701 1,718 21,469 Gross Profit 17,990 11,734 21,469
Direct expenses (3,811) (6,839) (5,533)
Central expenses (8,906)
Operating expenses (14,440) Operating expenses (14,440)
Operating profit 7,029Operating profit before exceptional items 7,029
Digital Workday Workday Work- Digital Workday Workday
Services Evolve Smart Services Smart Consolidated Services Services Services Evolve Smart Platform Consolidated
2013 £’000 £’000 £’000 £’000 £’000 £’000 2013 £’000 £’000 £’000 £’000 £’000 £’000 £’000
Revenue 23,406 4,846 - 1,681 1,681 29,933 Revenue 23,406 1,681 25,087 4,846 - 4,846 29,933
Cost of sales (12,659) (1,430) - (816) (816) (14,905) Cost of Sales (12,659) (816) (13,475) (1,430) - (1,430) (14,905)
Gross profit 10,747 3,416 - 865 865 15,028 Gross Profit 11,612 3,416 15,028
Direct expenses (2,683) (1,482) (4,165)
Central expenses (7,110)
Operating expenses (11,275) Operating expenses (11,275)
Operating profit 3,753 Operating profit 3,753

Legal and Confidentiality StatementThis document contains statements about Kainos Group plc that are or may be forward-looking statements. Forward-looking statements include statements relating to (i) future capital expenditures, expenses, revenues, earnings, synergies, economic performance, indebtedness, financial condition, dividend policy, losses and future prospects; (ii) business and management strategies and the expansion and growth of Kainos Group plc’s operations; and (iii) the effects of government regulation on business.
These forward-looking statements are not guarantees of future performance. They have not been reviewed by the auditors or advisers of Kainos Group plc. They involve known and unknown risks, uncertainties and other factors which may cause the actual results, performance or achievements to be materially different from any results, performance or achievements expressed or implied by such statements. They are based on numerous assumptions regarding the present and future business strategies and the future operating environment. All subsequent oral or written forward-looking statements attributable to Kainos Group plc or any of its shareholders or any persons acting on its behalf are expressly qualified in their entirety by this cautionary statement. All forward-looking statements included in this document speak only as of the date they were made and are based on information then available to Kainos Group plc. Investors should not place undue reliance on such forward-looking statements, and Kainos Group plc does not undertake any obligation to update publicly or revise any forward-looking statements.
No representation or warranty, express or implied, is given regarding the accuracy of the information or opinions contained in this document and no liability is accepted by Kainos Group plc or any of its directors, members, officers, employees, agents or advisers for any such information or opinions.
This information is being supplied to you for information purposes only and not for any other purpose. This document and the information contained in it does not constitute or form any part of an offer of, or invitation or inducement to apply for, securities.
The distribution of this document in jurisdictions other than the United Kingdom may be restricted by law and persons into whose possession this document comes should inform themselves about, and observe any such restrictions. Any failure to comply with these restrictions may constitute a violation of laws of any such other jurisdiction.
© Kainos Group plc 2016. All rights reserved.
28/11/2016 29